
Molecular Crystal Structure Simulations and Structure-Magnetic Properties of LiFePO4 Composite Particles Optimized by La
 ,
,
Abstract
1. Introduction
2. Results and Discussion
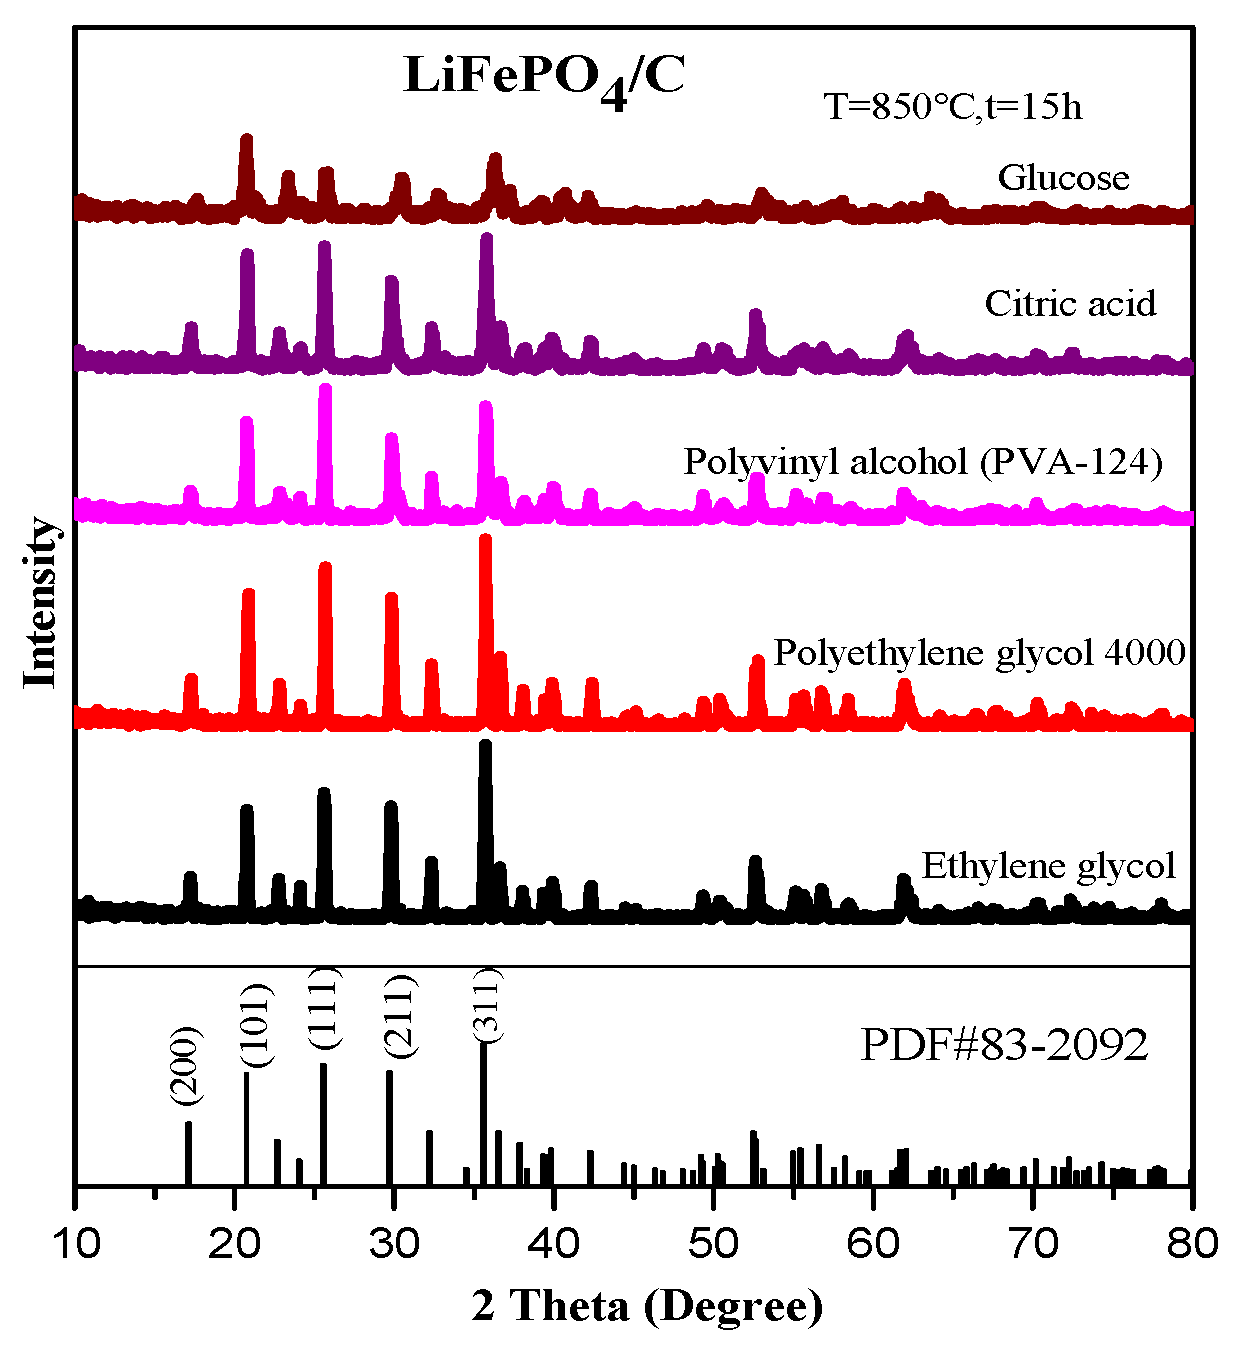
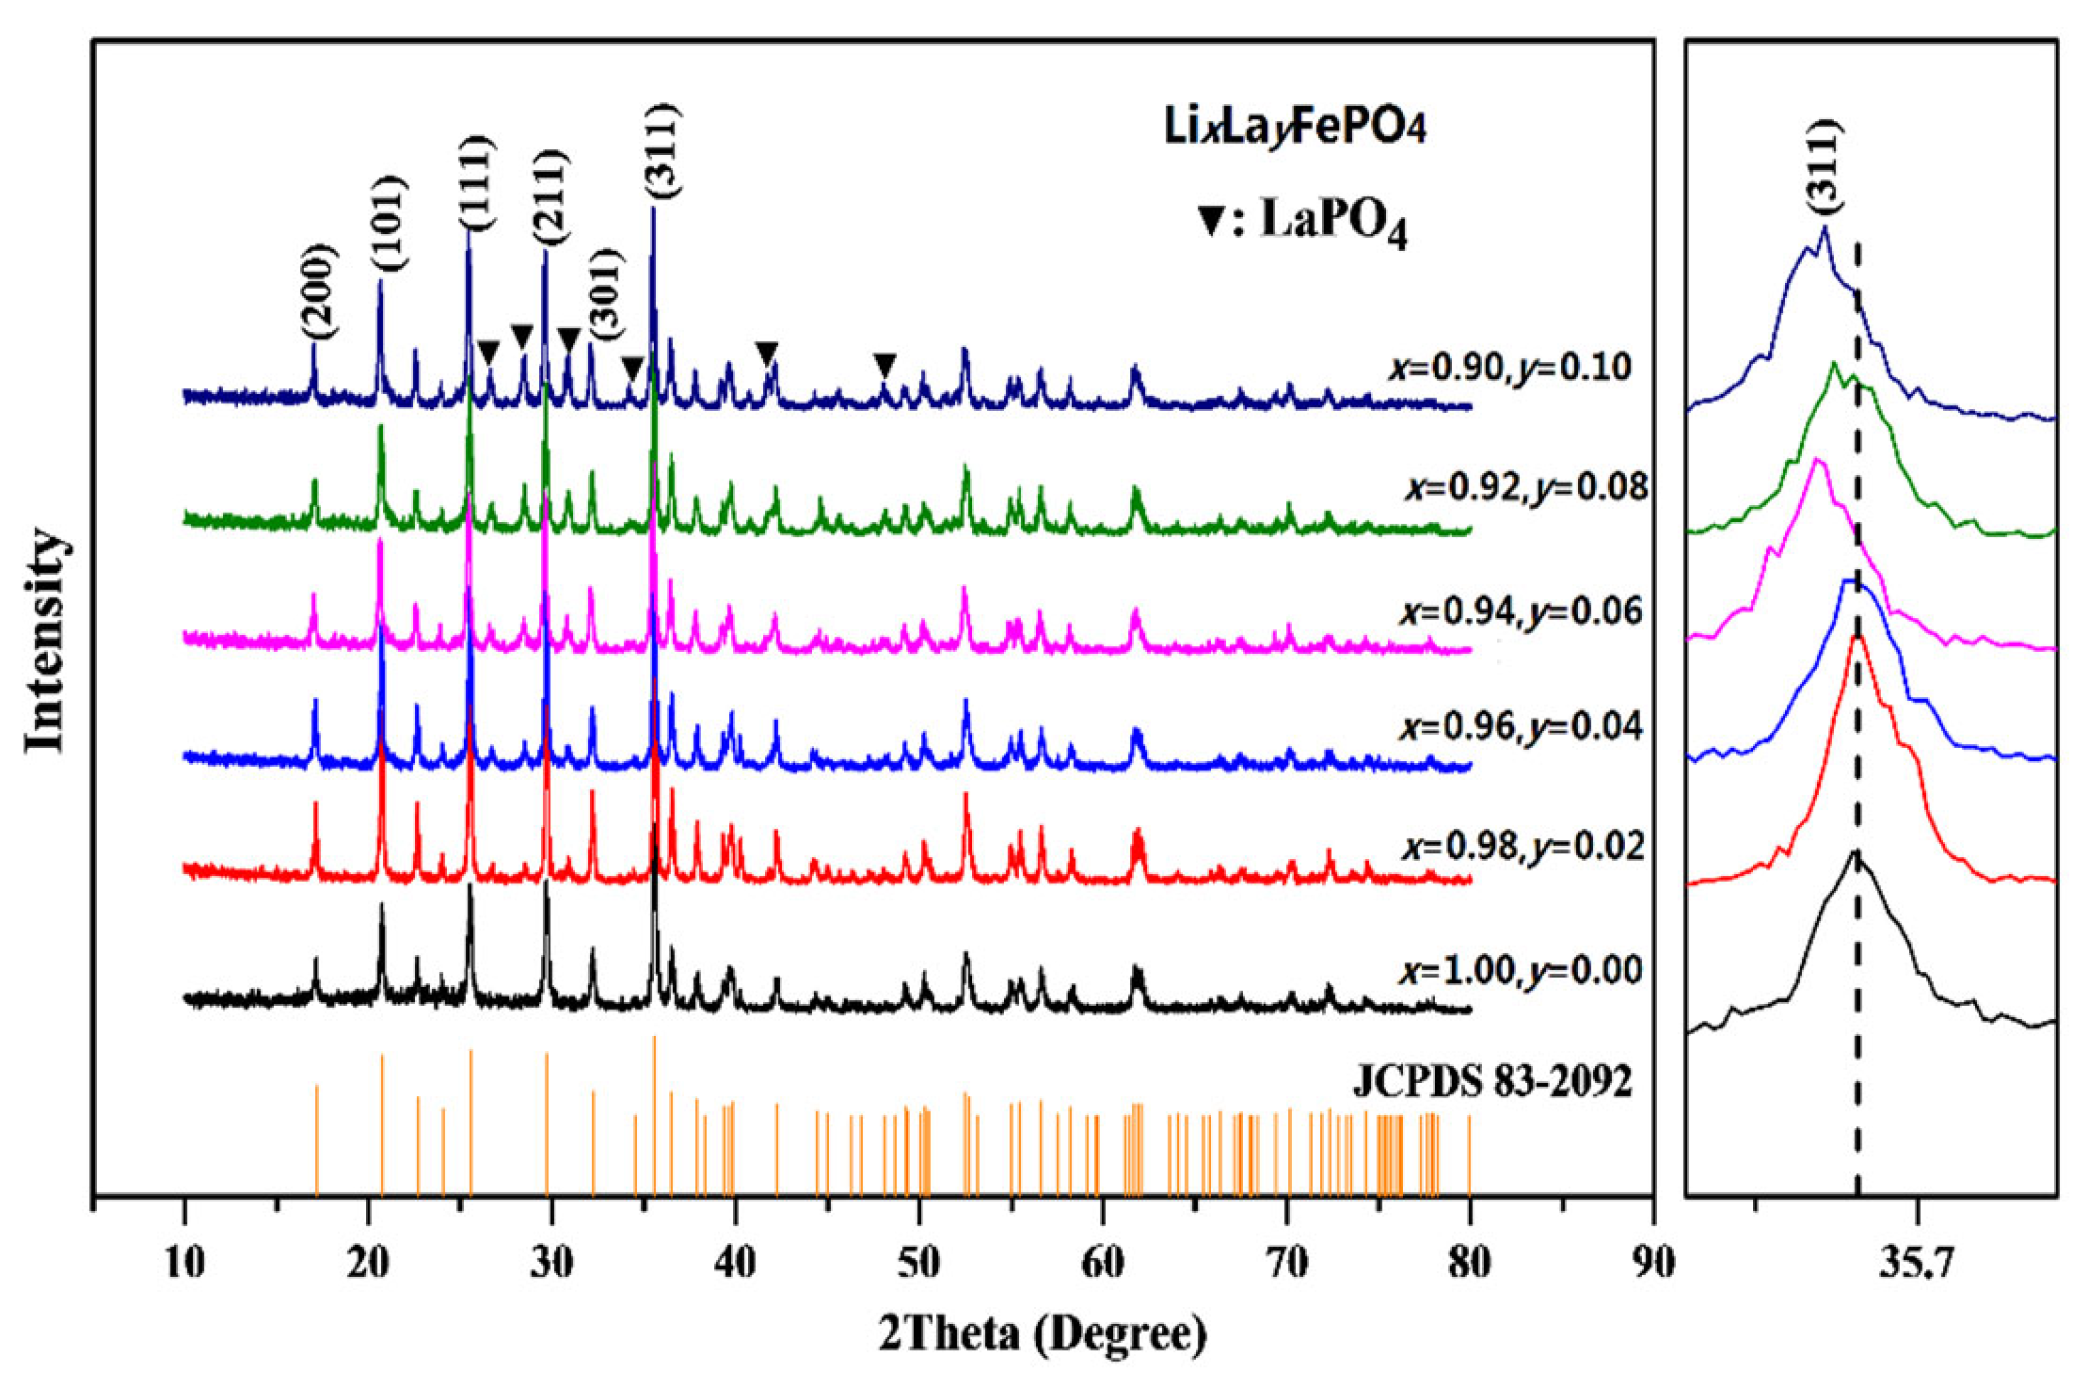
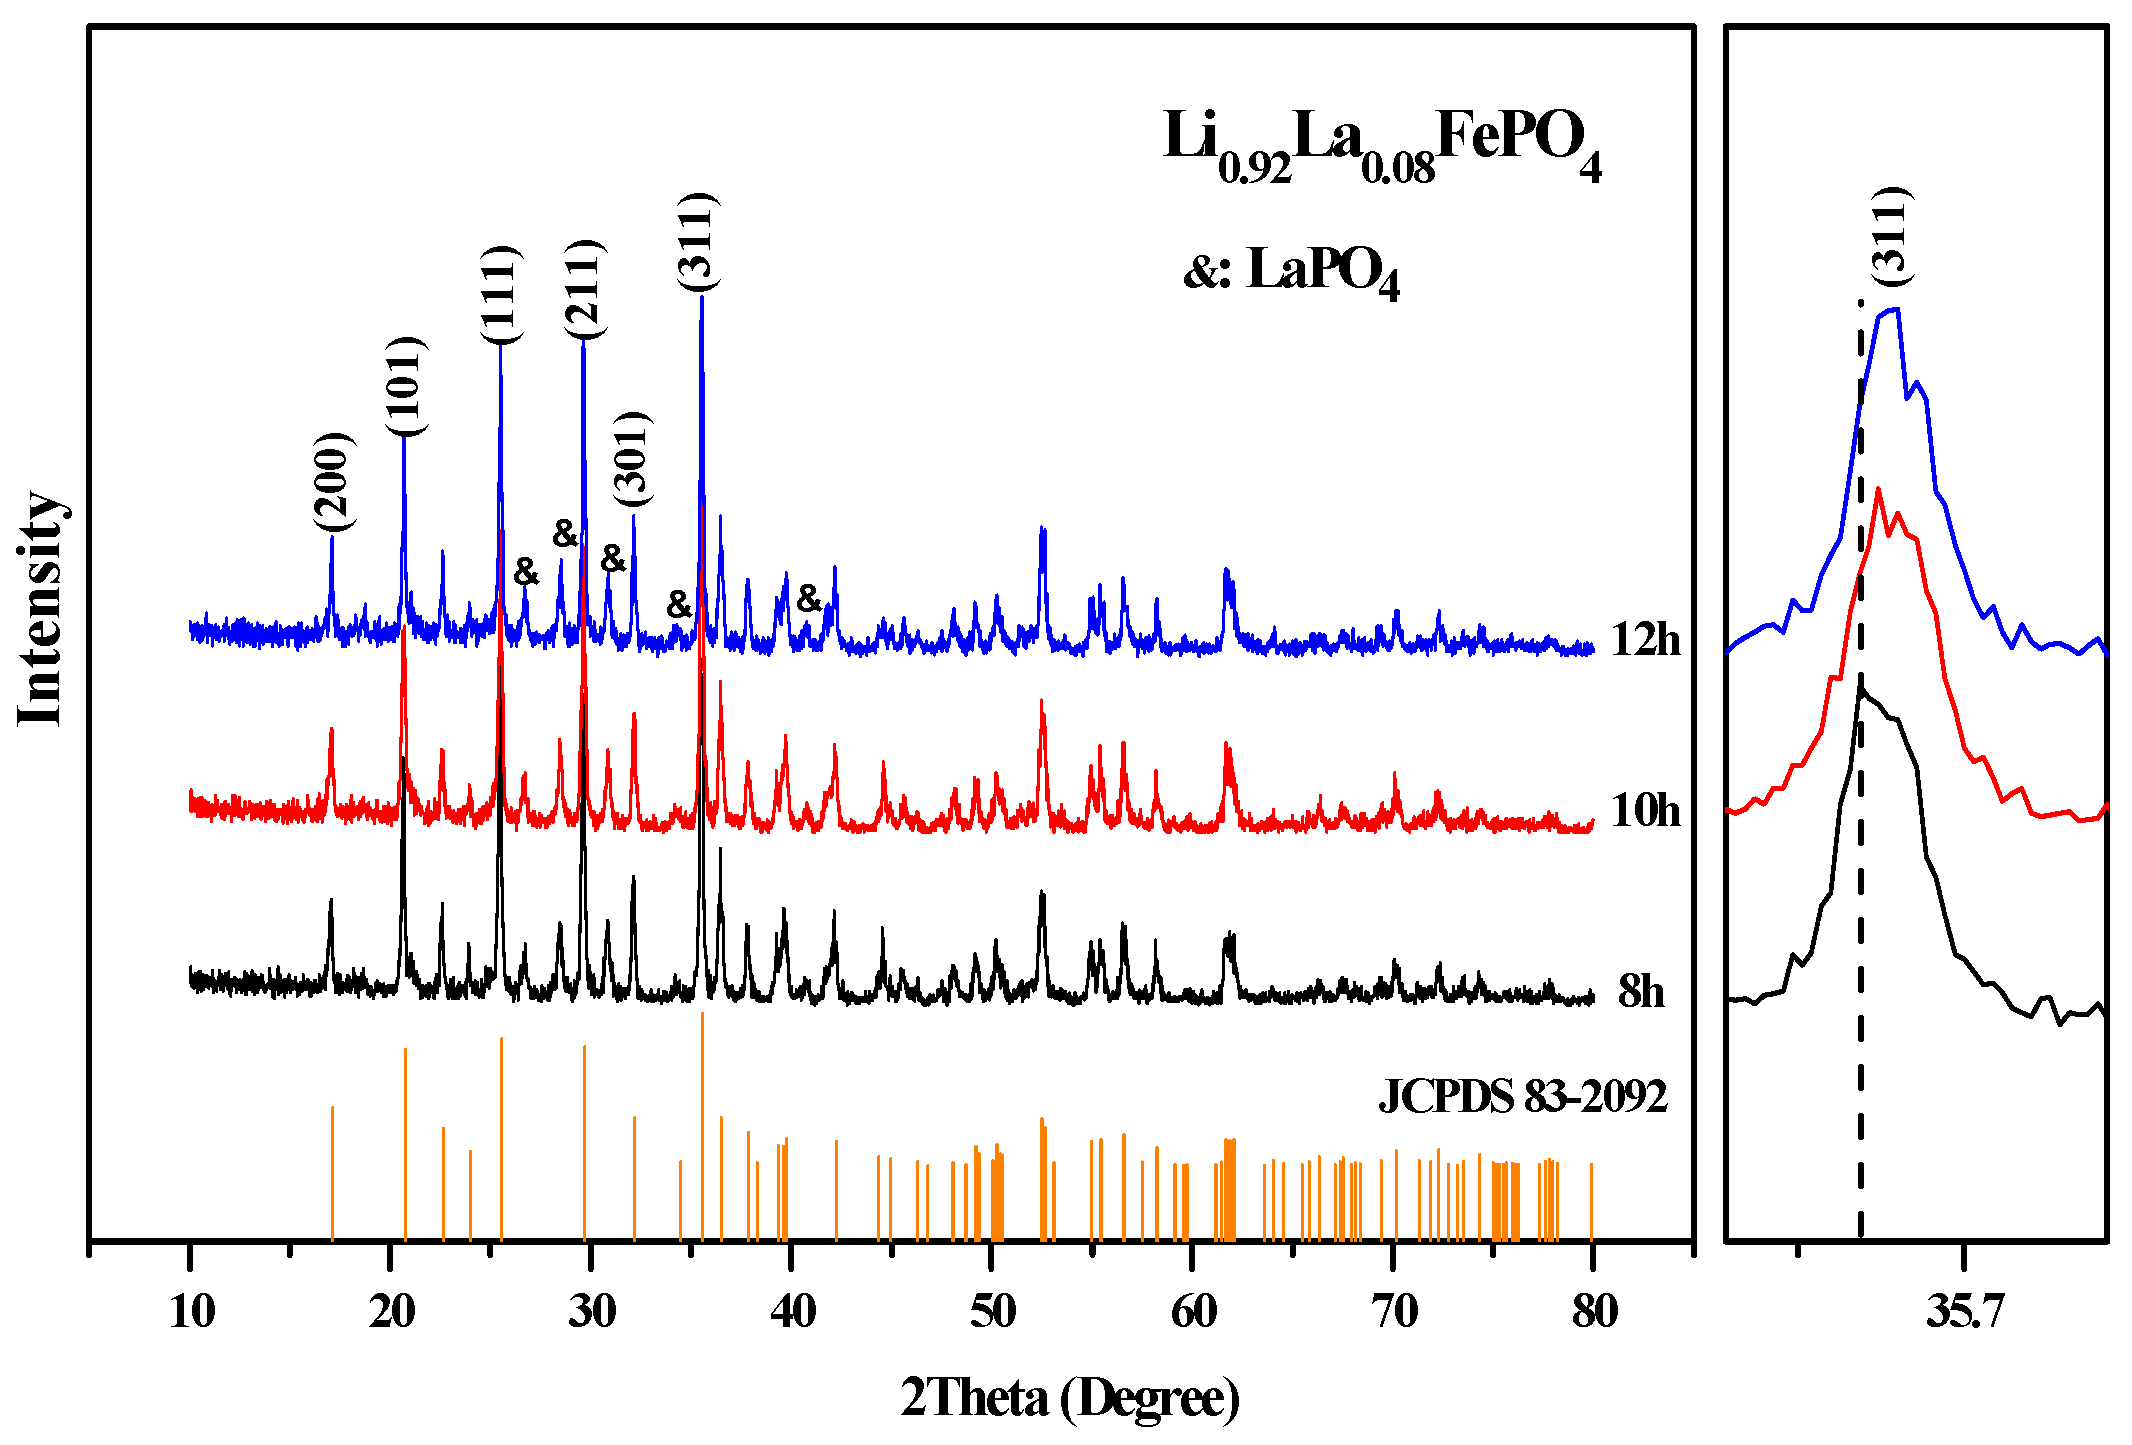
2.1. XRD Analysis
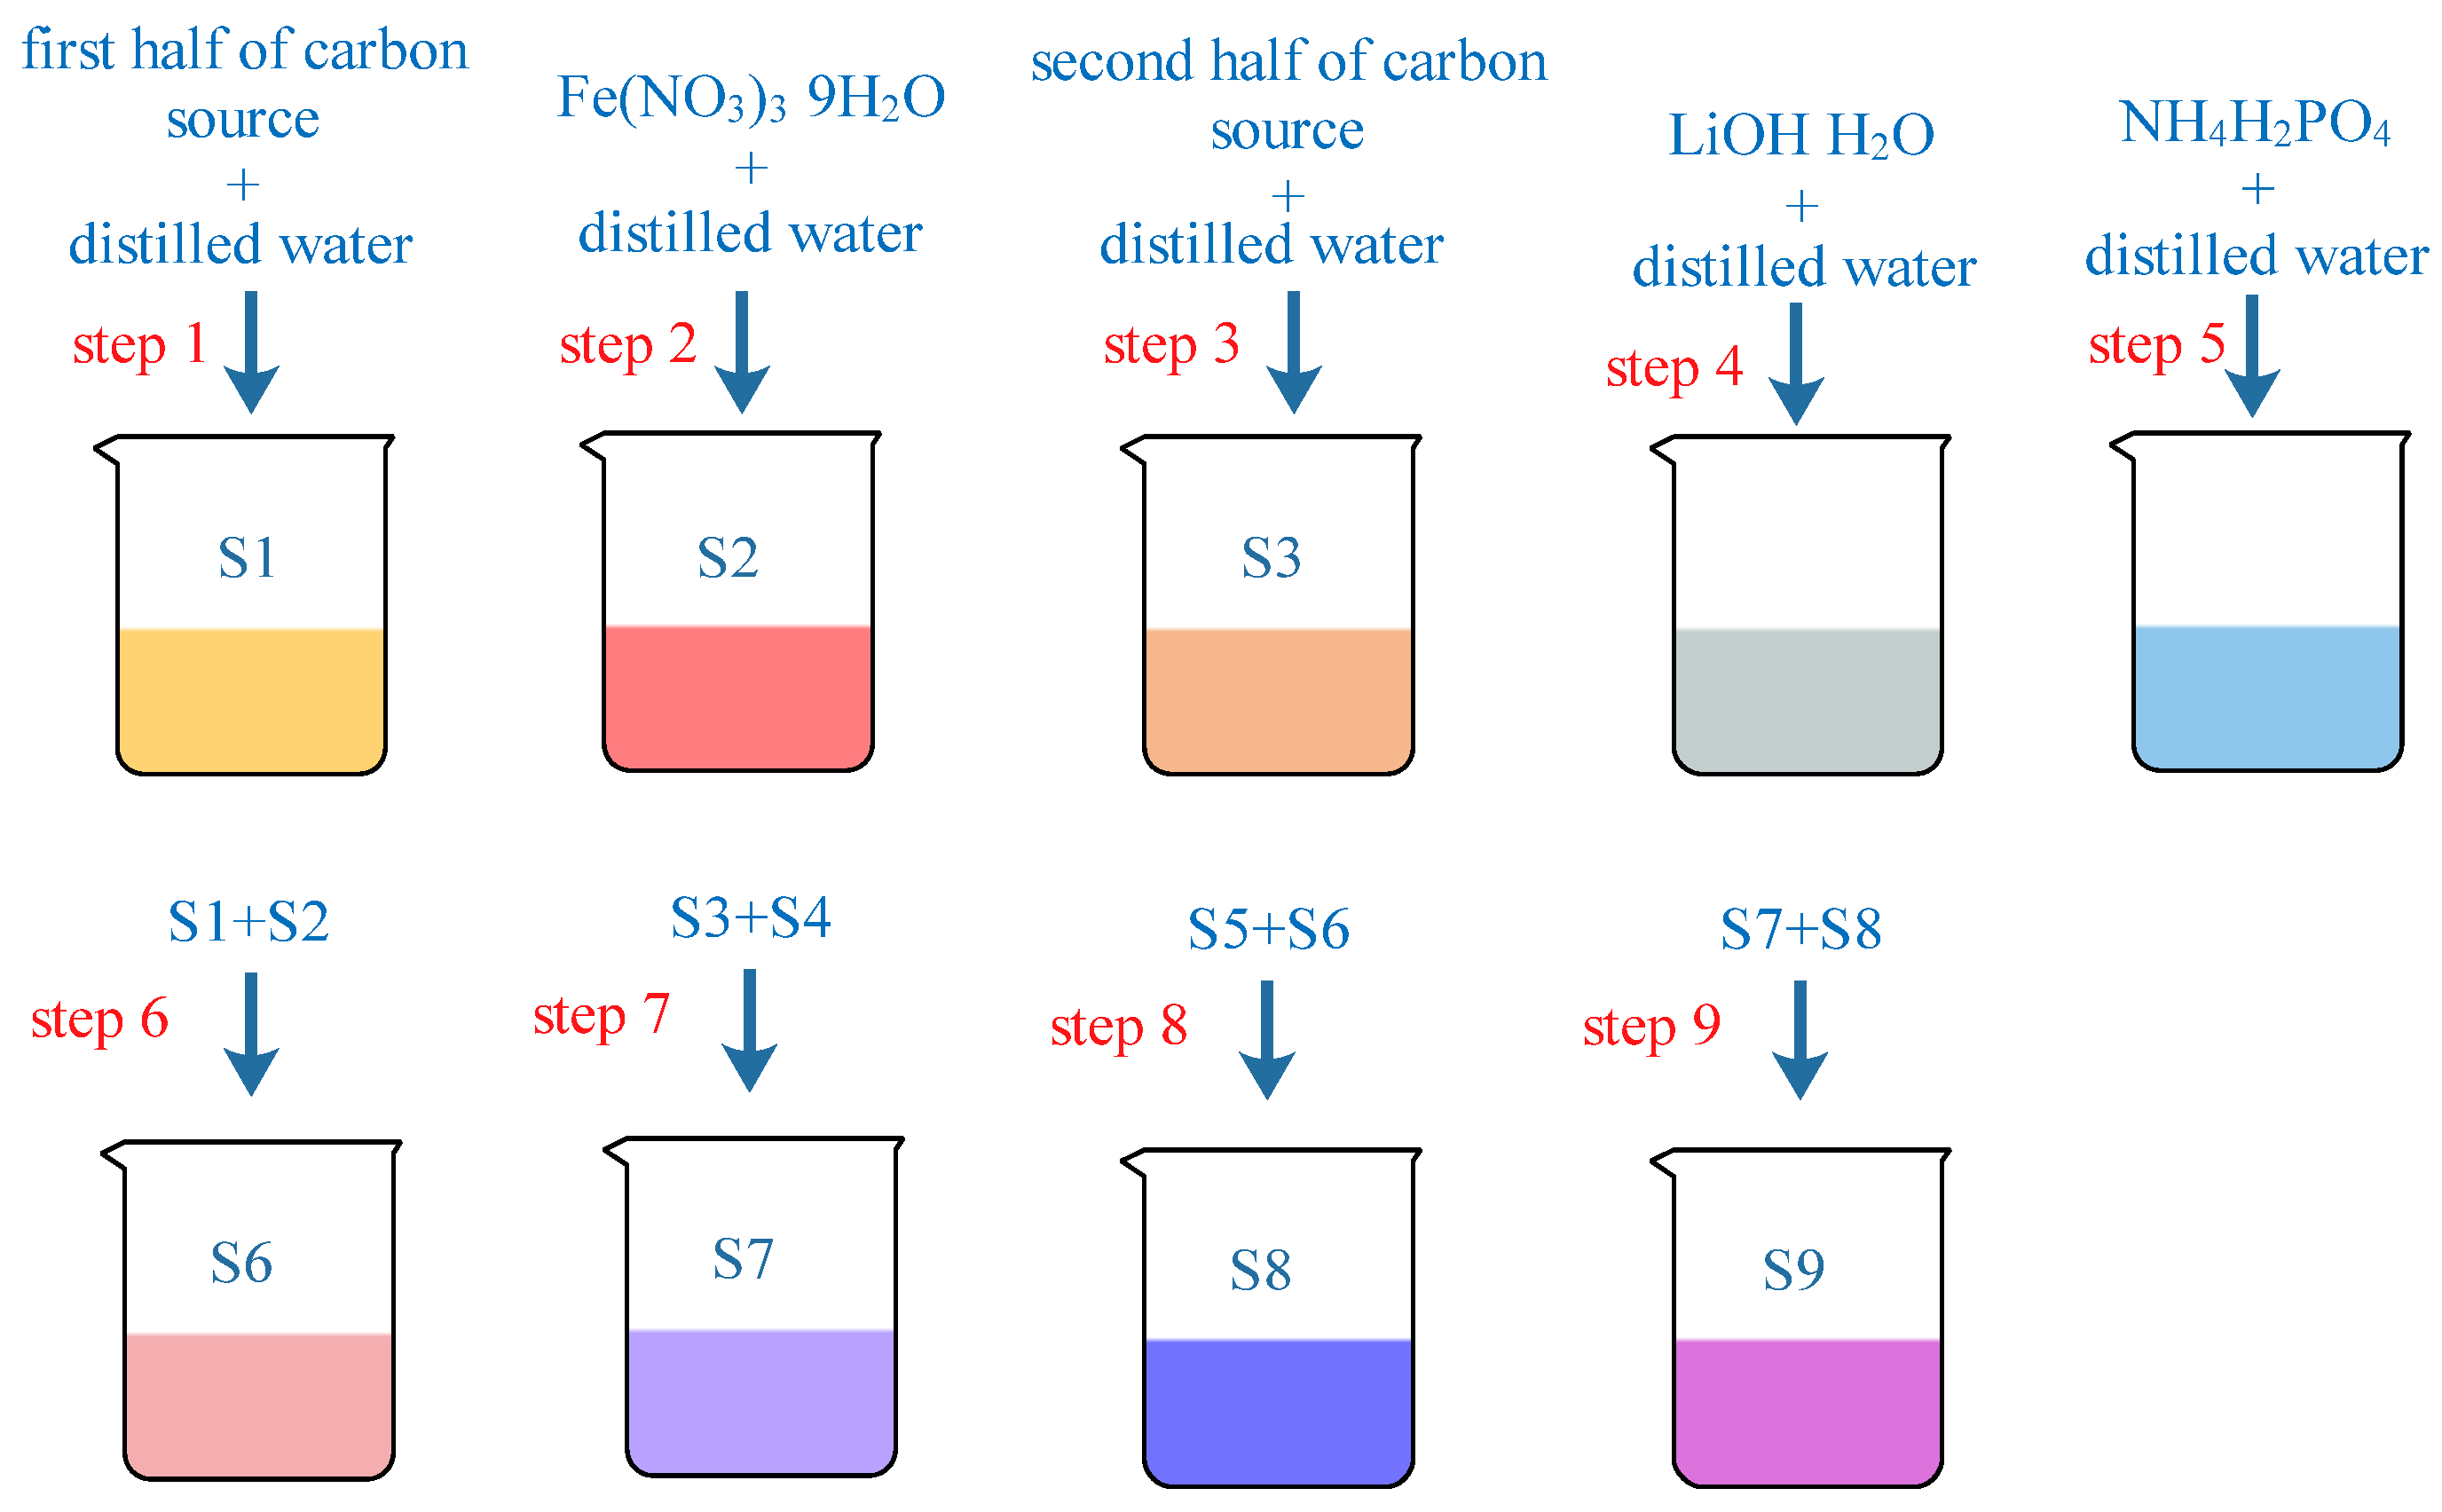
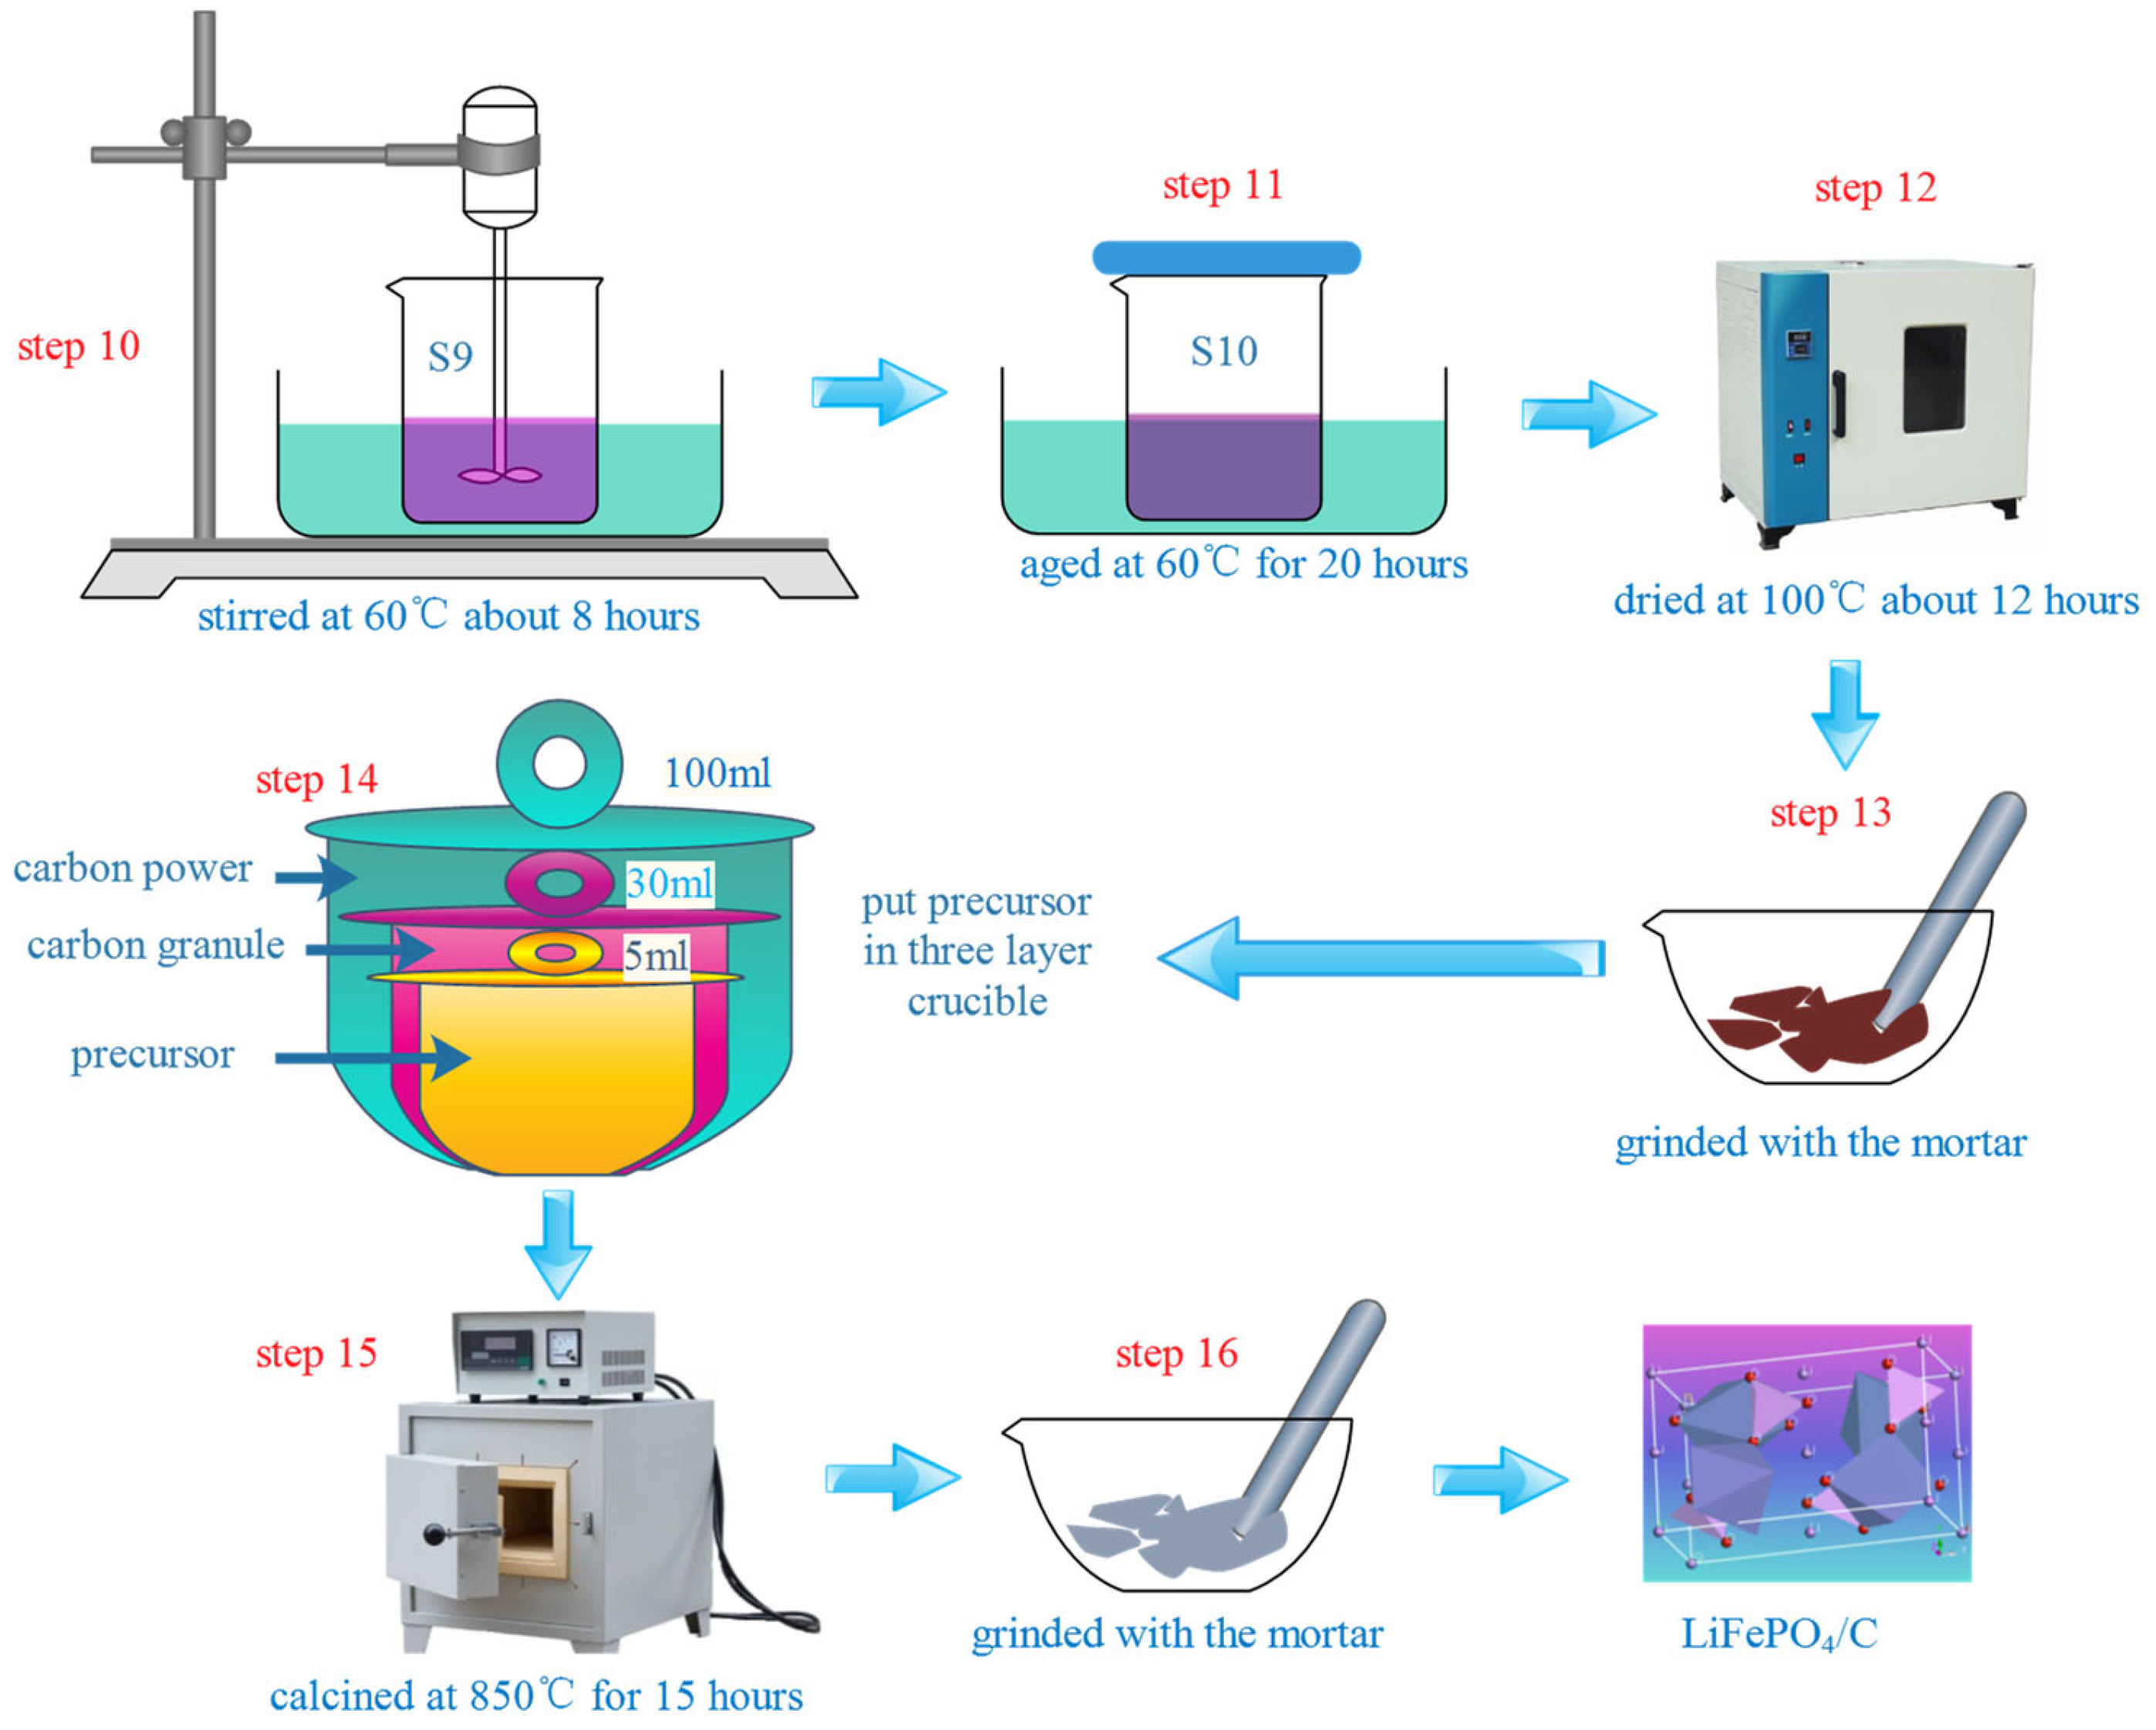
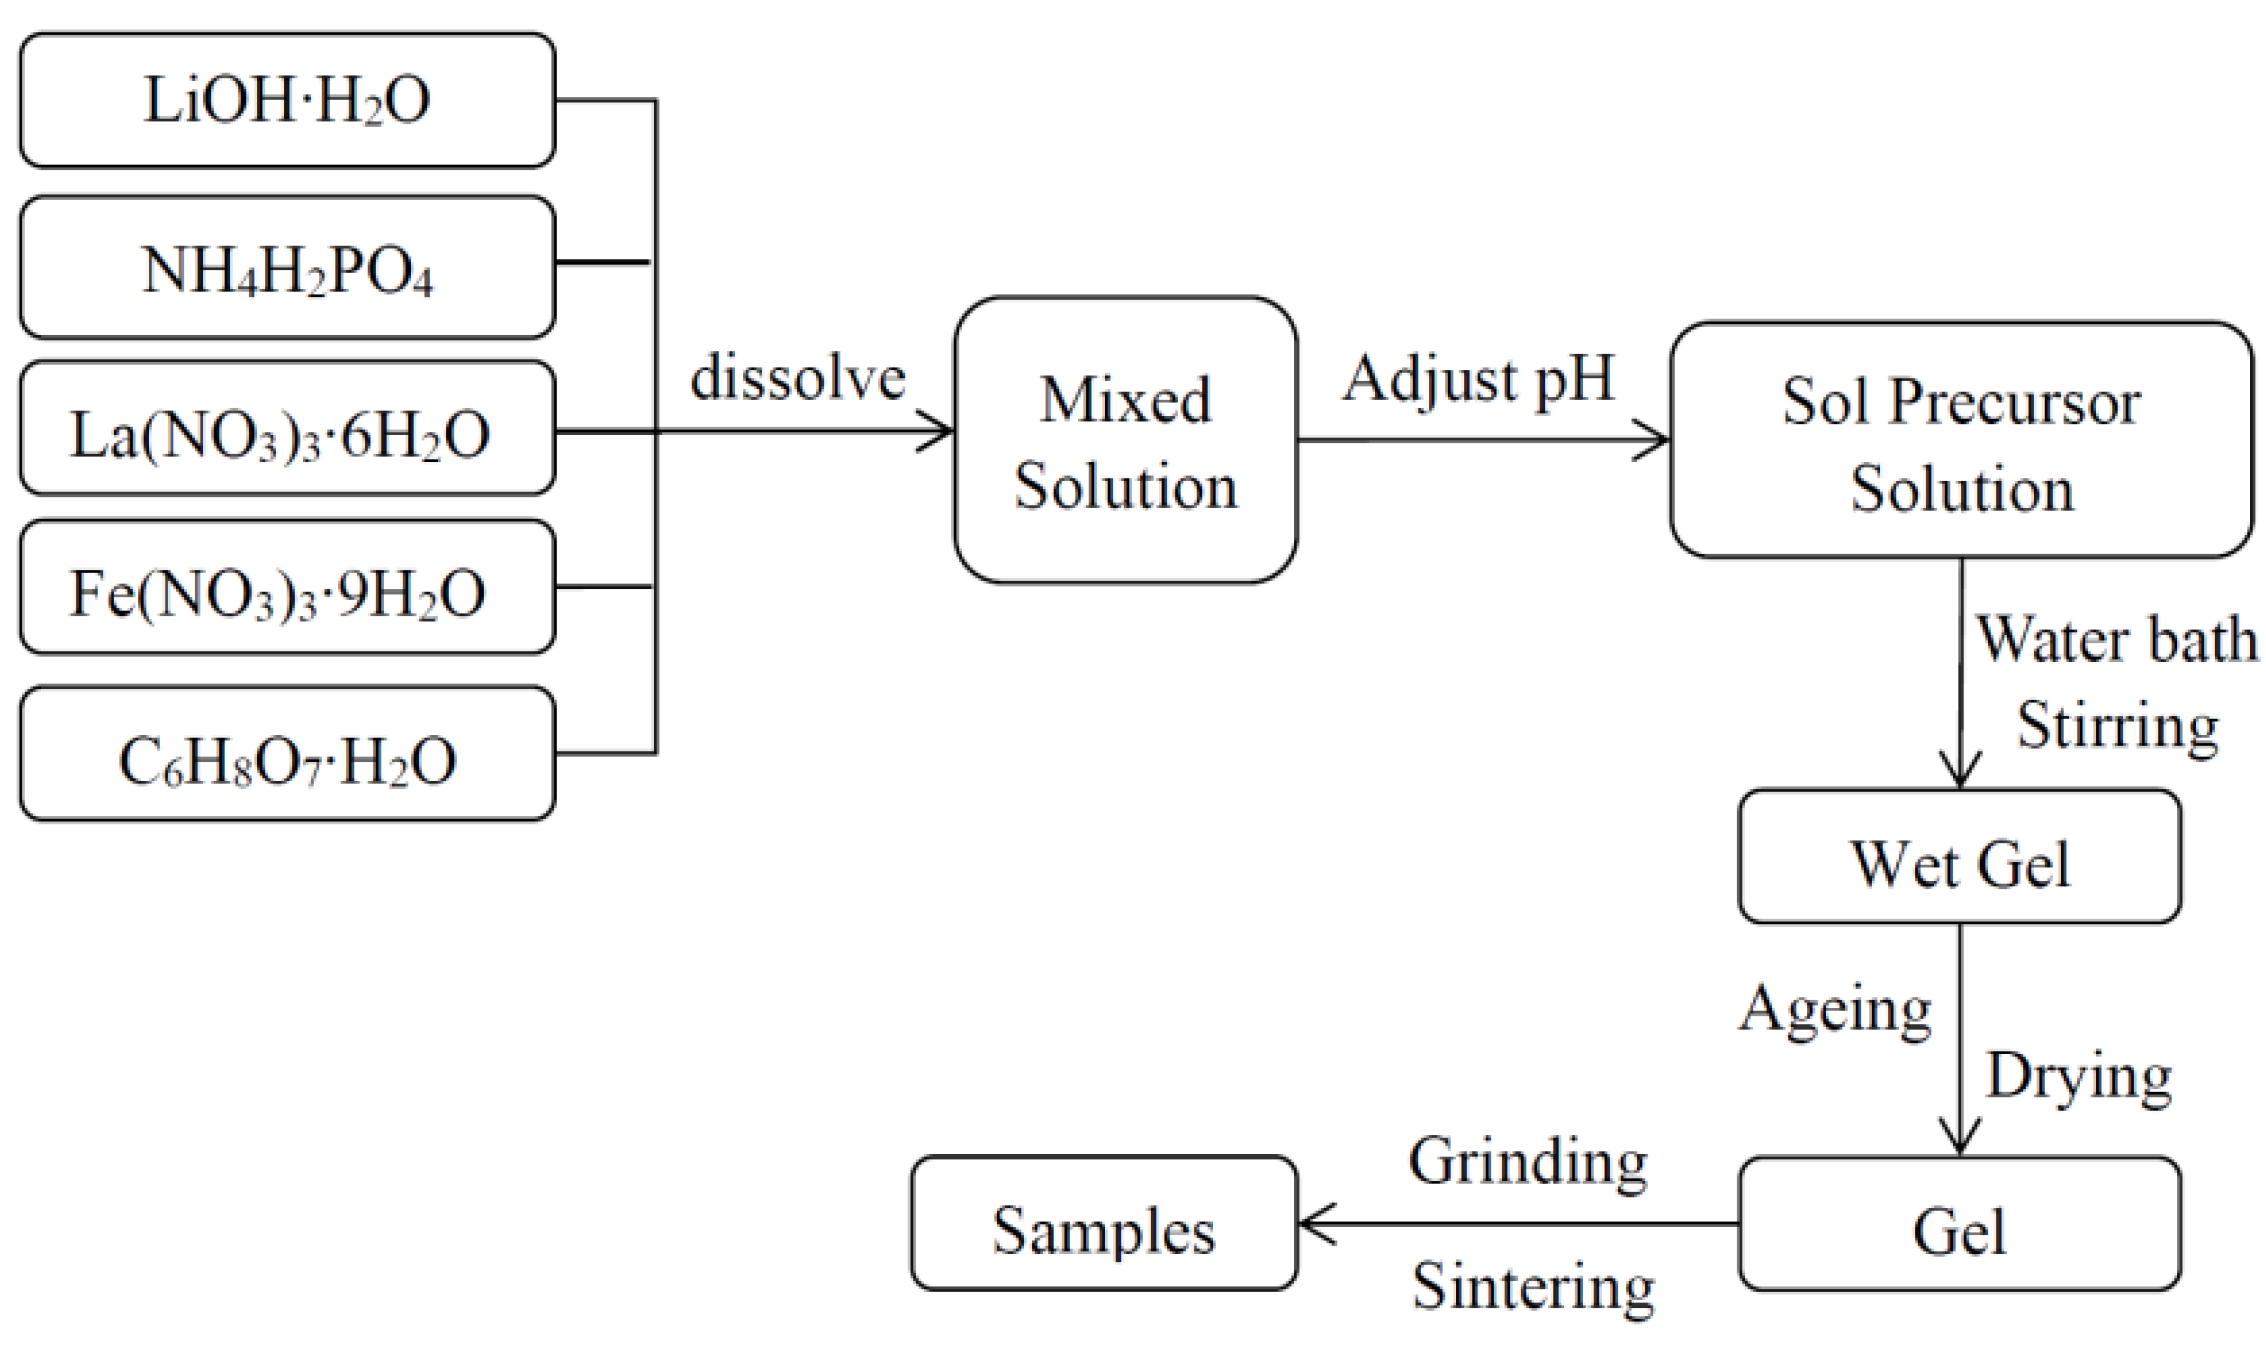
2.2. Preparation Process
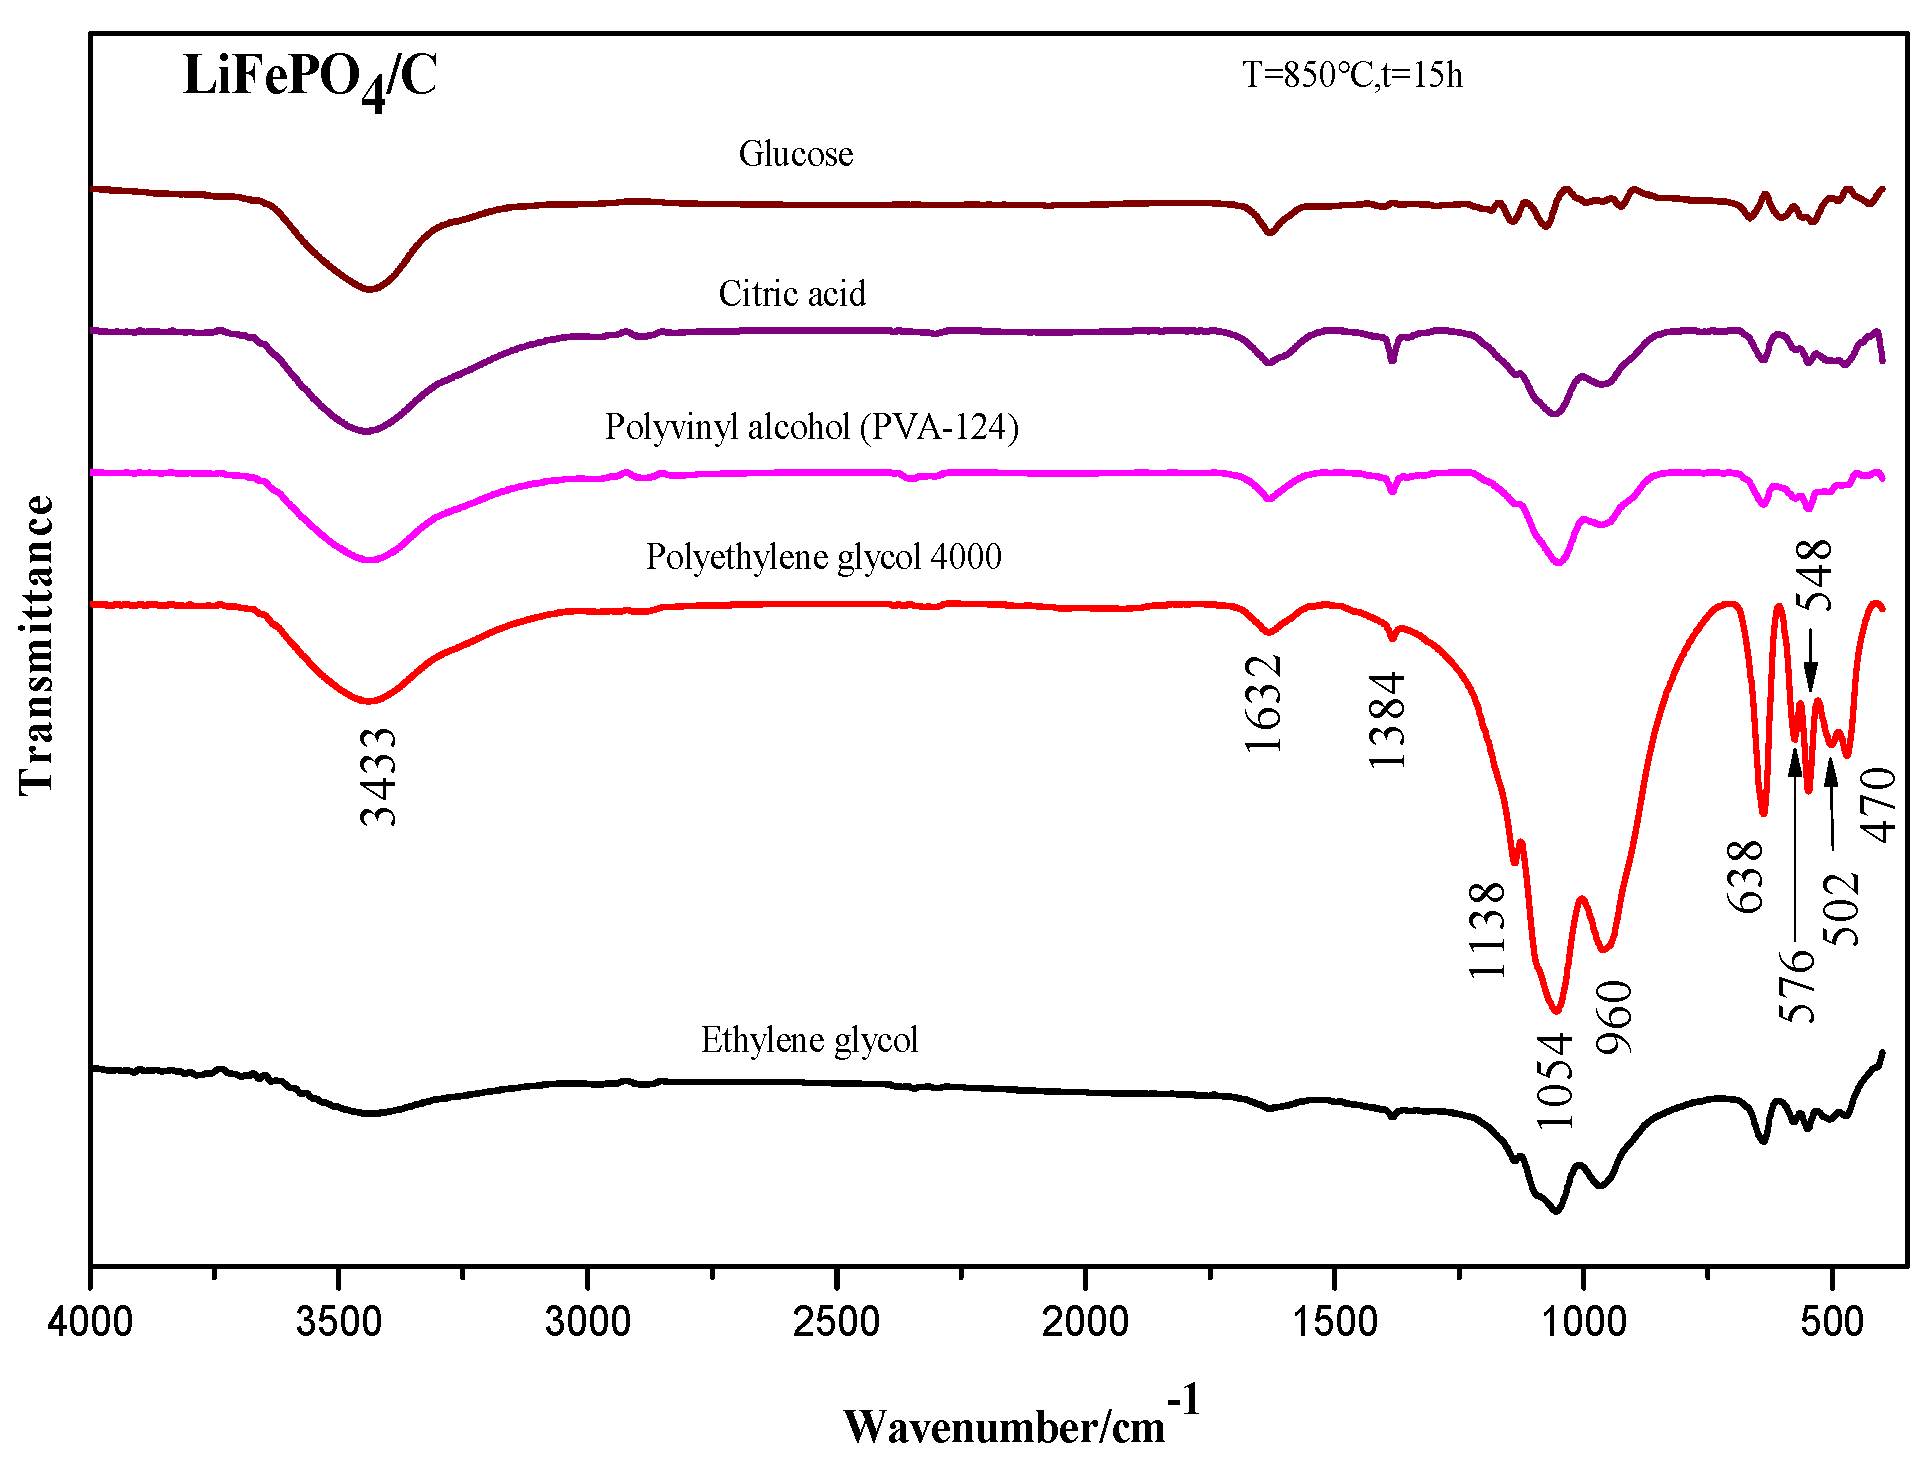
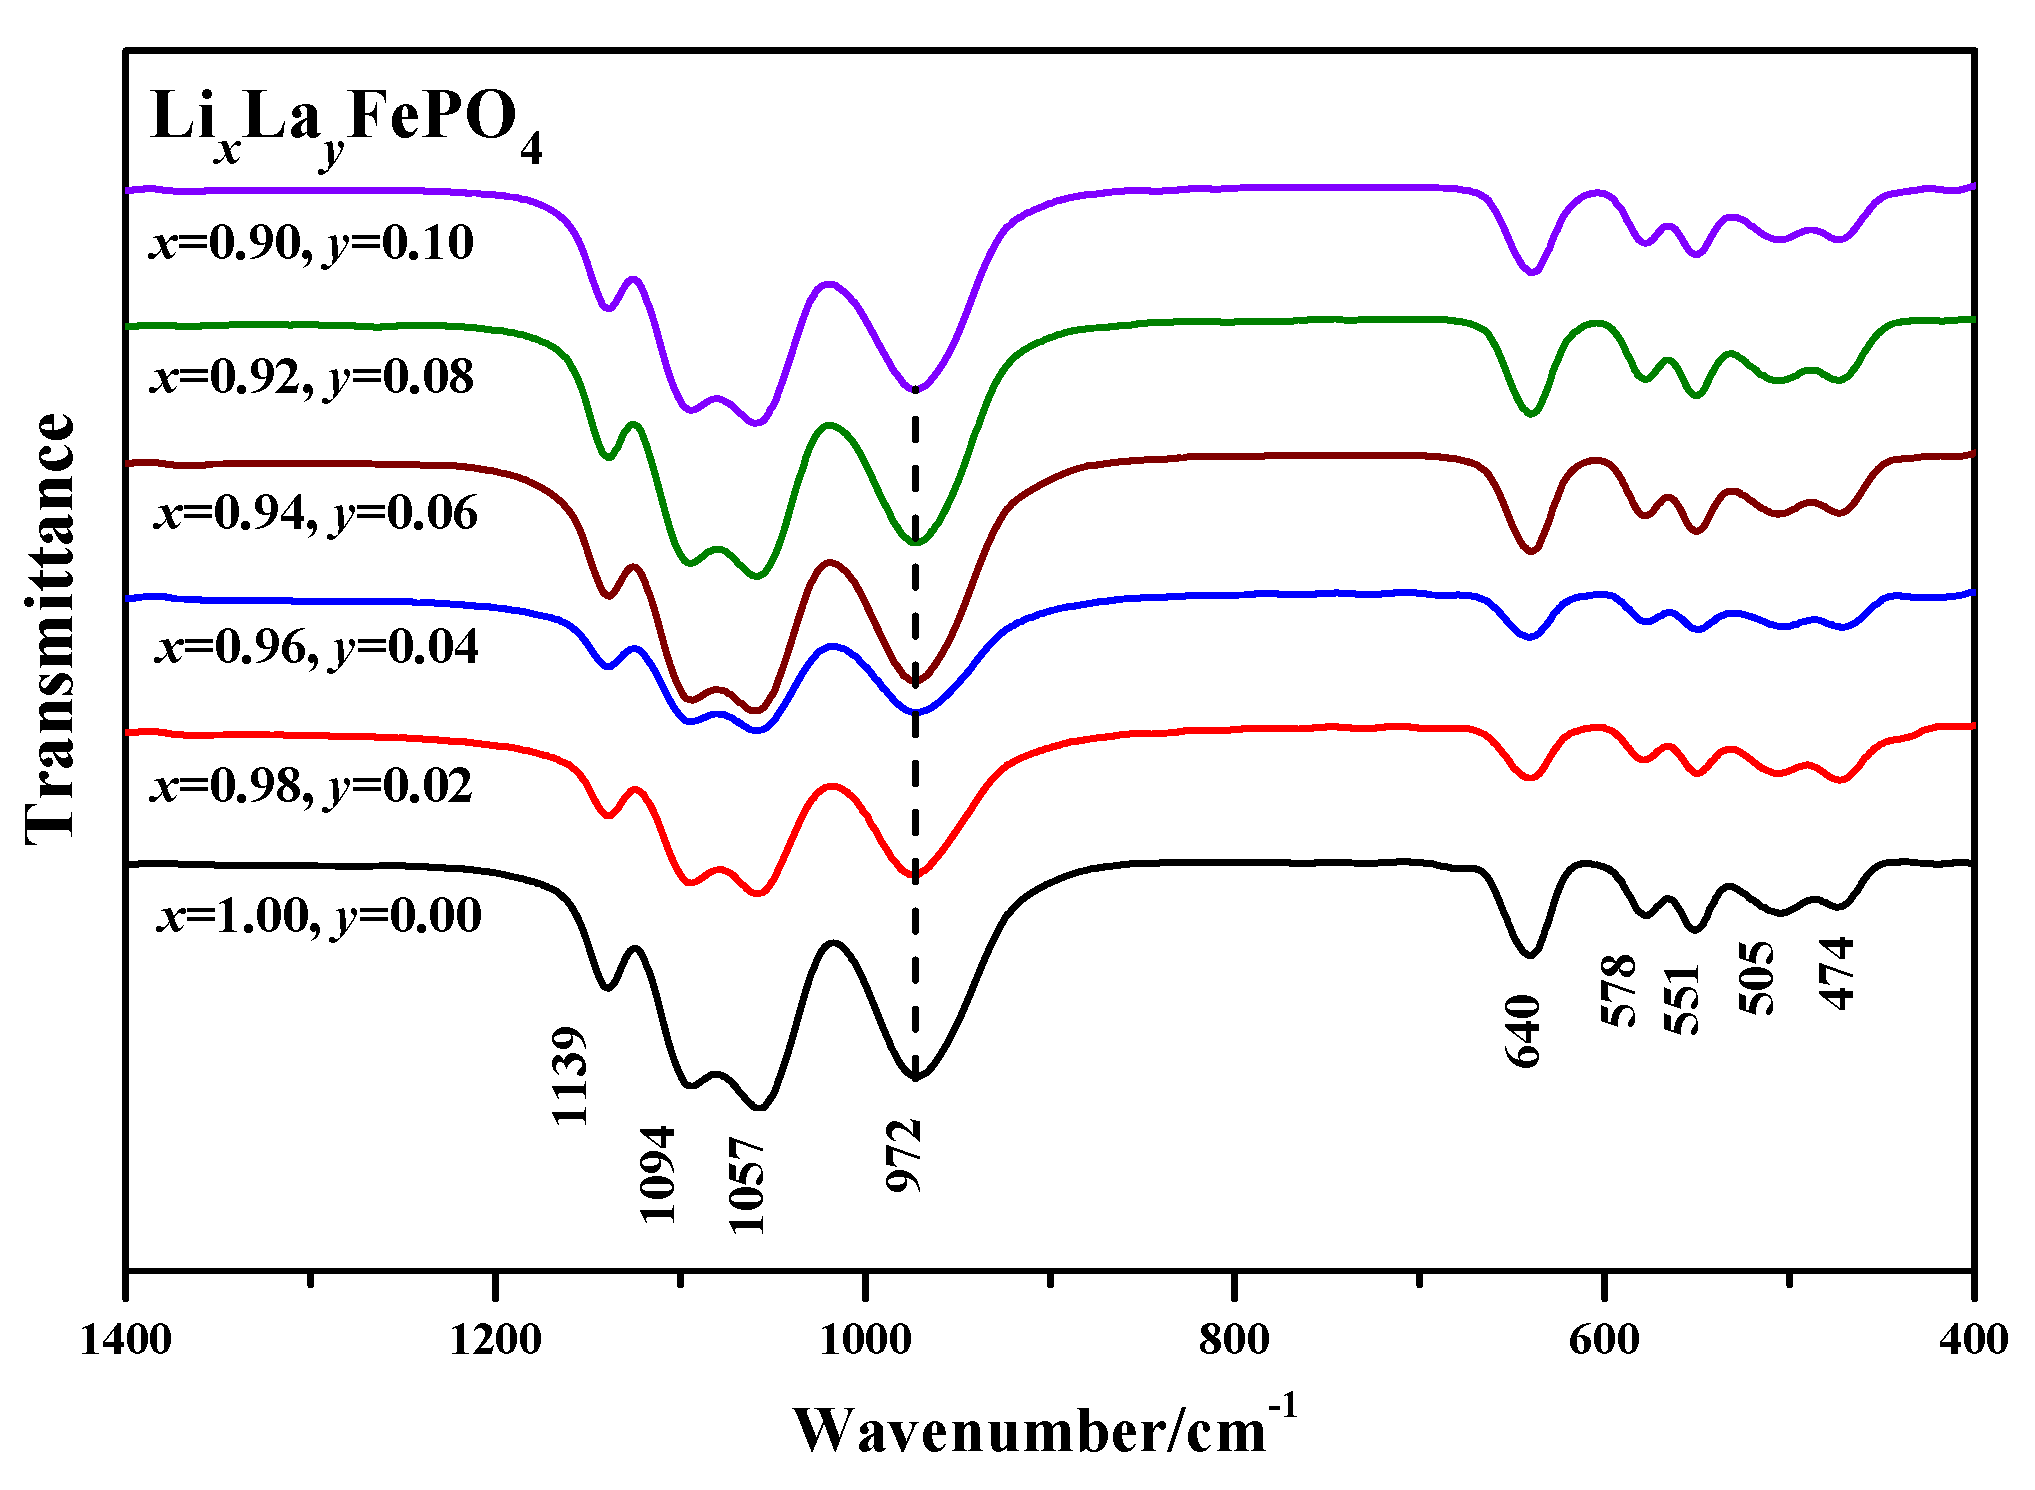
2.3. Infrared Spectrum Analysis
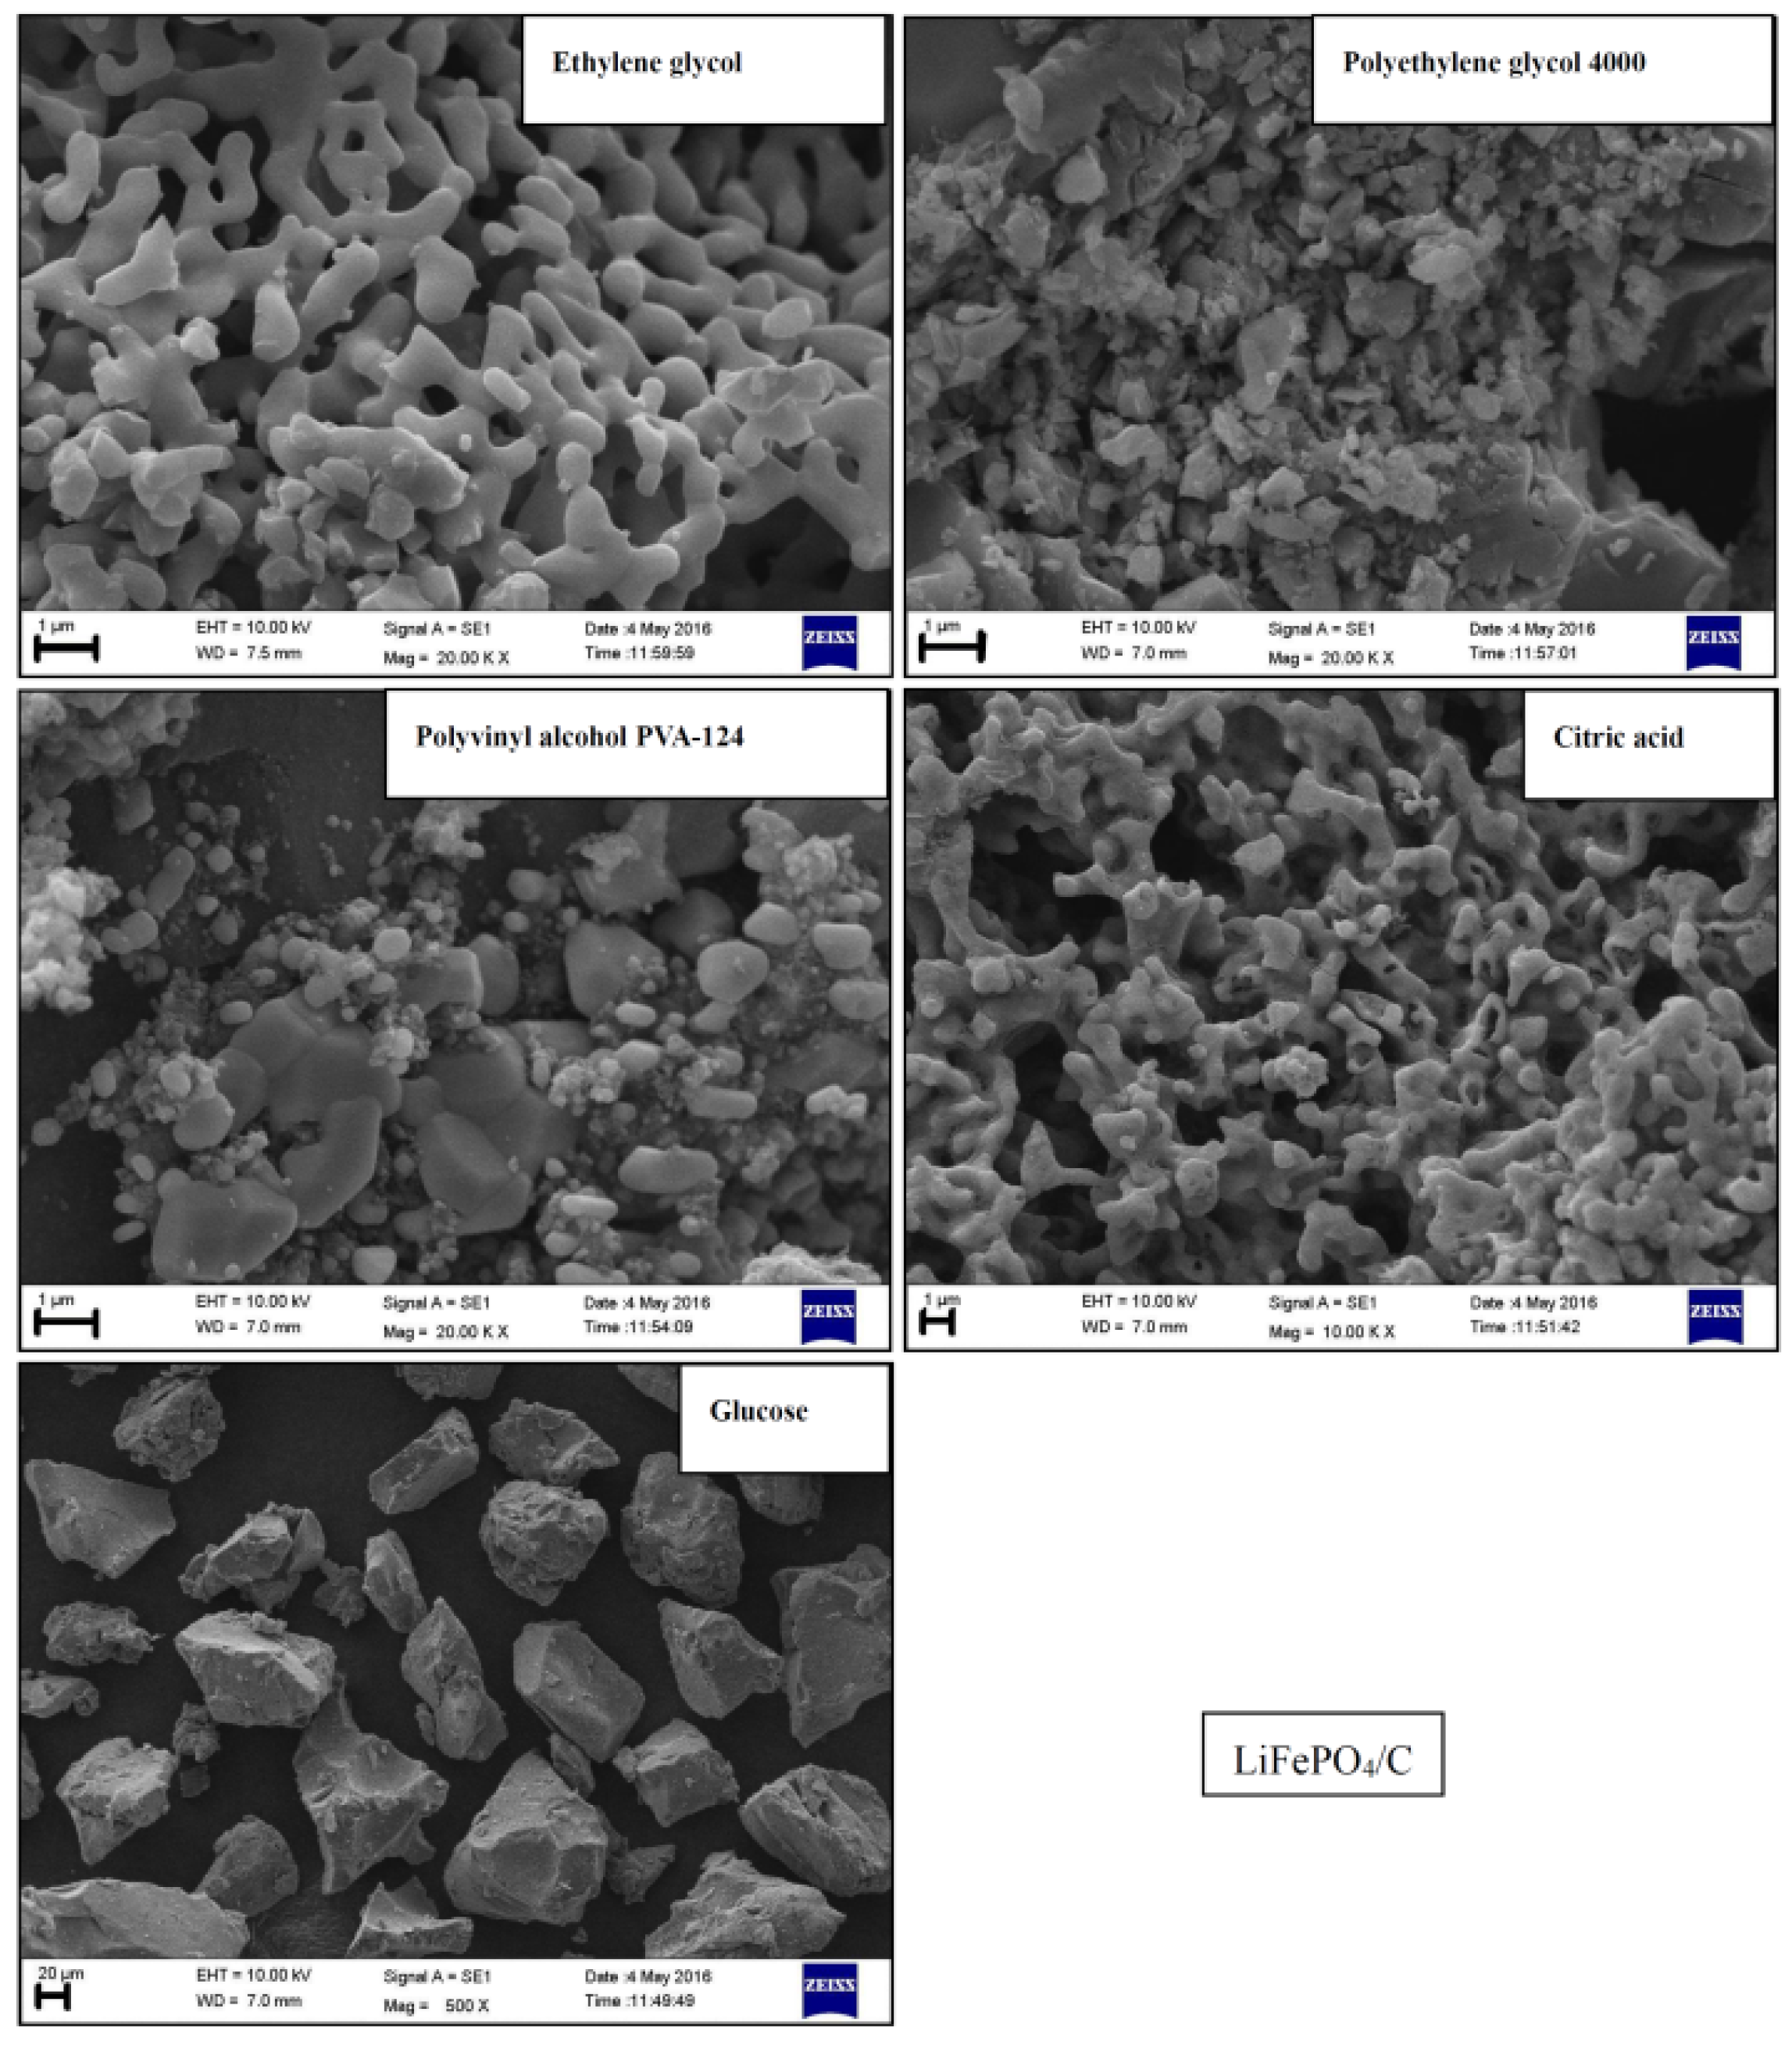
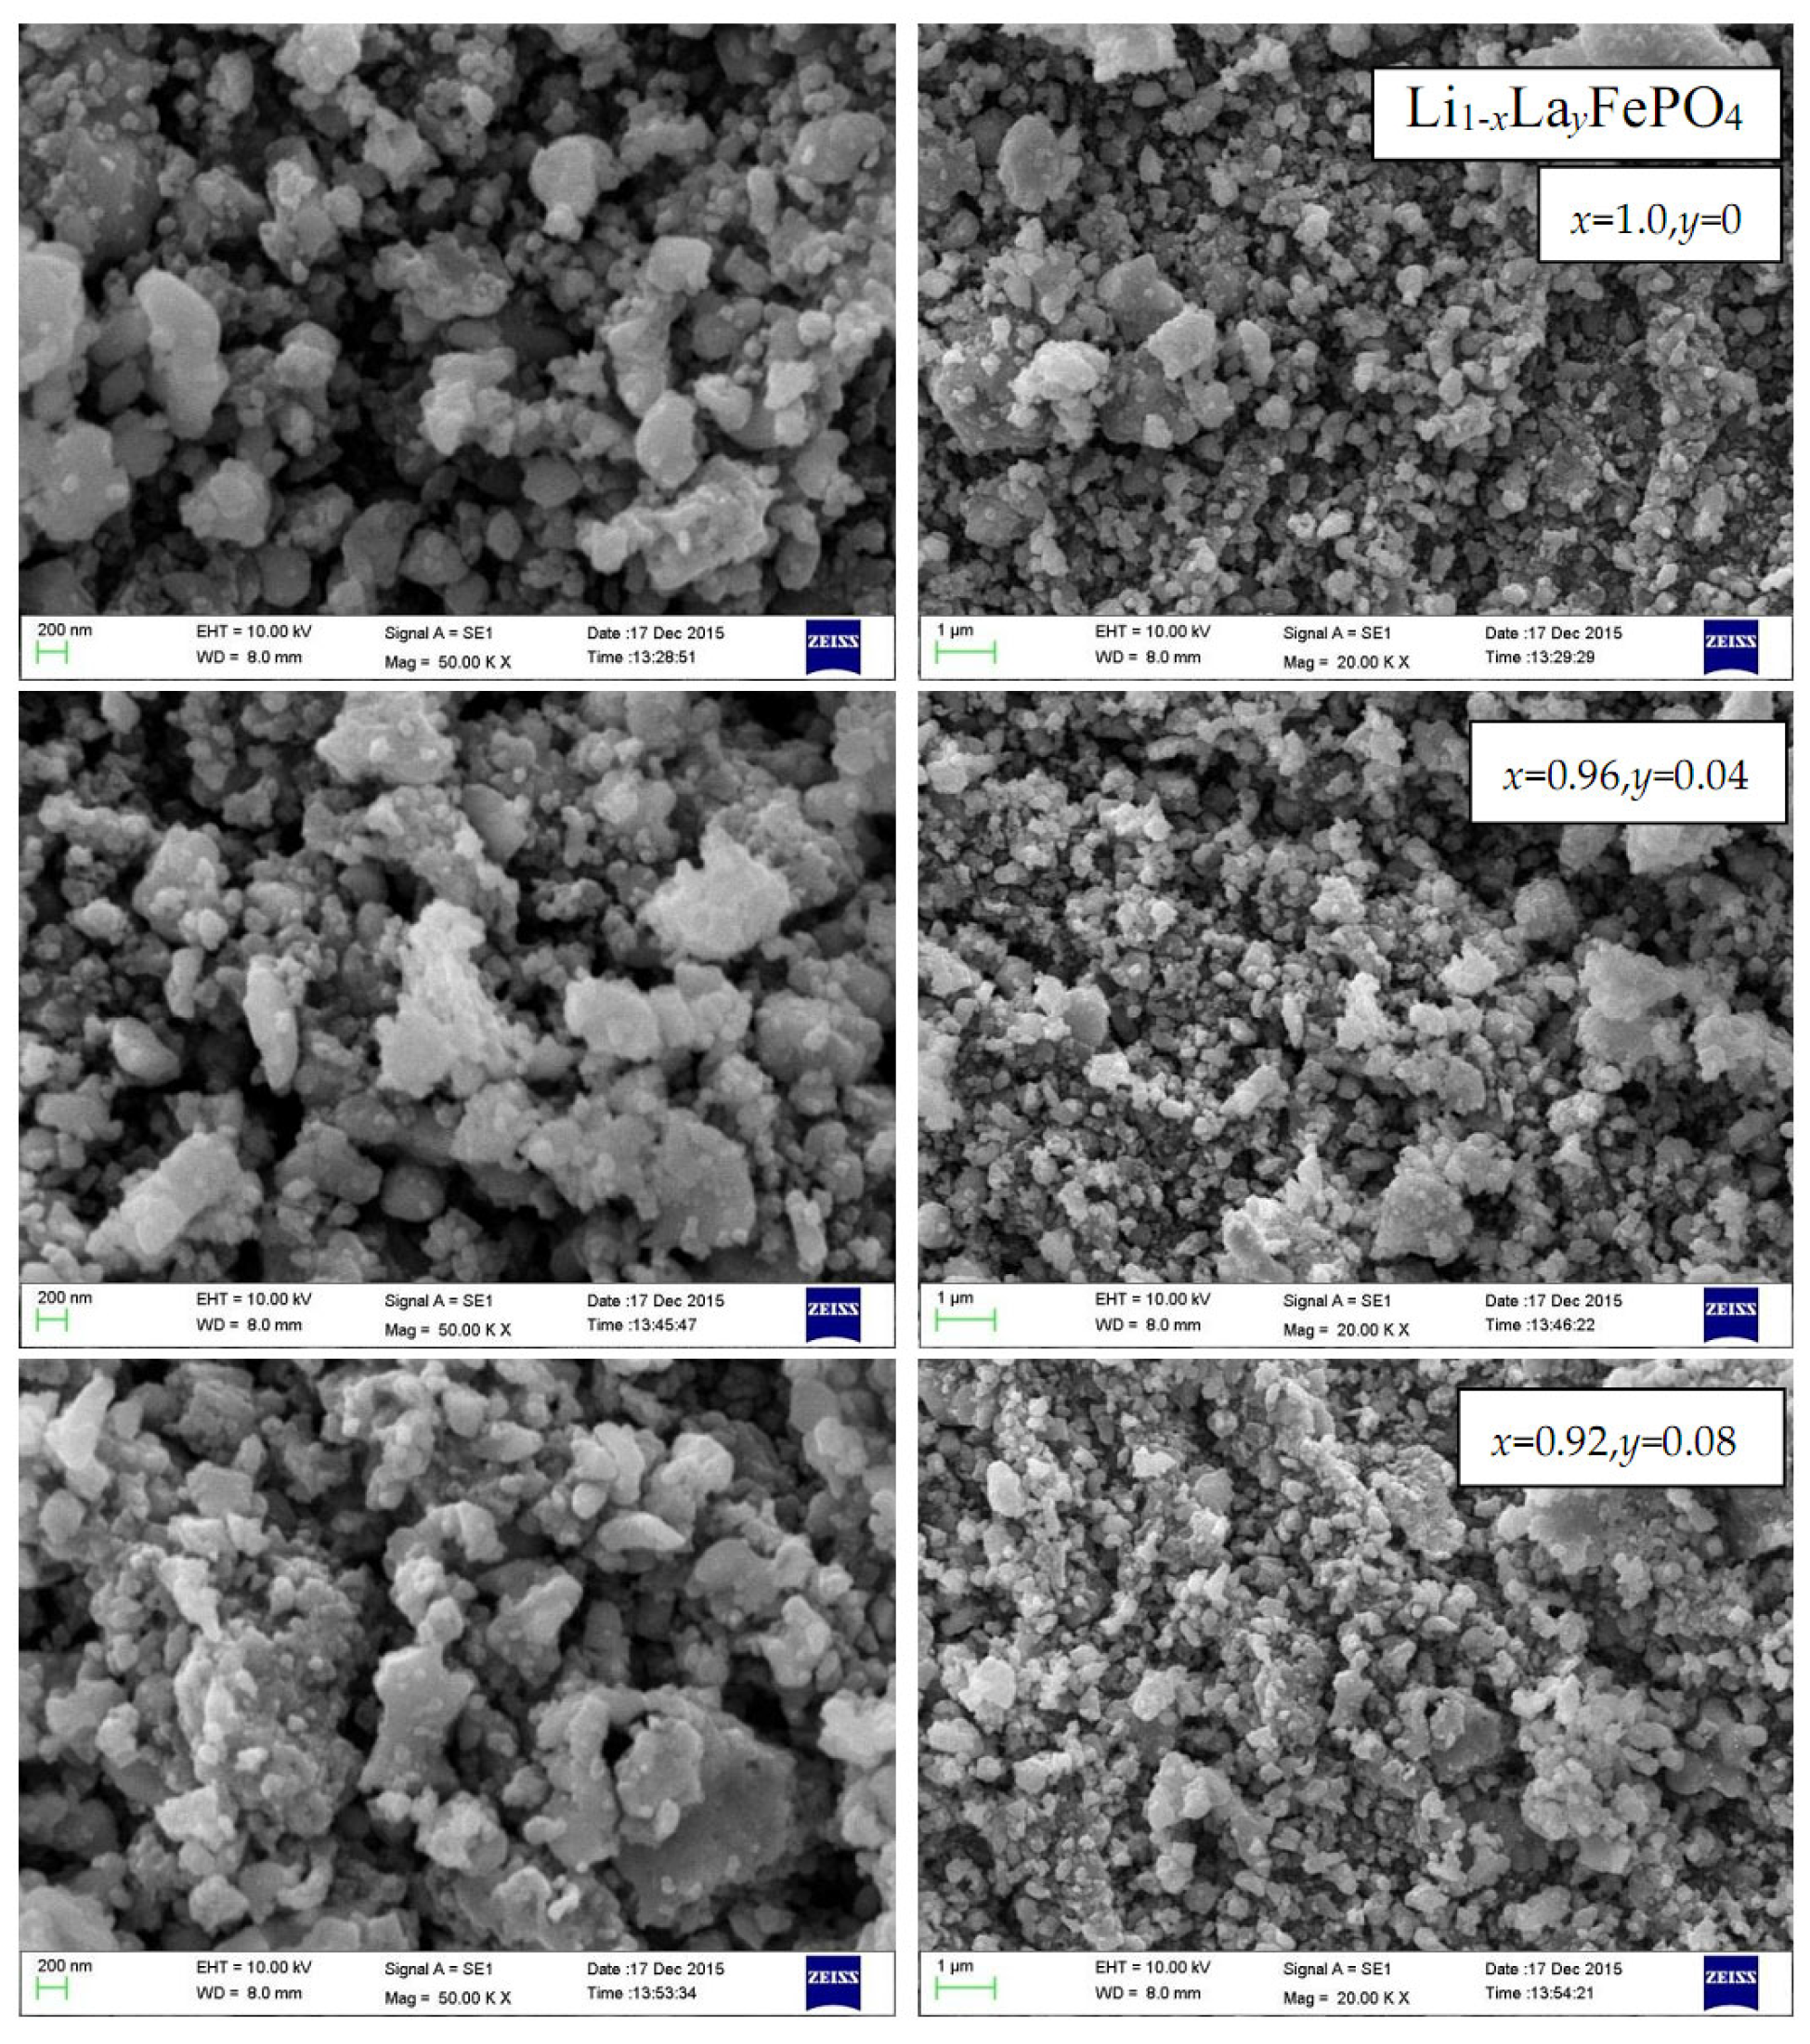
2.4. Scanning Electron Microscopy Analysis
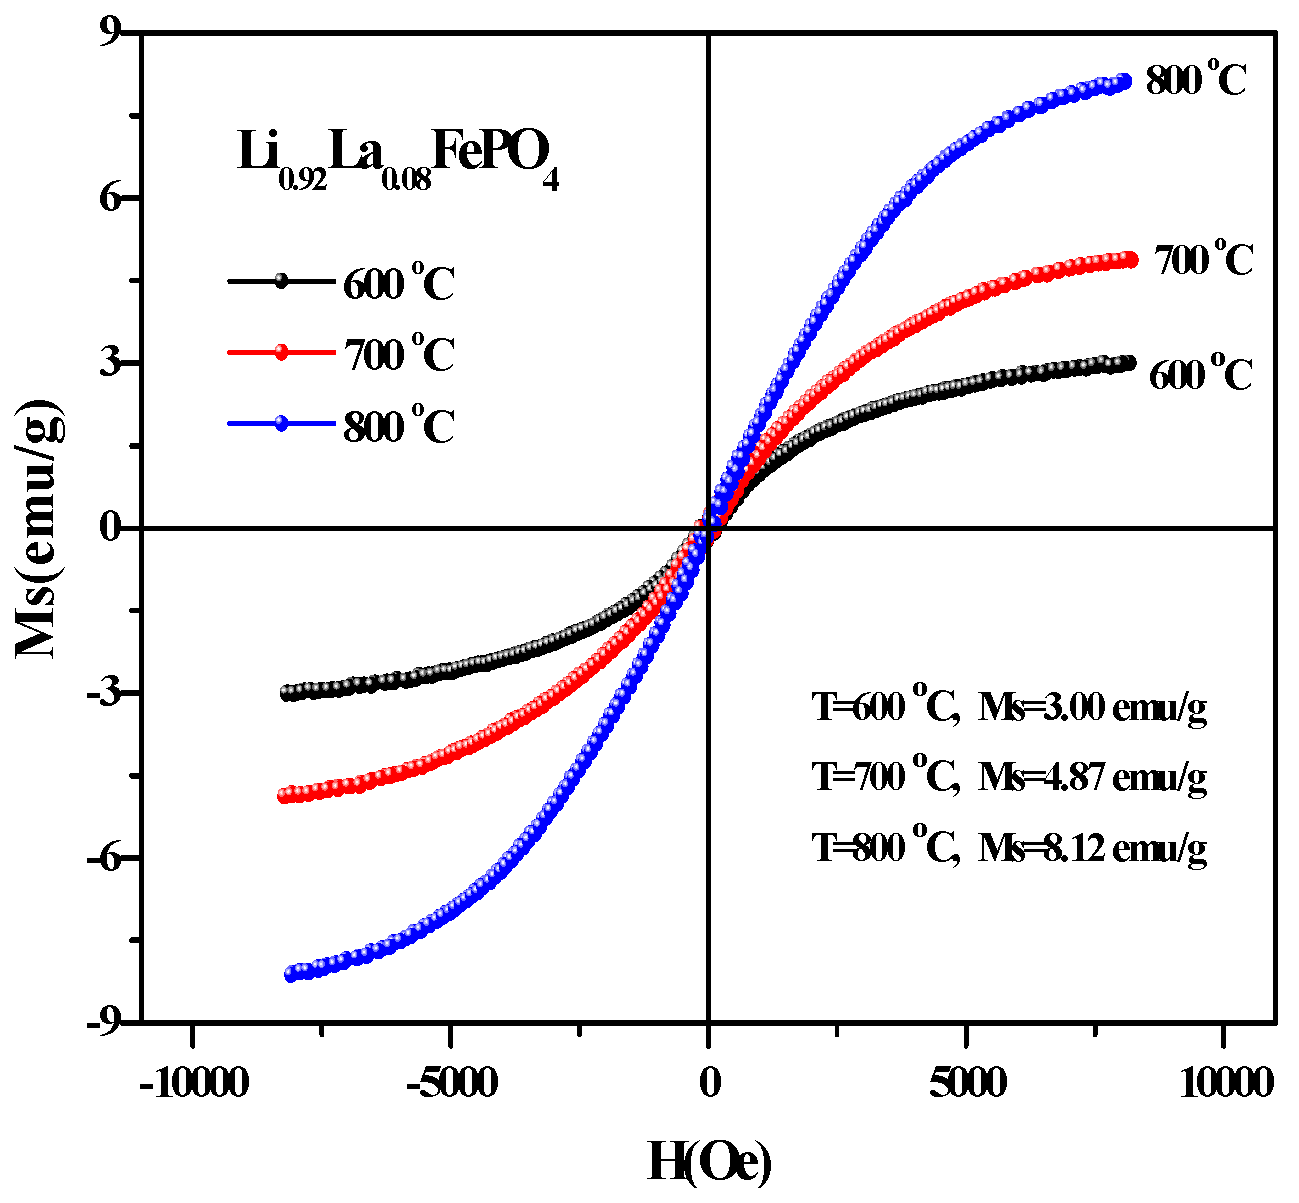
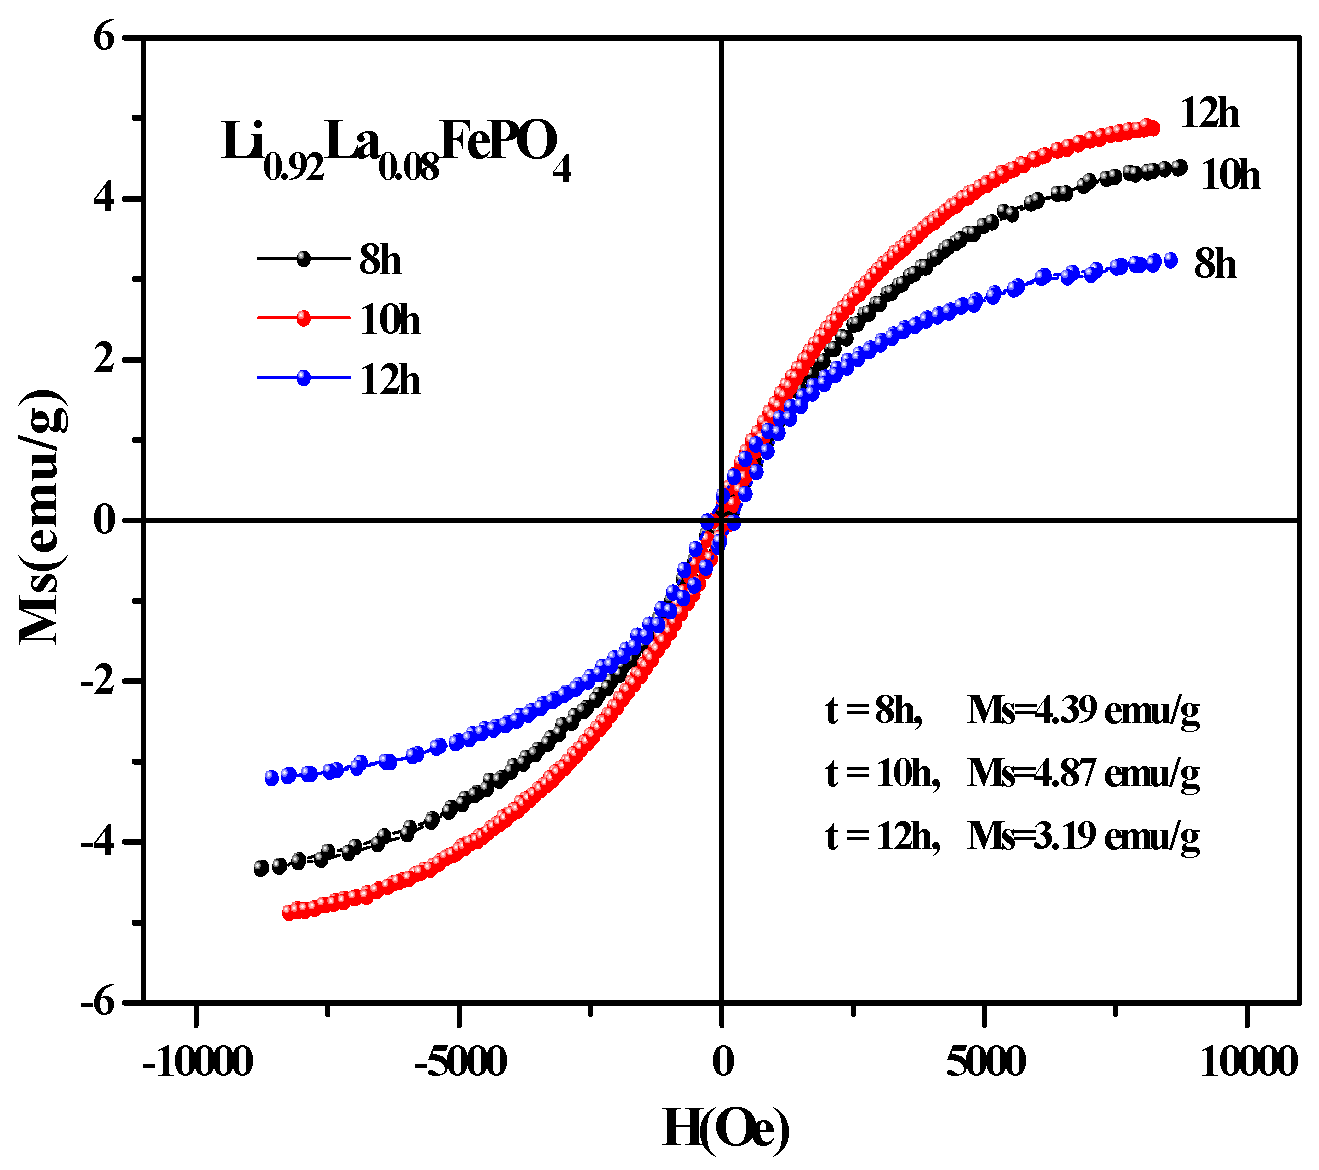
2.5. Magnetic Analysis
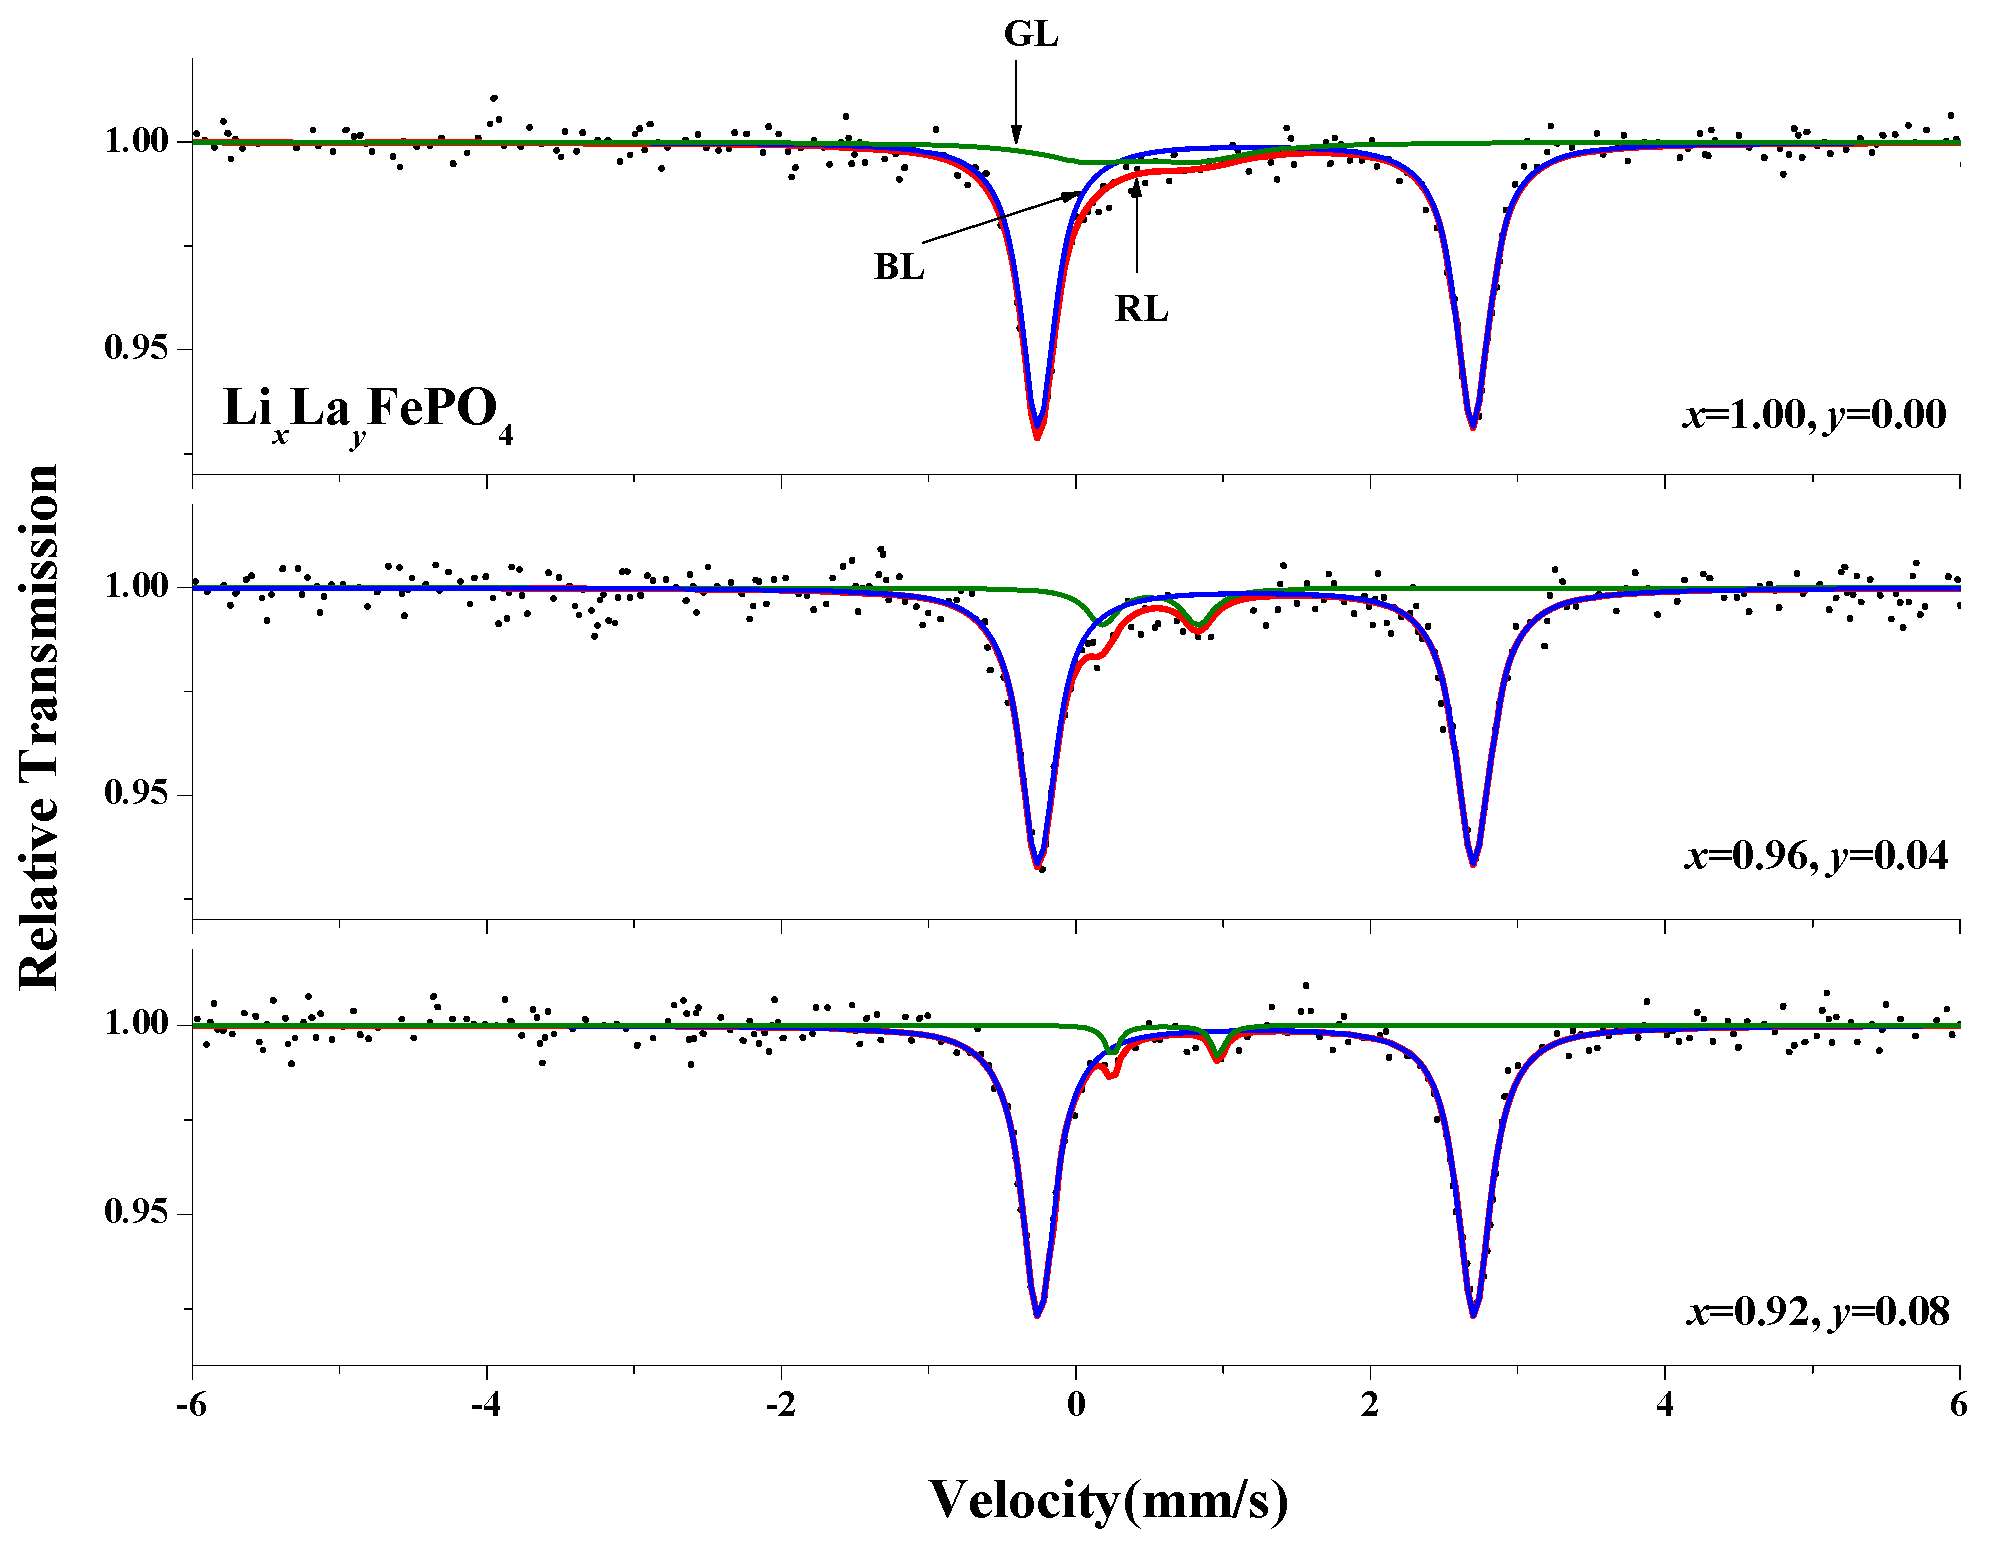
2.6. Mössbauer Spectra Analysis
3. Experimental Section
4. Conclusions
Author Contributions
Funding
Data Availability Statement
Conflicts of Interest
References
- Padhi, A.K.; Nanjundaswamy, K.S.; Goodenough, J.B. Phospho-olivines as Positive-Electrode Materials for Rechargeable Lithium Batteries. J. Electrochem. Soc. 1997, 144, 1188–1194. [Google Scholar] [CrossRef]
- Tong, H.; Li, Y.; Mao, G.; Wang, C.; Yu, W.; Liu, Y.; Liu, M. Regeneration of spent LiFePO4 as a high-performance cathode material by a simultaneous coating and doping strategy. Int. J. Miner. Met. Mater. 2023, 30, 1162–1170. [Google Scholar] [CrossRef]
- Zhang, Q.; Zhou, J.; Zeng, G.; Ren, S. Effect of lanthanum and yttrium doped LiFePO4 cathodes on electrochemical performance of lithium-ion battery. J. Mater. Sci. 2023, 58, 8463–8477. [Google Scholar] [CrossRef]
- Shimoi, N.; Komatsu, M. Application of exfoliated graphene as conductive additive for lithium-ion secondary batteries. Powder Technol. 2021, 390, 268–272. [Google Scholar] [CrossRef]
- Popp, H.; Koller, M.; Jahn, M.; Bergmann, A. Mechanical methods for state determination of Lithium-Ion secondary batteries: A review. J. Energy Storage 2020, 32, 101859. [Google Scholar]
- Minakshi, M.; Bahri, P.A.; Paul, S.; Kumari, P.; Divakaran, A.M.; Manjunatha, K.N. Rational design on materials for developing next generation lithium-ion secondary battery. Prog. Solid State Chem. 2021, 62, 100298. [Google Scholar] [CrossRef]
- Yan, D.; Lu, A.-H.; Chen, Z.-Y.; He, L.; Li, W.-C. Pseudocapacitance-Dominated Li-Ion Capacitors Showing Remarkable Energy Efficiency by Introducing Amorphous LiFePO4 in the Cathode. ACS Appl. Energy Mater. 2021, 4, 1824–1832. [Google Scholar] [CrossRef]
- Yao, J.; Konstantinov, K.; Wang, G.X.; Liu, H.K. Electrochemical and magnetic characterization of LiFePO4 and Li0.95Mg0.05FePO4 cathode materials. J. Solid State Electrochem. 2007, 11, 177–185. [Google Scholar] [CrossRef]
- León, B.; Vicente, C.P.; Tirado, J.L.; Biensan, P.; Tessier, C. Optimized Chemical Stability and Electrochemical Performance of LiFePO4 Composite Materials Obtained by ZnO Coating. J. Electrochem. Soc. 2008, 155, A211–A216. [Google Scholar]
- Liu, S.; Yin, H.; Bin, H.; He, J.; Wang, H. Characterization and Electrochemical Performance of ZnO Modified LiFePO4/C Cathode Materials for Lithium-ion Batteries. Chin. J. Struct. Chem. 2014, 33, 353–360. [Google Scholar]
- Zhang, X.L.; Ruan, Z.Q.; He, Q.T.; Hong, X.J.; Song, X.; Zheng, Q.F.; Nie, J.-H.; Cai, Y.P.; Wang, H. Three-Dimensional (3D) Nanostructured Skeleton Substrate Composed of Hollow Carbon Fiber/Carbon Nanosheet/ZnO for Stable Lithium Anode. ACS Appl. Mater. Interfaces 2021, 13, 3078–3088. [Google Scholar]
- Zeng, G.; Zhou, J.; Ren, S. Two-dimensional Nb2CTx nanosheets decorated LiFePO4/C as cathode material for lithium-ion batteries. J. Mater. Sci. 2023, 58, 5413–5426. [Google Scholar]
- Chen, X.; Li, Y.; Wang, J. Enhanced Electrochemical Performance of LiFePO4 Originating from the Synergistic Effect of ZnO and C Co-Modification. Nanomaterials 2021, 11, 12. [Google Scholar] [CrossRef]
- Yolun, A.; Altin, E.; Altundag, S.; Arshad, M.; Abbas, S.M.; Altin, S. Investigation of structural and electrochemical performance of Ru-substituted LiFePO4 cathode material: An improvement of the capacity and rate performance. J. Mater. Sci. Mater. Electron. 2022, 33, 6670–6680. [Google Scholar] [CrossRef]
- Sugiyama, J.; Nozaki, H.; Kamazawa, K.; Ofer, O.; Månsson, M.; Ansaldo, E.J.; Brewer, J.H.; Chow, K.H.; Watanabe, I.; Ikedo, Y.; et al. Magnetic and Diffusive Nature of LiFePO4. Phys. Procedia 2012, 30, 190–193. [Google Scholar] [CrossRef]
- Al Shibli, H.; Chaturvedi, P.; Kanagaraj, A.B.; Zaghari, P.; Choi, D.S.; Ryu, J.E. Sol-gel fabricated one-dimensional LiFePO4 microstructures for carbon nanotube-based nanocomposite freestanding sheet as cathode material for Li ion batteries. J. Compos. Mater. 2024, 58, 435–440. [Google Scholar] [CrossRef]
- Jarolimek, K.; Risko, C. Modification of the LiFePO4 (010) Surface Due to Exposure to Atmospheric Gases. ACS Appl. Mater. Interfaces 2021, 13, 29034–29040. [Google Scholar] [CrossRef]
- Zou, W.; Feng, X.; Wang, R.; Wei, W.; Luo, S.; Zheng, R.; Yang, D.; Mi, H.; Chen, H. High-efficiency core-shell magnetic heavy-metal absorbents derived from spent-LiFePO4 Battery. J. Hazard. Mater. 2021, 402, 123583. [Google Scholar] [PubMed]
- Hou, H.; Li, D.; Liu, X.; Yao, Y.; Dai, Z.; Yu, C. Recovery of Expired Lithium Carbonate Tablets for LiFePO4/C Cathode. Waste Biomass Valor 2020, 11, 3097–3105. [Google Scholar]
- Lv, Y.; Wang, L.X.; Lu, D.; Sun, J.; Sun, J.C. Synthesis of LiFePO4 by Co-Precipitation and Optimization of its Performance. Key Eng. Mater. 2012, 519, 132–136. [Google Scholar] [CrossRef]
- Hu, Q.; Liao, J.Y.; Zou, B.K.; Yu, M.F.; Tang, Z.F.; Wen, Z.Y.; Chen, C.H. Improving the rate and low-temperature performance of LiFePO4 by tailoring the form of carbon coating from amorphous to graphene-like. J. Solid State Electrochem. 2018, 22, 797–805. [Google Scholar]
- Liu, X.H.; Zhao, Z.W. Synthesis of LiFePO4/C doped with Mg2+ by reactive extrusion method. Adv. Powder Technol. 2014, 25, 1339–1344. [Google Scholar]
- Świder, J.; Świętosławski, M.; Molenda, M.; Dziembaj, R. A Novel Concept for the Synthesis of Nanometric LiFePO4 by Co-precipitation Method in an Anhydrous Environment. Procedia Eng. 2014, 98, 36–41. [Google Scholar] [CrossRef]
- Ji, Z.; Sun, Y.; Guan, X.; Zhou, Y.; Qian, J.; Chen, F. Revealing the superior rate performance and cycle stability of the La and F Co-doping LiFePO4/C. Vacuum 2024, 227, 113452. [Google Scholar]
- Cong, J.; Luo, S.-H.; Li, K.; Wang, Y.-F.; Yan, S.-X.; Li, P.-W.; Chen, H.-H. Lanthanum-doped LiFePO4 cathode materials for lithium ion battery by citric acid-assisted carbothermal reduction method using acid-washed iron red as raw material. Ionics 2024, 30, 749–757. [Google Scholar] [CrossRef]
- Li, R.; Fan, C.; Zhang, W.; Tan, M.; Zeng, T.; Han, S. Structure and performance of Na+ and Fe2+ co-doped Li1-xNaxMn0.8Fe0.2PO4/C nanocapsule synthesized by a simple solvothermal method for lithium ion batteries. Ceram. Int. 2019, 45, 10501–10510. [Google Scholar]
- Latif, C.; Muyasaroh, A.F.; Firdausi, A.; Mardiana, D.; Klysubun, W.; Saiyasombat, C.; Prihandoko, B.; Zainuri, M.; Pratapa, S. Preparation and characterisation of LiFePO4 ceramic powders via dissolution method. Ceram. Int. 2021, 47, 31877–31885. [Google Scholar] [CrossRef]
- Li, D.; Huang, Y.; Jia, D.; Guo, Z.; Bao, S.-J. Synthesis and electrochemical properties of nanosized carbon-coated Li1−3x La x FePO4 composites. J. Solid State Electrochem. 2010, 14, 889–895. [Google Scholar] [CrossRef]
- Cho, Y.D.; Fey GT, K.; Kao, H.M. Physical and electrochemical properties of La-doped LiFePO4/C composites as cathode materials for lithium-ion batteries. J. Solid State Electrochem. 2008, 12, 815–823. [Google Scholar]
- Luo, S.; Tian, Y.; Li, H.; Shi, K.; Tang, Z.; Zhang, Z. Influence of lanthanum doping on performance of LiFePO4 cathode materials for lithium-ion batteries. J. Rare Earths 2010, 28, 439–442. [Google Scholar]
- Guan, L.; Liu, M.; Yu, F.; Qiu, T.; Zhou, T.; Lin, X. A LiFePO4 regeneration method based on PVAc alcoholysis reaction. Renew. Energy 2021, 175, 559–567. [Google Scholar] [CrossRef]
- Shen, C.; Li, G.; Liu, L.; Li, P.; Xu, H.; Hu, H.; Wang, L. Facile fabrication of compact LiFePO4/C composite with excellent atomically-efficient for high-energy-density Li-ion batteries. J. Power Sources 2021, 496, 229759. [Google Scholar]
- Swierczynski, M.; Stroe, D.I.; Stan, A.I.; Teodorescu, R.; Kær, S.K. Lifetime estimation of the nanophosphate LiFePO4/c battery chemistry used in full electric vehicles. Ind. Appl. IEEE Trans. 2015, 51, 3453–3461. [Google Scholar]
- Lei, X.; Zhang, H.; Chen, Y.; Wang, W.; Ye, Y.; Zheng, C.; Deng, P.; Shi, Z. A three-dimensional LiFePO4/carbon nanotubes/graphene composite as a catalyst material for lithium ion batteries with super high rate performance. J. Alloys Compd. 2015, 626, 280–286. [Google Scholar]
- Ju, S.H.; Kang, Y.C. LiFePO4/C cathode powders prepared by spray pyrolysis from the colloidal spray solution containing nano-sized carbon black. Mater. Chem. Phys. 2008, 107, 328–333. [Google Scholar]
- Altin, S.; Yolun, A. Fabrication and electrochemical performance of Ho-substituted C/LiFePO4: Improved battery performance. J. Mater. Sci. Mater. Electron. 2021, 32, 21568–21578. [Google Scholar]
- Chen, C.; Liu, G.B.; Wang, Y.; Li, J.L.; Liu, H. Preparation and electrical properties of LiFePO4/C nanocomposite using FePO4·2H2O nanoparticles by introduction of Fe3(PO4) 2·8H2O at low cost. Electrochem. Acta 2013, 113, 464–469. [Google Scholar]
- Liao, X.Z.; He, Y.S.; Ma, Z.F.; Zhang, X.M.; Wang, L. Effects of fluorine-substitution on the electrochemical behavior of LiFePO4/C cathode materials. J. Power Sources 2007, 174, 720–725. [Google Scholar]
- Kim, J.W.; Cheruvally, G.; Ahn, J.H.; Ahn, H.J. Electrical properties of LiFePO4/C composite catalyst material: Carbon coating by the precursor method and direct addition. J. Phys. Chem. Solids 2008, 69, 1257–1260. [Google Scholar]
- Xu, Z.; Xu, L.; Lai, Q.; Ji, X. Microemulsion synthesis of LiFePO4/C and its electrochemical properties as cathode materials for lithium-ion cells. Mater. Chem. Phys. 2007, 105, 80–85. [Google Scholar]
- Guan, C.; Huang, H. Complexing agents on carbon content and lithium storage capacity of LiFePO4/C cathode synthesized via sol-gel approach. Adv. Mater. Sci. Eng. 2016, 2016, 7213916. [Google Scholar]
- Jugović, D.; Mitrić, M.; Cvjetićanin, N.; Jančar, B.; Mentus, S.; Uskoković, D. Synthesis and characterization of LiFePO4/C composite obtained by sonochemical method. Solid State Ion. 2008, 179, 415–419. [Google Scholar]
- Wang, X.; Cheng, K.; Zhang, J.; Yu, L.; Yang, J. Effect of carbon content and calibration temperature on the electrical performance of lithium iron phosphate/carbon composites as catalyst materials for lithium ion batteries. Adv. Powder Technol. 2013, 24, 593–598. [Google Scholar]
- Huang, H.; Hu, W.; Zhang, G.; Zhang, F.; Ding, S. Theoretical study of the electronic structure and crystal morphology of LiFePO4 as cathode material for lithium battery. J. At. Mol. Phys. 2015, 32, 870–874. [Google Scholar]
- Chen, M.; Liu, F.-M.; Chen, S.-S.; Zhao, Y.-J.; Sun, Y.; Li, C.-S.; Yuan, Z.-Y.; Qian, X.; Wan, R. In situ self-catalyzed formation of carbon nanotube wrapped and amorphous nanocarbon shell coated LiFePO4 microclew for high-power lithium ion batteries. Carbon 2023, 203, 661–670. [Google Scholar] [CrossRef]
- Kacher, J.; Landon, C.; Adams, B.L.; Fullwood, D. Bragg’s Law diffraction simulations for electron backscatter diffraction analysis. Ultramicroscopy 2009, 109, 1148–1156. [Google Scholar] [PubMed]
- Hu, J.; Zeng, H.; Chen, X.; Wang, Z.; Wang, H.; Wang, R.; Wu, L.; Huang, Q.; Kong, L.; Zheng, J.; et al. Revealing Insights into LixFePO4 Nanocrystals with Magnetic Order at Room Temperature Resulting in Trapping of Li Ions. J. Phys. Chem. Lett. 2019, 10, 4794–4799. [Google Scholar]
- Salah, A.A.; Jozwiak, P.; Garbarczyk, J.; Benkhouja, K.; Zaghib, K.; Gendron, F.; Julien, C. Local structure and redox energies of lithium phosphates with olivine- and Nasicon-like structures. J. Power Sources 2005, 140, 370–375. [Google Scholar] [CrossRef]
- Burba, C.M. Roger frech Raman and FTIR Spectroscopic Study of LixFePO4 (0<x<1). J. Electrochem. Soc. 2004, 151, 1032–1038. [Google Scholar]
- Salah, A.A.; Jozwiak, P.; Zaghib, K.; Garbarczyk, J.; Gendron, F.; Mauger, A.; Julien, C. FTIR features of lithium-iron phosphates as electrode materials for rechargeable lithium batteries. Spectrochim. Acta Part A Mol. Biomol. Spectrosc. 2006, 65, 1007–1013. [Google Scholar] [CrossRef]
- Salah, A.A.; Mauger, A.; Julien, C.M.; Gendron, F. Nano sized imprity phases in relation to the mode of preparation of LiFePO4. Mater. Sci. Eng. B Solid State Mater. Adv. Technol. 2006, 129, 232–244. [Google Scholar]
- Nageswara Rao, B.; Kiran, J.N.; Satyanarayana, N. Structural and Morphological Studies of Two-Step Synthesized LiCoO2 and Microwave Synthesized LiFePO4 Particles. T. Indian. Ceram. Soc. 2023, 82, 202–208. [Google Scholar] [CrossRef]
- Tang, D.; Ji, G.; Wang, J.; Liang, Z.; Chen, W.; Ji, H.; Ma, J.; Liu, S.; Zhuang, Z.; Zhou, G. A multifunctional amino acid enables direct recycling of spent LiFePO4 cathode material. Adv. Mater. 2024, 36, 2309722. [Google Scholar] [CrossRef]
- Halim, A.; Setyawan, H.; Machmudah, S.; Nurtono, T.; Winardi, S. Effect of Fuel Rate and Annealing Process of LiFePO4 Cathode Material for Li-ion Batteries synthesized by Flame Spray Pyrolysis Method. AIP Conf. Proc. 2014, 1586, 173–178. [Google Scholar]
- Shi, M.; Li, R.; Liu, Y. In situ preparation of LiFePO4/C with unique copolymer carbon resource for superior performance lithium-ion batteries. J. Alloys Compd. 2021, 854, 157162. [Google Scholar]
- ASarmadi; Masoudpanah, S.M.; Alamolhoda, S. L-Lysine-assisted solvothermal synthesis of hollow-like structure LiFePO4/C powders as cathode materials for Li-ion batteries. J. Mater. Res. Technol. 2021, 15, 5405–5413. [Google Scholar]
- Tang, H.; Tan, L.; Xu, J. Synthesis and characterization of LiFePO4 coating with aluminum doped zinc oxide. Trans. Nonferrous Met. Soc. China 2013, 23, 451–455. [Google Scholar] [CrossRef]
- Zhuang, Y.; Zhang, W.; Bao, Y.; Guan, M. Influence of the LiFePO4/C coating on the electrochemical performance of Nickel-rich cathode for lithium-ion batteries. J. Alloys Compd. 2022, 898, 162848. [Google Scholar]
- Zhang, L.; Zhang, Z.; Song, Y.; Wang, L.; Wang, H.; Fang, H.; Gao, H.; Yang, C.; Zhang, A.; Jia, X. In situ confined synthesis of LiFePO4/Ti3C2@C composites with high-rate and low-temperature long cycling performance. Ionics 2023, 29, 33–41. [Google Scholar]
- Böckenfeld, N.; Placke, T.; Winter, M.; Passerini, S.; Balducci, A. The influence of activated carbon on the performance of lithium iron phosphate based electrodes. Electrochim. Acta 2012, 76, 130–136. [Google Scholar] [CrossRef]
- Avci, E. Enhanced catalyst performance of nano sized lithium iron phosphate composite using polytetrafluoroethylene as carbon precursor. J. Power Sources 2014, 270, 142–150. [Google Scholar]
- Liu, H.; Zhang, P.; Li, G.C.; Wu, Q.; Wu, Y.P. LiFePO4/C composites from carbothermal reduction method. J. Solid State Electrochem. 2008, 12, 1011–1015. [Google Scholar]
- Li, Y.; Wang, L.; Liang, F.; Yao, Y.; Zhang, K. Enhancing high rate performance and cyclability of LiFePO4 cathode materials for lithium ion batteries by boron doping. J. Alloys Compd. 2021, 880, 160560. [Google Scholar]
- Selmi, A.; Sahbani, S.K.; Said, K.; Akriche, S.; Salem, R.B.; Kouass, S. Sol-gel synthesis of LiSICON compound and their studies by X-ray powder diffraction, infrared, magnetic and impedance spectroscopy. J. Mol. Struct. 2023, 1294, 136374. [Google Scholar] [CrossRef]
- Chen, M.; Shao, L.L.; Yang, H.B.; Zhao, Q.Y.; Yuan, Z.Y. Organophosphonic acid as precursor to prepare LiFePO4/carbon nanocomposites for high-power lithium ion batteries. Electrochim. Acta 2015, 168, 59–68. [Google Scholar]
- Lin, Y.; Wu, J.; Huang, X.; Cao, Y.; Guo, R. Effect of synthesis temperature on the structure and electrochemical performances of LiFePO4/C. Ionics 2019, 25, 5697–5707. [Google Scholar]
- Shang, W.; Kong, L.; Ji, X. Synthesis, characterization and electrochemical performances of LiFePO4/graphene cathode material for high power lithium-ion batteries. Solid State Sci. 2014, 38, 79–84. [Google Scholar]
- Karami, M.; Masoudpanah, S.M.; Rezaie, H.R. Solution combustion synthesis of hierarchical porous LiFePO4 powders as cathode materials for lithium-ion batteries. Adv. Powder Technol. 2021, 32, 1935–1942. [Google Scholar]
- Kumar, S.; Chand, P.; Kumar, A.; Anand, H. Effect of different aqueous electrolytes on electrochemical behavior of LiFePO4 as a cathode material: Lithium ion battery and renewable energy nexus. Energy Nexus 2021, 1, 100005. [Google Scholar] [CrossRef]
- Lu, J.; Tang, Z.; Zhang, Z.; Shen, W. Preparation of LiFePO4 with inverse opal structure and its satisfactory electrochemical properties. Mater. Res. Bull. 2005, 40, 2039–2046. [Google Scholar] [CrossRef]
- Zaghib, K.; Mauger, A.; Gendron, F.; Julien, C.M. Surface effects on the physical and electrochemical properties of thin LiFePO4 particles. Chem. Mater. 2008, 20, 462–469. [Google Scholar] [CrossRef]
- Koleva, V.; Zhecheva, E.; Stoyanova, R. A new phosphate-formate precursor method for the preparation of carbon coated nano-crystalline LiFePO4. J. Alloy. Compd. 2009, 476, 950–957. [Google Scholar] [CrossRef]
- Zhou, J.; Zhang, D.; Sun, G.; Chang, C. B-axis oriented alignment of LiFePO4 monocrystalline platelets by magnetic orientation for a high-performance lithium-ion battery. Solid State Ion. 2019, 338, 96–102. [Google Scholar] [CrossRef]
- Prince, A.; Mylswamy, S.; Chan, T.; Liu, R.; Hannoyer, B.; Jean, M.; Shen, C.; Huang, S.; Lee, J.; Wang, G. Investigation of Fe valence in LiFePO4 by Mössbauer and XANES spectroscopic techniques. Solid State Commun. 2004, 132, 455–458. [Google Scholar] [CrossRef]
- Baster, D.; Zheng, K.; Zając, W.; Świerczek, K.; Molenda, J. Toward elucidation of delithiation mechanism of zinc-substituted LiFePO4. Electrochim. Acta 2013, 92, 79–86. [Google Scholar] [CrossRef]
- Bazzi, K.; Mandal, B.; Nazri, M.; Naik, V.; Garg, V.; Oliveira, A.; Vaishnava, P.; Nazri, G.; Naik, R. Effect of surfactants on the electrochemical behavior of LiFePO4 cathode material for lithium ion batteries. J. Power Sources 2014, 265, 67–74. [Google Scholar] [CrossRef]


| Samples | Carbon Source | Average Lattice Constants | ||
|---|---|---|---|---|
| a-Axis (Å) | b-Axis (Å) | c-Axis (Å) | ||
| PDF#83-2092 | 10.3340 | 6.0100 | 4.6930 | |
| 1 | Ethylene glycol | 10.2769 | 5.9870 | 4.6842 |
| 2 | PEG4000 | 10.2509 | 5.9877 | 4.6700 |
| 3 | PVA-124 | 10.2784 | 5.9599 | 4.6906 |
| 4 | Citric acid | 10.2646 | 5.9844 | 4.6863 |
| 5 | Glucose | 10.0212 | 5.8209 | 4.7350 |
| (x, y) | Lattice Parameters | Crystallite Size (Å) | |||
|---|---|---|---|---|---|
| a (Å) | b (Å) | c (Å) | Vol (Å3) | ||
| (1.00, 0.00) | 10.34119 | 6.00442 | 4.70433 | 292.10 | 493 |
| (0.98, 0.02) | 10.33708 | 6.00860 | 4.69580 | 292.21 | 678 |
| (0.96, 0.04) | 10.34229 | 6.01088 | 4.69574 | 292.52 | 668 |
| (0.94, 0.06) | 10.34652 | 6.01306 | 4.71540 | 293.36 | 488 |
| (0.92, 0.08) | 10.37129 | 6.01088 | 4.69703 | 292.82 | 407 |
| (0.90, 0.10) | 10.35730 | 6.02266 | 4.70102 | 293.24 | 497 |
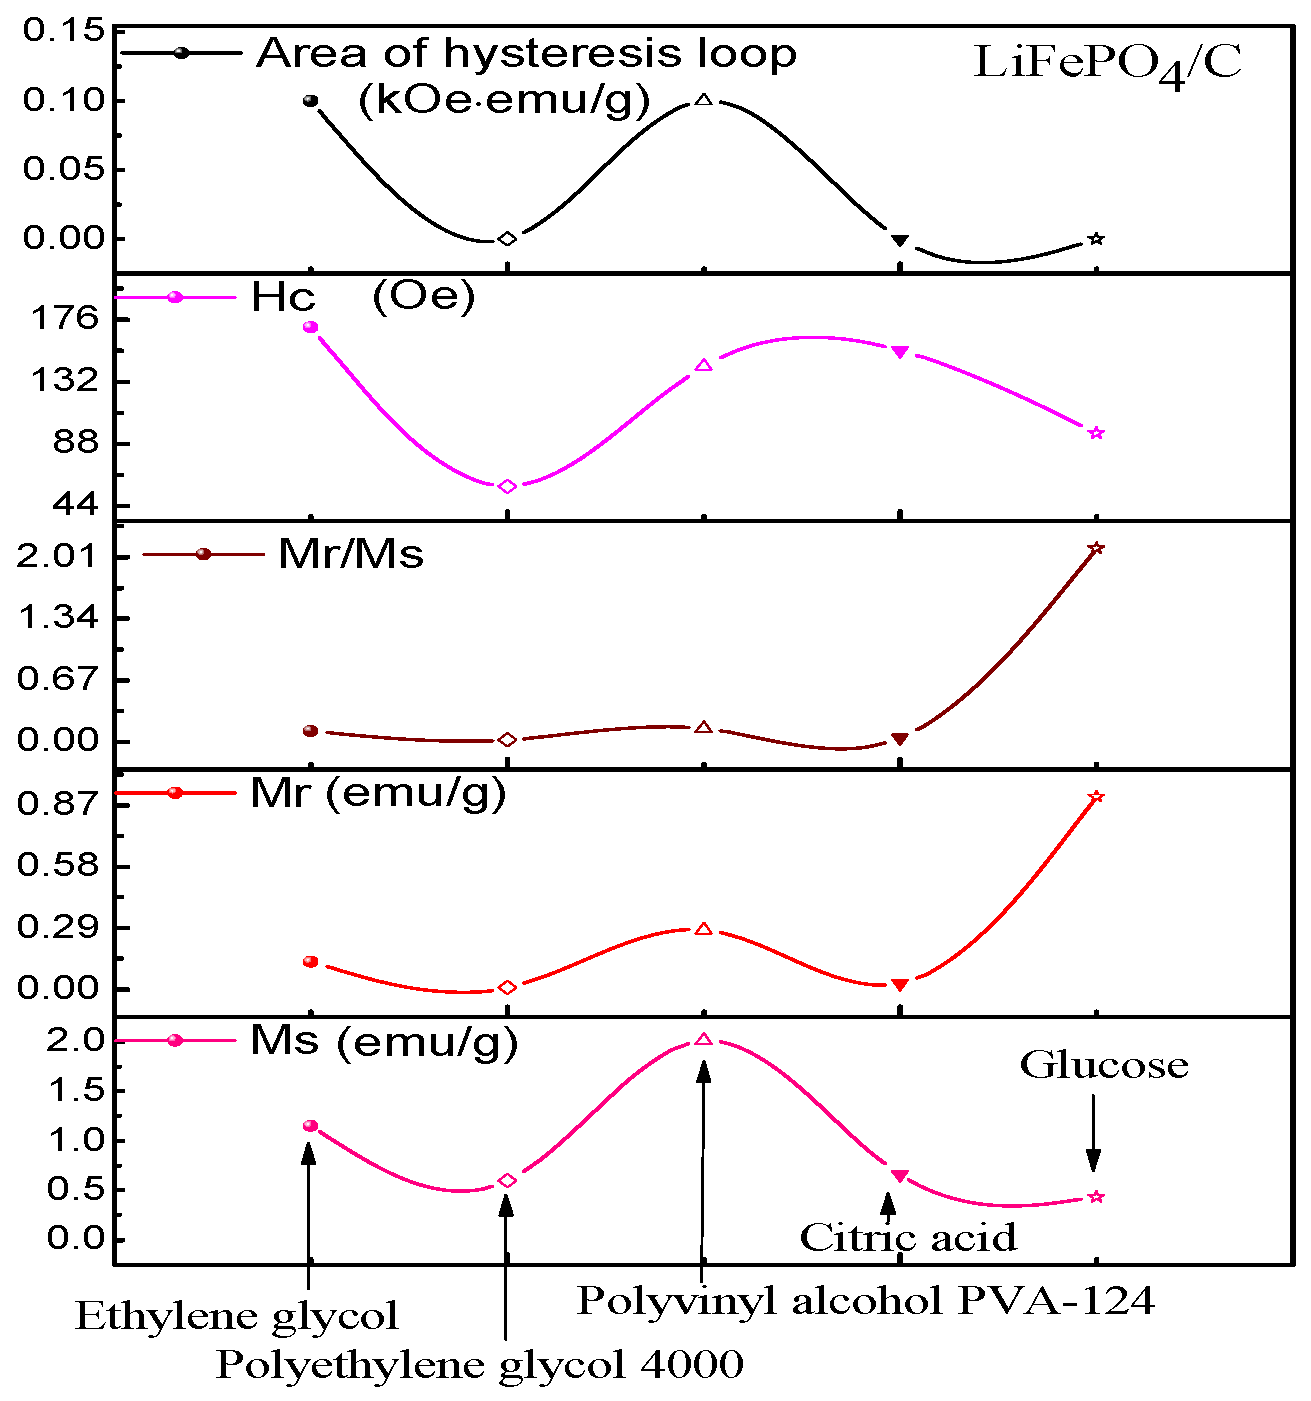
| Samples | 1 | 2 | 3 | 4 | 5 |
|---|---|---|---|---|---|
| Carbon source | Ethylene glycol | PEG4000 | PVA-124 | Citric acid | Glucose |
| Ms (emu/g) | 1.15 | 0.60 | 2.01 | 0.66 | 0.43 |
| Mr (emu/g) | 0.13 | 0.01 | 0.28 | 0.03 | 0.91 |
| Mr/Ms | 0.115 | 0.023 | 0.140 | 0.041 | 2.107 |
| Hc (Oe) | 170.67 | 58.03 | 142.68 | 154.15 | 95.70 |
| Area of hysteresis (kOe·emu/g) | 0.1 | 0.0 | 0.1 | 0.0 | 0.0 |
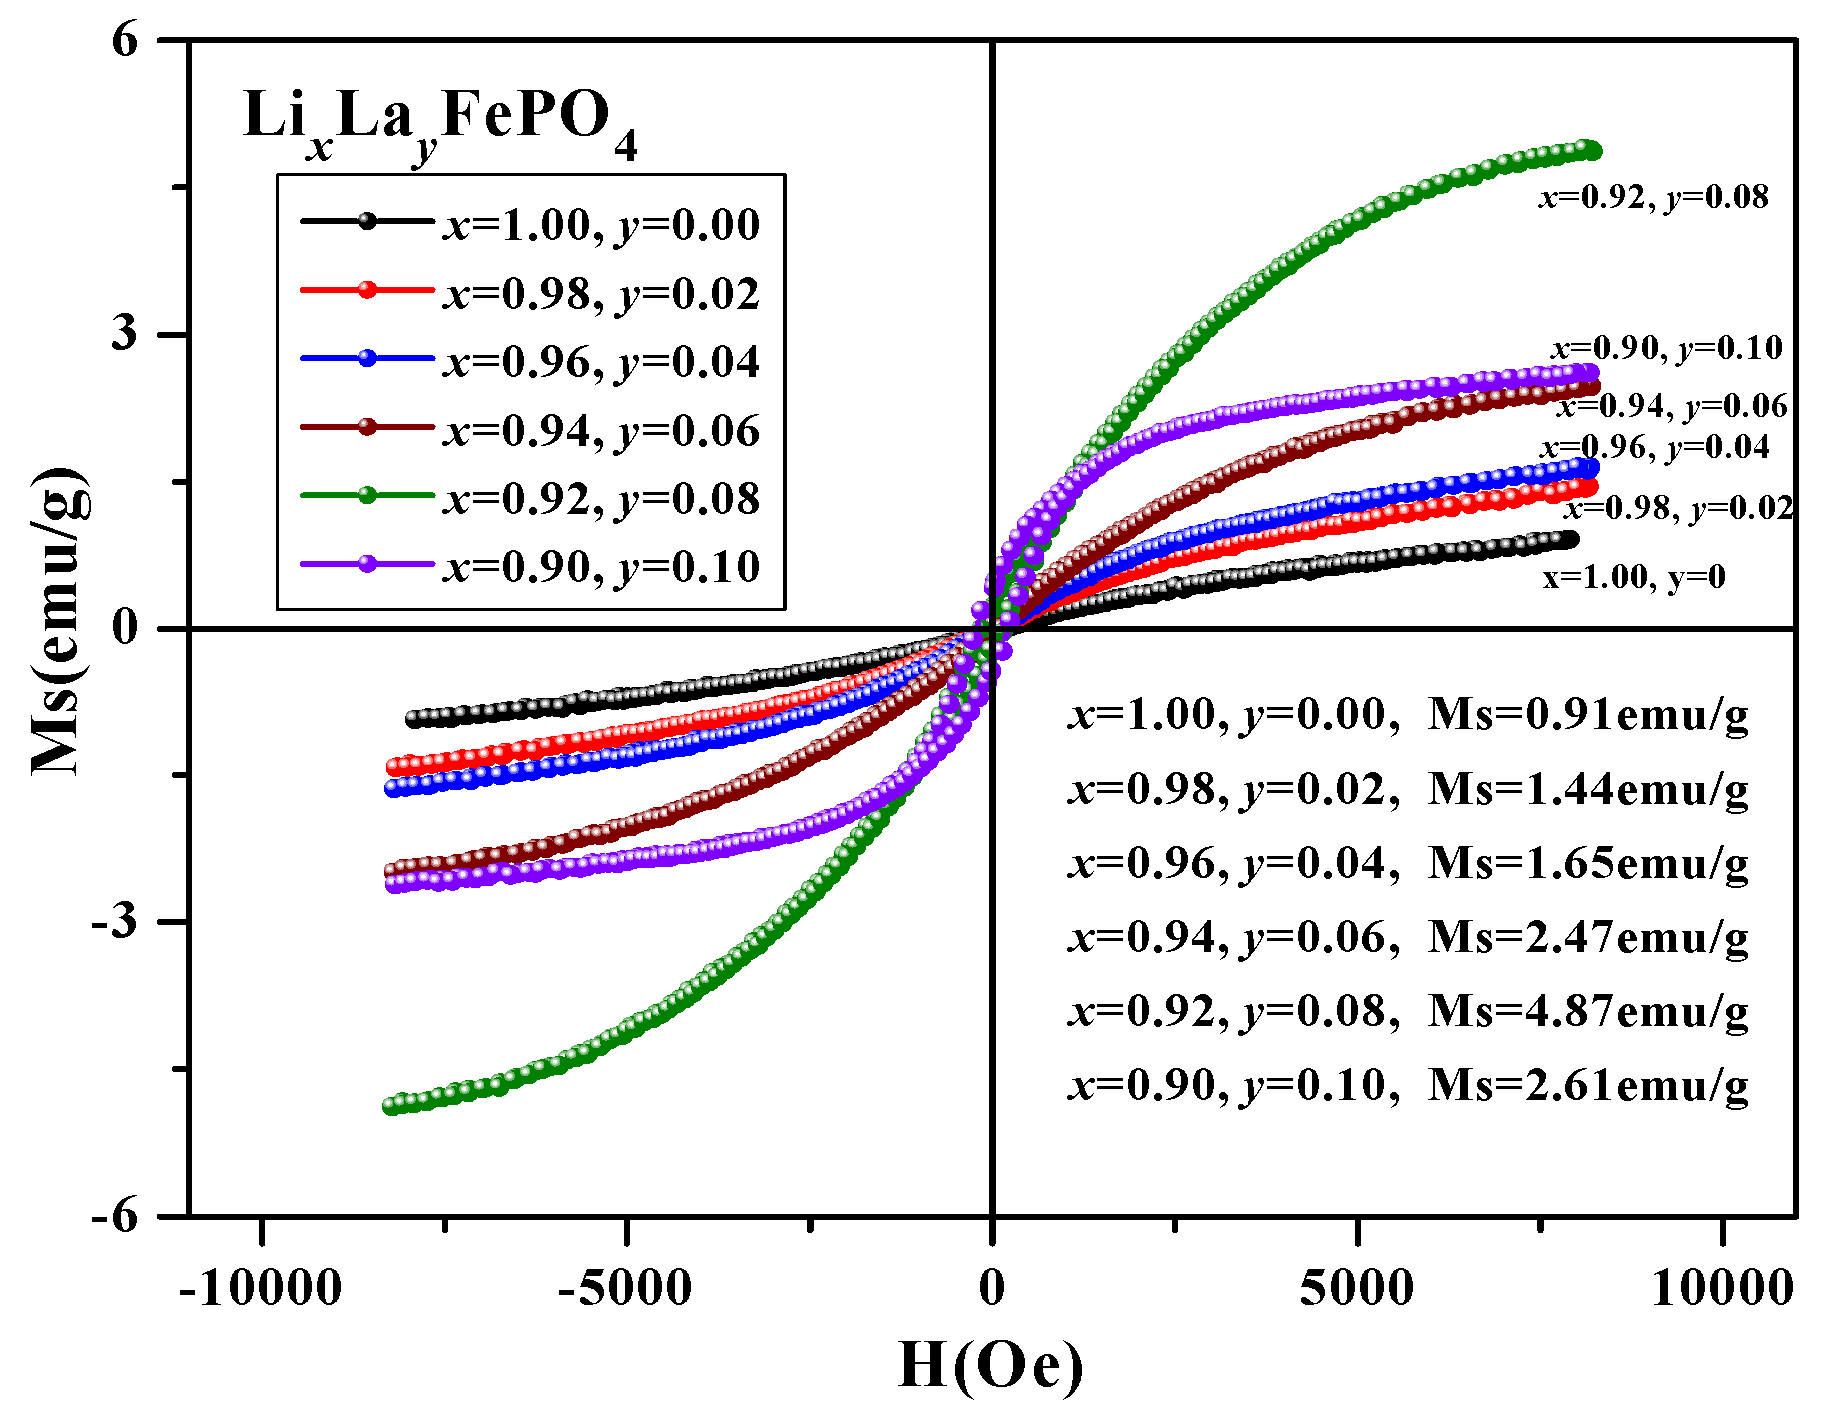
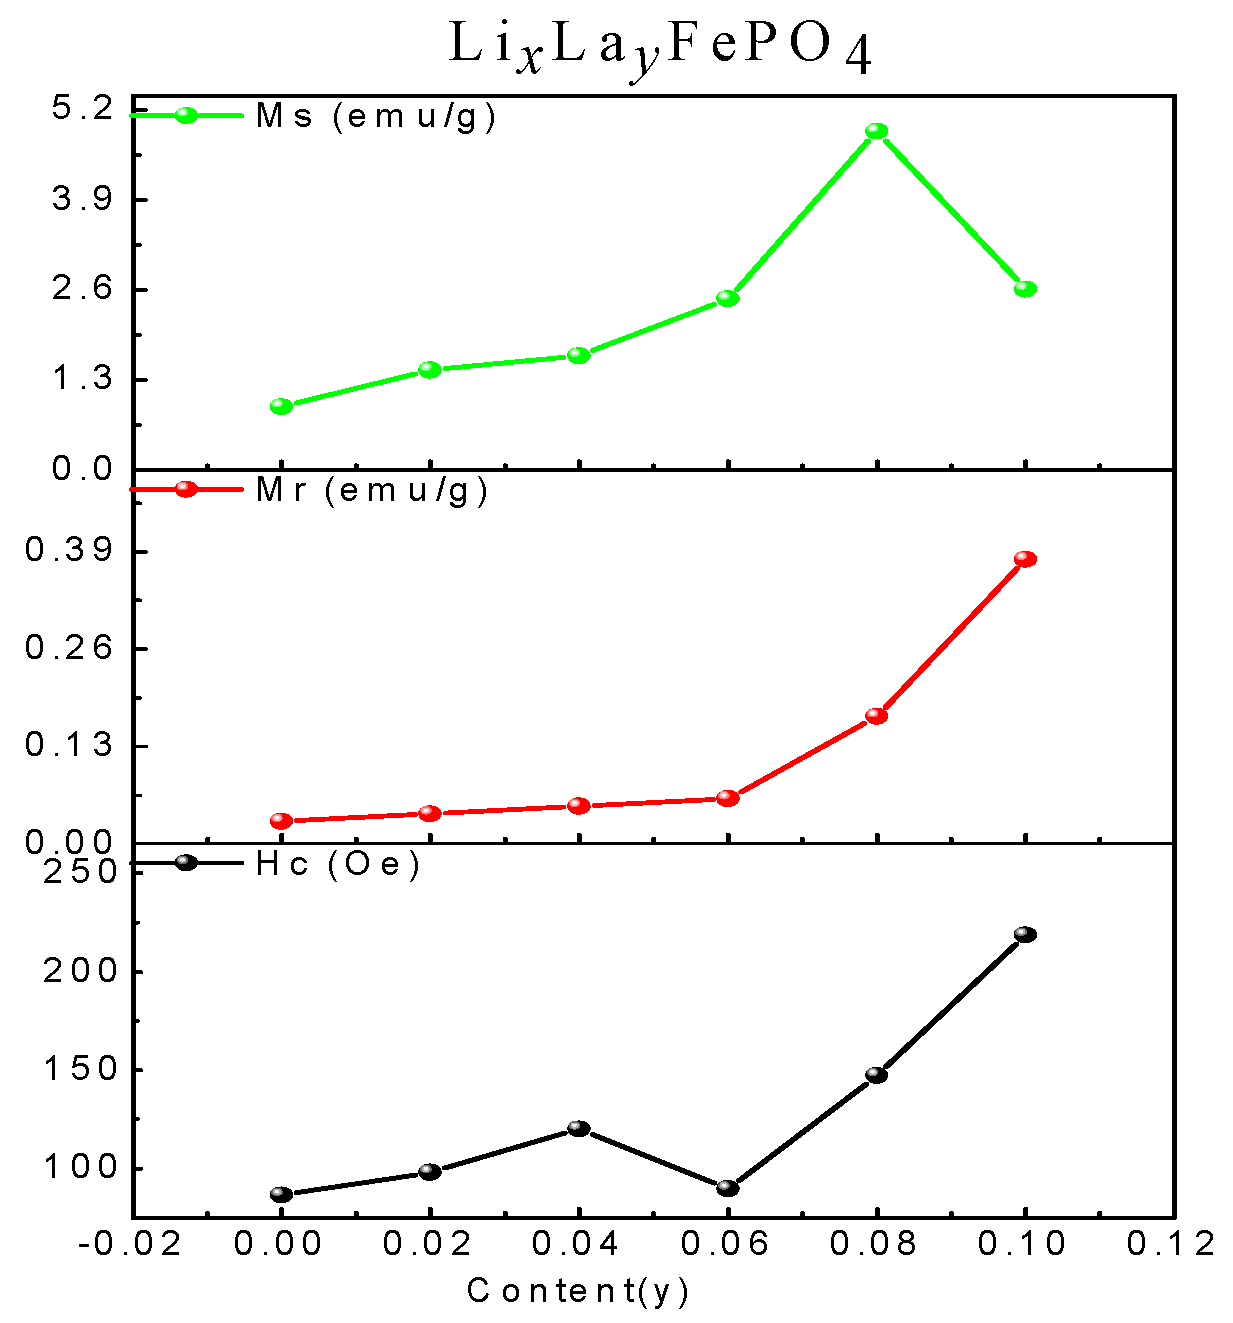
| (x, y) | (1.00, 0) | (0.98, 0.02) | (0.96, 0.04) | (0.94, 0.06) | (0.92, 0.08) | (0.90, 0.10) |
|---|---|---|---|---|---|---|
| Ms (emu/g) | 0.91 | 1.44 | 1.65 | 2.47 | 4.89 | 2.61 |
| Mr (emu/g) | 0.03 | 0.04 | 0.05 | 0.06 | 0.17 | 0.38 |
| Hc (Oe) | 86.55 | 98.10 | 120.15 | 89.68 | 147.39 | 218.59 |
| T (°C) | Ms (emu/g) | Mr (emu/g) | Hc (Oe) |
|---|---|---|---|
| 600 | 2.69 | 0.17 | 185.24 |
| 700 | 4.89 | 0.17 | 147.39 |
| 800 | 7.26 | 0.08 | 58.21 |
| (x, y) | Component | IS (mm/s) | QS (mm/s) | LW (mm/s) | A (%) |
|---|---|---|---|---|---|
| (1.00, 0.00) | Doublet(1) | 1.218 | 2.951 | 0.285 | 85.5 |
| Doublet(2) | 0.452 | 0.717 | 0.832 | 14.5 | |
| (0.96, 0.04) | Doublet(1) | 1.220 | 2.956 | 0.297 | 89.9 |
| Doublet(2) | 0.503 | 0.650 | 0.255 | 10.1 | |
| (0.92, 0.08) | Doublet(1) | 1.224 | 2.956 | 0.282 | 96.0 |
| Doublet(2) | 0.605 | 0.719 | 0.109 | 4.0 |
Disclaimer/Publisher’s Note: The statements, opinions and data contained in all publications are solely those of the individual author(s) and contributor(s) and not of MDPI and/or the editor(s). MDPI and/or the editor(s) disclaim responsibility for any injury to people or property resulting from any ideas, methods, instructions or products referred to in the content. |
© 2024 by the authors. Licensee MDPI, Basel, Switzerland. This article is an open access article distributed under the terms and conditions of the Creative Commons Attribution (CC BY) license (https://creativecommons.org/licenses/by/4.0/).
Share and Cite
Lin, Q.; Su, K.; Huang, Y.; He, Y.; Zhang, J.; Yang, X.; Xu, H. Molecular Crystal Structure Simulations and Structure-Magnetic Properties of LiFePO4 Composite Particles Optimized by La. Molecules 2024, 29, 3933. https://doi.org/10.3390/molecules29163933
Lin Q, Su K, Huang Y, He Y, Zhang J, Yang X, Xu H. Molecular Crystal Structure Simulations and Structure-Magnetic Properties of LiFePO4 Composite Particles Optimized by La. Molecules. 2024; 29(16):3933. https://doi.org/10.3390/molecules29163933
Chicago/Turabian StyleLin, Qing, Kaimin Su, Yajun Huang, Yun He, Jianbiao Zhang, Xingxing Yang, and Huiren Xu. 2024. "Molecular Crystal Structure Simulations and Structure-Magnetic Properties of LiFePO4 Composite Particles Optimized by La" Molecules 29, no. 16: 3933. https://doi.org/10.3390/molecules29163933
APA StyleLin, Q., Su, K., Huang, Y., He, Y., Zhang, J., Yang, X., & Xu, H. (2024). Molecular Crystal Structure Simulations and Structure-Magnetic Properties of LiFePO4 Composite Particles Optimized by La. Molecules, 29(16), 3933. https://doi.org/10.3390/molecules29163933