
A Spectral Detection Method Based on Integrated and Partition Modeling for Trace Copper in High-Concentration Zinc Solution

Abstract
1. Introduction
2. Theory
2.1. Interval Partition Wavelength Selection
- (1)
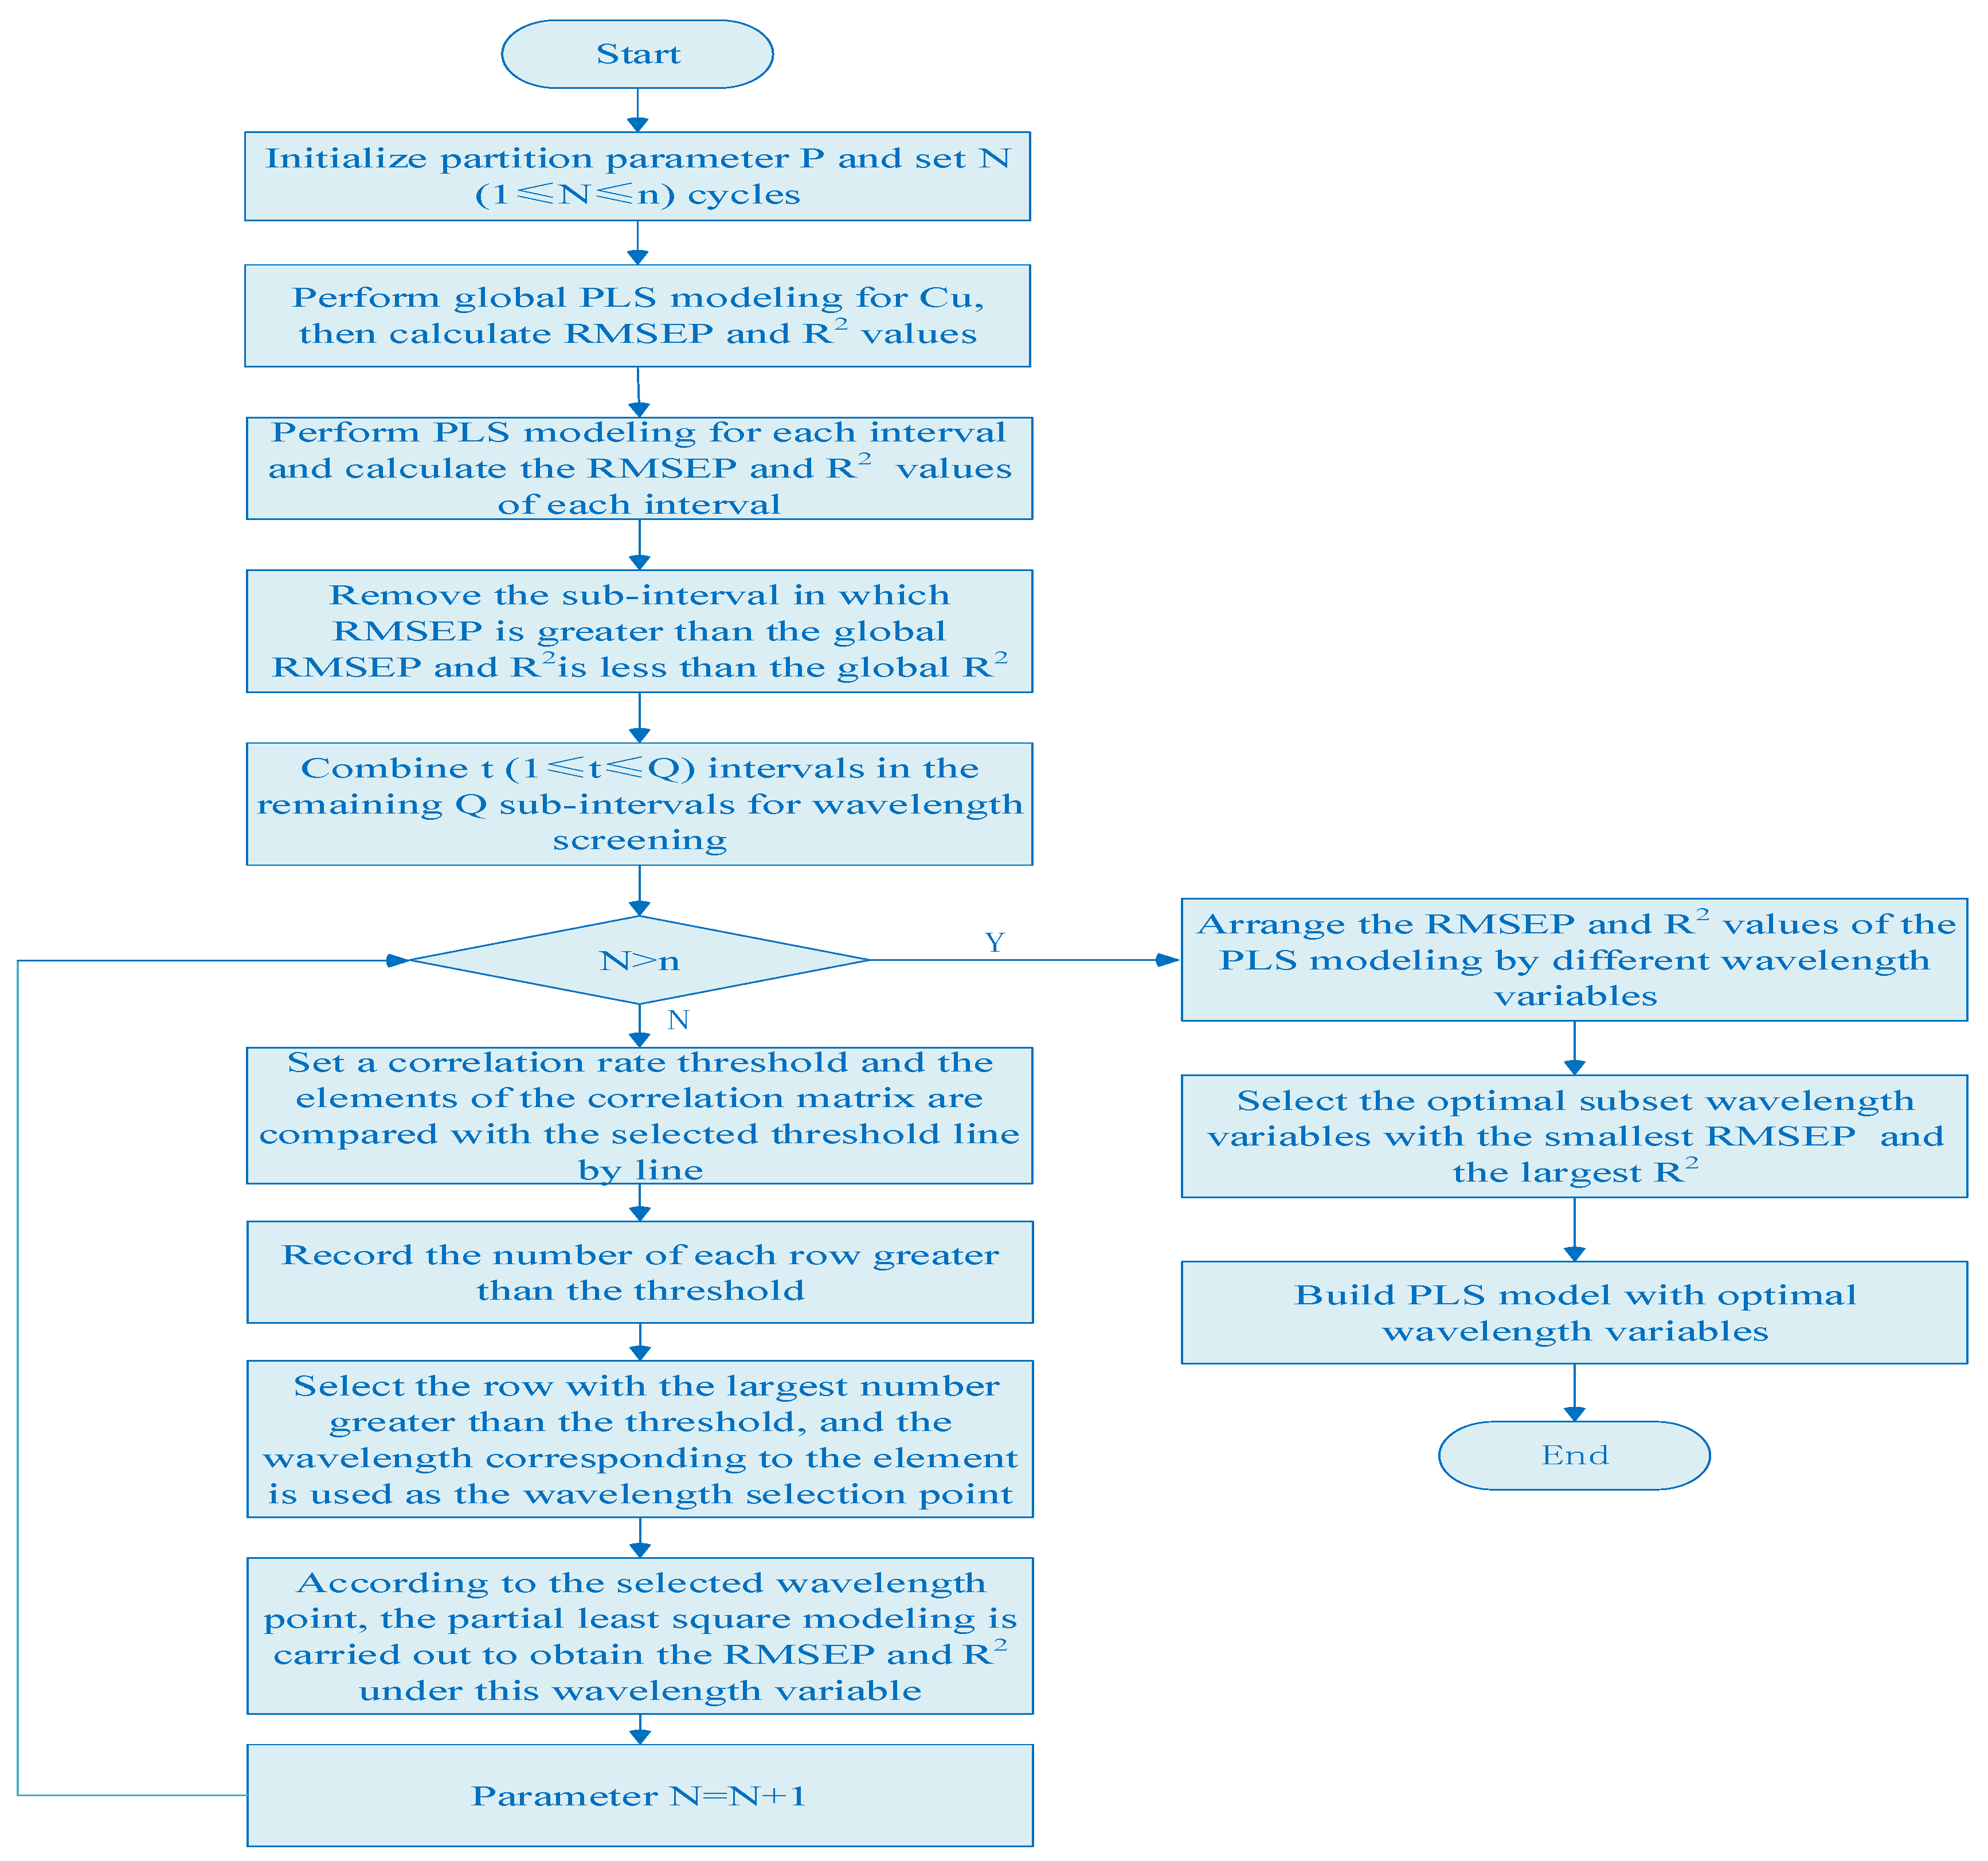
- The global PLS model of copper is established in the full spectral range, and the RMSEP and R2 values of copper are calculated according to Formulas (2) and (3) as thresholds for interval screening.
- (2)
- The whole spectra is divided into P subintervals with equal width, the local PLS model of copper is established in each subinterval, and the RMSEP and R2 values of copper in P subintervals are calculated.
- (3)
- The RMSEP and R2 values of the full spectral model and each local model are compared, the wavelength interval in which RMSEP is greater than the global RMSEP and R2 is less than the global R2 is removed, and the remaining Q subintervals with smaller RMSEP and larger R2 values are taken out.
- (4)
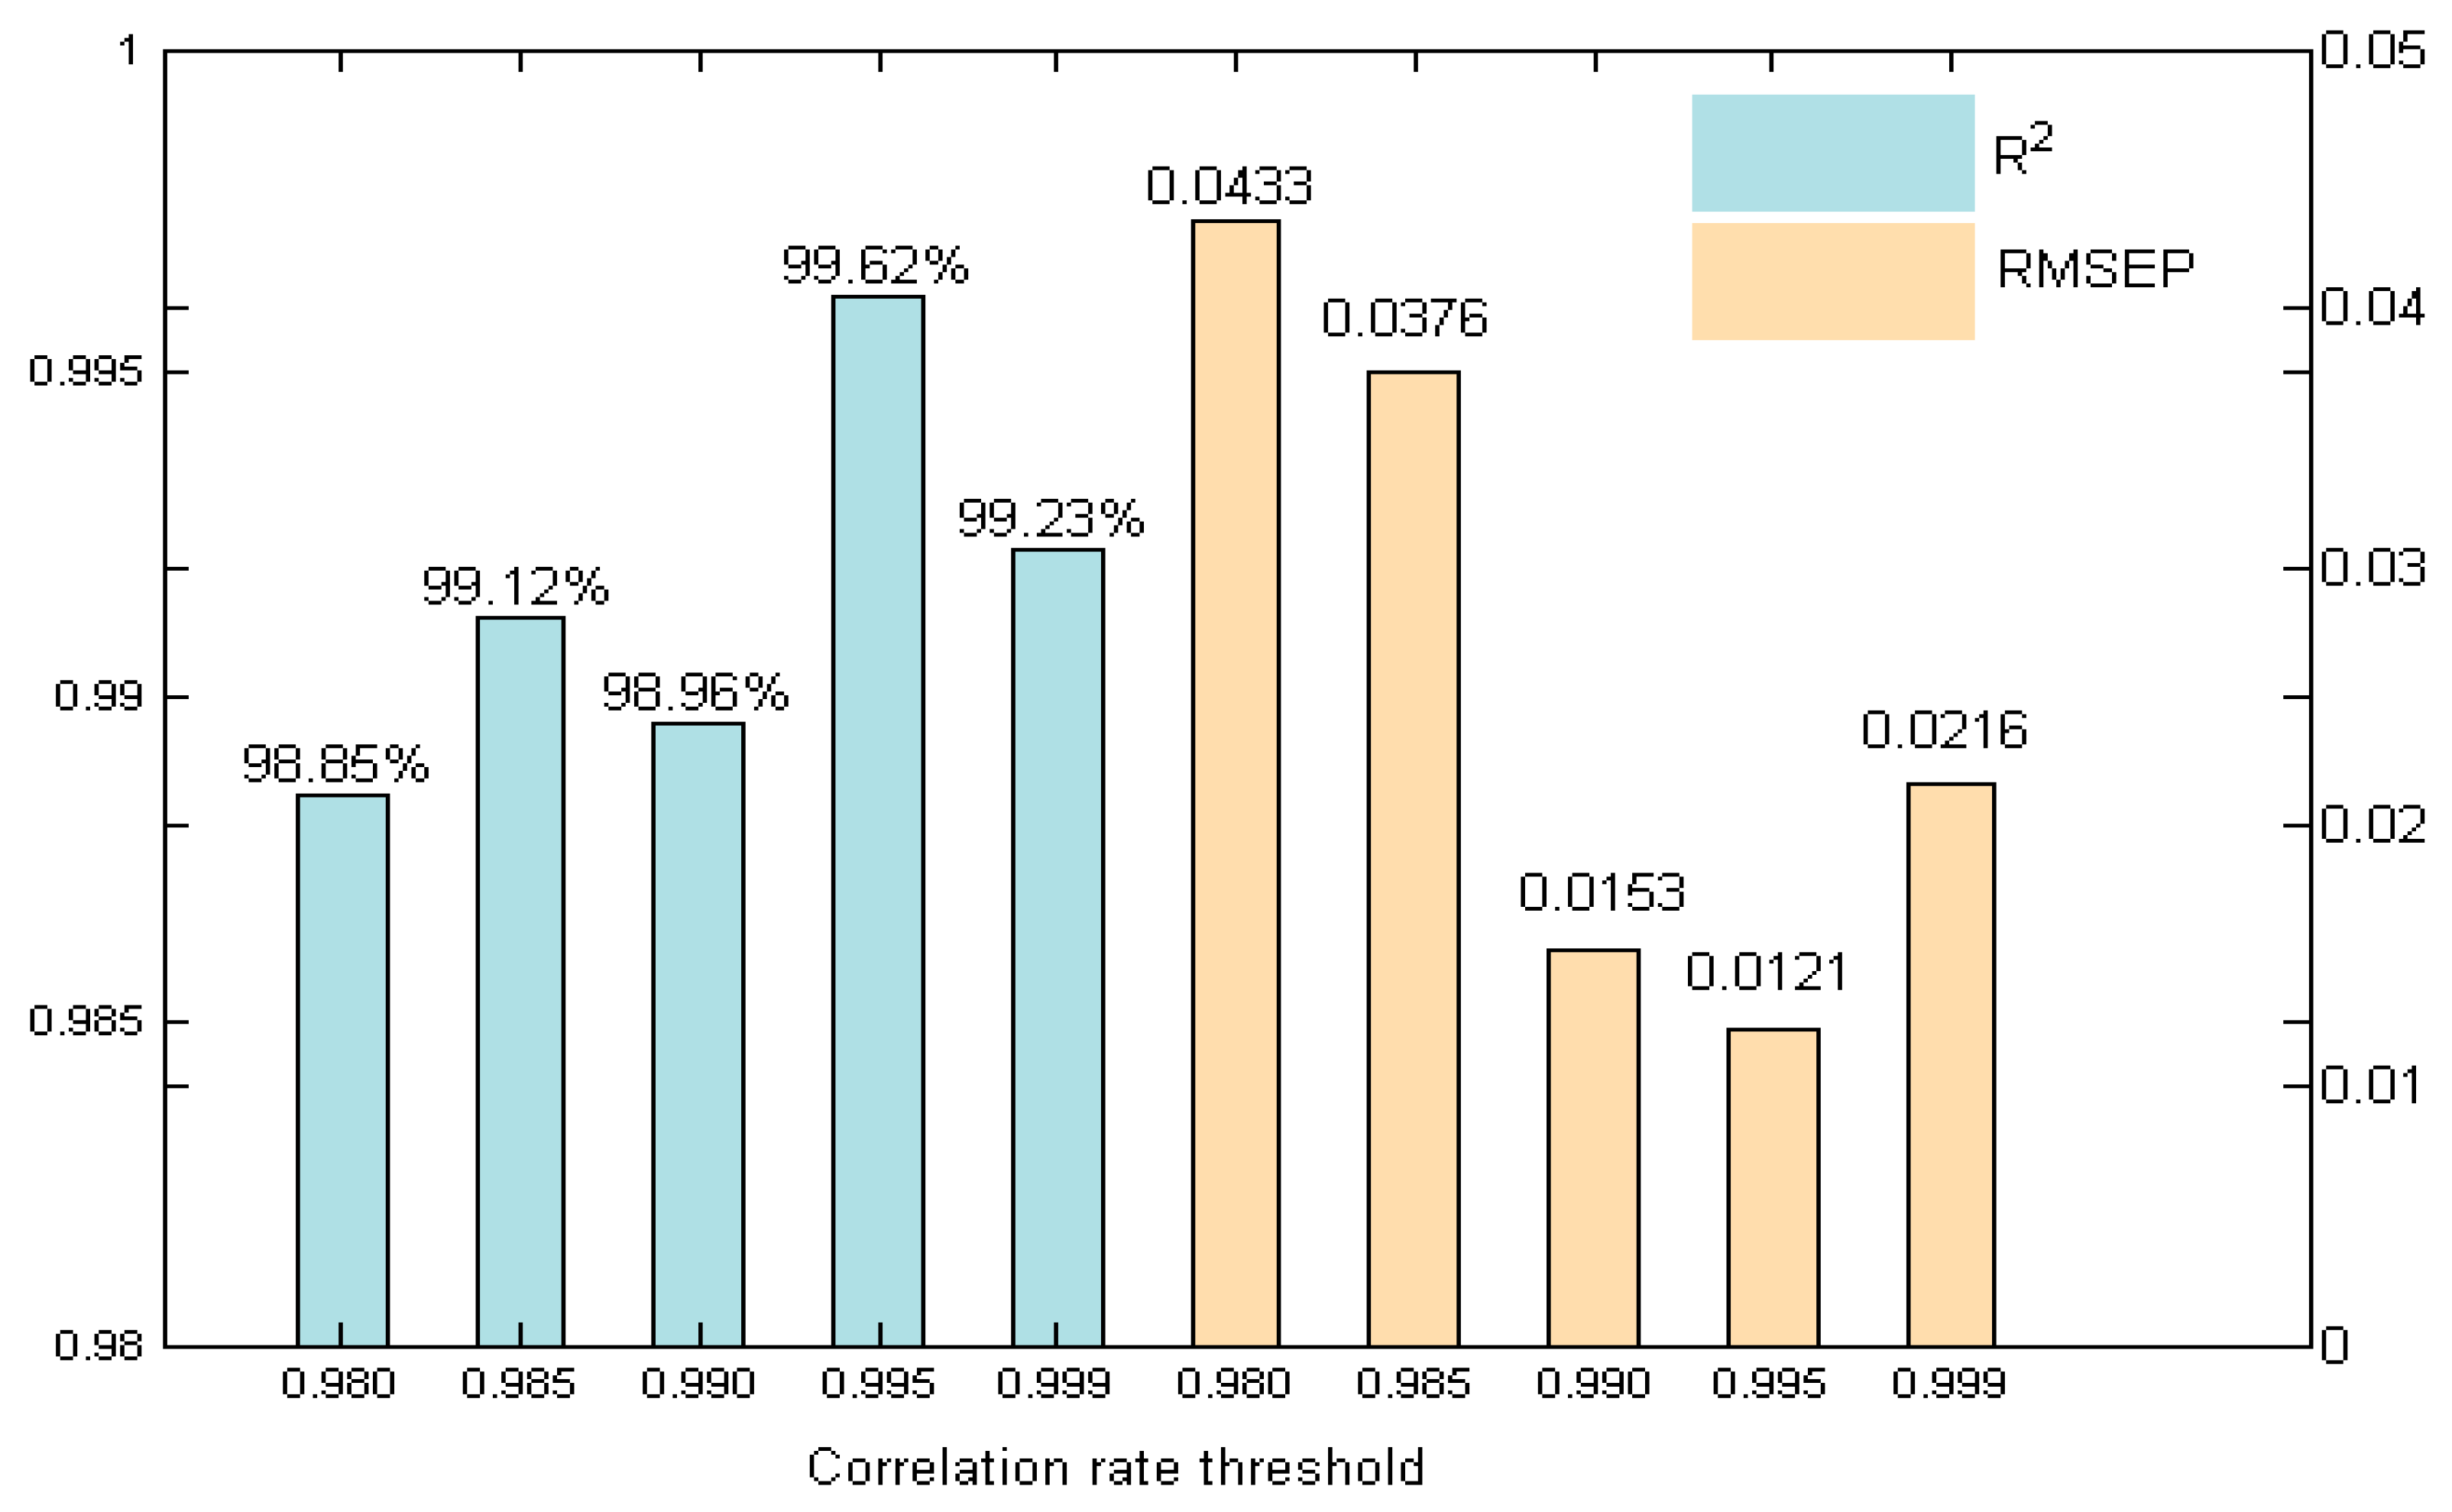
- N () cycles are set and a correlation-rate threshold is set for each cycle. The elements of the correlation matrix are compared with the selected threshold line by line.
- (5)
- The number of each row greater than the threshold is recorded, and the row with the largest number greater than the threshold is selected. The wavelength corresponding to the element in this row that is greater than the correlation-rate threshold is used as the wavelength selection point.
- (6)
- According to the selected wavelength point, partial least squares modeling is carried out to obtain the RMSEP and R2 under this wavelength variable, and the next cycle is carried out.
- (7)
- When the cycle is over, the modes established by different wavelength variables are compared, and the subset with the smallest RMSEP value and the largest R2 is the optimal subset. The variable filtering process is then complete. The algorithm flow chart is shown in Figure 1.
2.2. PLS Integrated Modeling Based on Adaboost Algorithm
- (1)
- The weight distribution of training data is initialized:
- (2)
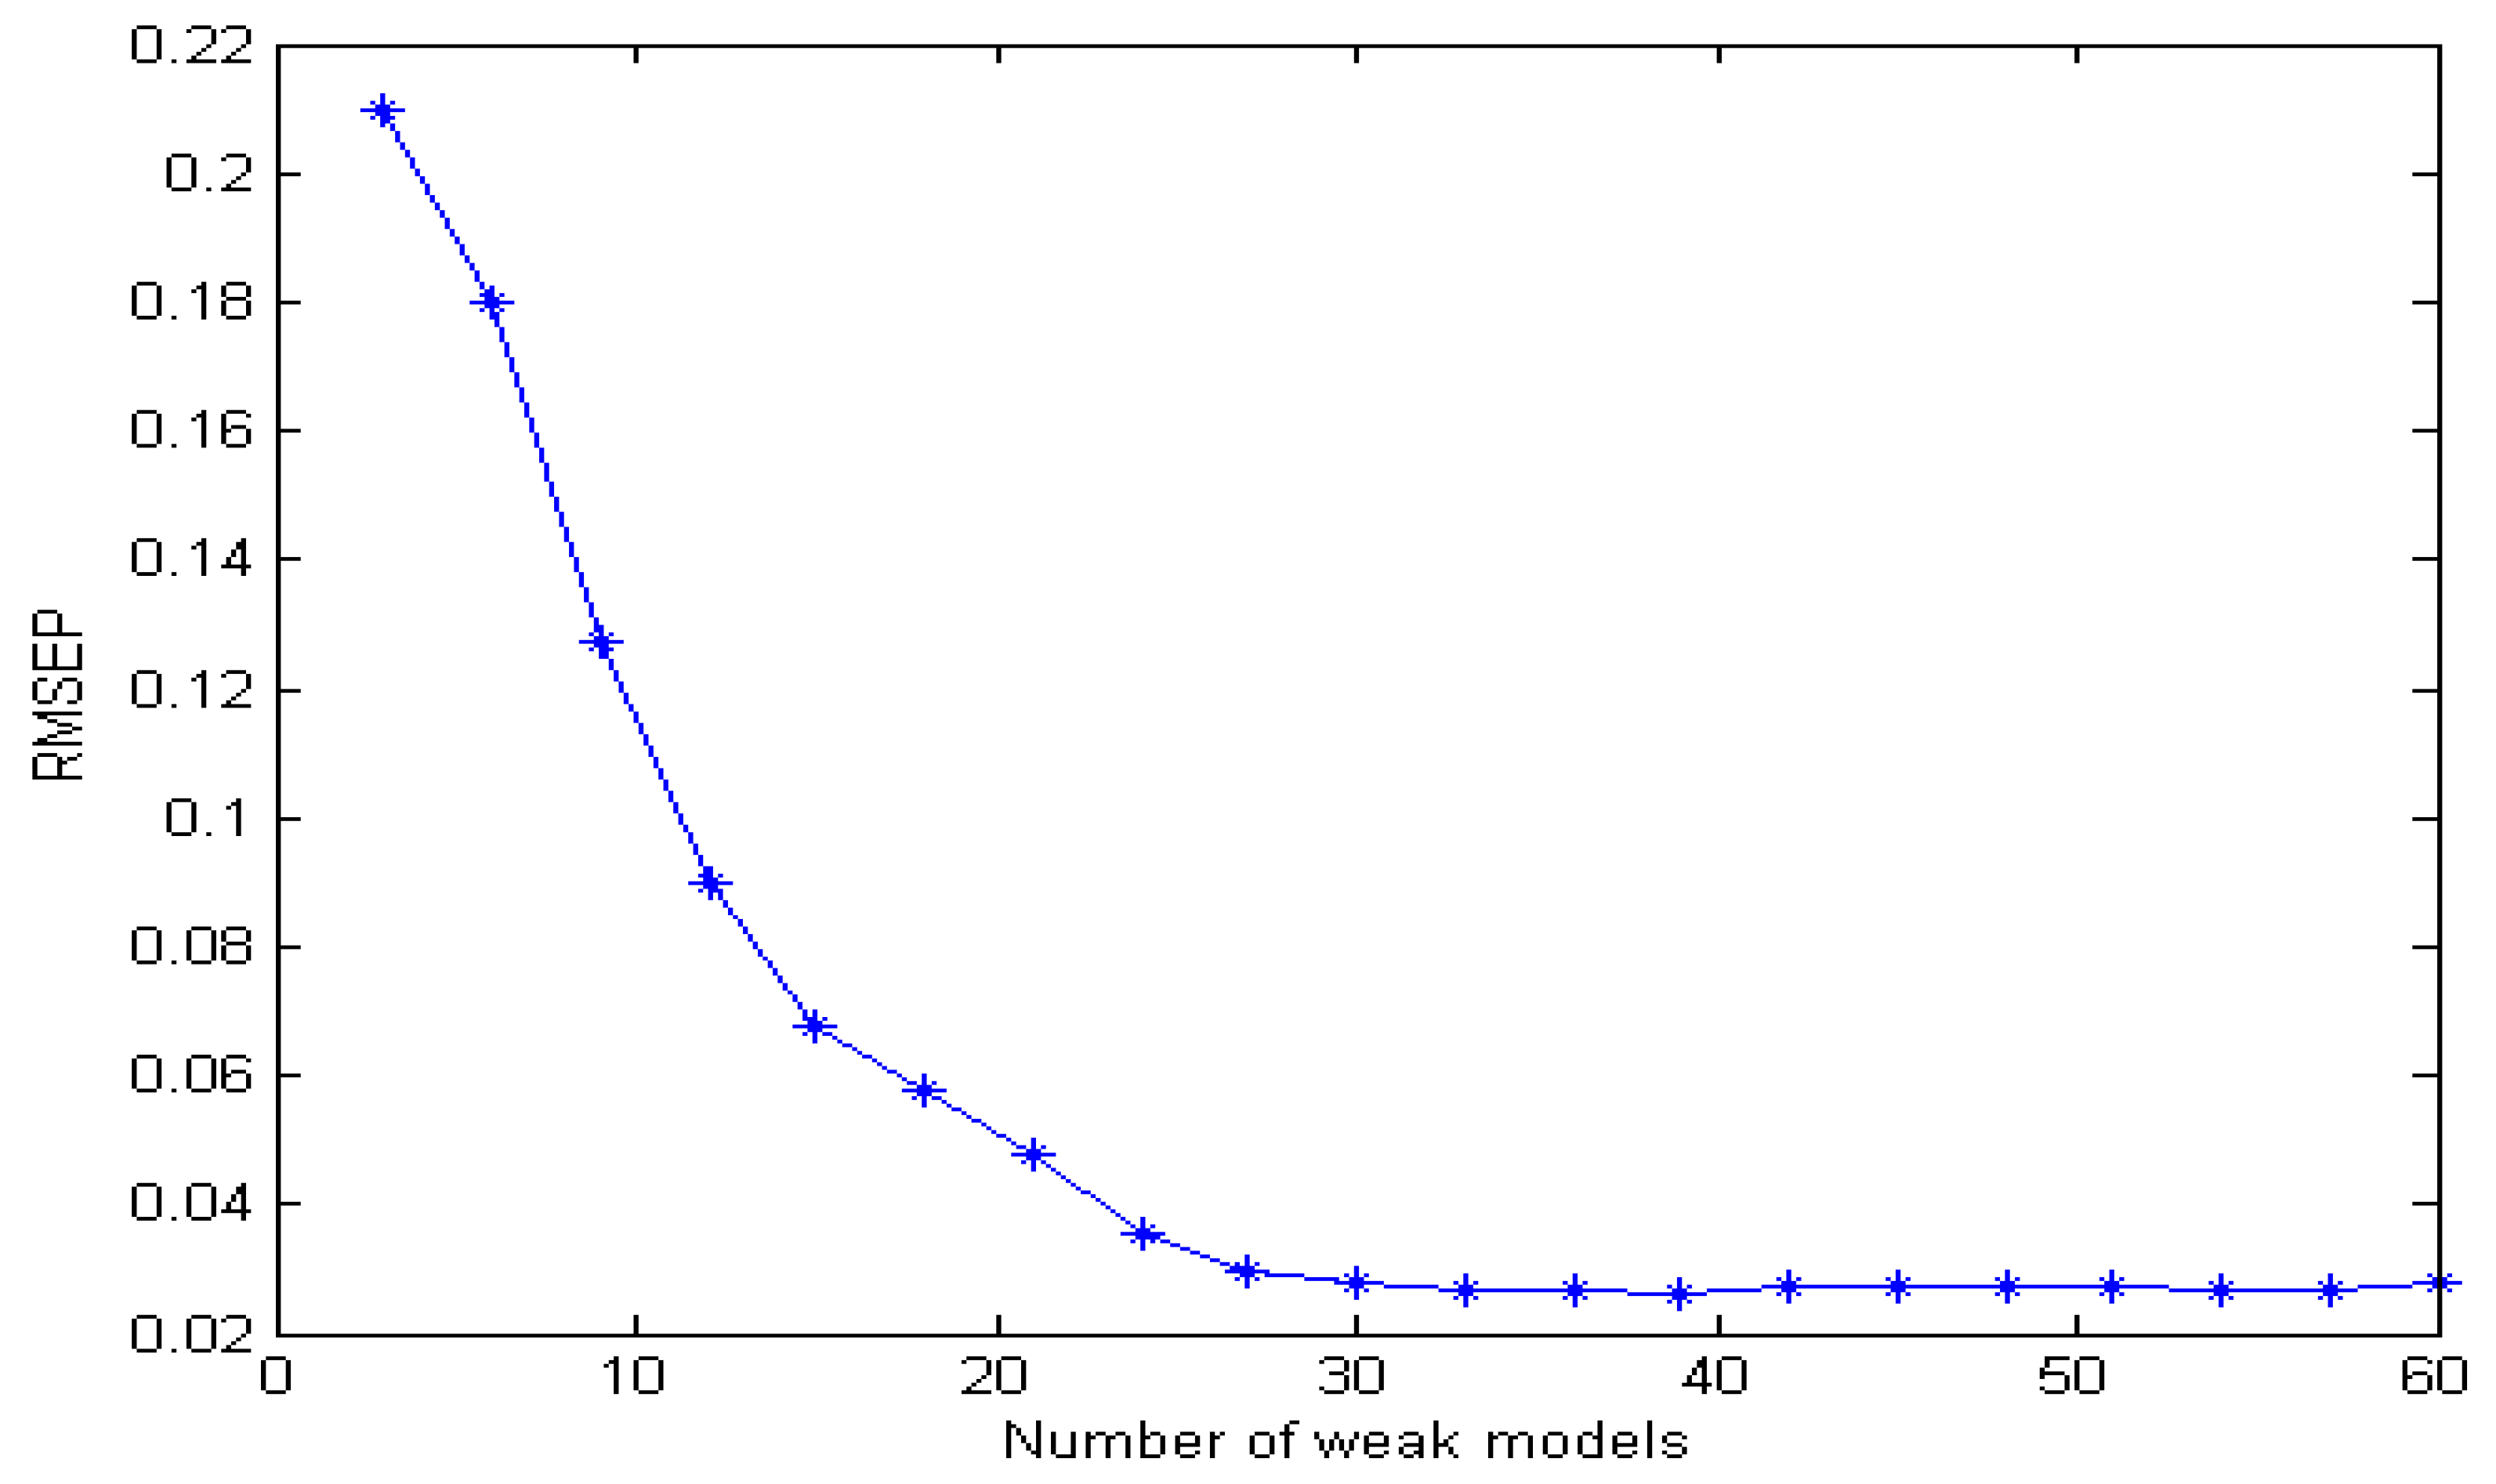
- The sample weights are trained iteratively, and the threshold of iteration times is MT. The threshold of iteration times used in this paper is 30, and m represents the m-th iteration.
- (3)
- Several PLS weak models are generated by random sampling, and the weak model with the lowest error rate is selected as the m-th basic model to predict the verification samples, and the error rate is calculated:
- (4)
- The weight of the m-th basic model Hm(x) in the final model is calculated. The proportion of the basic model is negatively correlated with the error rate. The higher the prediction error rate of this model, the lower the proportion of this model in the final model:
- (5)
- The weight distribution of the training data set is updated:
- (6)
- The number of iterations is then checked to ensure that it does not exceed the iteration threshold. If the number of iterations exceeds MT, the basic model is combined as shown in Formula (13) to obtain the final classifier:
3. Results and Discussion
3.1. Spectral Characteristics
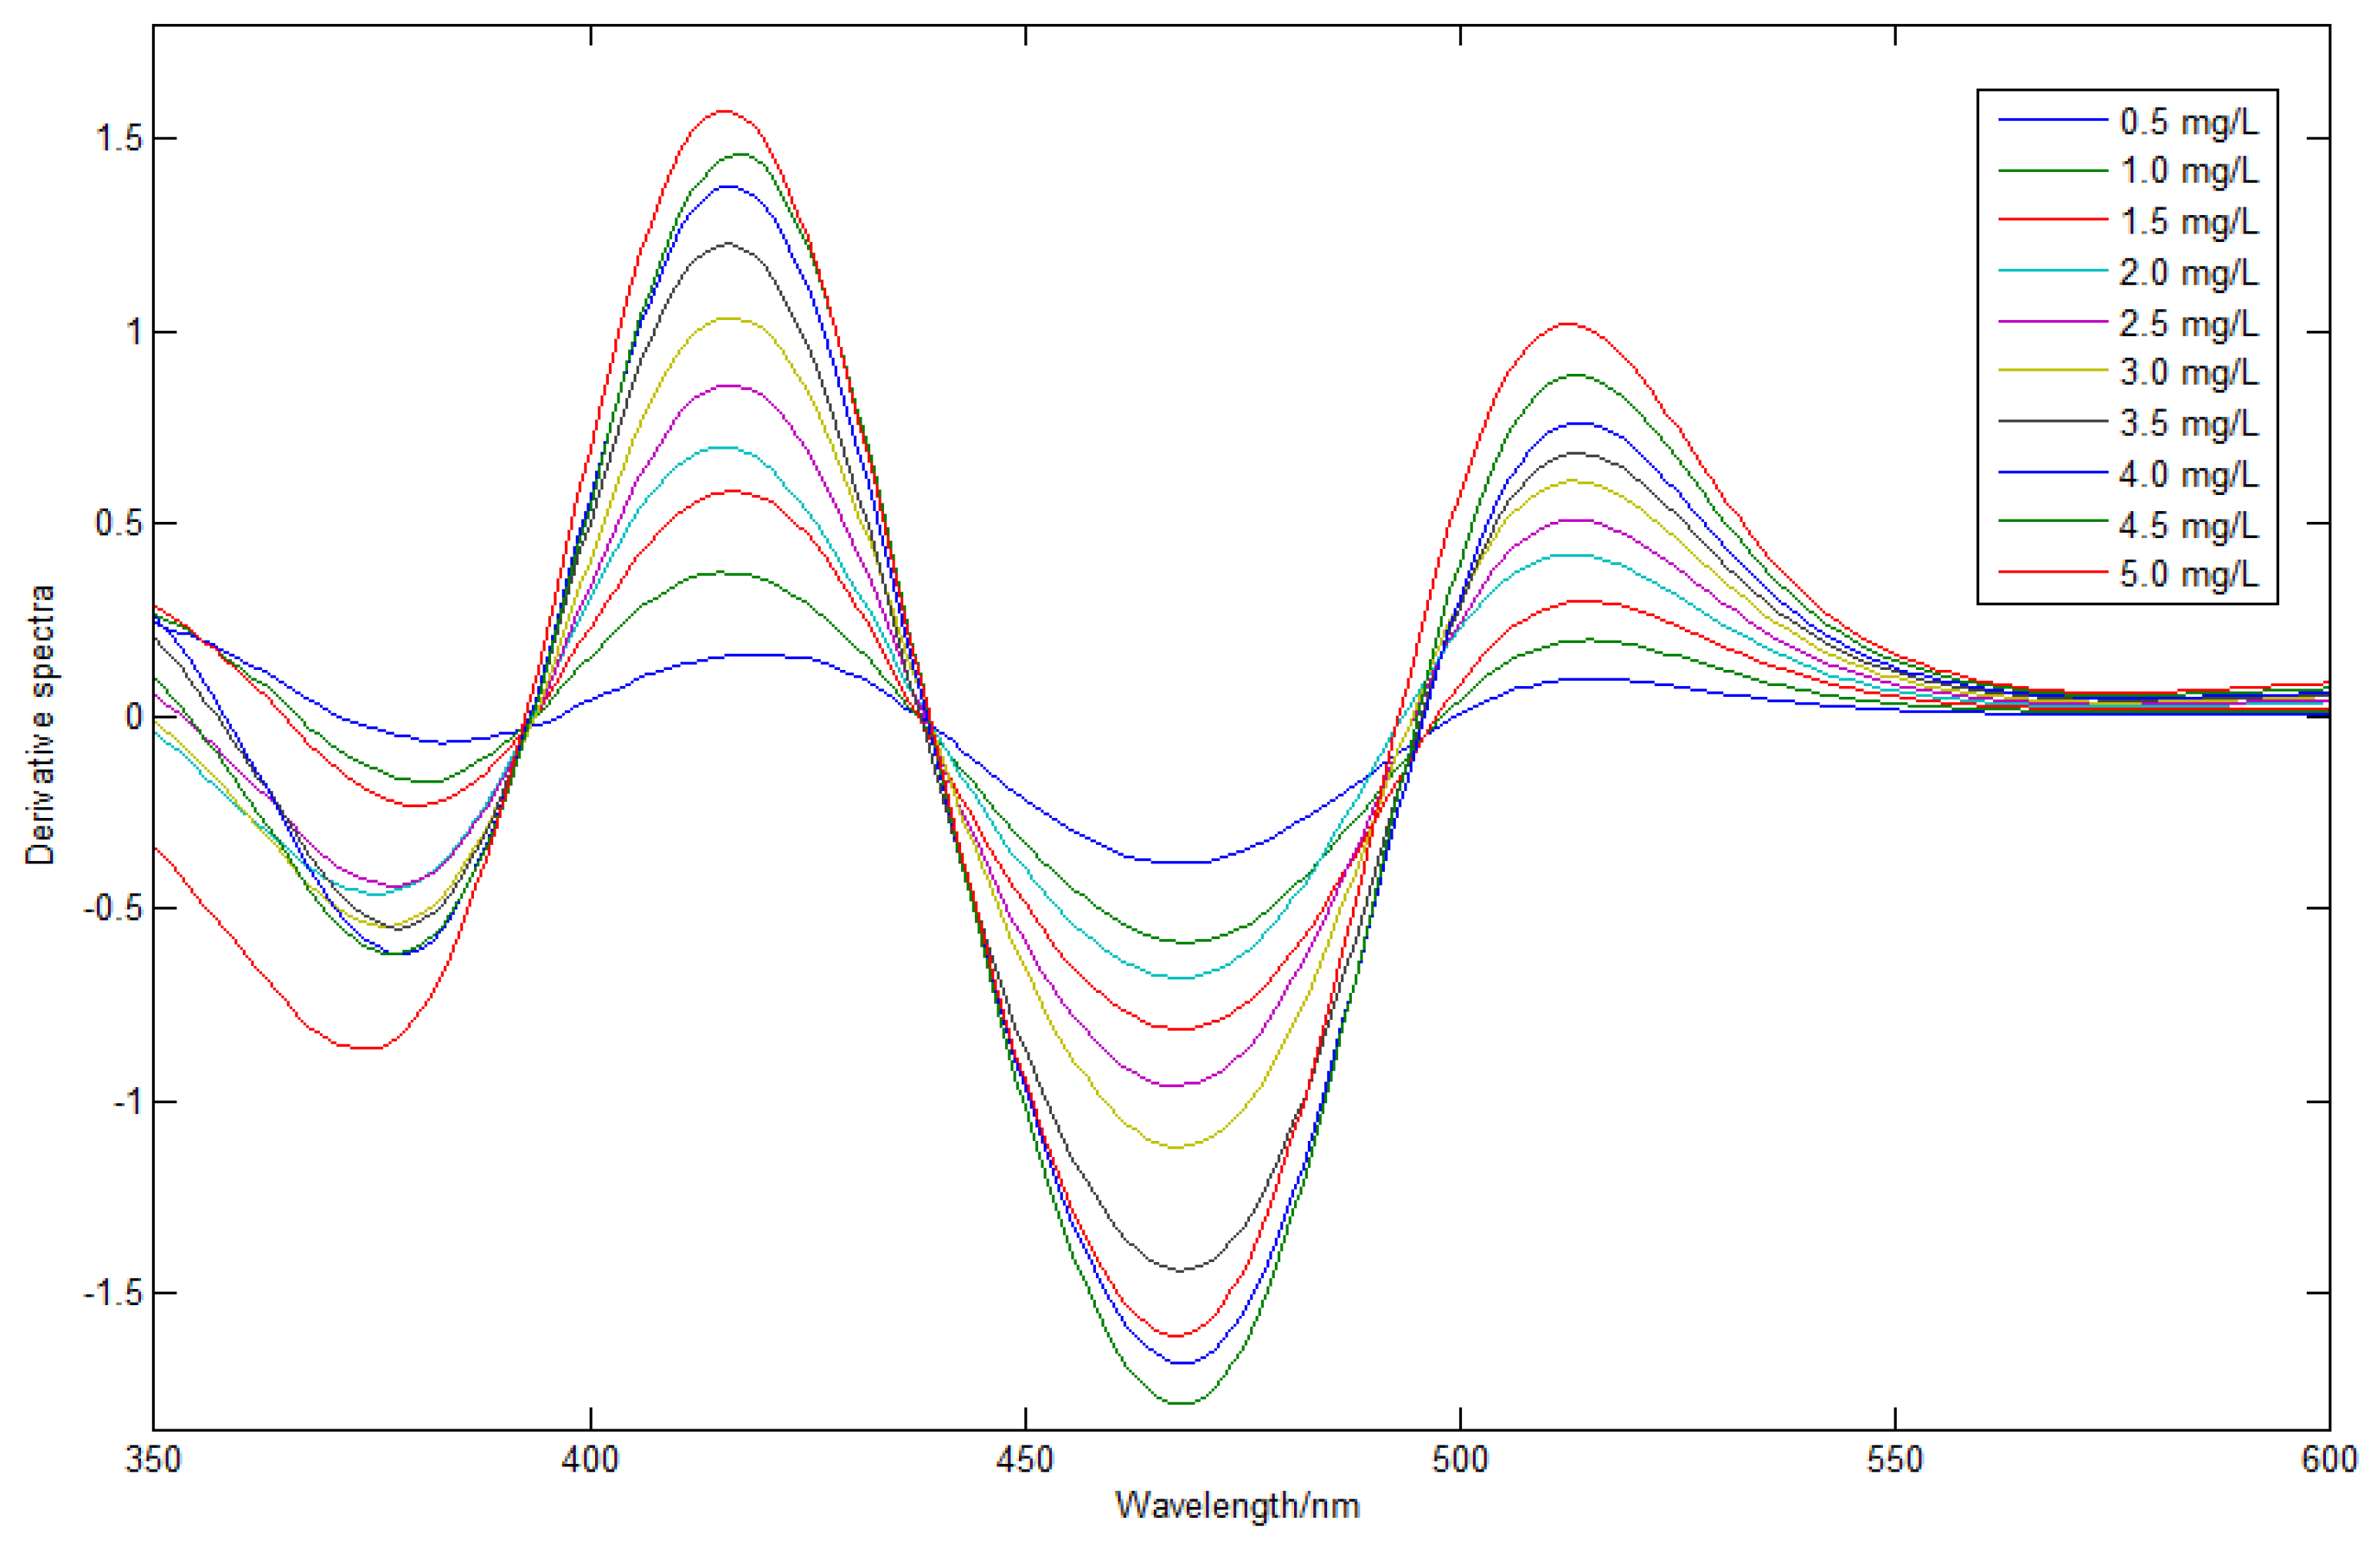
3.2. Derivative Spectrometry
3.3. Application of Interval Partition Method
3.4. Integrated Modeling Based on Adaboost Algorithm
3.5. Performance Comparison of Different Algorithms
4. Experimental
4.1. Apparatus and Reagents
4.2. Procedures
5. Conclusions
Author Contributions
Funding
Institutional Review Board Statement
Informed Consent Statement
Data Availability Statement
Acknowledgments
Conflicts of Interest
References
- Sikder, M.; Lead, J.R.; Chandler, G. A rapid approach for measuring silver nanoparticle concentration and dissolution in seawater by UV-Vis. Sci. Total Environ. 2018, 618, 597–607. [Google Scholar] [CrossRef] [PubMed]
- Liu, W.S.; Liu, Y.H.; Su, H. Nickel(II) extraction from chloride solutions using N-2-ethylhexylpyridine-3-formamide: A new reagent toward clean hydrometallurgy and a proposed flowsheet for chloride leach liquors of nickel laterites. Hydrometallurgy 2024, 227, 106337. [Google Scholar] [CrossRef]
- Yadav, D.; Banerjee, R. Thermodynamic and economic analysis of the solar carbothermal and hydrometallurgy routes for zinc production. Energy 2022, 247, 123242. [Google Scholar] [CrossRef]
- Luan, M.; Jing, G.; Piao, Y. Treatment of refractory organic pollutants in industrial wastewater by wet air oxidation. Arab. J. Chem. 2017, 10, S769–S776. [Google Scholar] [CrossRef]
- Zinatloo, A.S.; Rakhshani, S.; Mehrabadi, Z. Novel rod-like [Cu(phen)2(OAc)]PF6 complex for high-performance visible-light-driven photocatalytic degradation of hazardous organic dyes: DFT approach, Hirshfeld and fingerprint plot analysis. J. Environ. Manag. 2023, 350, 119545. [Google Scholar] [CrossRef]
- Ma, C.F.; Zhang, Q.; Liang, J. Quantitative analysis of four PAHs in oily sludge by surface-enhanced Raman spectroscopy (SERS) combined with partial least squares regression (PLS) based on a novel nano-silver-silicon coupling substrate. Spectrochim. Acta A 2024, 318, 124531. [Google Scholar] [CrossRef]
- Li, B.; Wang, X.; Wei, Y. Extraction of copper from copper and cadmium residues of zinc hydrometallurgy by oxidation acid leaching and cyclone electrowinning. Miner. Eng. 2018, 128, 247–253. [Google Scholar] [CrossRef]
- Zhou, F.B.; Li, C.G.; Zhu, H.Q. A novel method for simultaneous determination of zinc, nickel, cobalt and copper based on UV–vis spectrometry. Optik 2019, 182, 58–64. [Google Scholar] [CrossRef]
- Dong, L.; Xu, X.; Li, C. Plasmon-induced transparency in sensing application with semicircle cavity waveguide. Opt. Commun. 2018, 410, 751–755. [Google Scholar] [CrossRef]
- Liu, P.; Nie, Y.Z.; Xia, Q.L. Structural and electronic properties of arsenic nitrogen monolayer. Phys. Lett. A 2017, 381, 1102–1106. [Google Scholar] [CrossRef]
- Tatikolov, A.S. UV–vis spectral study of the isomeric equilibrium for the anionic polymethine dyes—Oxonols in different solvents. Chem. Phys. Lett. 2016, 665, 131–136. [Google Scholar] [CrossRef]
- Martins, A.R.; Talhavini, M.; Vieira, M.L. Discrimination of whisky brands and counterfeit identification by UV-Vis spectroscopy and multivariate data analysis. Food Chem. 2017, 229, 142–151. [Google Scholar] [CrossRef] [PubMed]
- Xu, H.; Li, H.; Xiao, G. Tunable plasmon resonance in the nanobars and split ring resonator(SRR) composite structure. Opt. Commun. 2016, 377, 70–73. [Google Scholar] [CrossRef]
- Xu, H.; Li, H.; He, Z. Theoretical analysis of optical properties and sensing in a dual-layer asymmetric metamaterial. Opt. Commun. 2018, 407, 250–254. [Google Scholar] [CrossRef]
- Guo, X.M.; Lin, Z.N.; Wang, Y.J. In-line monitoring the degradation of polypropylene under multiple extrusions based on raman spectroscopy. Polymers 2019, 11, 1698. [Google Scholar] [CrossRef] [PubMed]
- Xu, H.; Li, H.; He, Z. Dual tunable plasmon-induced transparency based on silicon-air grating coupled graphene structure in terahertz metamaterial. Opt. Express 2017, 25, 20780–20790. [Google Scholar] [CrossRef] [PubMed]
- Li, P.; Qu, J.B.; He, Y.L. Global calibration model of UV-Vis spectroscopy for COD estimation in the effluent of rural sewage treatment facilities. RSC Adv. 2020, 10, 20691–20700. [Google Scholar] [CrossRef]
- Li, B.; Li, H.; Zeng, L. Filtering and sensing properties based on metal-dielectric-metal waveguide with slot cavities. J. Mod. Optic. 2016, 63, 1378–1383. [Google Scholar] [CrossRef]
- He, Z.; Li, H.; Li, B. Theoretical analysis of ultrahigh figure of merit sensing in plasmonic waveguides with a multimode stub. Opt. Lett. 2016, 41, 5206–5215. [Google Scholar] [CrossRef]
- Giriraj, P.; Sivakkumar, T. Simultaneous estimation of dutasteride and tamsulosin hydrochloride in tablet dosage form by vierordt’s method. Arab. J. Chem. 2017, 10, S1862–S1867. [Google Scholar] [CrossRef]
- Zaazaa, H.E.; Elzanfaly, E.S.; Soudi, A.T. Application of the ratio difference spectrophotometry to the determination of ibuprofen and famotidine in their combined dosage form: Comparison with previously published spectrophotometric methods. Spectrochim. Acta A 2015, 143, 251–255. [Google Scholar] [CrossRef]
- Shi, T.; Luan, X.; Liu, F. Near-infrared modelling with temperature compensation based on multilevel principal component regression. Vib. Spectrosc. 2017, 92, 302–307. [Google Scholar] [CrossRef]
- Li, H.D.; Xu, Q.S.; Liang, Y.Z. An integrated library for partial least squares regression and linear discriminant analysis. Chemom. Intell. Lab. Syst. 2018, 176, 34–43. [Google Scholar] [CrossRef]
- Yakubu, H.J.; Worku, A.; Tothi, R. Near-infrared spectroscopy for rapid evaluation of winter cereals and Italian ryegrass forage mixtures. Anim. Sci. J. 2023, 94, e13823. [Google Scholar] [CrossRef]
- Ford, J.L.; Green, M.H.; Green, J.B. Intestinal beta-carotene bioconversion in humans is determined by a new single-sample, plasma isotope ratio method and compared with traditional and modified area-under-the-curve methods. Arch. Biochem. Biophys. 2018, 653, 121–126. [Google Scholar] [CrossRef] [PubMed]
- Do, T.T.; Dao, U.P.; Bui, H.T. Effect of electrostatic interaction between fluoxetine and lipid membranes on the partitioning of fluoxetine investigated using second derivative spectrophotometry and FTIR. Chem. Phys. Lipids 2017, 207, 10–23. [Google Scholar] [CrossRef]
- Zhou, F.B.; Li, C.G.; Zhu, H.Q.; Li, Y.G. Simultaneous Determination of Trace Metal Ions in Industrial Wastewater Based on UV–Vis Spectrometry. Optik 2019, 176, 512–517. [Google Scholar] [CrossRef]
- Fedenko, V.S.; Shemet, A.M.; Landi, S. UV-vis spectroscopy and colorimetric models for detecting anthocyanin-metal complexes in plants: An overview of in vitro and in vivo techniques. J. Plant Physiol. 2017, 212, 13–28. [Google Scholar] [CrossRef]
- Silva, D.J.; Wiebeck, H. Using PLS, iPLS and siPLS linear regressions to determine the composition of LDPE/HDPE blends: A comparison between confocal Raman and ATR-FTIR spectroscopies. Vib. Spectrosc. 2017, 92, 259–266. [Google Scholar] [CrossRef]
- Zhu, X.R.; Li, G.Y.; Su, D.L. The feasibility of rapid determination of the cadmium content in rice based on near infrared spectroscopy and synergy interval partial least squares. Food Mach. 2015, 31, 43–48. [Google Scholar]
- Hao, Y.; Sun, X.D.; Pan, Y.Y. Detection of firmness and furface color of pear by near infrared spectroscopy based on Monte Carlo uninformative variables elimination method. Spectrosc. Spectr. Anal. 2011, 31, 1225–1229. [Google Scholar]
- Liu, G.H.; Xia, R.S.; Jiang, H. A wavelength selection approach of near infrared spectra based on SCARS strategy and its application. Spectrosc. Spectr. Anal. 2014, 34, 2094–2098. [Google Scholar]
- Yadav, D.; Banerjee, R. A comparative life cycle energy and carbon emission analysis of the solar carbothermal and hydrometallurgy routes for zinc production. Appl. Energy 2018, 229, 577–602. [Google Scholar] [CrossRef]
- Duan, H.; Ma, S.; Han, L. A novel denoising method for laser-induced breakdown spectroscopy: Improved wavelet dual threshold function method and its application to quantitative modeling of Cu and Zn in Chinese animal manure composts. Microchem. J. 2017, 134, 262–269. [Google Scholar] [CrossRef]
- Zou, Z.; Deng, Y.; Hu, J. Recent trends in atomic fluorescence spectrometry towards miniaturized instrumentation—A review. Anal. Chim. Acta. 2018, 1019, 25–37. [Google Scholar] [CrossRef]
- Zeng, C.L.; Li, C.; Xia, G.Q.; Zhong, X. Fast Stray Light Performance Evaluation Based on BSDF and Radiative Transfer Theory. Sensors 2023, 23, 9182. [Google Scholar] [CrossRef]
- Zhou, F.B.; Li, C.G.; Yang, C.H. A spectrophotometric method for simultaneous determination of trace ions of copper, cobalt, and nickel in the zinc sulfate solution by ultraviolet-visible spectrometry. Spectrochim. Acta A 2019, 223, 117370. [Google Scholar] [CrossRef]
- Zhou, F.B.; Li, C.G.; Zhu, H.Q. A Characteristic Interval Modeling Method for Simultaneous Detection of Multiple Metal Ions. Front. Chem. 2022, 10, 839633. [Google Scholar] [CrossRef]


| Wavelength/nm | Linear Regression Equation | Correlation Coefficient (R2) |
|---|---|---|
| 368 | Y = 0.1150x − 0.1414 | 0.6667 |
| 415 | Y = 0.0650x + 0.3081 | 0.9906 |
| 444 | y = −0.0607x − 0.0528 | 0.8257 |
| 497 | y = −0.0879x + 0.0283 | 0.3791 |
| 509 | y = −0.0147x + 0.1807 | 0.9891 |
| 540 | y = 0.0076x + 0.0698 | 0.9932 |
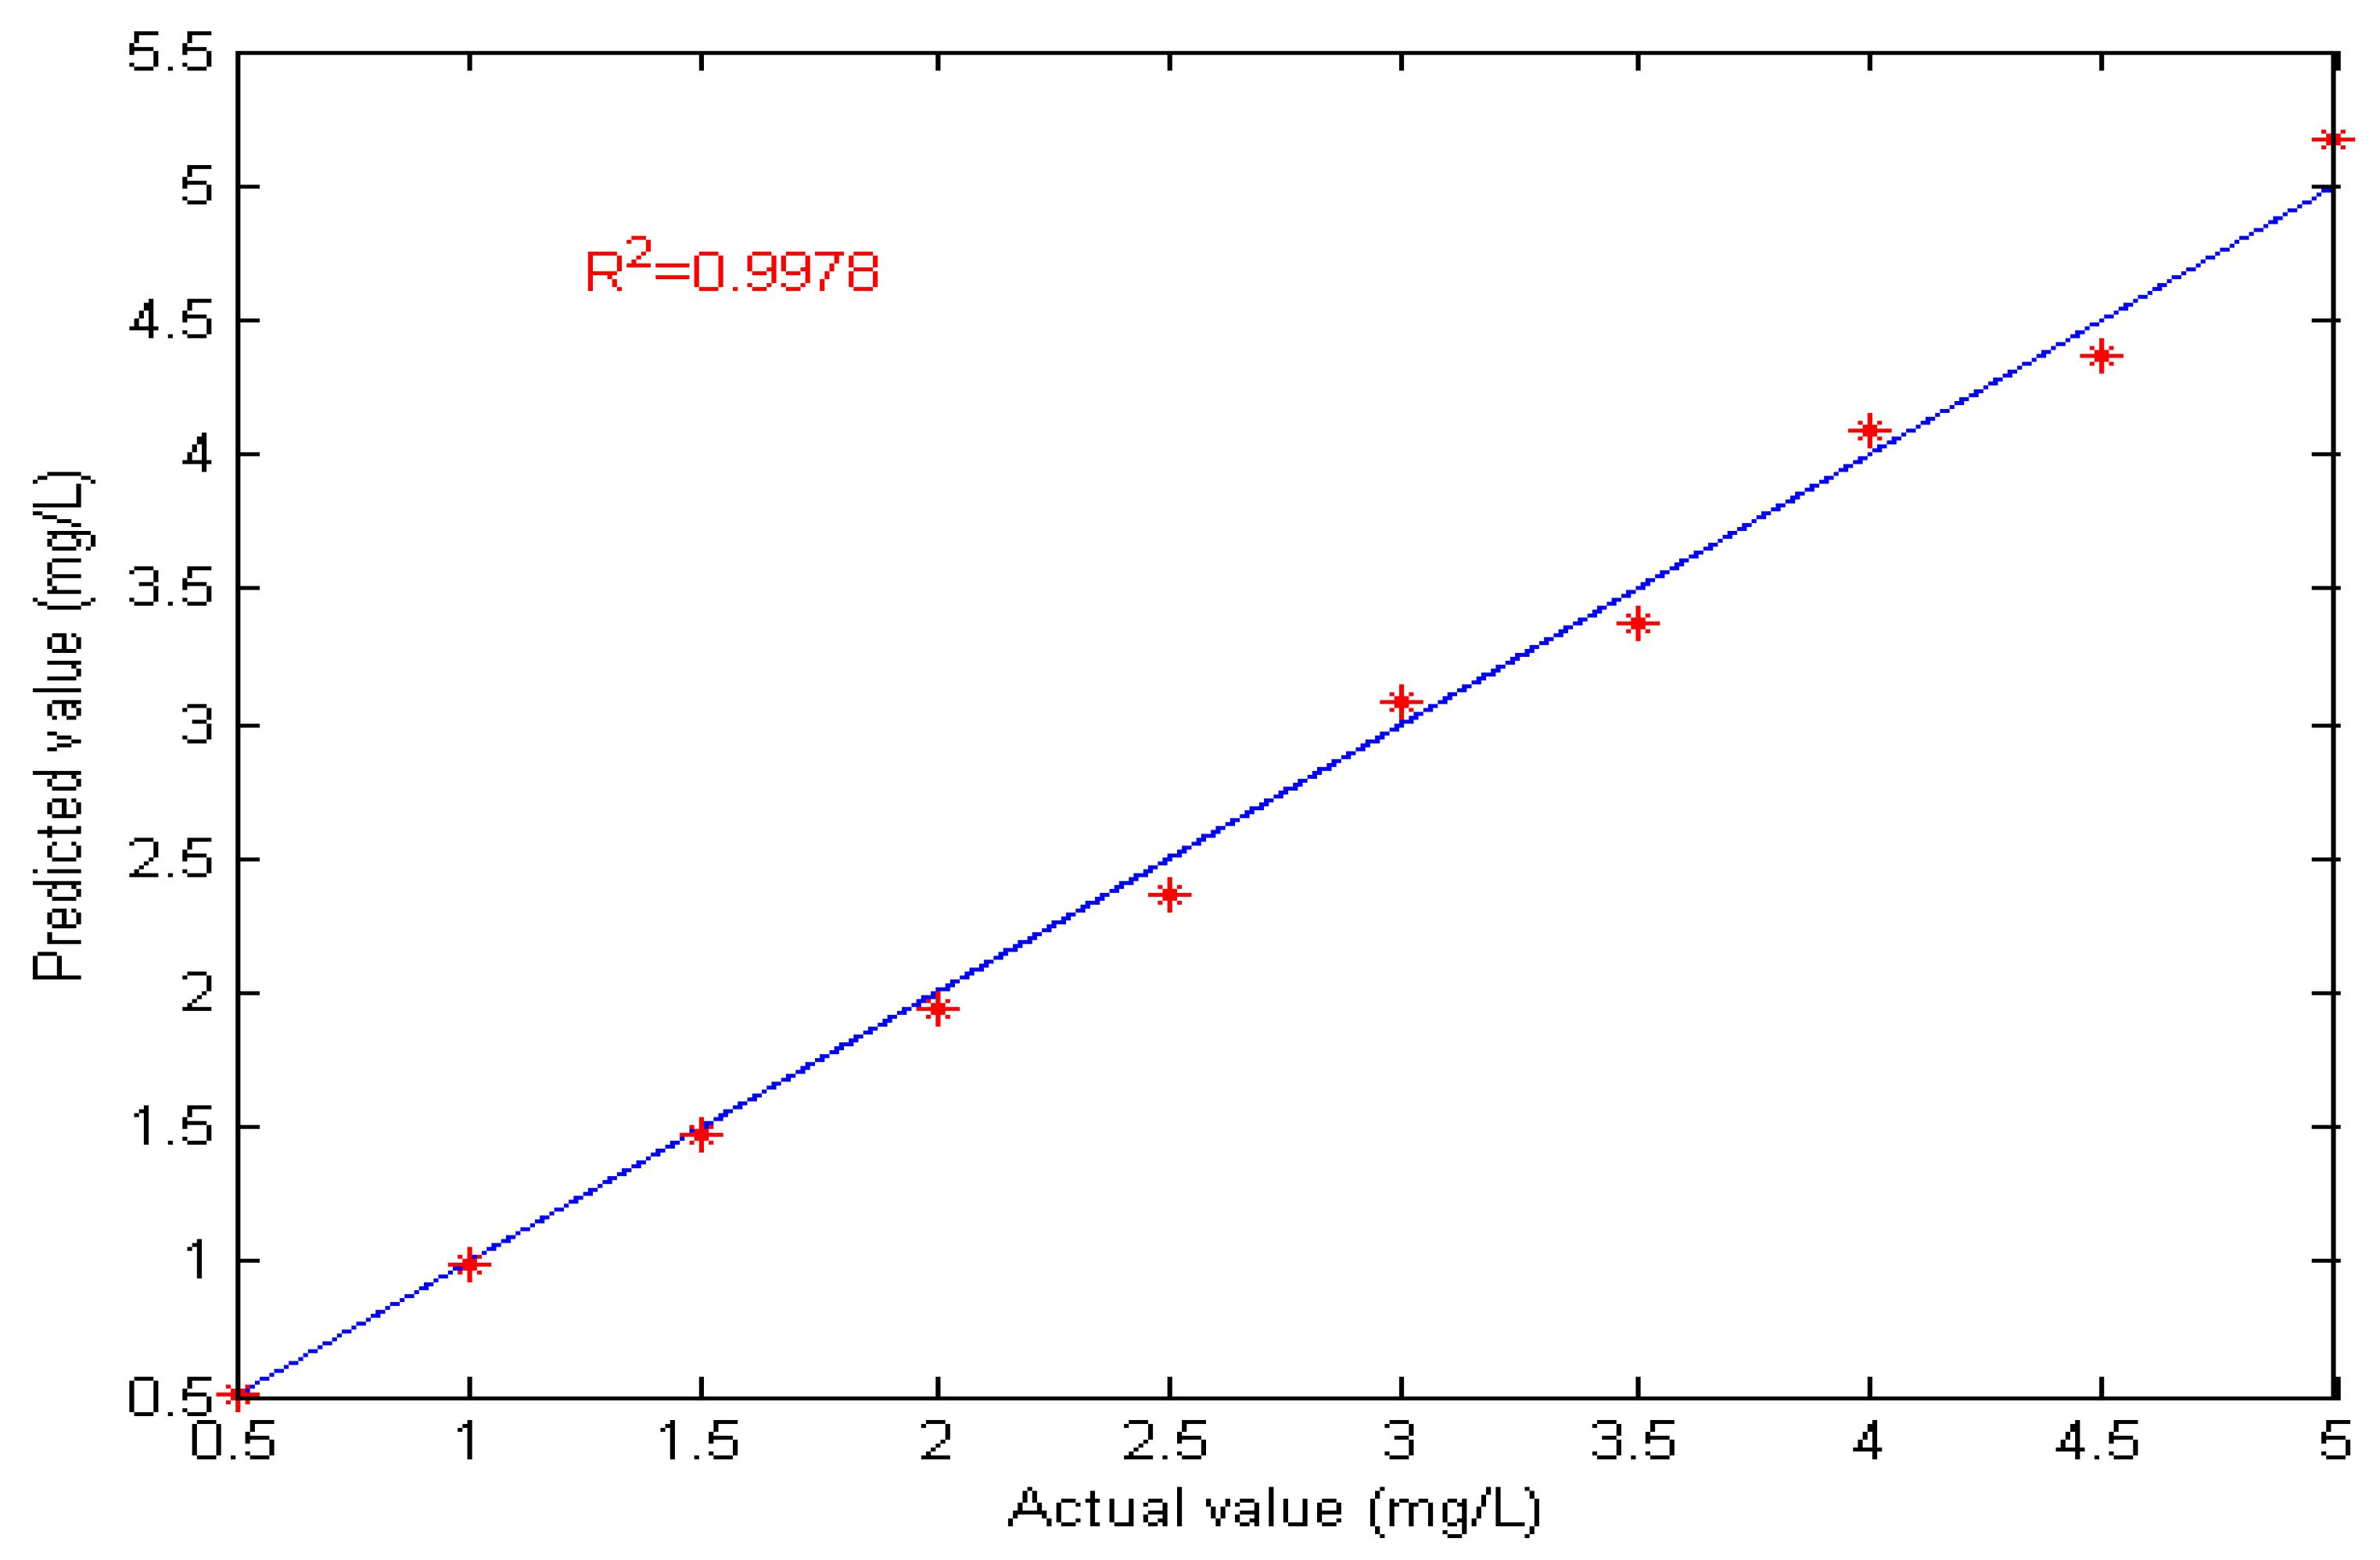
| No. | Actual Value (mg/L) | Predicted Value (mg/L) | Relative Error (%) | |
|---|---|---|---|---|
| Zn | Cu | Cu | Cu | |
| 1 | 2.1 × 10⁴ | 2.00 | 1.938 | 3.10 |
| 2 | 2.2 × 10⁴ | 4.00 | 4.093 | 2.33 |
| 3 | 2.3 × 10⁴ | 0.50 | 0.513 | 2.60 |
| 4 | 2.4 × 10⁴ | 2.50 | 2.358 | 5.68 |
| 5 | 2.5 × 10⁴ | 4.50 | 4.373 | 2.82 |
| 6 | 2.6 × 10⁴ | 1.00 | 0.984 | 1.60 |
| 7 | 2.7 × 10⁴ | 3.00 | 3.086 | 2.87 |
| 8 | 2.8 × 10⁴ | 5.00 | 5.171 | 3.42 |
| 9 | 2.9 × 10⁴ | 1.50 | 1.467 | 2.20 |
| 10 | 3.0 × 10⁴ | 3.50 | 3.376 | 3.54 |
| Average relative error (%) | 3.02 | |||
| LOD (mg/L) | 0.14 | |||
| RMSEP | 0.031 | |||
| Detect Ion | Evaluation Index | FBPLS | CARS | MC_UVE | IPM |
|---|---|---|---|---|---|
| Cu | Wavelength number | 251 | 65 | 82 | 47 |
| Maximum relative error/% | 74.31 | 21.35 | 11.29 | 6.22 | |
| Average relative error/% | 19.52 | 9.27 | 7.73 | 3.14 | |
| R2 | 0.8833 | 0.9674 | 0.9916 | 0.9978 | |
| RMSEP | 0.2782 | 0.1345 | 0.0833 | 0.0307 |
Disclaimer/Publisher’s Note: The statements, opinions and data contained in all publications are solely those of the individual author(s) and contributor(s) and not of MDPI and/or the editor(s). MDPI and/or the editor(s) disclaim responsibility for any injury to people or property resulting from any ideas, methods, instructions or products referred to in the content. |
© 2024 by the authors. Licensee MDPI, Basel, Switzerland. This article is an open access article distributed under the terms and conditions of the Creative Commons Attribution (CC BY) license (https://creativecommons.org/licenses/by/4.0/).
Share and Cite
Zhou, F.; Wu, B.; Zhou, J. A Spectral Detection Method Based on Integrated and Partition Modeling for Trace Copper in High-Concentration Zinc Solution. Molecules 2024, 29, 4006. https://doi.org/10.3390/molecules29174006
Zhou F, Wu B, Zhou J. A Spectral Detection Method Based on Integrated and Partition Modeling for Trace Copper in High-Concentration Zinc Solution. Molecules. 2024; 29(17):4006. https://doi.org/10.3390/molecules29174006
Chicago/Turabian StyleZhou, Fengbo, Bo Wu, and Jianhua Zhou. 2024. "A Spectral Detection Method Based on Integrated and Partition Modeling for Trace Copper in High-Concentration Zinc Solution" Molecules 29, no. 17: 4006. https://doi.org/10.3390/molecules29174006
APA StyleZhou, F., Wu, B., & Zhou, J. (2024). A Spectral Detection Method Based on Integrated and Partition Modeling for Trace Copper in High-Concentration Zinc Solution. Molecules, 29(17), 4006. https://doi.org/10.3390/molecules29174006