


Microcrystalline Luminescent (Eu1-xLnx)2bdc3·nH2O (Ln = La, Gd, Lu) Antenna MOFs: Effect of Dopant Content on Structure, Particle Morphology, and Luminescent Properties
 , ,
, ,  , ,
, ,  and
and
Abstract
:
1. Introduction
2. Results and Discussion
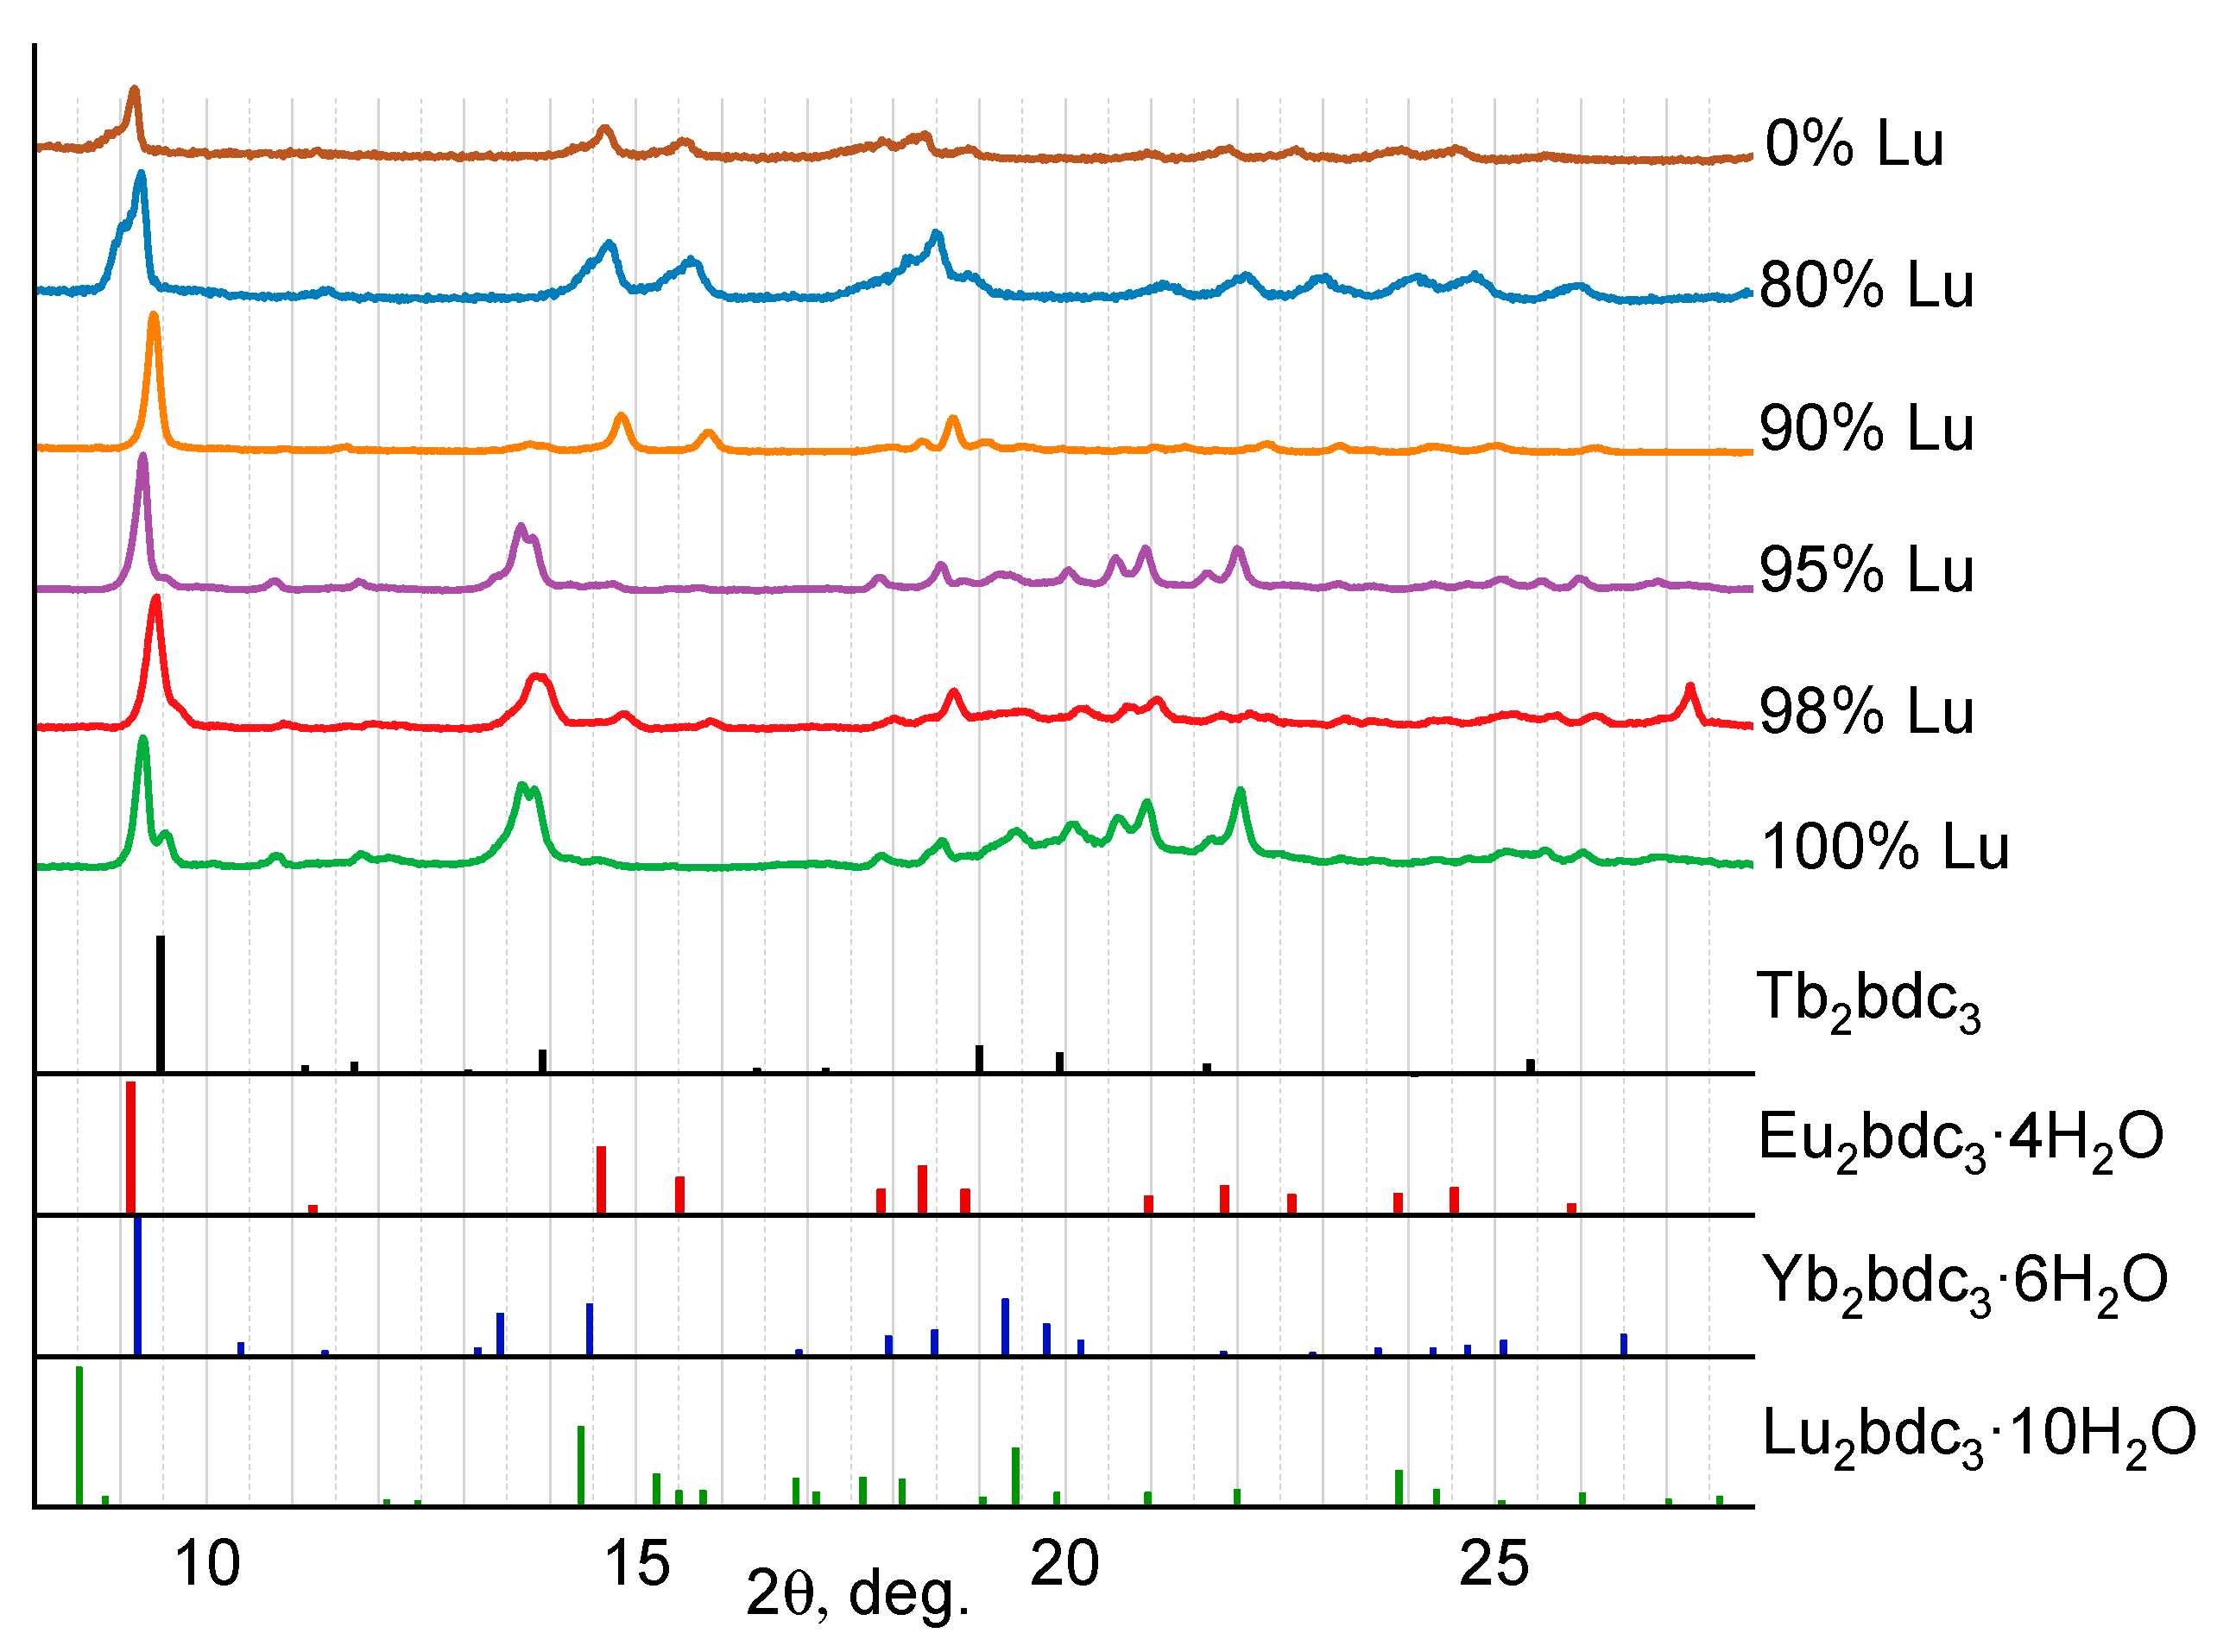
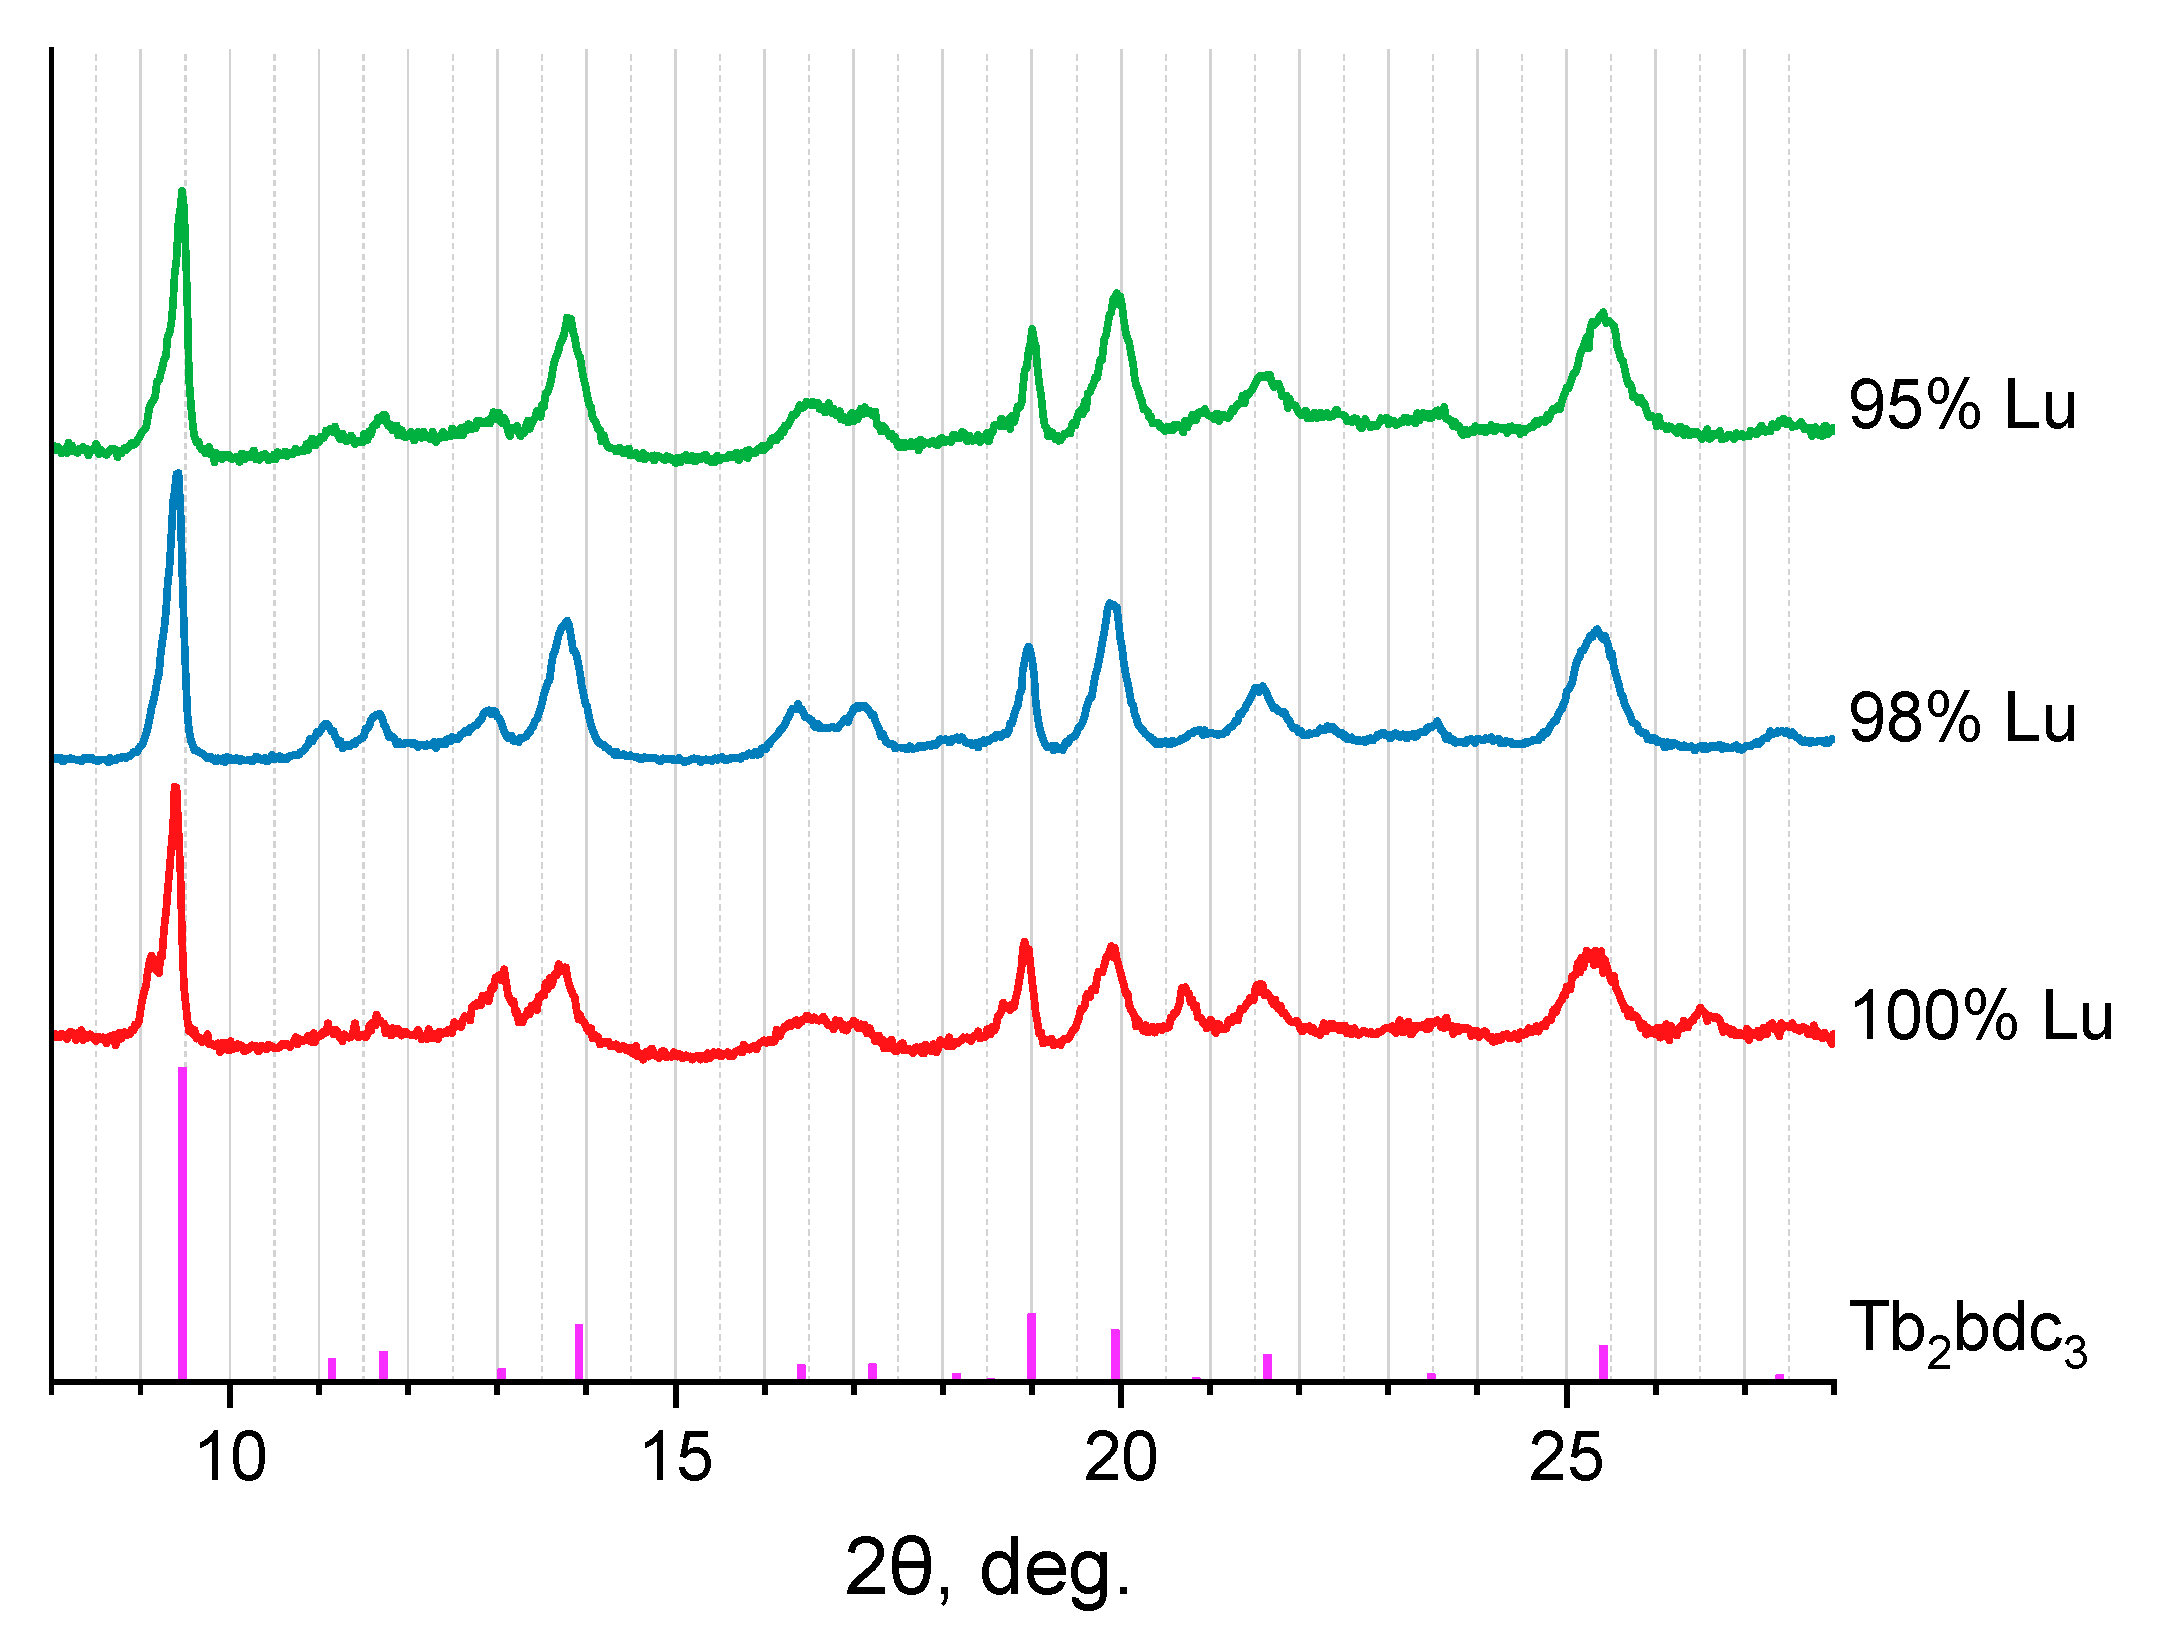
2.1. Crystalline Structure
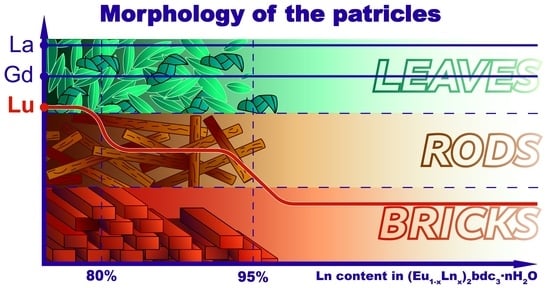
2.2. Particle Morphology
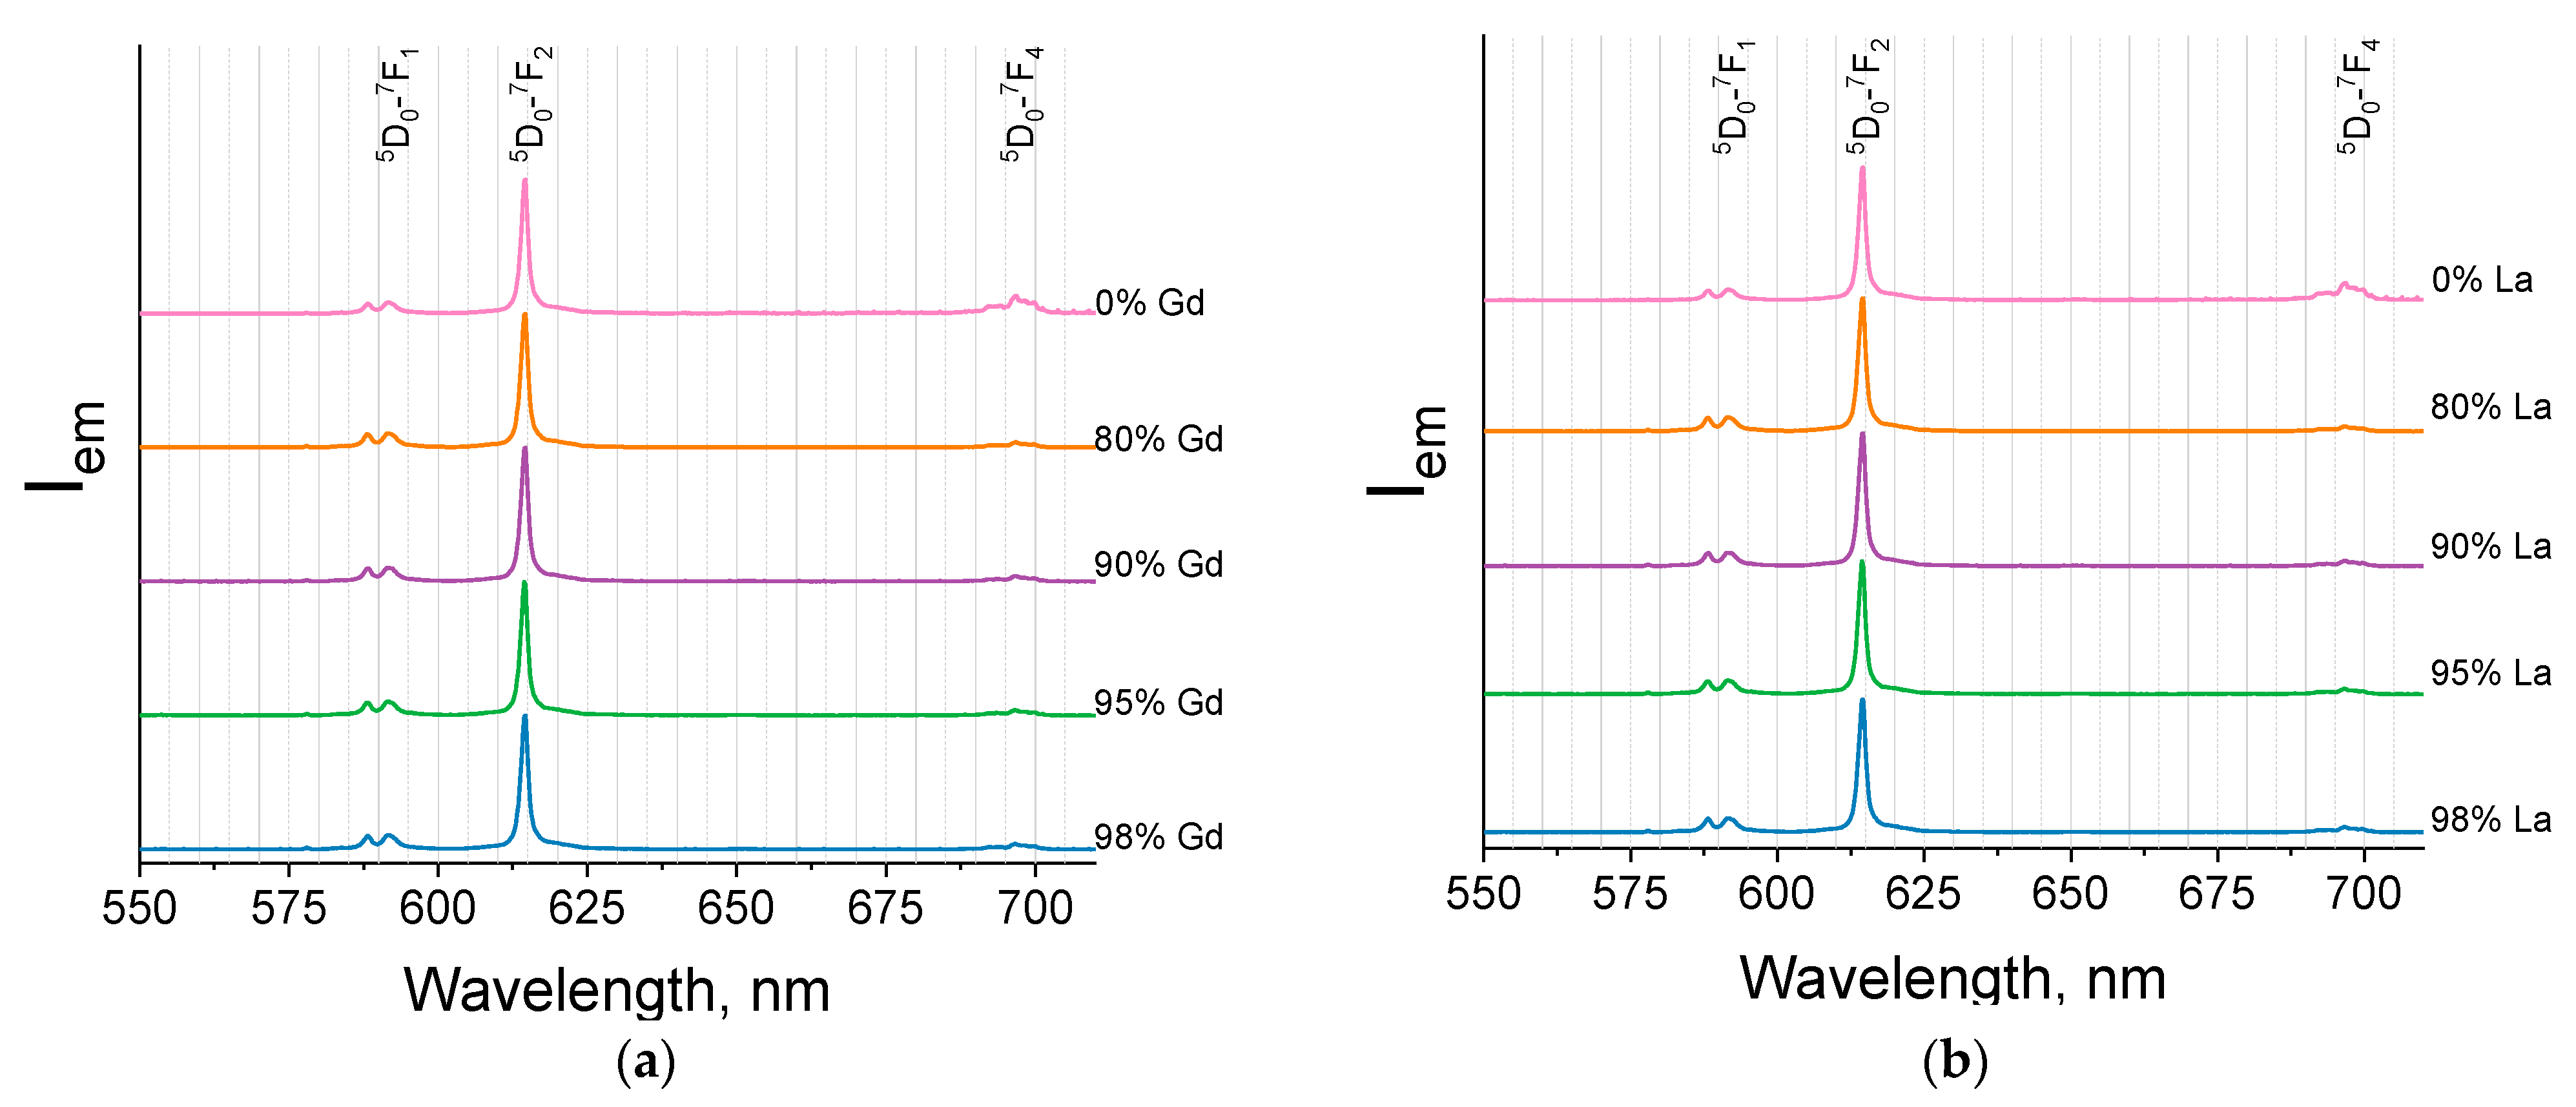
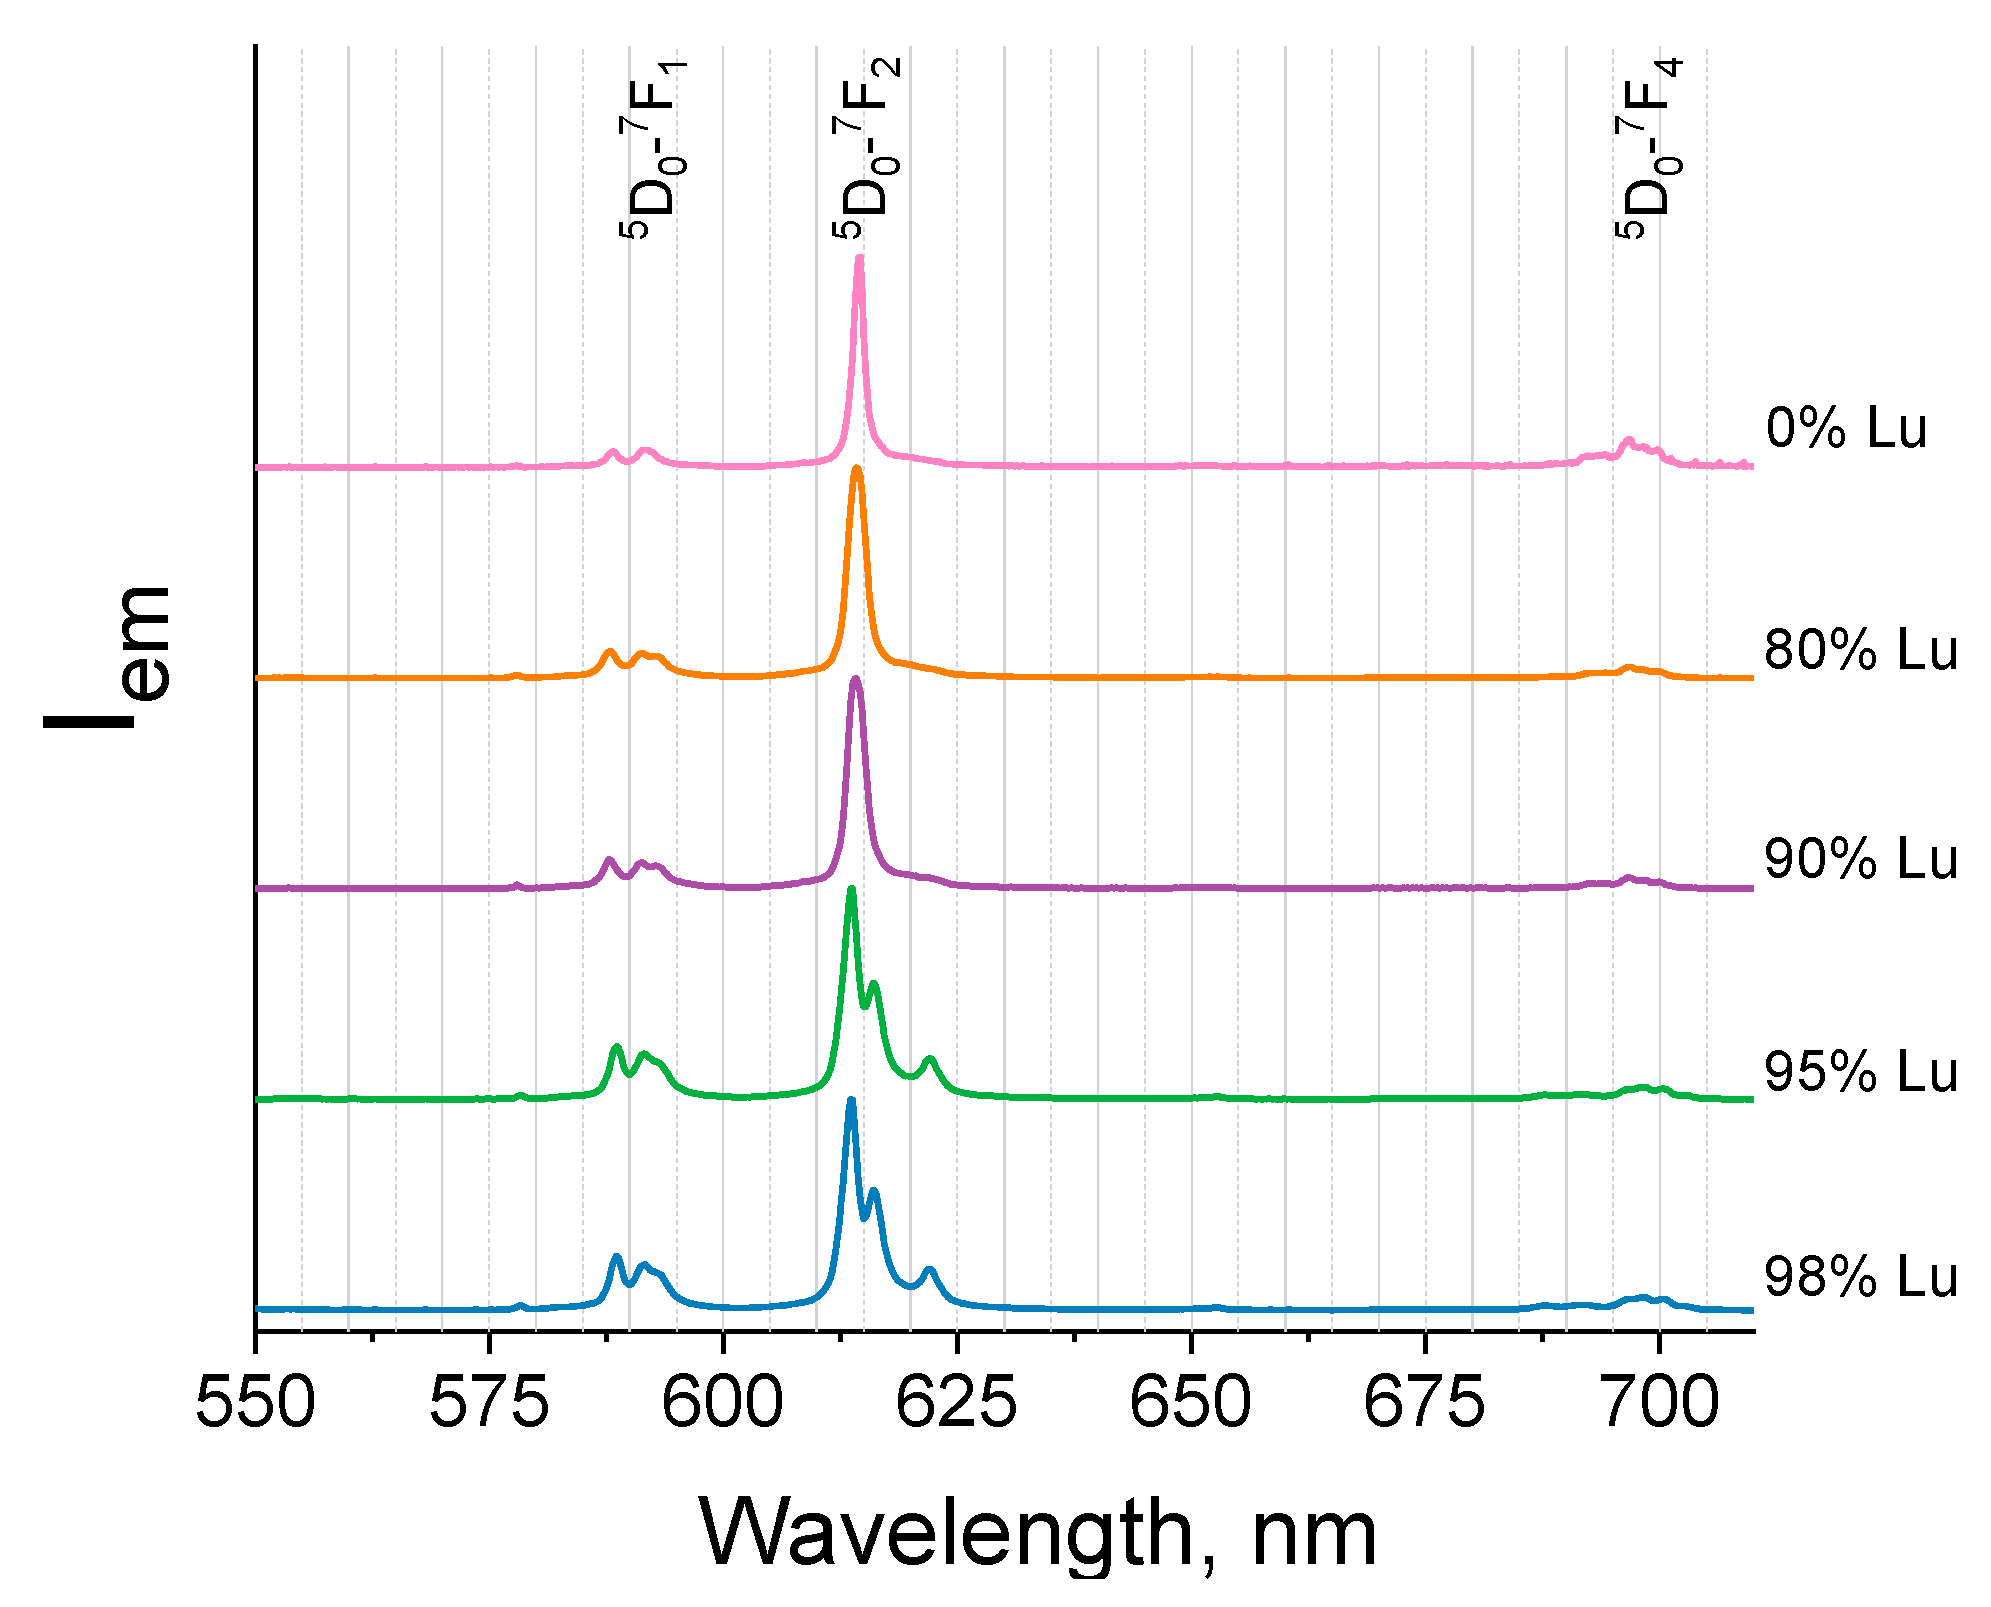
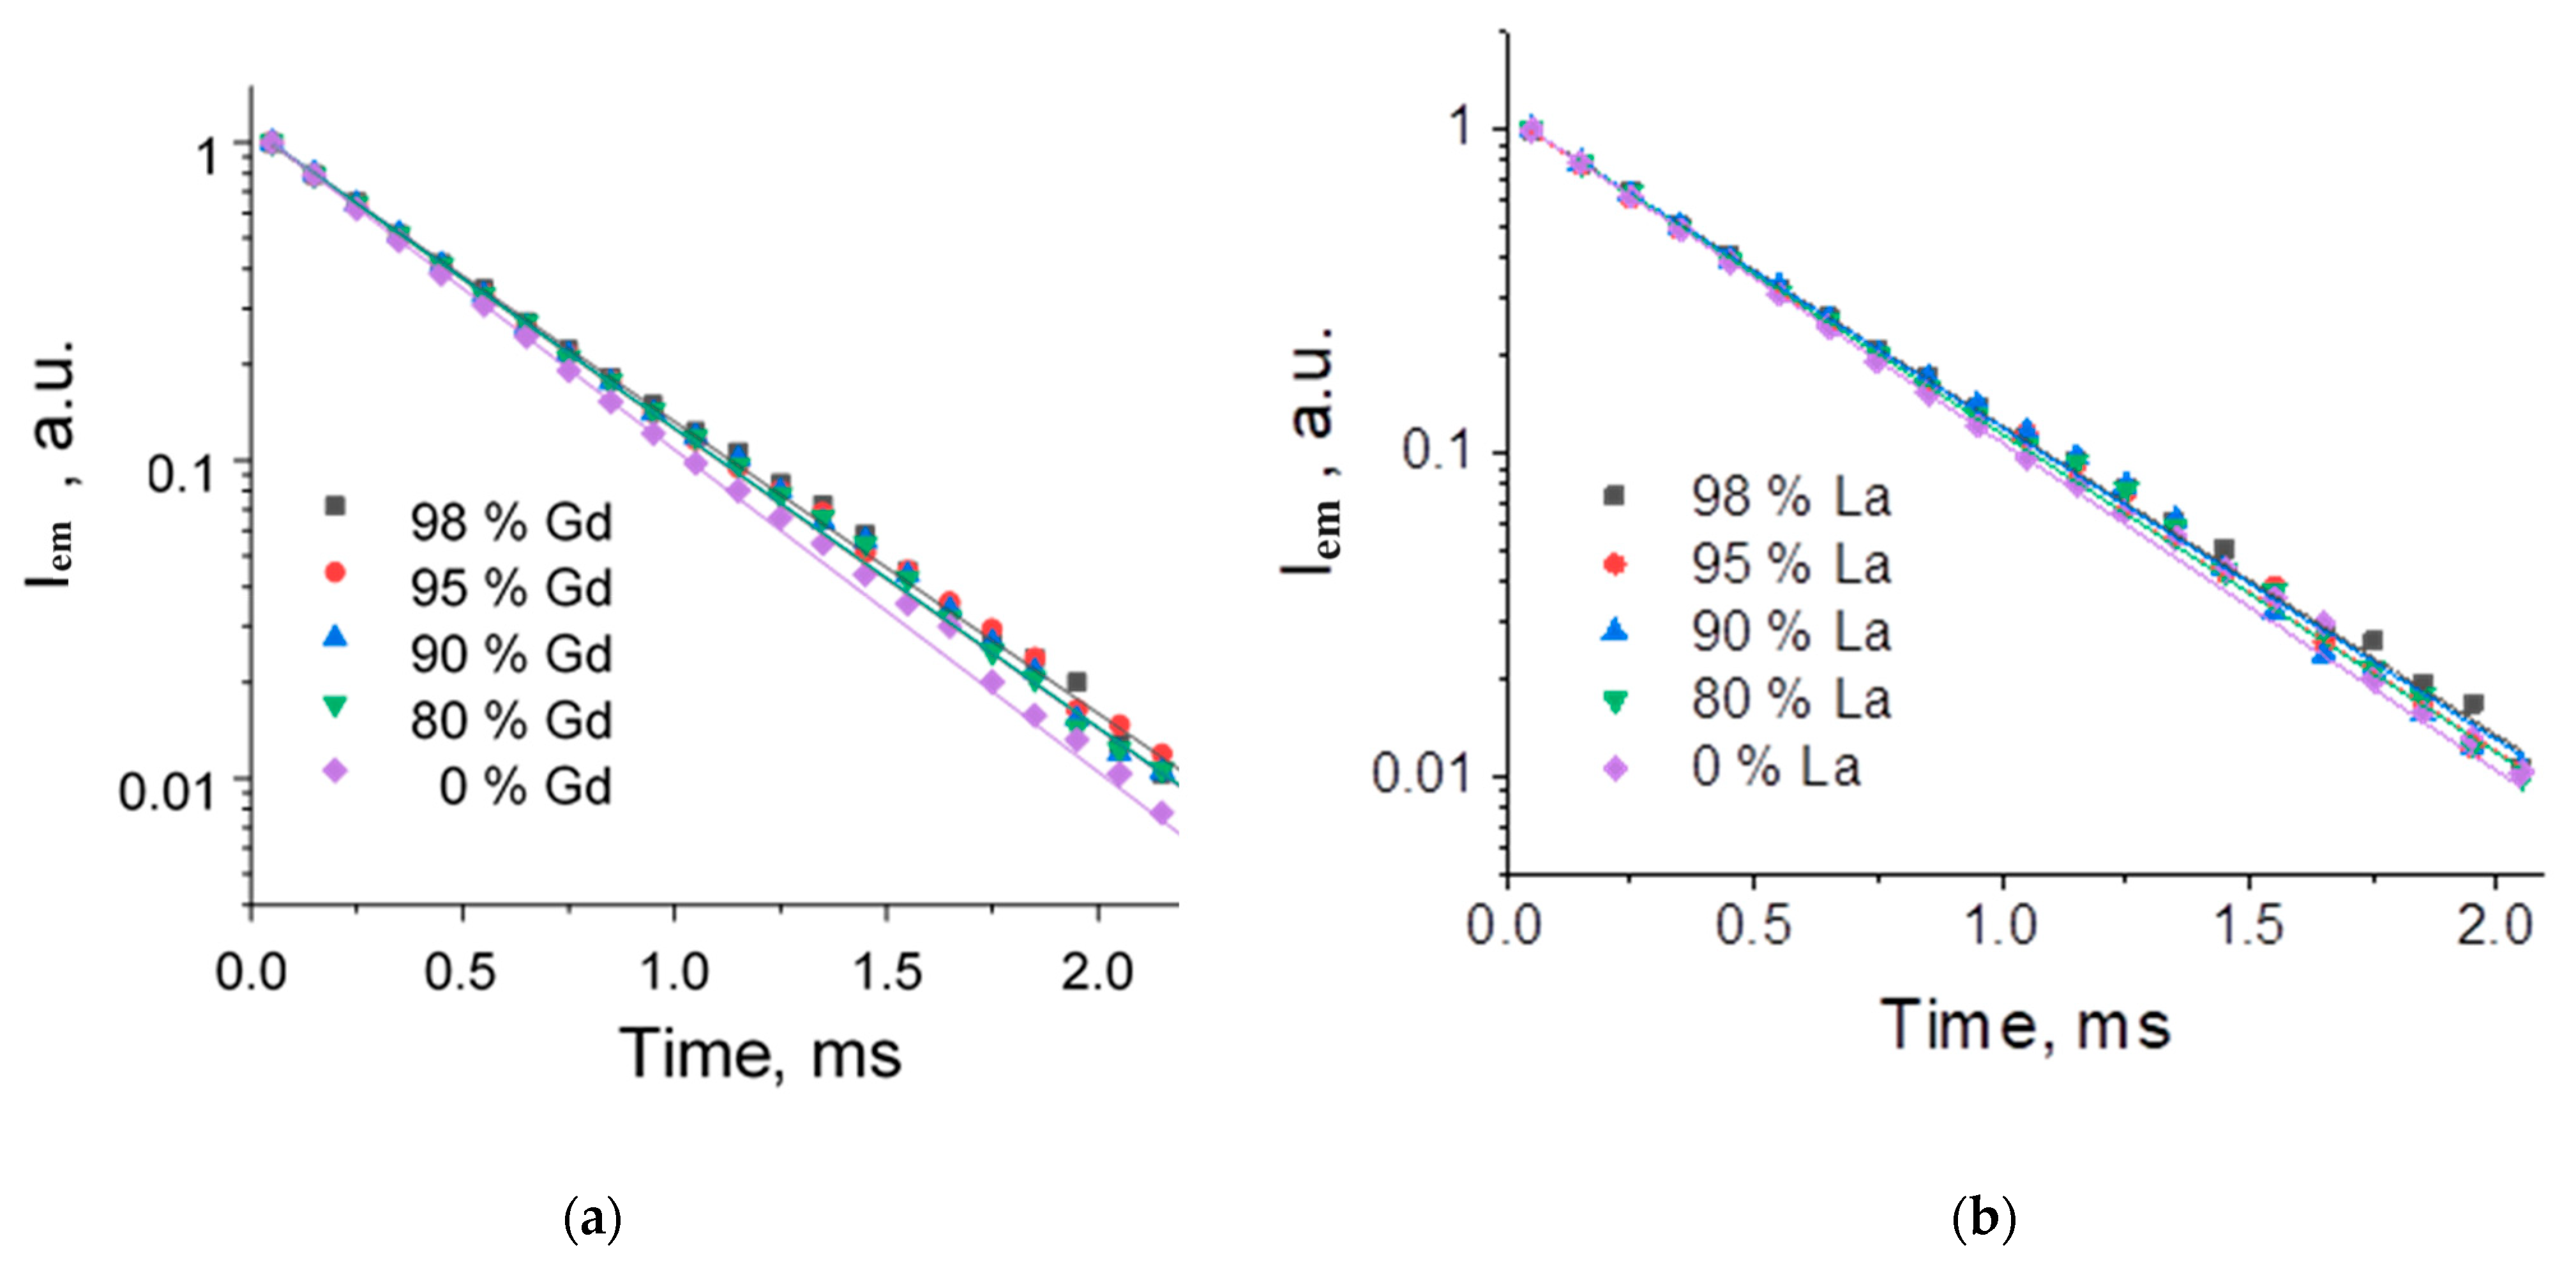
2.3. Luminescence Properties
3. Materials and Methods
3.1. Materials
3.2. Synthesis
3.3. Methods
4. Conclusions
Author Contributions
Funding
Institutional Review Board Statement
Informed Consent Statement
Data Availability Statement
Acknowledgments
Conflicts of Interest
References
- Younis, S.A.; Bhardwaj, N.; Bhardwaj, S.K.; Kim, K.-H.; Deep, A. Rare Earth Metal–Organic Frameworks (RE-MOFs): Synthesis, Properties, and Biomedical Applications. Coord. Chem. Rev. 2021, 429, 213620. [Google Scholar] [CrossRef]
- Neufeld, M.J.; Winter, H.; Landry, M.R.; Goforth, A.M.; Khan, S.; Pratx, G.; Sun, C. Lanthanide Metal–Organic Frameworks for Multispectral Radioluminescent Imaging. ACS Appl. Mater. Interfaces 2020, 12, 26943–26954. [Google Scholar] [CrossRef] [PubMed]
- Xia, N.; Chang, Y.; Zhou, Q.; Ding, S.; Gao, F. An Overview of the Design of Metal-Organic Frameworks-Based Fluorescent Chemosensors and Biosensors. Biosensors 2022, 12, 928. [Google Scholar] [CrossRef] [PubMed]
- Yu, Z.; Kang, S.; Tai, M.; Wang, J.; Tian, Q.; Jin, D.; Wang, L. Synthesis, Modulation, and Characterization of Ln3+ Ions Doped Metal−organic Frameworks for WLED Applications. Dyes Pigments 2023, 209, 110897. [Google Scholar] [CrossRef]
- Zhao, S.-N.; Wang, G.; Poelman, D.; Voort, P. Luminescent Lanthanide MOFs: A Unique Platform for Chemical Sensing. Materials 2018, 11, 572. [Google Scholar] [CrossRef] [PubMed]
- Dou, X.; Sun, K.; Chen, H.; Jiang, Y.; Wu, L.; Mei, J.; Ding, Z.; Xie, J. Nanoscale Metal-Organic Frameworks as Fluorescence Sensors for Food Safety. Antibiotics 2021, 10, 358. [Google Scholar] [CrossRef]
- Puglisi, R.; Pellegrino, A.L.; Fiorenza, R.; Scirè, S.; Malandrino, G. A Facile One-Pot Approach to the Synthesis of Gd-Eu Based Metal-Organic Frameworks and Applications to Sensing of Fe3+ and Cr2O72− Ions. Sensors 2021, 21, 1679. [Google Scholar] [CrossRef]
- Duan, L.; Zhang, C.; Cen, P.; Jin, X.; Liang, C.; Yang, J.; Liu, X. Stable Ln-MOFs as Multi-Responsive Photoluminescence Sensors for the Sensitive Sensing of Fe3+, Cr2O72− and Nitrofuran. CrystEngComm 2020, 22, 1695–1704. [Google Scholar] [CrossRef]
- Kolesnik, S.S.; Nosov, V.G.; Kolesnikov, I.E.; Khairullina, E.M.; Tumkin, I.I.; Vidyakina, A.A.; Sysoeva, A.A.; Ryazantsev, M.N.; Panov, M.S.; Khripun, V.D.; et al. Ultrasound-Assisted Synthesis of Luminescent Micro- and Nanocrystalline Eu-Based MOFs as Luminescent Probes for Heavy Metal Ions. Nanomaterials 2021, 11, 2448. [Google Scholar] [CrossRef]
- Yin, H.-Q.; Wang, X.-Y.; Yin, X.-B. Rotation Restricted Emission and Antenna Effect in Single Metal–Organic Frameworks. J. Am. Chem. Soc. 2019, 141, 15166–15173. [Google Scholar] [CrossRef]
- Wu, J.-Q.; Ma, X.-Y.; Liang, C.-L.; Lu, J.-M.; Shi, Q.; Shao, L.-X. Design of an Antenna Effect Eu(III)-Based Metal–Organic Framework for Highly Selective Sensing of Fe3+. Dalton Trans. 2022, 51, 2890–2897. [Google Scholar] [CrossRef] [PubMed]
- Alammar, T.; Hlova, I.Z.; Gupta, S.; Biswas, A.; Ma, T.; Zhou, L.; Balema, V.; Pecharsky, V.K.; Mudring, A.-V. Mechanochemical Synthesis, Luminescent and Magnetic Properties of Lanthanide Benzene-1,4-Dicarboxylate Coordination Polymers (Ln0.5Gd0.5)2 (1,4-BDC)3(H2O)4; Ln = Sm, Eu, Tb. New J. Chem. 2020, 44, 1054–1062. [Google Scholar] [CrossRef]
- Cabral Campello, M.P.; Palma, E.; Correia, I.; Paulo, P.M.R.; Matos, A.; Rino, J.; Coimbra, J.; Pessoa, J.C.; Gambino, D.; Paulo, A.; et al. Lanthanide Complexes with Phenanthroline-Based Ligands: Insights into Cell Death Mechanisms Obtained by Microscopy Techniques. Dalton Trans. 2019, 48, 4611–4624. [Google Scholar] [CrossRef] [PubMed]
- Decadt, R.; Van Hecke, K.; Depla, D.; Leus, K.; Weinberger, D.; Van Driessche, I.; Van Der Voort, P.; Van Deun, R. Synthesis, Crystal Structures, and Luminescence Properties of Carboxylate Based Rare-Earth Coordination Polymers. Inorg. Chem. 2012, 51, 11623–11634. [Google Scholar] [CrossRef] [PubMed]
- Massi, M.; Ogden, M. Luminescent Lanthanoid Calixarene Complexes and Materials. Materials 2017, 10, 1369. [Google Scholar] [CrossRef]
- Alpha, B.; Ballardini, R.; Balzani, V.; Lehn, J.; Perathoner, S.; Sabbatini, N. Antenna Effect in Luminescent Lanthanide Cryptates: A Photophysical Study. Photochem. Photobiol. 1990, 52, 299–306. [Google Scholar] [CrossRef]
- Orlova, A.V.; Kozhevnikova, V.Y.; Lepnev, L.S.; Goloveshkin, A.S.; Le-Deigen, I.M.; Utochnikova, V.V. NIR Emitting Terephthalates (SmxDyyGd1−x−y)2(Tph)3(H2O)4 for Luminescence Thermometry in the Physiological Range. J. Rare Earths 2020, 38, 492–497. [Google Scholar] [CrossRef]
- Utochnikova, V.V.; Grishko, A.Y.; Koshelev, D.S.; Averin, A.A.; Lepnev, L.S.; Kuzmina, N.P. Lanthanide Heterometallic Terephthalates: Concentration Quenching and the Principles of the “Multiphotonic Emission”. Opt. Mater. 2017, 74, 201–208. [Google Scholar] [CrossRef]
- Nosov, V.G.; Toikka, Y.N.; Petrova, A.S.; Butorlin, O.S.; Kolesnikov, I.E.; Orlov, S.N.; Ryazantsev, M.N.; Kolesnik, S.S.; Bogachev, N.A.; Skripkin, M.Y.; et al. Brightly Luminescent (TbxLu1−x)2bdc3·nH2O MOFs: Effect of Synthesis Conditions on Structure and Luminescent Properties. Molecules 2023, 28, 2378. [Google Scholar] [CrossRef]
- Nosov, V.G.; Kupryakov, A.S.; Kolesnikov, I.E.; Vidyakina, A.A.; Tumkin, I.I.; Kolesnik, S.S.; Ryazantsev, M.N.; Bogachev, N.A.; Skripkin, M.Y.; Mereshchenko, A.S. Heterometallic Europium(III)–Lutetium(III) Terephthalates as Bright Luminescent Antenna MOFs. Molecules 2022, 27, 5763. [Google Scholar] [CrossRef]
- Kudyakova, Y.S.; Slepukhin, P.A.; Valova, M.S.; Burgart, Y.V.; Saloutin, V.I.; Bazhin, D.N. The Impact of the Alkali Metal Ion on the Crystal Structure and (Mechano)Luminescence of Terbium(III) Tetrakis(Β-diketonates). Eur. J. Inorg. Chem. 2020, 2020, 523–531. [Google Scholar] [CrossRef]
- Mironova, O.A.; Ryadun, A.A.; Sukhikh, T.S.; Konchenko, S.N.; Pushkarevsky, N.A. Synthesis and Luminescence Studies of Lanthanide Complexes (Gd, Tb, Dy) with Phenyl- and 2-Pyridylthiolates Supported by a Bulky β-Diketiminate Ligand. Impact of the Ligand Environment on Terbium(III) Emission. New J. Chem. 2020, 44, 19769–19779. [Google Scholar] [CrossRef]
- Judd, B.R. Optical Absorption Intensities of Rare-Earth Ions. Phys. Rev. 1962, 127, 750–761. [Google Scholar] [CrossRef]
- Ofelt, G.S. Intensities of Crystal Spectra of Rare-Earth Ions. J Chem Phys 1962, 37, 511–520. [Google Scholar] [CrossRef]
- Reineke, T.M.; Eddaoudi, M.; Fehr, M.; Kelley, D.; Yaghi, O.M. From Condensed Lanthanide Coordination Solids to Microporous Frameworks Having Accessible Metal Sites. J. Am. Chem. Soc. 1999, 121, 1651–1657. [Google Scholar] [CrossRef]
- Daiguebonne, C.; Kerbellec, N.; Guillou, O.; Bünzli, J.-C.; Gumy, F.; Catala, L.; Mallah, T.; Audebrand, N.; Gérault, Y.; Bernot, K.; et al. Structural and Luminescent Properties of Micro- and Nanosized Particles of Lanthanide Terephthalate Coordination Polymers. Inorg. Chem. 2008, 47, 3700–3708. [Google Scholar] [CrossRef]
- Feng, S. Poly[Hexaaquabis(μ3-Terephthalato)(μ2-Terephthalato)Diytterbium(III)]. Acta Crystallogr. Sect. E Struct. Rep. Online 2010, 66, m33. [Google Scholar] [CrossRef]
- Wang, P.; Li, Z.-F.; Song, L.-P.; Wang, C.-X.; Chen, Y. Catena -Poly[[[μ-Benzene-1,4-Dicarboxylato-Bis[Tetraaqualutetium(III)]]-Di-μ-Benzene-1,4-Dicarboxylato] Dihydrate]. Acta Crystallogr. Sect. E Struct. Rep. Online 2006, 62, m253–m255. [Google Scholar] [CrossRef]
- Mowat, J.P.S.; Miller, S.R.; Griffin, J.M.; Seymour, V.R.; Ashbrook, S.E.; Thompson, S.P.; Fairen-Jimenez, D.; Banu, A.-M.; Düren, T.; Wright, P.A. Structural Chemistry, Monoclinic-to-Orthorhombic Phase Transition, and CO2 Adsorption Behavior of the Small Pore Scandium Terephthalate, Sc2(O2CC6H4CO2)3, and Its Nitro- And Amino-Functionalized Derivatives. Inorg. Chem. 2011, 50, 10844–10858. [Google Scholar] [CrossRef]
- Pan, L.; Zheng, N.; Wu, Y.; Han, S.; Yang, R.; Huang, X.; Li, J. Synthesis, Characterization and Structural Transformation of A Condensed Rare Earth Metal Coordination Polymer. Inorg. Chem. 2001, 40, 828–830. [Google Scholar] [CrossRef]
- Holland, T.J.B.; Redfern, S.A.T. Unit Cell Refinement from Powder Diffraction Data: The Use of Regression Diagnostics. Mineral. Mag. 1997, 61, 65–77. [Google Scholar] [CrossRef]
- Pawley, G.S. Unit-Cell Refinement from Powder Diffraction Scans. J. Appl. Crystallogr. 1981, 14, 357–361. [Google Scholar] [CrossRef]
- Shannon, R.D. Revised Effective Ionic Radii and Systematic Studies of Interatomic Distances in Halides and Chalcogenides. Acta. Crystallogr. Sect. A 1976, 32, 751–767. [Google Scholar] [CrossRef]
- Bangham, A.D. A Correlation between Surface Charge and Coagulant Action of Phospholipids. Nature 1961, 192, 1197–1198. [Google Scholar] [CrossRef]
- Kolesnikov, I.E.; Povolotskiy, A.V.; Mamonova, D.V.; Kolesnikov, E.Y.; Kurochkin, A.V.; Lähderanta, E.; Mikhailov, M.D. Asymmetry Ratio as a Parameter of Eu3+ Local Environment in Phosphors. J. Rare Earths 2018, 36, 474–481. [Google Scholar] [CrossRef]
- Sudarsan, V.; van Veggel, F.C.J.M.; Herring, R.A.; Raudsepp, M. Surface Eu3+ Ions Are Different than “Bulk” Eu3+ Ions in Crystalline Doped LaF3 Nanoparticles. J. Mater. Chem. 2005, 15, 1332–1342. [Google Scholar] [CrossRef]
- Golyeva, E.V.; Kolesnikov, I.E.; Lähderanta, E.; Kurochkin, A.V.; Mikhailov, M.D. Effect of Synthesis Conditions on Structural, Morphological and Luminescence Properties of MgAl2O4:Eu3+ Nanopowders. J. Lumin. 2018, 194, 387–393. [Google Scholar] [CrossRef]
- Park, K.; Kim, H.; Hakeem, D.A. Effect of Host Composition and Eu3+ Concentration on the Photoluminescence of Aluminosilicate (Ca,Sr)2Al2SiO7:Eu3+ Phosphors. Dye. Pigment. 2017, 136, 70–77. [Google Scholar] [CrossRef]
- Oomen, E.W.J.L.; van Dongen, A.M.A. Europium (III) in Oxide Glasses. J. Non-Cryst. Solids 1989, 111, 205–213. [Google Scholar] [CrossRef]
- Schwarzenbach, G.; Flashka, H. Complexometric Titrations, 2nd ed.; Methuen: London, UK, 1969. [Google Scholar]


| χLu (at.%) | a, Å | b, Å | c, Å | α | β | γ | V, Å3 |
|---|---|---|---|---|---|---|---|
| 0 | 6.1860 ± 0.0018 | 10.103 ± 0.003 | 10.184 ± 0.003 | 102.279 ± 0.026 | 91.423 ± 0.027 | 101.482 ± 0.028 | 608.00 ± 0.24 |
| 80 | 6.1435 ± 0.0018 | 10.014 ± 0.003 | 10.061 ± 0.003 | 101.985 ± 0.026 | 91.683 ± 0.026 | 101.232 ± 0.028 | 592.26 ± 0.23 |
| 90 | 6.0896 ± 0.0018 | 9.994 ± 0.003 | 9.971 ± 0.003 | 101.466 ± 0.026 | 91.631 ± 0.026 | 100.876 ± 0.028 | 582.66 ± 0.23 |
| χLa (at.%) | a, Å | b, Å | c, Å | α | β | γ | V, Å3 |
| 0 | 6.1860 ± 0.0018 | 10.103 ± 0.003 | 10.184 ± 0.003 | 102.279 ± 0.026 | 91.423 ± 0.027 | 101.482 ± 0.028 | 608.00 ± 0.24 |
| 80 | 6.2261 ± 0.0018 | 10.142 ± 0.003 | 10.273 ± 0.003 | 102.127 ± 0.026 | 91.657 ± 0.027 | 101.507 ± 0.028 | 619.84 ± 0.24 |
| 90 | 6.2477 ± 0.0019 | 10.198 ± 0.004 | 10.292 ± 0.003 | 102.169 ± 0.026 | 91.599 ± 0.027 | 101.513 ± 0.028 | 626.41 ± 0.25 |
| 95 | 6.2632 ± 0.0019 | 10.197 ± 0.004 | 10.308 ± 0.003 | 102.235 ± 0.026 | 91.537 ± 0.027 | 101.565 ± 0.028 | 628.68 ± 0.25 |
| 98 | 6.2412 ± 0.0005 | 10.159 ± 0.008 | 10.283 ± 0.013 | 102.32± 0.18 | 91.53 ± 0.15 | 101.78 ± 0.12 | 621.85 ± 0.25 |
| 100 | 6.2691 ± 0.0019 | 10.206 ± 0.004 | 10.336 ± 0.003 | 102.260 ± 0.026 | 91.552 ± 0.027 | 101.495 ± 0.028 | 631.61 ± 0.25 |
| χGd (at.%) | a, Å | b, Å | c, Å | α | β | γ | V, Å3 |
| 0 | 6.1860 ± 0.0018 | 10.103 ± 0.003 | 10.184 ± 0.003 | 102.279 ± 0.026 | 91.423 ± 0.027 | 101.482 ± 0.028 | 608.00 ± 0.24 |
| 80 | 6.2368 ± 0.0019 | 10.036 ± 0.003 | 10.251 ± 0.003 | 102.879 ± 0.026 | 91.989 ± 0.027 | 101.617 ± 0.028 | 610.54 ± 0.23 |
| 90 | 6.1611 ± 0.0018 | 10.077 ± 0.003 | 10.148 ± 0.003 | 102.212 ± 0.026 | 91.258 ± 0.026 | 101.411 ± 0.028 | 602.25 ± 0.23 |
| 95 | 6.2354 ± 0.0019 | 10.031 ± 0.003 | 10.234 ± 0.003 | 102.829 ± 0.026 | 91.931 ± 0.027 | 101.480 ± 0.028 | 609.61 ± 0.23 |
| 98 | 6.2235 ± 0.0018 | 9.995 ± 0.003 | 10.238 ± 0.003 | 103.065 ± 0.026 | 91.812 ± 0.027 | 101.641 ± 0.027 | 605.60 ± 0.23 |
| 100 | 6.2112 ± 0.0018 | 9.992 ± 0.003 | 10.227 ± 0.003 | 102.810 ± 0.026 | 92.048 ± 0.027 | 101.481 ± 0.027 | 604.40 ± 0.23 |
| (Eu1-xLax)2bdc3·nH2O | (Eu1-xGdx)2bdc3·nH2O | (Eu1-xLux)2bdc3·nH2O | ||||||
|---|---|---|---|---|---|---|---|---|
| χLa (at.%) | width, μm | length, μm | χGd (at.%) | width, μm | length, μm | χLu (at.%) | width, μm | length, μm |
| 100 | 2.7 ± 1.2 | 8.7 ± 2.2 | 100 | 2.2 ± 1.3 | 5.8 ± 2.7 | 100 | 8.2 ± 3.6 | 12 ± 4 |
| 98 | 1.9 ± 0.6 | 5.3 ± 1.4 | 98 | 2.7 ± 1.1 | 5.8 ± 1.9 | 98 | 5.1 ± 1.5 | 8.0 ± 2.3 |
| 95 | 3.1 ± 0.9 | 8.5 ± 2.5 | 95 | 1.7 ± 0.6 | 4.2 ± 1.1 | 95 | 4.6 ± 1.2 | 7.5 ± 1.2 |
| 90 | 2.8 ± 1.0 | 7.4 ± 2.1 | 90 | 3.0 ± 0.8 | 7.4 ± 2.1 | 90 | 0.8 ± 0.3 | 4.9 ± 1.3 |
| 80 | 2.7 ± 1.0 | 6.5 ± 1.7 | 80 | 3.0 ± 1.0 | 7.0 ± 2.1 | 80 | 0.8 ± 0.4 | 3.5 ± 1.6 |
| 0 | 1.6 ± 0.8 | 3.9 ± 1.9 | 0 | 1.6 ± 0.8 | 3.9 ± 1.9 | 0 | 1.6 ± 0.8 | 3.9 ± 1.9 |
| (Eu1-xLax)2bdc3·nH2O | (Eu1-xGdx)2bdc3·nH2O | (Eu1-xLux)2bdc3·nH2O | |||||
|---|---|---|---|---|---|---|---|
| χLn (at.%) | τ, ms | ΦPL, % | τ, ms | ΦPL, % | τ1, ms | τ2, ms | ΦPL, % |
| 98 | 0.45 ± 0.01 | 9 ± 1 | 0.47 ± 0.01 | 10 ± 1 | 0.41 ± 0.01 (91.4%) | 1.54 ± 0.18 (8.6%) | 16 ± 1 |
| 95 | 0.44 ± 0.01 | 10 ± 1 | 0.46 ± 0.01 | 12 ± 1 | 0.34 ± 0.01 (85.9%) | 1.62 ± 0.08 (14.1%) | 23 ± 1 |
| 90 | 0.45 ± 0.01 | 9 ± 1 | 0.46 ± 0.01 | 13 ± 1 | 0.46 ± 0.01 | - | 11 ± 1 |
| 80 | 0.44 ± 0.01 | 10 ± 1 | 0.46 ± 0.01 | 12 ± 1 | 0.46 ± 0.01 | - | 12 ± 1 |
| 0 | 0.43 ± 0.01 | 10 ± 1 | 0.43 ± 0.01 | 10 ± 1 | 0.43 ± 0.01 | - | 10 ± 1 |
| χLa (at.%) | (Eu1-xLax)2bdc3·nH2O | (Eu1-xGdx)2bdc3·nH2O | (Eu1-xLux)2bdc3·nH2O |
|---|---|---|---|
| 98 | 3.8 ± 0.3 | 3.8 ± 0.3 | 3.0 ± 0.3 |
| 95 | 3.9 ± 0.3 | 3.8 ± 0.3 | 2.9 ± 0.3 |
| 90 | 3.9 ± 0.3 | 3.9 ± 0.3 | 3.5 ± 0.3 |
| 80 | 3.9 ± 0.3 | 3.7 ± 0.3 | 3.7 ± 0.3 |
| 0 | 3.7 ± 0.3 | 3.7 ± 0.3 | 3.7 ± 0.3 |
| χLn (at.%) | C(Eu3+), mM | C(Ln3+), mM |
|---|---|---|
| 100 | 0 | 5.0 |
| 98 | 0.1 | 4.9 |
| 95 | 0.25 | 4.75 |
| 90 | 0.5 | 4.5 |
| 80 | 1.0 | 4.0 |
| 0 | 5.0 | 0 |
| (Eu1-xLax)2bdc3·nH2O | (Eu1-xGdx)2bdc3·nH2O | (Eu1-xLux)2bdc3·nH2O | |||
|---|---|---|---|---|---|
| χLa (at.%), Taken | χLa (at.%), EDX | χGd (at.%), Taken | χGd (at.%), EDX | χLu (at.%), Taken | χLu (at.%), EDX |
| 100 | 100 | 100 | 100 | 100 | 100 |
| 98 | 97.4 ± 0.9 | 98 | 98 ± 1 | 98 | 98 ± 1 |
| 95 | 94.7 ± 0.6 | 95 | 95.4 ± 0.6 | 95 | 94 ± 3 |
| 90 | 89.4 ± 0.5 | 90 | 90.2 ± 0.8 | 90 | 91 ± 4 |
| 80 | 79.7 ± 2.3 | 80 | 81.1 ± 1.2 | 80 | 79 ± 6 |
| 0 | 0 | 0 | 0 | 0 | 0 |
Disclaimer/Publisher’s Note: The statements, opinions and data contained in all publications are solely those of the individual author(s) and contributor(s) and not of MDPI and/or the editor(s). MDPI and/or the editor(s) disclaim responsibility for any injury to people or property resulting from any ideas, methods, instructions or products referred to in the content. |
© 2024 by the authors. Licensee MDPI, Basel, Switzerland. This article is an open access article distributed under the terms and conditions of the Creative Commons Attribution (CC BY) license (https://creativecommons.org/licenses/by/4.0/).
Share and Cite
Kolesnik, S.S.; Bogachev, N.A.; Kolesnikov, I.E.; Orlov, S.N.; Ryazantsev, M.N.; González, G.; Skripkin, M.Y.; Mereshchenko, A.S. Microcrystalline Luminescent (Eu1-xLnx)2bdc3·nH2O (Ln = La, Gd, Lu) Antenna MOFs: Effect of Dopant Content on Structure, Particle Morphology, and Luminescent Properties. Molecules 2024, 29, 532. https://doi.org/10.3390/molecules29020532
Kolesnik SS, Bogachev NA, Kolesnikov IE, Orlov SN, Ryazantsev MN, González G, Skripkin MY, Mereshchenko AS. Microcrystalline Luminescent (Eu1-xLnx)2bdc3·nH2O (Ln = La, Gd, Lu) Antenna MOFs: Effect of Dopant Content on Structure, Particle Morphology, and Luminescent Properties. Molecules. 2024; 29(2):532. https://doi.org/10.3390/molecules29020532
Chicago/Turabian StyleKolesnik, Stefaniia S., Nikita A. Bogachev, Ilya E. Kolesnikov, Sergey N. Orlov, Mikhail N. Ryazantsev, Gema González, Mikhail Yu. Skripkin, and Andrey S. Mereshchenko. 2024. "Microcrystalline Luminescent (Eu1-xLnx)2bdc3·nH2O (Ln = La, Gd, Lu) Antenna MOFs: Effect of Dopant Content on Structure, Particle Morphology, and Luminescent Properties" Molecules 29, no. 2: 532. https://doi.org/10.3390/molecules29020532
APA StyleKolesnik, S. S., Bogachev, N. A., Kolesnikov, I. E., Orlov, S. N., Ryazantsev, M. N., González, G., Skripkin, M. Y., & Mereshchenko, A. S. (2024). Microcrystalline Luminescent (Eu1-xLnx)2bdc3·nH2O (Ln = La, Gd, Lu) Antenna MOFs: Effect of Dopant Content on Structure, Particle Morphology, and Luminescent Properties. Molecules, 29(2), 532. https://doi.org/10.3390/molecules29020532