

Optimization of Antioxidant Activity of Compounds Generated during Ginseng Extract Fermentation Supplemented with Lactobacillus
 , , , , , , , and
Abstract
: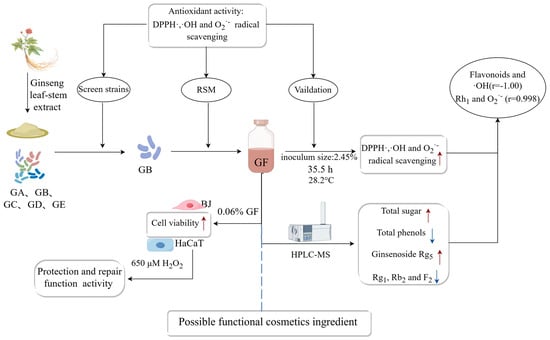
1. Introduction
2. Results and Discussion
2.1. Antioxidant and β-Glucosidase Activities of the Lactobacillaceae Strains
2.2. Preliminary Screening for Culture Conditions
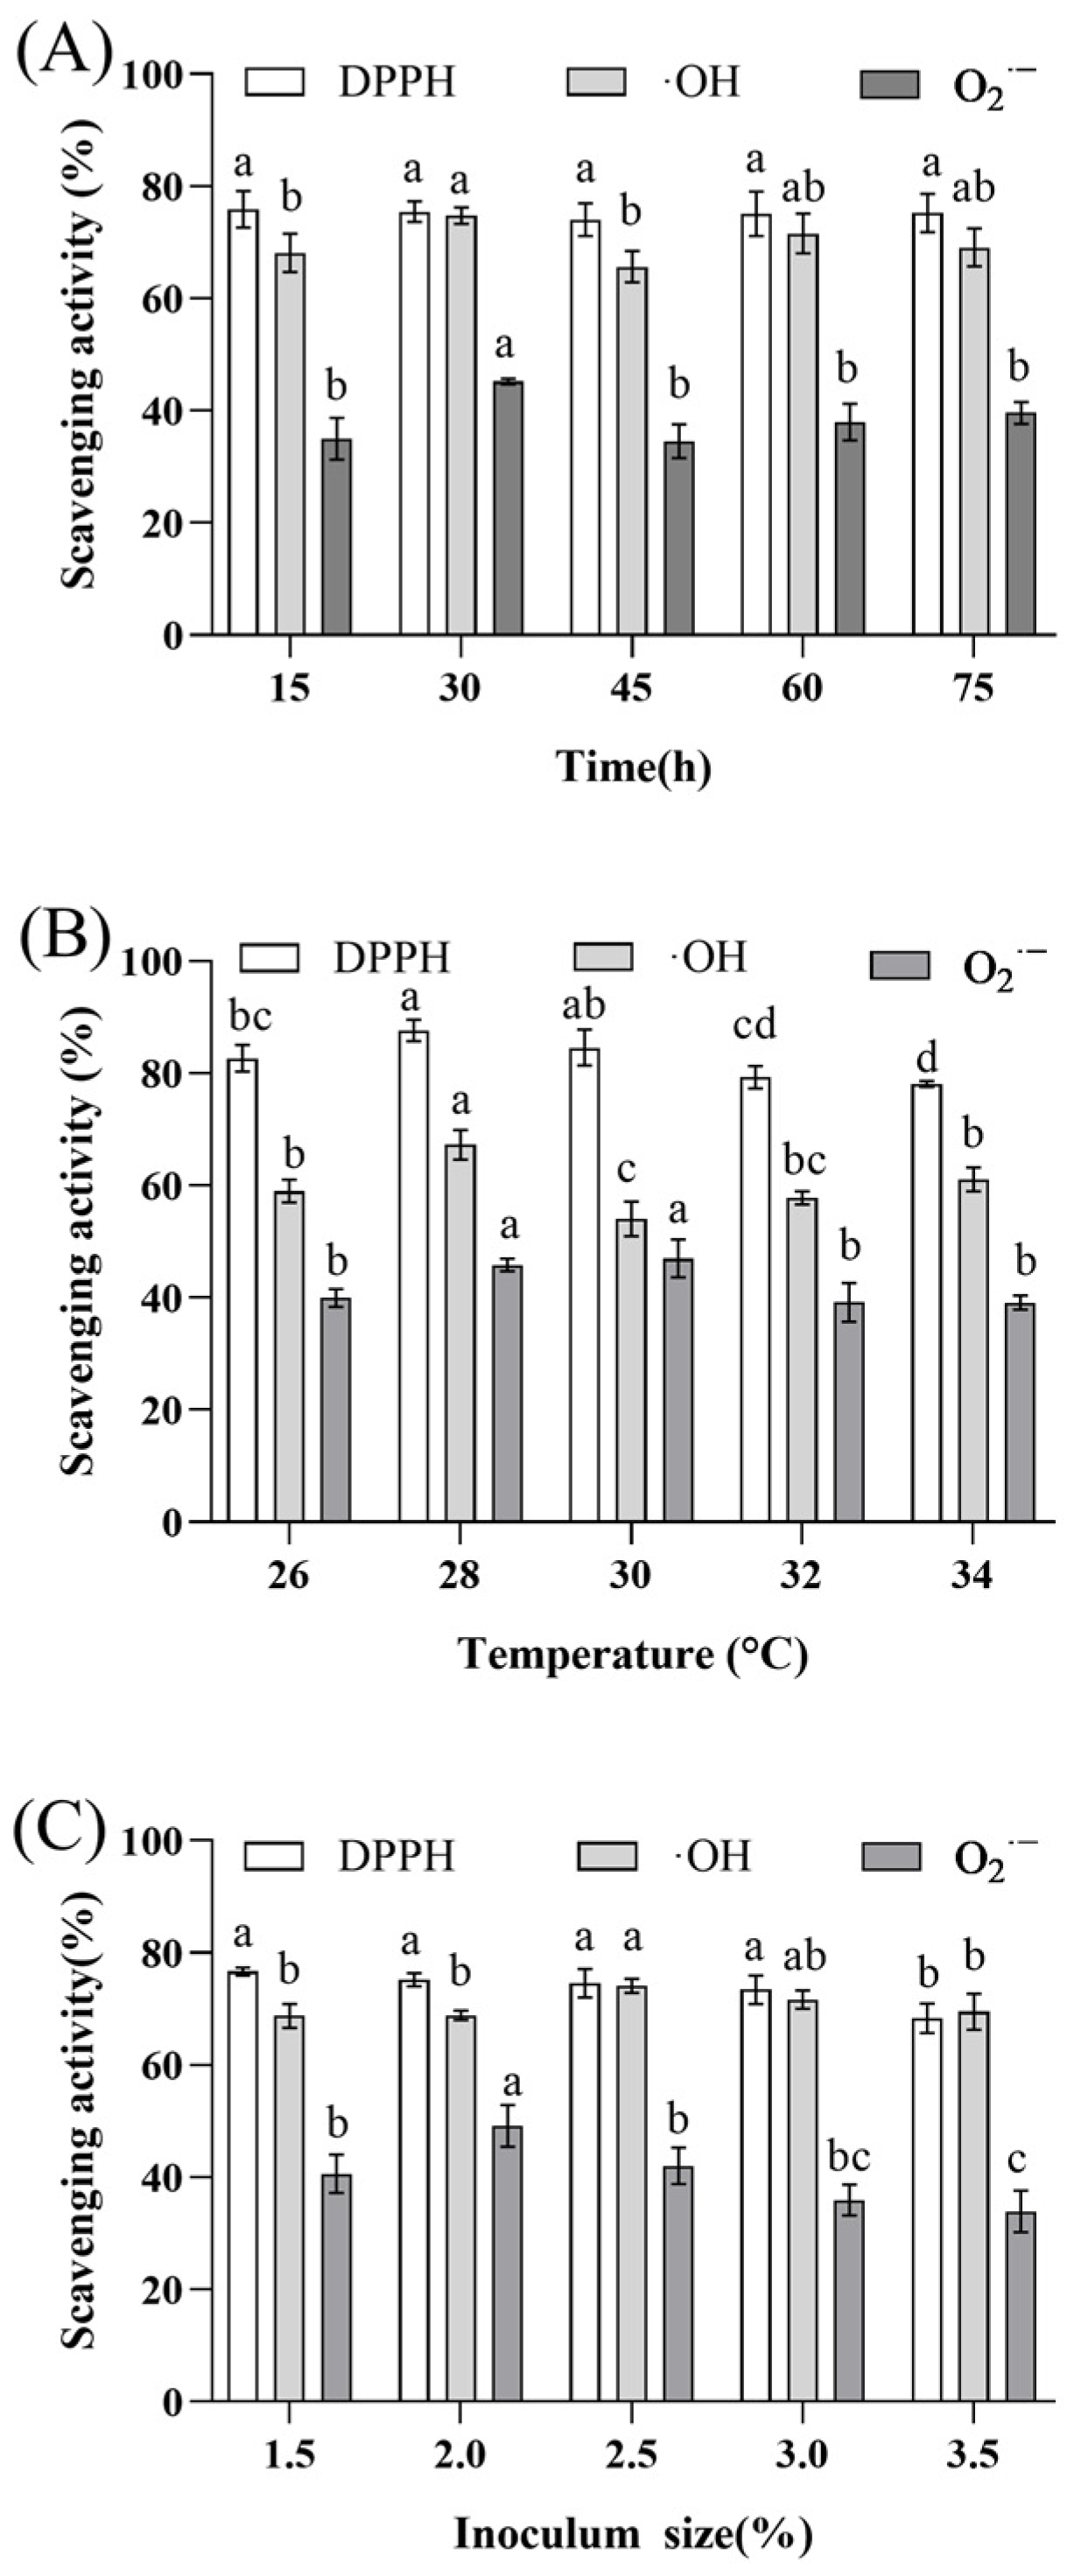
2.2.1. Effect of Fermentation Time on Capacity to Scavenge Radicals
2.2.2. Effect of Fermentation Temperature on Capacity to Scavenge Radicals
2.2.3. Effect of Inoculum Size on Capacity to Scavenge Radicals
2.3. Response Surface Optimization
2.3.1. Box–Behnken Experimental Design and Model Fitting
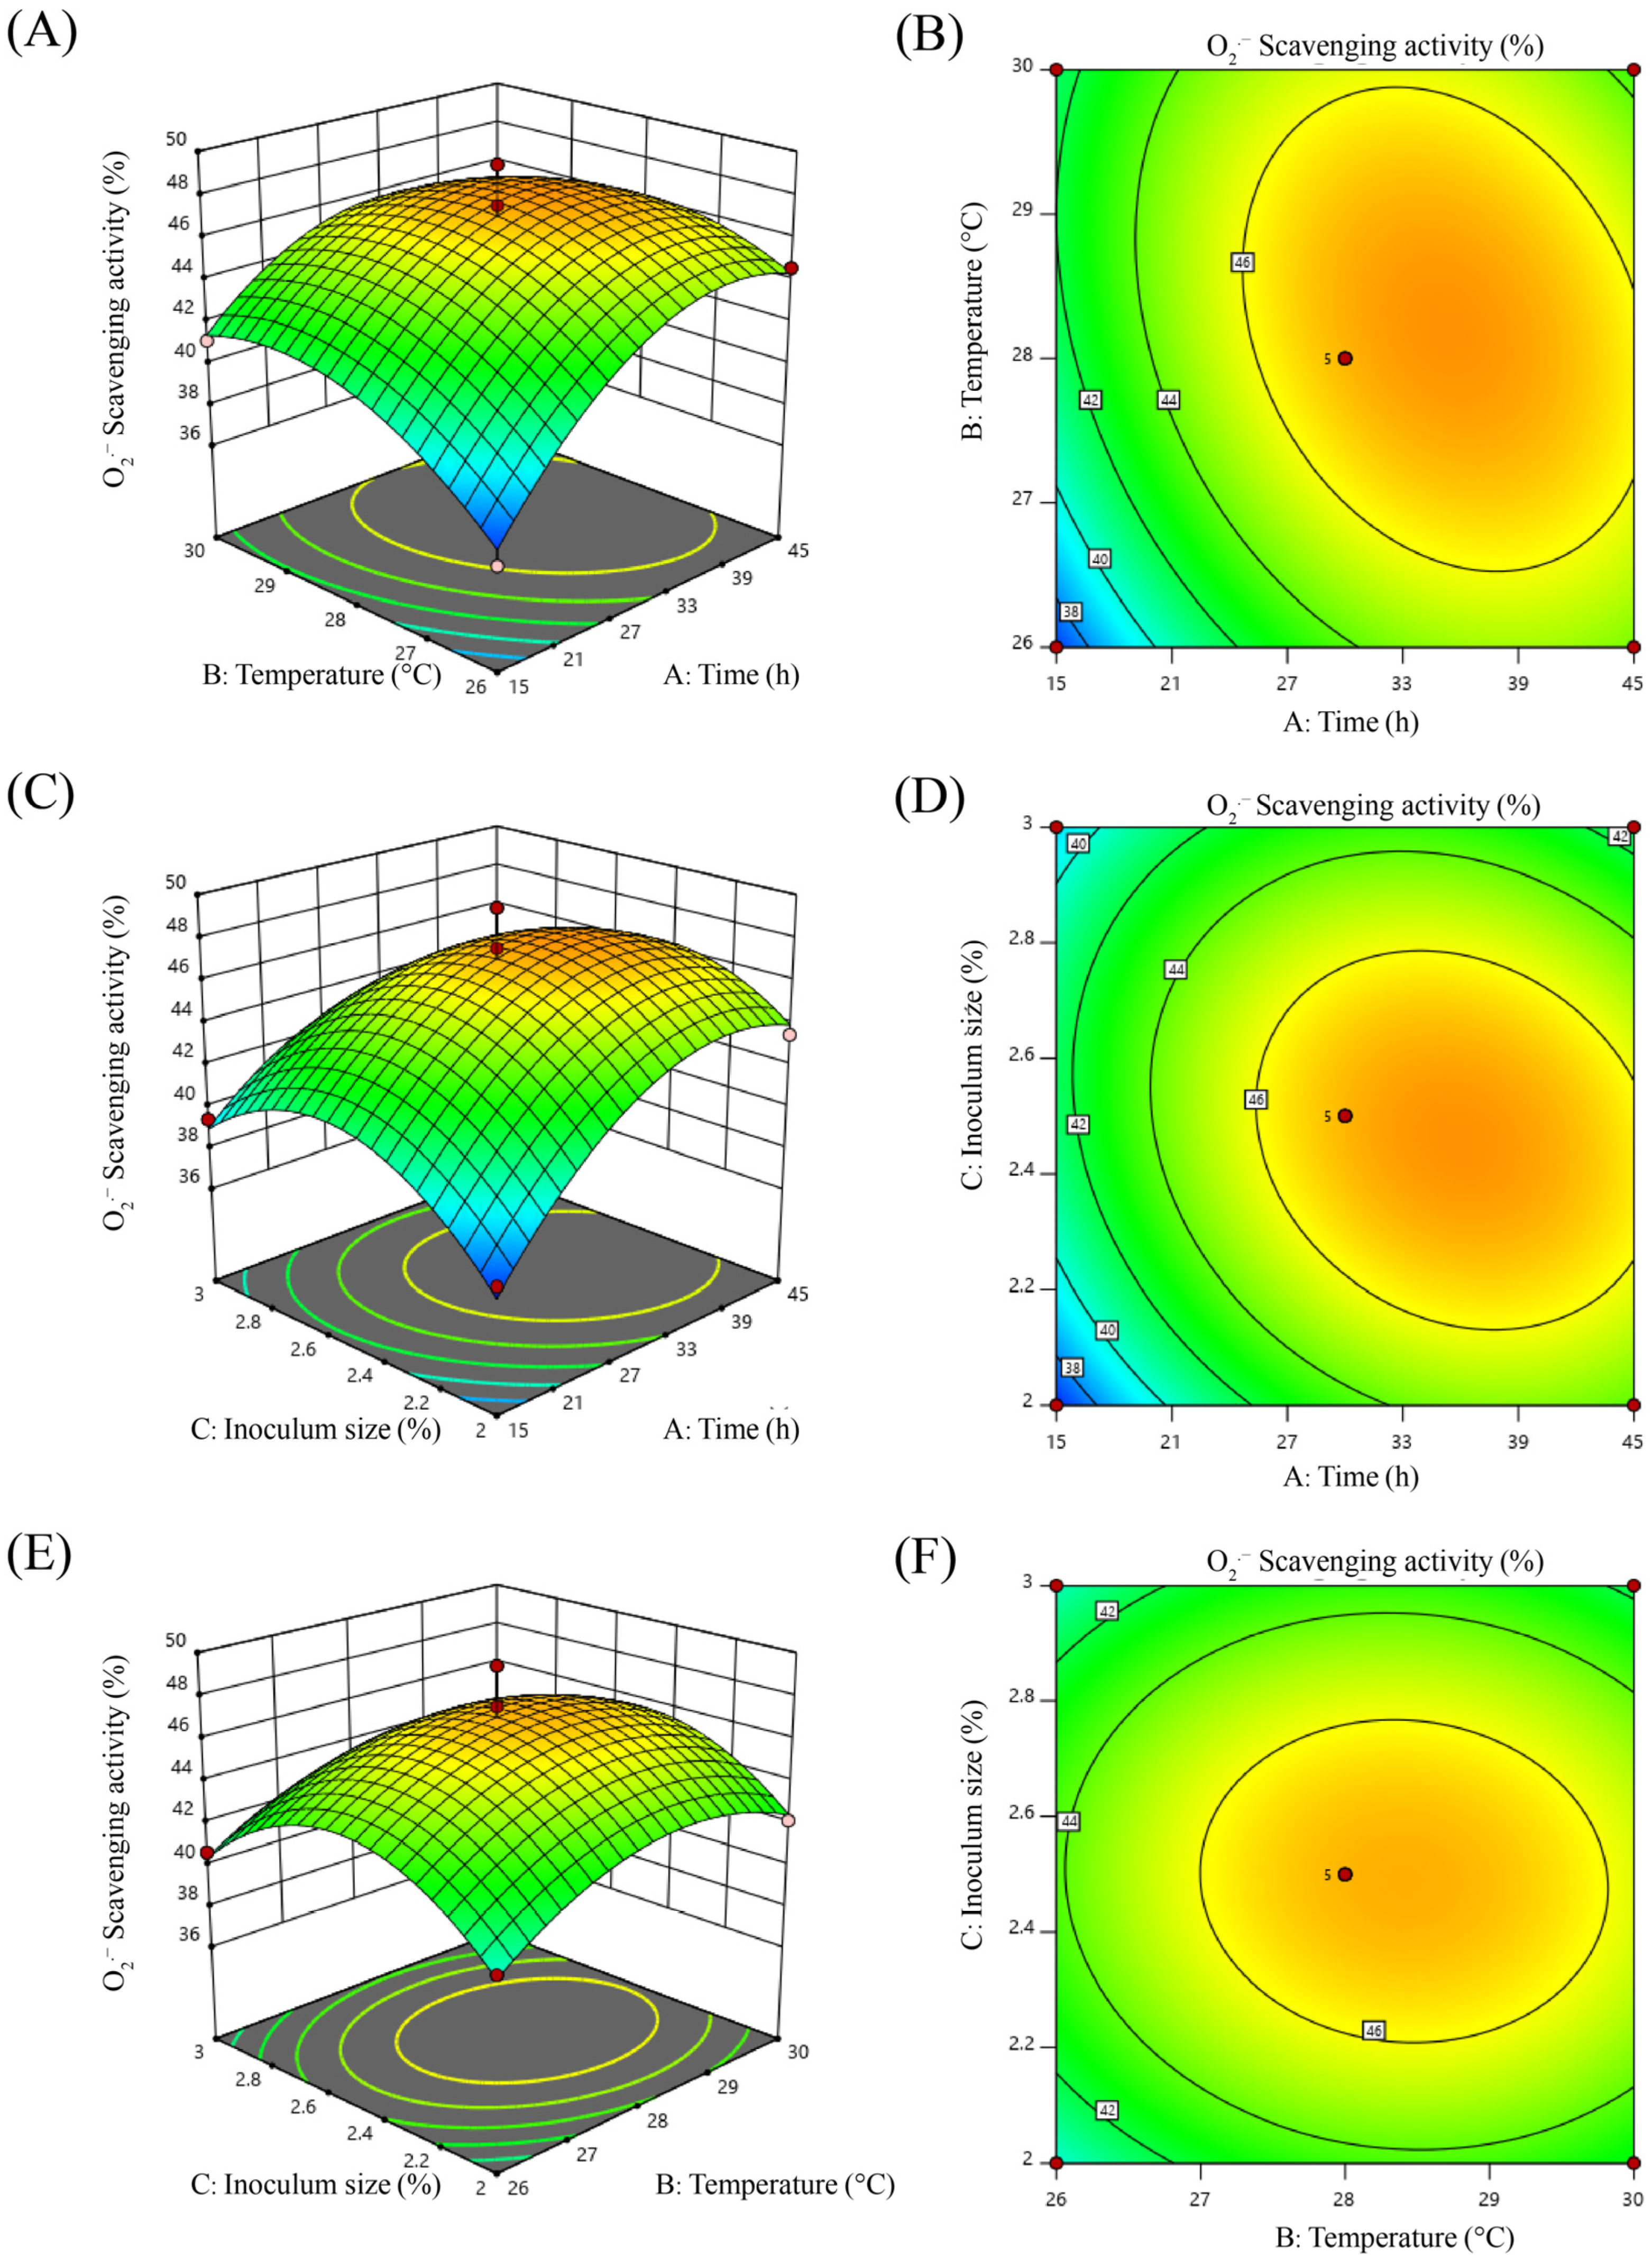
2.3.2. Response Surface and Contour Plot Analysis
2.3.3. Optimal Fermentation Process
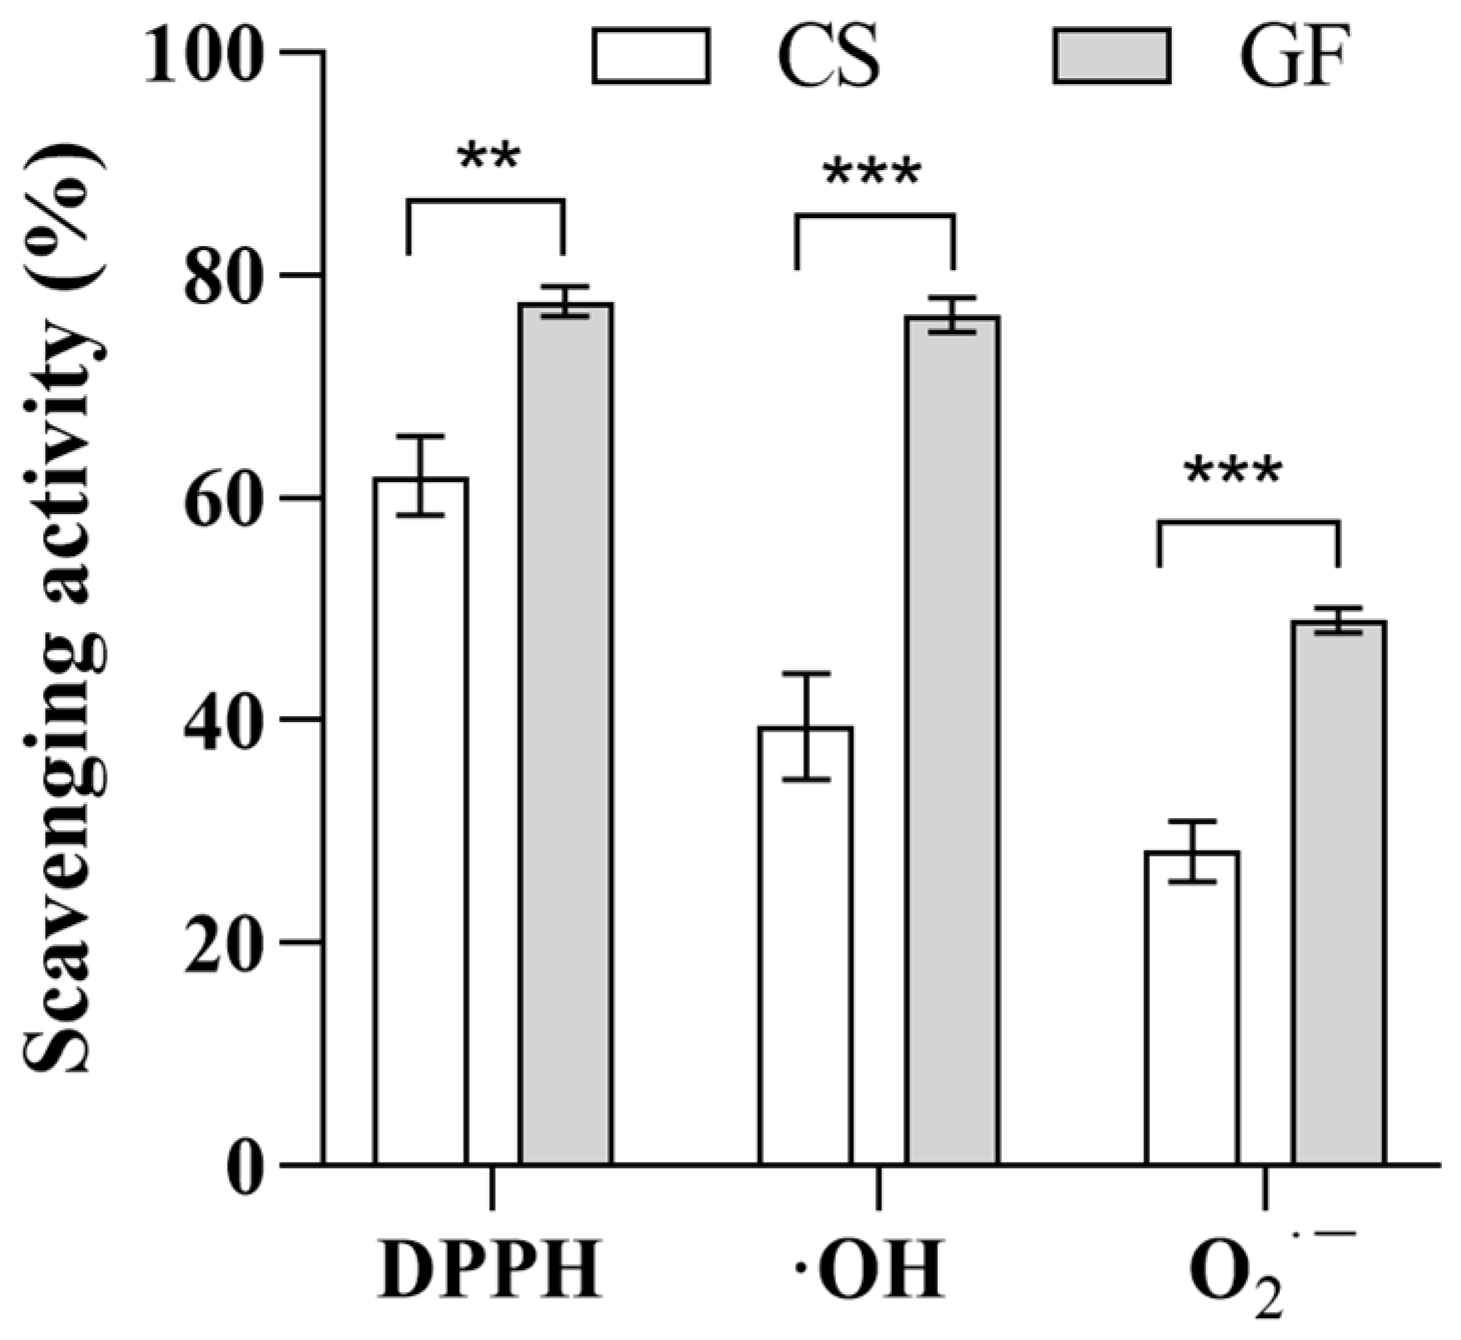
2.4. Correlation Analysis of the Active Ingredients and Antioxidant Activity of the Optimized Broth (GF)
2.4.1. Active Ingredients
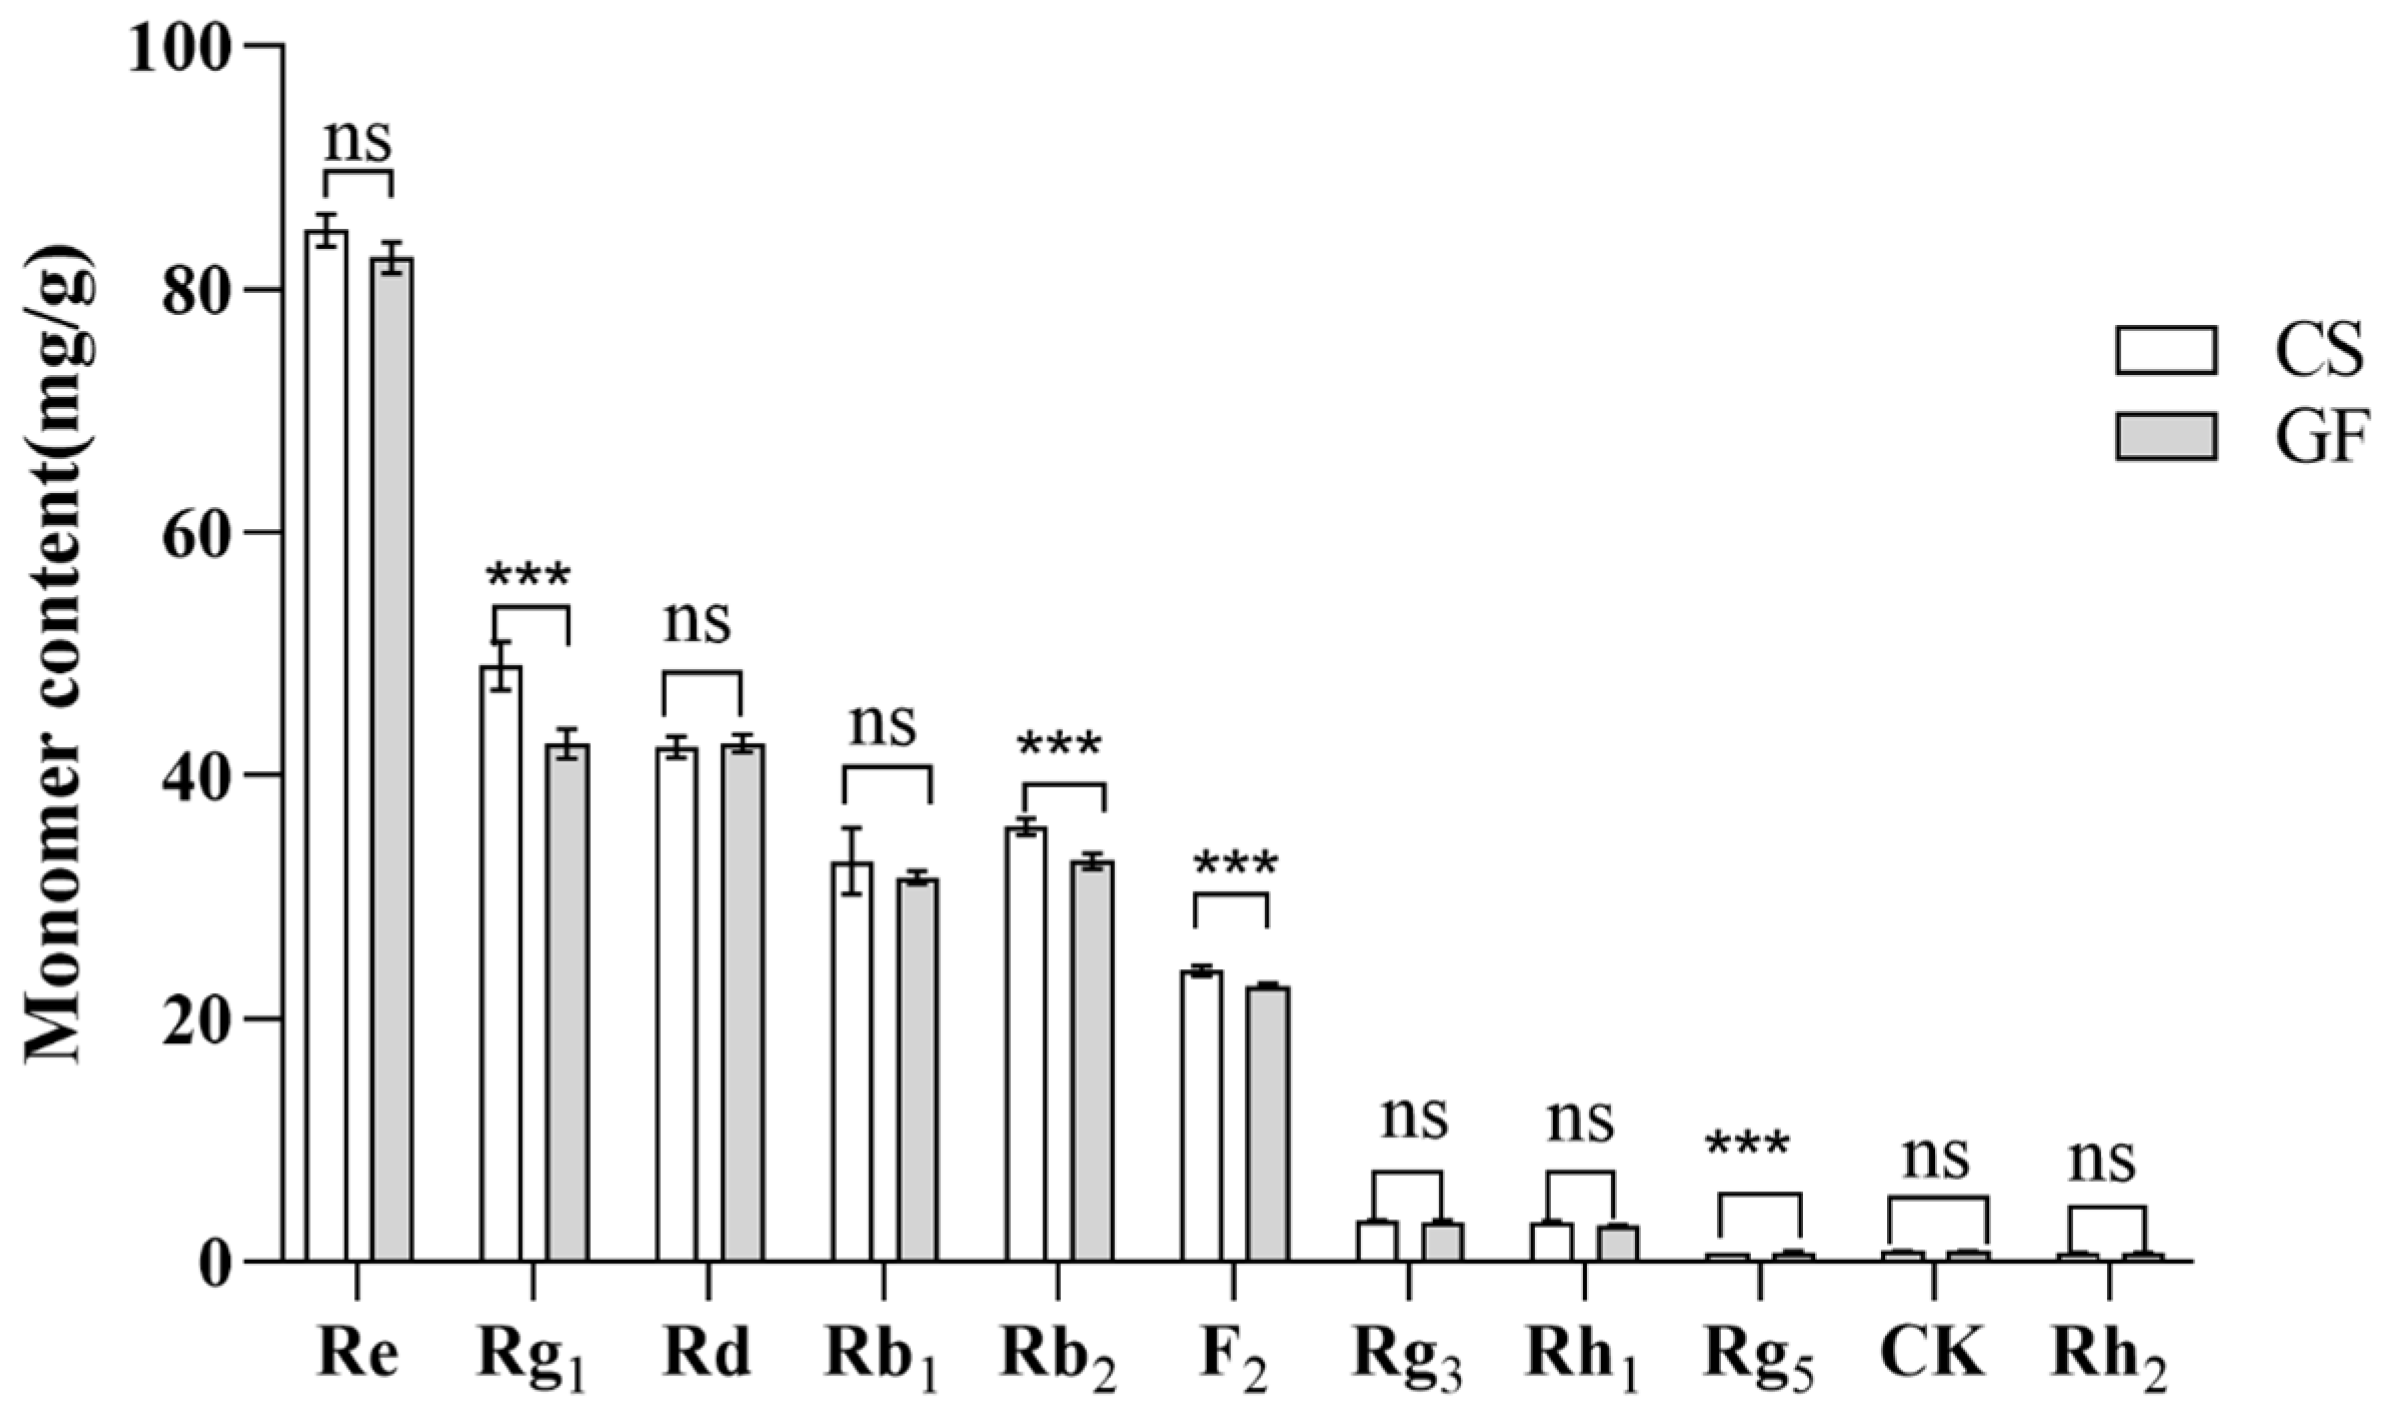
2.4.2. Ginsenoside Monomer Content
2.4.3. Correlation Analysis
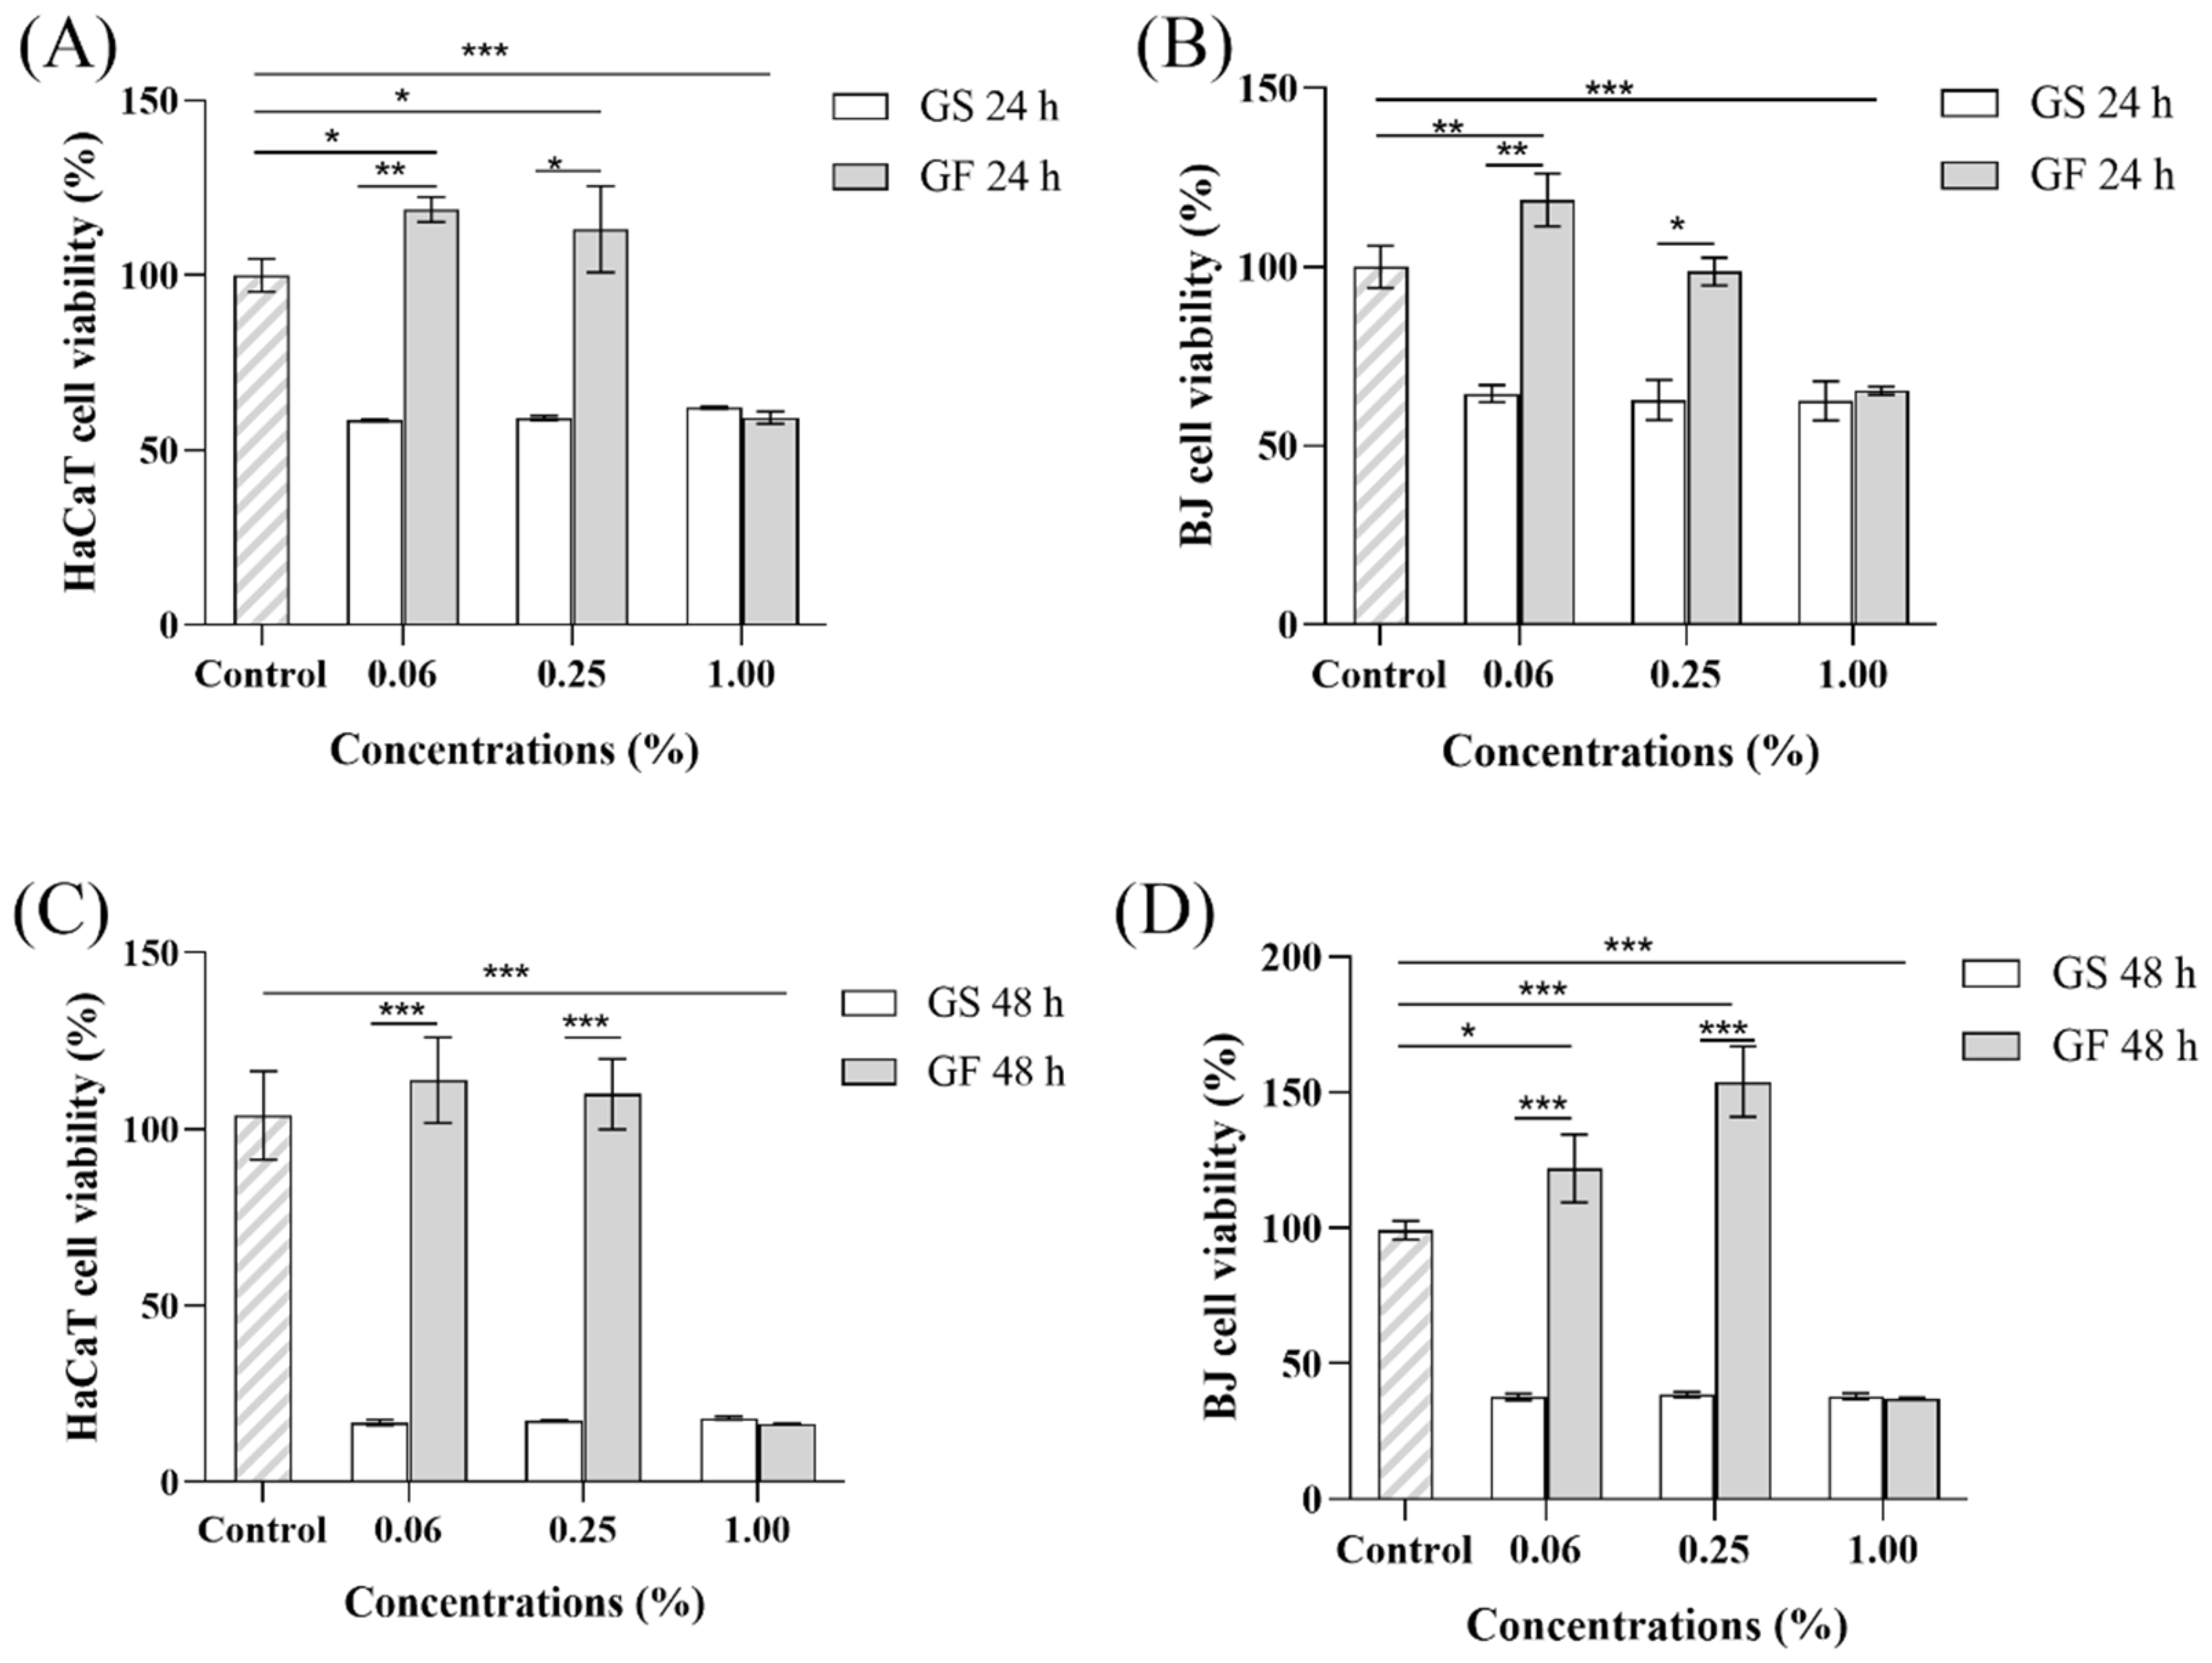
2.4.4. Effects of the GS and GF on the Activity of HaCaT and BJ Cells
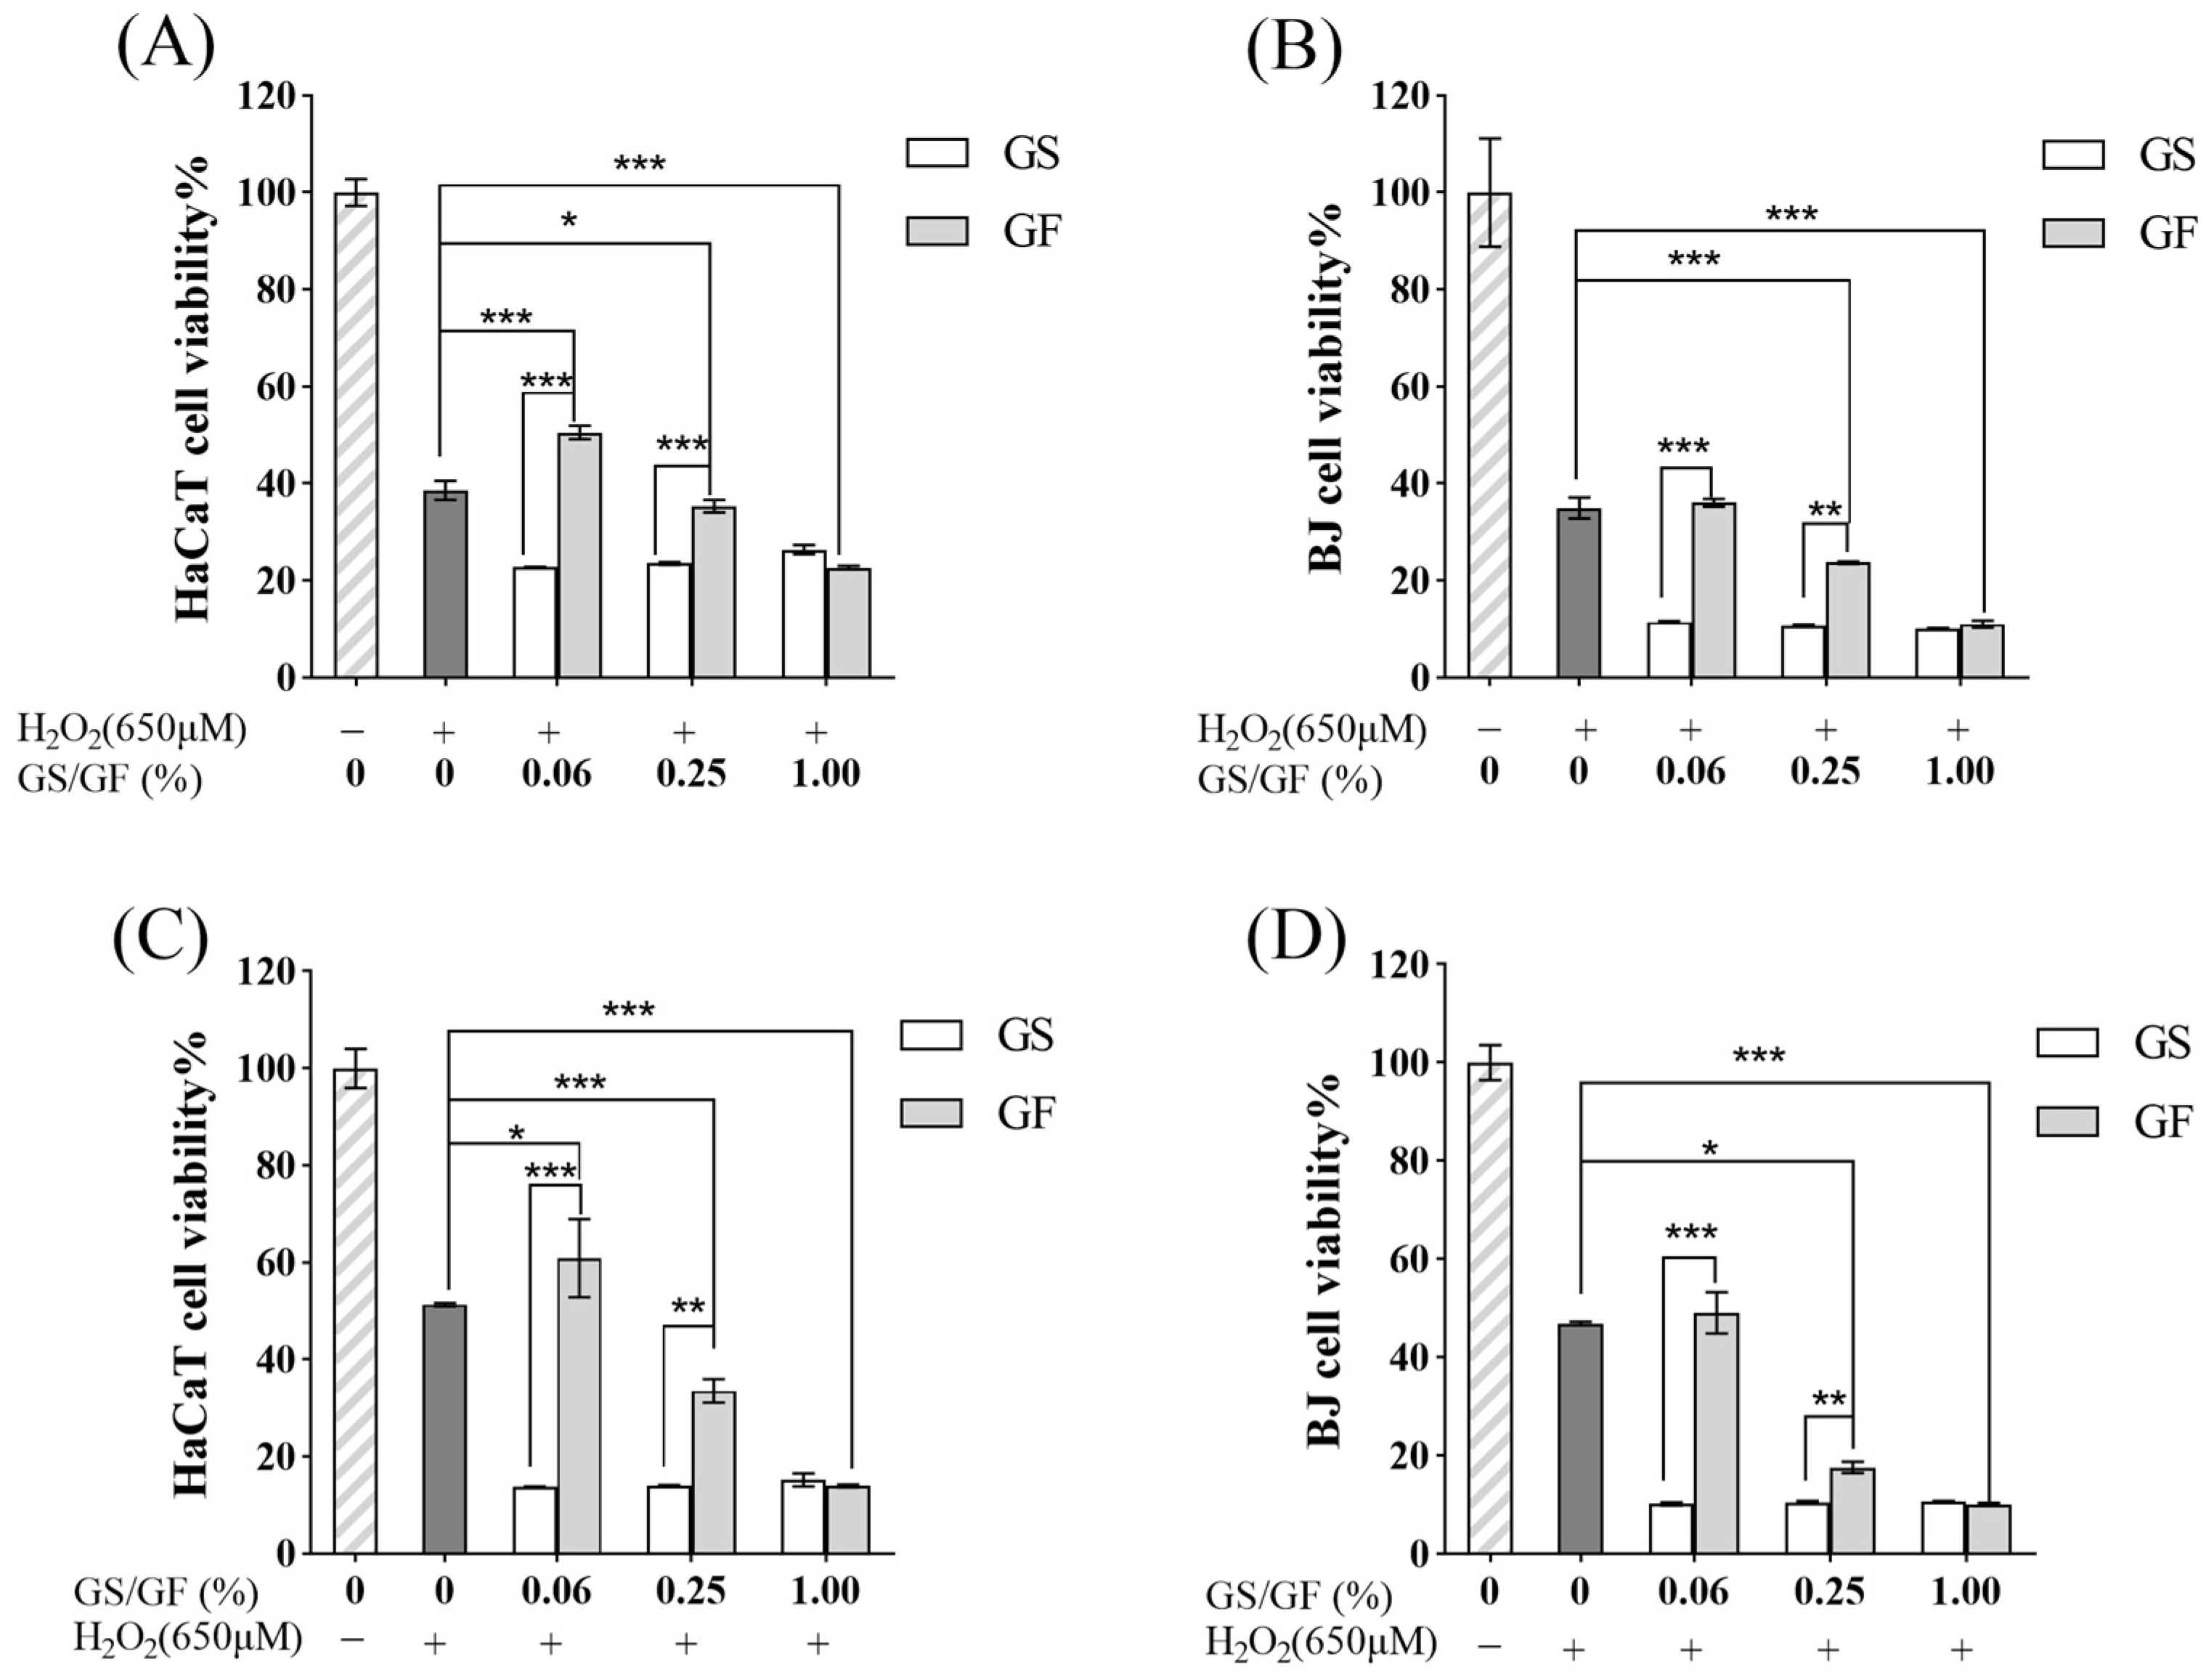
2.4.5. Effects of the GS and GF on HaCaT and BJ Cells in an Oxidative Stress Model
3. Materials and Methods
3.1. Materials, Chemical Reagents, and Instruments
3.2. Ginseng Fermentation
3.2.1. Strain Activation
3.2.2. Initial Fermentation of Ginseng
3.3. β-Glucosidase Activity Assay
3.4. Antioxidant Activity Assays
3.4.1. 2,2-Diphenyl-1-picrylhydrazyl Scavenging Activity
3.4.2. Hydroxyl Radical Scavenging Activity
3.4.3. Superoxide Anion Scavenging Activity
3.5. Determination of the Main Active Ingredients
3.5.1. Total Sugar (TS) Quantification
3.5.2. Total Phenol (TP) Quantification
3.5.3. Total Flavonoid (TF) Quantification
3.5.4. Total Ginsenoside (TG) Quantification
3.6. Ginsenoside Monomer Quantification
3.7. Optimization of GF Production
3.7.1. Single-Factor Screening of Culture Conditions
3.7.2. The Box–Behnken Design and Response Surface Methodology
3.8. Cell Test
3.8.1. Effects of the GS and GF on the Activity of HaCaT and BJ Cells
3.8.2. Assessment of the Capacity of the GS and GF to Protect Cells Exposed to H2O2
3.9. Statistical Analysis
4. Conclusions
Supplementary Materials
Author Contributions
Funding
Institutional Review Board Statement
Informed Consent Statement
Data Availability Statement
Conflicts of Interest
Abbreviations
References
- Patel, S.; Rauf, A. Adaptogenic herb ginseng (Panax) as medical food: Status quo and future prospects. Biomed. Pharmacother. Biomed. Pharmacother. 2017, 85, 120–127. [Google Scholar] [CrossRef]
- Kim, M.H.; Kim, K.T.; Sohn, S.Y.; Lee, J.Y.; Lee, C.H.; Yang, H.; Lee, B.K.; Lee, K.W.; Kim, D.D. Formulation And Evaluation Of Nanostructured Lipid Carriers (NLCs) of 20(S)-Protopanaxadiol (PPD) by Box-Behnken Design. Int. J. Nanomed. 2019, 14, 8509–8520. [Google Scholar] [CrossRef]
- Lee, N.K.; Paik, H.D. Bioconversion Using Lactic Acid Bacteria: Ginsenosides, GABA, and Phenolic Compounds. J. Microbiol. Biotechnol. 2017, 27, 869–877. [Google Scholar] [CrossRef]
- Kim, D.W.; Lee, W.J.; Gebru, Y.A.; Upadhyaya, J.; Ko, S.R.; Kim, Y.H.; Kim, M.K. Production of Minor Ginsenosides C-K and C-Y from Naturally Occurring Major Ginsenosides Using Crude β-Glucosidase Preparation from Submerged Culture of Fomitella fraxinea. Molecules 2021, 26, 4820. [Google Scholar] [CrossRef]
- Park, N.J.; Bong, S.K.; Lee, S.; Jung, Y.; Jegal, H.; Kim, J.; Kim, S.K.; Kim, Y.K.; Kim, S.N. Compound K improves skin barrier function by increasing SPINK5 expression. J. Ginseng Res. 2020, 44, 799–807. [Google Scholar] [CrossRef]
- Qu, Q.; Yang, F.; Zhao, C.; Liu, X.; Yang, P.; Li, Z.; Han, L.; Shi, X. Effects of fermented ginseng on the gut microbiota and immunity of rats with antibiotic-associated diarrhea. J. Ethnopharmacol. 2021, 267, 113594. [Google Scholar] [CrossRef]
- Li, L.; Wang, L.; Fan, W.; Jiang, Y.; Zhang, C.; Li, J.; Peng, W.; Wu, C. The Application of Fermentation Technology in Traditional Chinese Medicine: A Review. Am. J. Chin. Med. 2020, 48, 899–921. [Google Scholar] [CrossRef] [PubMed]
- Pham, Q.L.; Jang, H.J.; Kim, K.B. Anti-wrinkle effect of fermented black ginseng on human fibroblasts. Int. J. Mol. Med. 2017, 39, 681–686. [Google Scholar] [CrossRef]
- Palaniyandi, S.A.; Son, B.M.; Damodharan, K.; Suh, J.-W.; Yang, S.H. Fermentative transformation of ginsenoside Rb1 from Panax ginseng C. A. Meyer to Rg3 and Rh2 by Lactobacillus paracasei subsp. tolerans MJM60396. Biotechnol. Bioprocess Eng. 2016, 21, 587–594. [Google Scholar] [CrossRef]
- Yoo, J.M.; Lee, J.Y.; Lee, Y.G.; Baek, S.; Kim, M.R. Enhanced production of compound K in fermented ginseng extracts by Lactobacillus brevis. Food Sci. Biotechnol. 2019, 28, 823–829. [Google Scholar] [CrossRef]
- Lee, J.Y.; Yoo, J.M.; Baek, S.Y.; Kim, M.R. Anti-dermatitic effect of fermented ginseng extract including rich compound K through inhibiting activation of macrophage. Food Sci. Biotechnol. 2019, 28, 1845–1852. [Google Scholar] [CrossRef]
- Park, J.Y.; Song, M.W.; Kim, K.T.; Paik, H.D. Improved Antioxidative, Anti-Inflammatory, and Antimelanogenic Effects of Fermented Hydroponic Ginseng with Bacillus Strains. Antioxidants 2022, 11, 1848. [Google Scholar] [CrossRef]
- Jung, J.; Jang, H.J.; Eom, S.J.; Choi, N.S.; Lee, N.K.; Paik, H.D. Fermentation of red ginseng extract by the probiotic Lactobacillus plantarum KCCM 11613P: Ginsenoside conversion and antioxidant effects. J. Ginseng Res. 2019, 43, 20–26. [Google Scholar] [CrossRef] [PubMed]
- He, Y.L.; Lin, L.; Zheng, H.; Mo, Y.; Zhou, C.; Sun, S.; Hong, P.; Qian, Z.J. Potential anti-skin aging effect of a peptide AYAPE isolated from Isochrysis zhanjiangensis on UVB-induced HaCaT cells and H(2)O(2)-induced BJ cells. J. Photochem. Photobiol. B Biol. 2022, 233, 112481. [Google Scholar] [CrossRef] [PubMed]
- Gu, Y.; Han, J.; Jiang, C.; Zhang, Y. Biomarkers, oxidative stress and autophagy in skin aging. Ageing Res. Rev. 2020, 59, 101036. [Google Scholar] [CrossRef]
- Abrahams, S.; Haylett, W.L.; Johnson, G.; Carr, J.A.; Bardien, S. Antioxidant effects of curcumin in models of neurodegeneration, aging, oxidative and nitrosative stress: A review. Neuroscience 2019, 406, 1–21. [Google Scholar] [CrossRef]
- Trüeb, R.M. Oxidative stress and its impact on skin, scalp and hair. Int. J. Cosmet. Sci. 2021, 43, S9–S13. [Google Scholar] [CrossRef]
- Yang, Y.; Ren, C.; Zhang, Y.; Wu, X. Ginseng: An Nonnegligible Natural Remedy for Healthy Aging. Aging Dis. 2017, 8, 708–720. [Google Scholar] [CrossRef]
- Oh, Y.; Lim, H.W.; Park, K.H.; Huang, Y.H.; Yoon, J.Y.; Kim, K.; Lim, C.J. Ginsenoside Rc protects against UVB-induced photooxidative damage in epidermal keratinocytes. Mol. Med. Rep. 2017, 16, 2907–2914. [Google Scholar] [CrossRef]
- Shin, D.; Moon, H.W.; Oh, Y.; Kim, K.; Kim, D.D.; Lim, C.J. Defensive Properties of Ginsenoside Re against UV-B-Induced Oxidative Stress through Up-Regulating Glutathione and Superoxide Dismutase in HaCaT Keratinocytes. Iran. J. Pharm. Res. IJPR 2018, 17, 249–260. [Google Scholar]
- Hou, M.; Wang, R.; Zhao, S.; Wang, Z. Ginsenosides in Panax genus and their biosynthesis. Acta Pharm. Sinica. B 2021, 11, 1813–1834. [Google Scholar] [CrossRef]
- Song, Y.N.; Hong, H.G.; Son, J.S.; Kwon, Y.O.; Lee, H.H.; Kim, H.J.; Park, J.H.; Son, M.J.; Oh, J.G.; Yoon, M.H. Investigation of Ginsenosides and Antioxidant Activities in the Roots, Leaves, and Stems of Hydroponic-Cultured Ginseng (Panax ginseng Meyer). Prev. Nutr. Food Sci. 2019, 24, 283–292. [Google Scholar] [CrossRef]
- Pyo, M.K.; Choi, S.H.; Shin, T.J.; Hwang, S.H.; Lee, B.H.; Kang, J.; Kim, H.J.; Lee, S.H.; Nah, S.Y. A simple method for the preparation of crude gintonin from ginseng root, stem, and leaf. J. Ginseng Res. 2011, 35, 209–218. [Google Scholar] [CrossRef]
- Deng, Y.; Huang, Q.; Hu, L.; Liu, T.; Zheng, B.; Lu, D.; Guo, C.; Zhou, L. Enhanced exopolysaccharide yield and antioxidant activities of Schizophyllum commune fermented products by the addition of Radix Puerariae. RSC Adv. 2021, 11, 38219–38234. [Google Scholar] [CrossRef]
- Deng, Y.; Liu, H.; Huang, Q.; Tu, L.; Hu, L.; Zheng, B.; Sun, H.; Lu, D.; Guo, C.; Zhou, L. Mechanism of Longevity Extension of Caenorhabditis elegans Induced by Schizophyllum commune Fermented Supernatant with Added Radix Puerariae. Front. Nutr. 2022, 9, 847064. [Google Scholar] [CrossRef] [PubMed]
- Wu, Y.; Liu, Y.; Wu, J.; Ou, K.; Huang, Q.; Cao, J.; Duan, T.; Zhou, L.; Pan, Y. Chemical profile and antioxidant activity of bidirectional metabolites from Tremella fuciformis and Acanthopanax trifoliatus as assessed using response surface methodology. Front. Nutr. 2022, 9, 1035788. [Google Scholar] [CrossRef] [PubMed]
- Ma, Q.; Chen, M.; Liu, Y.; Tong, Y.; Liu, T.; Wu, L.; Wang, J.; Han, B.; Zhou, L.; Hu, X. Lactobacillus acidophilus Fermented Dandelion Improves Hyperuricemia and Regulates Gut Microbiota. Fermentation 2023, 9, 352. [Google Scholar] [CrossRef]
- Lee, H.Y.; Lee, J.H.; Shin, E.C.; Cho, D.Y.; Jung, J.G.; Kim, M.J.; Jeong, J.B.; Kang, D.; Kang, S.S.; Cho, K.M. Changes in Chemical Compositions and Antioxidant Activities from Fresh to Fermented Red Mountain-Cultivated Ginseng. Molecules 2022, 27, 4550. [Google Scholar] [CrossRef] [PubMed]
- Xu, Y.; Tang, Y.; Liu, T.; Liu, H.; Yang, J.; Meng, L. Optimization of Rare Ginsenosides and Antioxidant Activity Quality of Ginseng Jiaosu Based on Probiotic Strains and Fermentation Technology. J. Food Qual. 2023, 2023, 5686929. [Google Scholar] [CrossRef]
- Li, L.; Wang, R.; Liang, X.; Gai, Y.; Jiao, C.; Wang, M. Characterization of a Bacillus velezensis with Antibacterial Activity and Its Inhibitory Effect on Gray Mold Germ. Agronomy 2023, 13, 1553. [Google Scholar] [CrossRef]
- Karami, F.; Ghorbani, M.; Sadeghi Mahoonak, A.; Pourhossein, A.; Bagheri, A.; Khodarahmi, R. Increasing Antioxidant Activity in Food Waste Extracts by β-Glucosidase. Food Technol. Biotechnol. 2022, 60, 458–468. [Google Scholar] [CrossRef] [PubMed]
- Ziemlewska, A.; Nizioł-Łukaszewska, Z.; Bujak, T.; Zagórska-Dziok, M.; Wójciak, M.; Sowa, I. Effect of fermentation time on the content of bioactive compounds with cosmetic and dermatological properties in Kombucha Yerba Mate extracts. Sci. Rep. 2021, 11, 18792. [Google Scholar] [CrossRef] [PubMed]
- Wu, S.; Wang, W.; Zhu, W.; Chen, W.; Xu, W.; Sui, M.; Jiang, G.; Xiao, J.; Ning, Y.; Ma, C.; et al. Microbial community succession in the fermentation of Qingzhuan tea at various temperatures and their correlations with the quality formation. Int. J. Food Microbiol. 2022, 382, 109937. [Google Scholar] [CrossRef] [PubMed]
- Zhang, Z.; Guo, S.; Wu, T.; Yang, Y.; Yu, X.; Yao, S. Inoculum size of co-fermentative culture affects the sensory quality and volatile metabolome of fermented milk over storage. J. Dairy Sci. 2022, 105, 5654–5668. [Google Scholar] [CrossRef] [PubMed]
- Akpabli-Tsigbe, N.D.K.; Osabutey, J.; Mintah, B.K.; Tano-debrah, K.; Ma, Y.J.F.B. Cleavage of macromolecule (protein/polysaccharide)-phenolic bond in soybean cell wall through Lactobacillus casei and Lactobacillus helviticus mixed culture solid-state fermentation for chlorogenic acid extraction. Food Biosci. 2023, 55, 102903. [Google Scholar] [CrossRef]
- Witek-Krowiak, A.; Chojnacka, K.; Podstawczyk, D.; Dawiec, A.; Bubała, K. Application of response surface methodology and artificial neural network methods in modelling and optimization of biosorption process. Bioresour. Technol. 2014, 160, 150–160. [Google Scholar] [CrossRef]
- Zhou, Y.; Yang, X.; Li, Q.; Peng, Z.; Li, J.; Zhang, J. Optimization of fermentation conditions for surfactin production by B. subtilis YPS-32. BMC Microbiol. 2023, 23, 117. [Google Scholar] [CrossRef]
- Boateng, I.D.; Kumar, R.; Daubert, C.R.; Flint-Garcia, S.; Mustapha, A.; Kuehnel, L.; Agliata, J.; Li, Q.; Wan, C.; Somavat, P. Sonoprocessing improves phenolics profile, antioxidant capacity, structure, and product qualities of purple corn pericarp extract. Ultrason. Sonochem. 2023, 95, 106418. [Google Scholar] [CrossRef]
- Wang, L.; Wu, Y.; Liu, Y.; Wu, Z. Complex Enzyme-Assisted Extraction Releases Antioxidative Phenolic Compositions from Guava Leaves. Molecules 2017, 22, 1648. [Google Scholar] [CrossRef]
- Oleksy, M.; Klewicka, E. Exopolysaccharides produced by Lactobacillus sp.: Biosynthesis and applications. Crit. Rev. Food Sci. Nutr. 2018, 58, 450–462. [Google Scholar] [CrossRef]
- Park, J.; Kim, J.; Ko, E.S.; Jeong, J.H.; Park, C.O.; Seo, J.H.; Jang, Y.S. Enzymatic bioconversion of ginseng powder increases the content of minor ginsenosides and potentiates immunostimulatory activity. J. Ginseng Res. 2022, 46, 304–314. [Google Scholar] [CrossRef]
- Lee, S.J.; Ha, N.; Kim, Y.; Kim, M.G. Changes in the Ginsenoside Content During Fermentation Using an Appliance for the Preparation of Red Ginseng. Am. J. Chin. Med. 2016, 44, 1595–1606. [Google Scholar] [CrossRef] [PubMed]
- Lee, H.S.; Kim, M.R.; Park, Y.; Park, H.J.; Chang, U.J.; Kim, S.Y.; Suh, H.J. Fermenting red ginseng enhances its safety and efficacy as a novel skin care anti-aging ingredient: In vitro and animal study. J. Med. Food 2012, 15, 1015–1023. [Google Scholar] [CrossRef]
- Li, M.; Ma, M.; Wu, Z.; Liang, X.; Zheng, Q.; Li, D.; An, T.; Wang, G. Advances in the biosynthesis and metabolic engineering of rare ginsenosides. Appl. Microbiol. Biotechnol. 2023, 107, 3391–3404. [Google Scholar] [CrossRef]
- Chen, Q.; Wang, J.; Gao, Y.; Wang, Z.; Gao, X.; Yan, P. Biotransformation of American Ginseng Stems and Leaves by an Endophytic Fungus Umbelopsis sp. and Its Effect on Alzheimer’s Disease Control. Nutrients 2023, 15, 4878. [Google Scholar] [CrossRef]
- Bai, Y.; Gänzle, M.G. Conversion of ginsenosides by Lactobacillus plantarum studied by liquid chromatography coupled to quadrupole trap mass spectrometry. Food Res. Int. 2015, 76, 709–718. [Google Scholar] [CrossRef]
- Tran, T.N.A.; Son, J.S.; Awais, M.; Ko, J.H.; Yang, D.C.; Jung, S.K. β-Glucosidase and Its Application in Bioconversion of Ginsenosides in Panax ginseng. Bioengineering 2023, 10, 484. [Google Scholar] [CrossRef] [PubMed]
- Wang, P.; Tang, C.; Liu, Y.; Yang, J.; Fan, D. Biotransformation of High Concentrations of Ginsenoside Substrate into Compound K by β-glycosidase from Sulfolobus solfataricus. Genes 2023, 14, 897. [Google Scholar] [CrossRef] [PubMed]
- Xiong, X.; Huang, G.; Huang, H. The antioxidant activities of phosphorylated polysaccharide from native ginseng. Int. J. Biol. Macromol. 2019, 126, 842–845. [Google Scholar] [CrossRef]
- Bae, H.J.; Chung, S.I.; Lee, S.C.; Kang, M.Y. Influence of aging process on the bioactive components and antioxidant activity of ginseng (Panax ginseng L.). J. Food Sci. 2014, 79, H2127–H2131. [Google Scholar] [CrossRef]
- Ning, C.; Gao, X.; Wang, C.; Huo, X.; Liu, Z.; Sun, H.; Yang, X.; Sun, P.; Ma, X.; Meng, Q.; et al. Hepatoprotective effect of ginsenoside Rg1 from Panax ginseng on carbon tetrachloride-induced acute liver injury by activating Nrf2 signaling pathway in mice. Environ. Toxicol. 2018, 33, 1050–1060. [Google Scholar] [CrossRef] [PubMed]
- Huang, L.; Li, H.J.; Wu, Y.C. Processing technologies, phytochemistry, bioactivities and applications of black ginseng-a novel manufactured ginseng product: A comprehensive review. Food Chem. 2023, 407, 134714. [Google Scholar] [CrossRef]
- Huang, R.; Zhang, Y.; Shen, S.; Zhi, Z.; Cheng, H.; Chen, S.; Ye, X. Antioxidant and pancreatic lipase inhibitory effects of flavonoids from different citrus peel extracts: An in vitro study. Food Chem. 2020, 326, 126785. [Google Scholar] [CrossRef] [PubMed]
- Liu, Z.Q.; Luo, X.Y.; Sun, Y.X.; Chen, Y.P.; Wang, Z.C. Can ginsenosides protect human erythrocytes against free-radical-induced hemolysis? Biochim. Biophys. Acta 2002, 1572, 58–66. [Google Scholar] [CrossRef]
- Dong, L.; Lee, H.; Liu, Z.; Lee, D.S. Anti-Skin Inflammatory and Anti-Oxidative Effects of the Neoflavonoid Latifolin Isolated from Dalbergia odorifera in HaCaT and BJ-5ta Cells. Int. J. Mol. Sci. 2023, 24, 7371. [Google Scholar] [CrossRef] [PubMed]
- Michalak, M.; Zagórska-Dziok, M.; Klimek-Szczykutowicz, M.; Szopa, A. Phenolic Profile and Comparison of the Antioxidant, Anti-Ageing, Anti-Inflammatory, and Protective Activities of Borago officinalis Extracts on Skin Cells. Molecules 2023, 28, 868. [Google Scholar] [CrossRef]
- ISO 10993-5:2009; Biological Evaluation of Medical Devices Part 5: Tests for In Vitro Cytotoxicity. ISO: Geneva, Switzerland, 2009.
- Liu, H.M.; Xu, P.F.; Cheng, M.Y.; Lei, S.N.; Liu, Q.L.; Wang, W. Optimization of Fermentation Process of Pomegranate Peel and Schisandra Chinensis and the Biological Activities of Fermentation Broth: Antioxidant Activity and Protective Effect Against H(2)O(2)-induced Oxidative Damage in HaCaT Cells. Molecules 2021, 26, 3432. [Google Scholar] [CrossRef]
- Wei, C.; Yu, L.; Qiao, N.; Wang, S.; Tian, F.; Zhao, J.; Zhang, H.; Zhai, Q.; Chen, W. The characteristics of patulin detoxification by Lactobacillus plantarum 13M5. Food Chem. Toxicol. Int. J. Publ. Br. Ind. Biol. Res. Assoc. 2020, 146, 111787. [Google Scholar] [CrossRef]
- Lin, C.C.; Wu, P.S.; Liang, D.W.; Kwan, C.C.; Chen, Y.S. Quality, antioxidative ability, and cell proliferation-enhancing activity of fermented black soybean broths with various supplemental culture medium. J. Food Sci. 2012, 77, C95–C101. [Google Scholar] [CrossRef] [PubMed]
- Han, R.; Tang, F.; Lu, M.; Xu, C.; Hu, J.; Mei, M.; Wang, H. Astragalus polysaccharide ameliorates H2O2-induced human umbilical vein endothelial cell injury. Mol. Med. Rep. 2017, 15, 4027–4034. [Google Scholar] [CrossRef] [PubMed]
- Zhang, J.; Wang, W.; Mao, X. Chitopentaose protects HaCaT cells against H2O2-induced oxidative damage through modulating MAPKs and Nrf2/ARE signaling pathways. J. Funct. Foods 2020, 72, 104086. [Google Scholar] [CrossRef]
- Mallis, R.J.; Hamann, M.J.; Zhao, W.; Zhang, T.; Hendrich, S.; Thomas, J.A. Irreversible thiol oxidation in carbonic anhydrase III: Protection by S-glutathiolation and detection in aging rats. Biol. Chem. 2002, 383, 649–662. [Google Scholar] [CrossRef] [PubMed]
- He, B.; Chen, D.; Zhang, X.; Yang, R.; Yang, Y.; Chen, P.; Shen, Z. Oxidative Stress and Ginsenosides: An Update on the Molecular Mechanisms. Oxidative Med. Cell. Longev. 2022, 2022, 9299574. [Google Scholar] [CrossRef] [PubMed]
- Han, J.M.; Song, H.Y.; Jung, J.H.; Lim, S.; Seo, H.S.; Kim, W.S.; Lim, S.T.; Byun, E.B. Deinococcus radiodurans-derived membrane vesicles protect HaCaT cells against H(2)O(2)-induced oxidative stress via modulation of MAPK and Nrf2/ARE pathways. Biol. Proced. Online 2023, 25, 17. [Google Scholar] [CrossRef]
- Shin, K.C.; Lee, H.J.; Oh, D.K. Substrate specificity of β-glucosidase from Gordonia terrae for ginsenosides and its application in the production of ginsenosides Rg3, Rg2, and Rh1 from ginseng root extract. J. Biosci. Bioeng. 2015, 119, 497–504. [Google Scholar] [CrossRef]
- Chen, Y.; Chen, L.; Xiao, Z.; Gao, L. Effects of enzymolysis and fermentation on the antioxidant activity and functional components of a coarse cereal compound powder based on principal component analysis and microstructure study. J. Food Sci. 2022, 87, 3573–3587. [Google Scholar] [CrossRef]
- Huang, Q.; Liu, Y.; Deng, Y.; Yang, B.; Guo, R.; Jin, X.; Zhou, L. Preparation and Antioxidant Activity In Vitro of Fermented Tremella fuciformis Extracellular Polysaccharides. Fermentation 2022, 8, 616. [Google Scholar] [CrossRef]
- Tang, J.; Xiong, L.; Shu, X.; Chen, W.; Li, W.; Li, J.; Ma, L.; Xiao, Y.; Li, L. Antioxidant effects of bioactive compounds isolated from cordyceps and their protective effects against UVB-irradiated HaCaT cells. J. Cosmet. Dermatol. 2019, 18, 1899–1906. [Google Scholar] [CrossRef] [PubMed]
- Chen, S.; Huang, H.; Huang, G. Extraction, derivatization and antioxidant activity of cucumber polysaccharide. Int. J. Biol. Macromol. 2019, 140, 1047–1053. [Google Scholar] [CrossRef] [PubMed]
- Xu, Y.Y.; Qiu, Y.; Ren, H.; Ju, D.H.; Jia, H.L. Optimization of ultrasound-assisted aqueous two-phase system extraction of polyphenolic compounds from Aronia melanocarpa pomace by response surface methodology. Prep. Biochem. Biotechnol. 2017, 47, 312–321. [Google Scholar] [CrossRef]
- Yin, N.; Wang, Y.; Ren, X.; Zhao, Y.; Liu, N.; An, X.; Qi, J. Isolation and Characterization of Flavonoids from Fermented Dandelion (Taraxacum mongolicum Hand.-Mazz.), and Assessment of Its Antioxidant Actions In Vitro and In Vivo. Fermentation 2022, 8, 306. [Google Scholar] [CrossRef]
- Gavrila, A.I.; Tatia, R.; Seciu-Grama, A.M.; Tarcomnicu, I.; Negrea, C.; Calinescu, I.; Zalaru, C.; Moldovan, L.; Raiciu, A.D.; Popa, I. Ultrasound Assisted Extraction of Saponins from Hedera helix L. and an In Vitro Biocompatibility Evaluation of the Extracts. Pharmaceuticals 2022, 15, 1197. [Google Scholar] [CrossRef] [PubMed]
- Zhao, Y.N.; Wang, Z.L.; Dai, J.G.; Chen, L.; Huang, Y.F. Preparation and quality assessment of high-purity ginseng total saponins by ion exchange resin combined with macroporous adsorption resin separation. Chin. J. Nat. Med. 2014, 12, 382–392. [Google Scholar] [CrossRef] [PubMed]
- Tao, A.; Feng, X.; Sheng, Y.; Song, Z. Optimization of the Artemisia Polysaccharide Fermentation Process by Aspergillus niger. Front. Nutr. 2022, 9, 842766. [Google Scholar] [CrossRef]


| Run | A (h) | B (°C) | C (%) | DPPH (%) | O2·− (%) | ·OH (%) |
|---|---|---|---|---|---|---|
| 1 | 30 | 28 | 2.50 | 82.79 ± 0.16 | 47.53 ± 1.63 | 75.62 ± 4.78 |
| 2 | 30 | 28 | 2.50 | 84.72 ± 2.23 | 49.39 ± 3.01 | 76.61 ± 3.56 |
| 3 | 45 | 28 | 2.00 | 73.07 ± 0.71 | 43.49 ± 2.57 | 70.10 ± 2.37 |
| 4 | 30 | 28 | 2.50 | 80.26 ± 1.52 | 46.09 ± 2.50 | 78.57 ± 3.33 |
| 5 | 30 | 30 | 2.00 | 80.56 ± 2.77 | 42.16 ± 4.33 | 75.01 ± 0.63 |
| 6 | 45 | 30 | 2.50 | 71.41 ± 1.42 | 44.28 ± 2.40 | 68.63 ± 2.01 |
| 7 | 30 | 28 | 2.50 | 81.48 ± 2.49 | 46.16 ± 2.16 | 81.39 ± 0.43 |
| 8 | 15 | 30 | 2.50 | 77.80 ± 4.98 | 41.15 ± 3.11 | 76.75 ± 1.61 |
| 9 | 15 | 28 | 3.00 | 83.54 ± 0.69 | 39.40 ± 3.79 | 77.22 ± 0.92 |
| 10 | 15 | 26 | 2.50 | 80.97 ± 2.71 | 36.16 ± 1.92 | 73.56 ± 0.23 |
| 11 | 30 | 26 | 3.00 | 83.03 ± 1.93 | 40.64 ± 2.57 | 72.98 ± 1.50 |
| 12 | 30 | 28 | 2.50 | 79.35 ± 0.33 | 46.02 ± 1.34 | 77.54 ± 0.59 |
| 13 | 45 | 26 | 2.50 | 69.89 ± 4.61 | 44.61 ± 1.04 | 76.08 ± 0.14 |
| 14 | 45 | 28 | 3.00 | 71.34 ± 2.69 | 40.68 ± 3.07 | 69.71 ± 1.68 |
| 15 | 15 | 28 | 2.00 | 82.39 ± 2.71 | 37.20 ± 2.59 | 72.25 ± 1.30 |
| 16 | 30 | 26 | 2.00 | 83.71 ± 2.76 | 40.23 ± 2.83 | 76.54 ± 1.50 |
| 17 | 30 | 30 | 3.00 | 80.63 ± 1.88 | 41.45 ± 1.77 | 72.55 ± 0.72 |
| Sources | Sum of Squares | df | Mean Square | F-Value | p-Value |
|---|---|---|---|---|---|
| Model | 201.02 | 9 | 22.34 | 14.27 | 0.0010 |
| A | 45.84 | 1 | 45.84 | 29.28 | 0.0010 |
| B | 6.84 | 1 | 6.84 | 4.37 | 0.0749 |
| C | 0.1063 | 1 | 0.1063 | 0.0679 | 0.8020 |
| AB | 7.06 | 1 | 7.06 | 4.51 | 0.0713 |
| AC | 6.30 | 1 | 6.30 | 4.02 | 0.0849 |
| BC | 0.3115 | 1 | 0.3115 | 0.1990 | 0.6690 |
| A² | 43.37 | 1 | 43.37 | 27.70 | 0.0012 |
| B² | 21.88 | 1 | 21.88 | 13.97 | 0.0073 |
| C² | 55.76 | 1 | 55.76 | 35.61 | 0.0006 |
| Residual | 10.96 | 7 | 1.57 | ||
| Lack of Fit | 2.47 | 3 | 0.8245 | 0.3887 | 0.7682 |
| Pure Error | 8.49 | 4 | 2.12 | ||
| Cor Total | 211.98 | 16 | |||
| R2 | 0.9483 | ||||
| R2Adj | 0.8818 |
| Factor | Level | ||
|---|---|---|---|
| −1 | 0 | 1 | |
| A: time/h | 15 | 30 | 45 |
| B: temperature/°C | 26 | 28 | 30 |
| C: inoculum size/% | 2.0 | 2.5 | 3.0 |
| TS | TP | TF | TG | DPPH | ·OH | O2·− | |
|---|---|---|---|---|---|---|---|
| TS | 1 | 0.500 | 0.737 | 0.822 | 0.189 | −0.731 | −0.952 |
| TP | 1 | −0.217 | 0.904 | −0.756 | −0.225 | −0.212 | |
| TF | 1 | 0.221 | 0.803 | −1.00 ** | −0.908 | ||
| TG | 1 | −0.404 | −0.213 | −0.609 | |||
| DPPH | 1 | −0.808 | −0.48 | ||||
| ·OH | 1 | 0.905 | |||||
| O2·− | 1 |
Disclaimer/Publisher’s Note: The statements, opinions and data contained in all publications are solely those of the individual author(s) and contributor(s) and not of MDPI and/or the editor(s). MDPI and/or the editor(s) disclaim responsibility for any injury to people or property resulting from any ideas, methods, instructions or products referred to in the content. |
© 2024 by the authors. Licensee MDPI, Basel, Switzerland. This article is an open access article distributed under the terms and conditions of the Creative Commons Attribution (CC BY) license (https://creativecommons.org/licenses/by/4.0/).
Share and Cite
Lin, S.; Wu, Y.; Huang, Q.; Liu, Z.; Xu, J.; Ji, R.; Slovesnova, N.V.; He, X.; Zhou, L. Optimization of Antioxidant Activity of Compounds Generated during Ginseng Extract Fermentation Supplemented with Lactobacillus. Molecules 2024, 29, 1265. https://doi.org/10.3390/molecules29061265
Lin S, Wu Y, Huang Q, Liu Z, Xu J, Ji R, Slovesnova NV, He X, Zhou L. Optimization of Antioxidant Activity of Compounds Generated during Ginseng Extract Fermentation Supplemented with Lactobacillus. Molecules. 2024; 29(6):1265. https://doi.org/10.3390/molecules29061265
Chicago/Turabian StyleLin, Shuiqing, Yuxiao Wu, Qian Huang, Zhiting Liu, Juan Xu, Ruifeng Ji, Natalia V. Slovesnova, Xin He, and Lin Zhou. 2024. "Optimization of Antioxidant Activity of Compounds Generated during Ginseng Extract Fermentation Supplemented with Lactobacillus" Molecules 29, no. 6: 1265. https://doi.org/10.3390/molecules29061265