
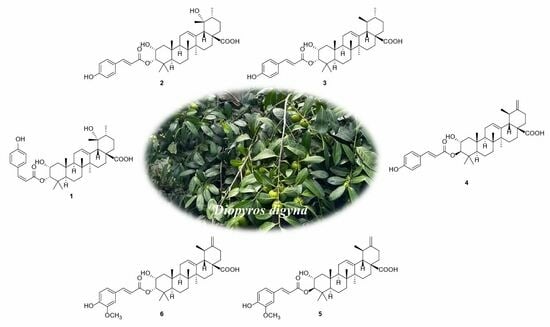
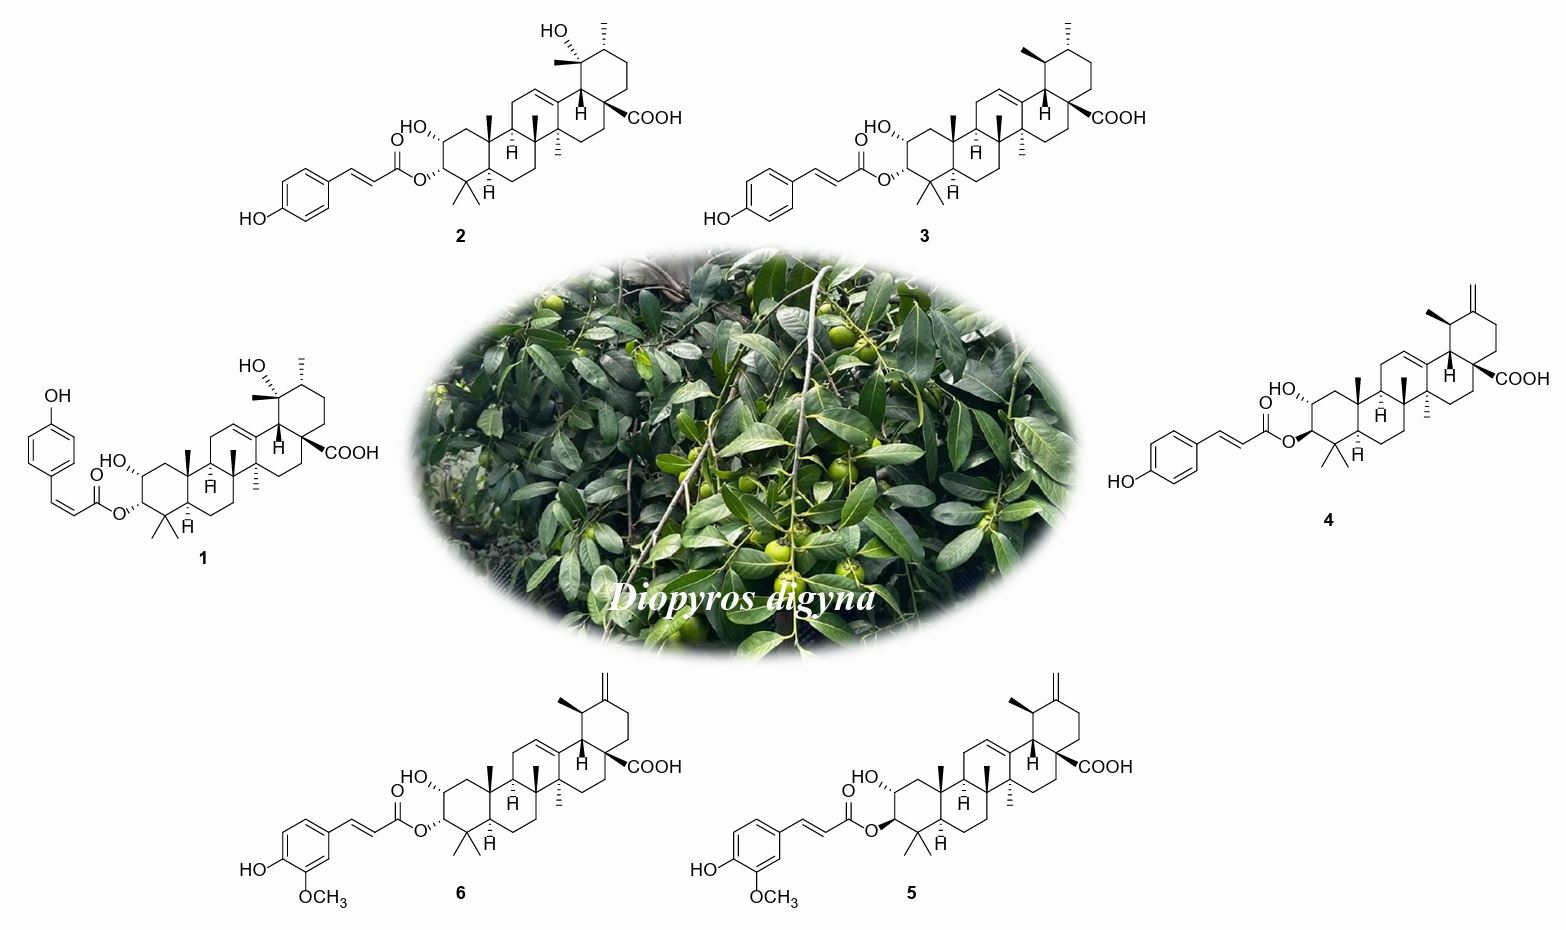
Triterpenoids from the Leaves of Diospyros digyna and Their PTP1B Inhibitory Activity

Abstract
1. Introduction
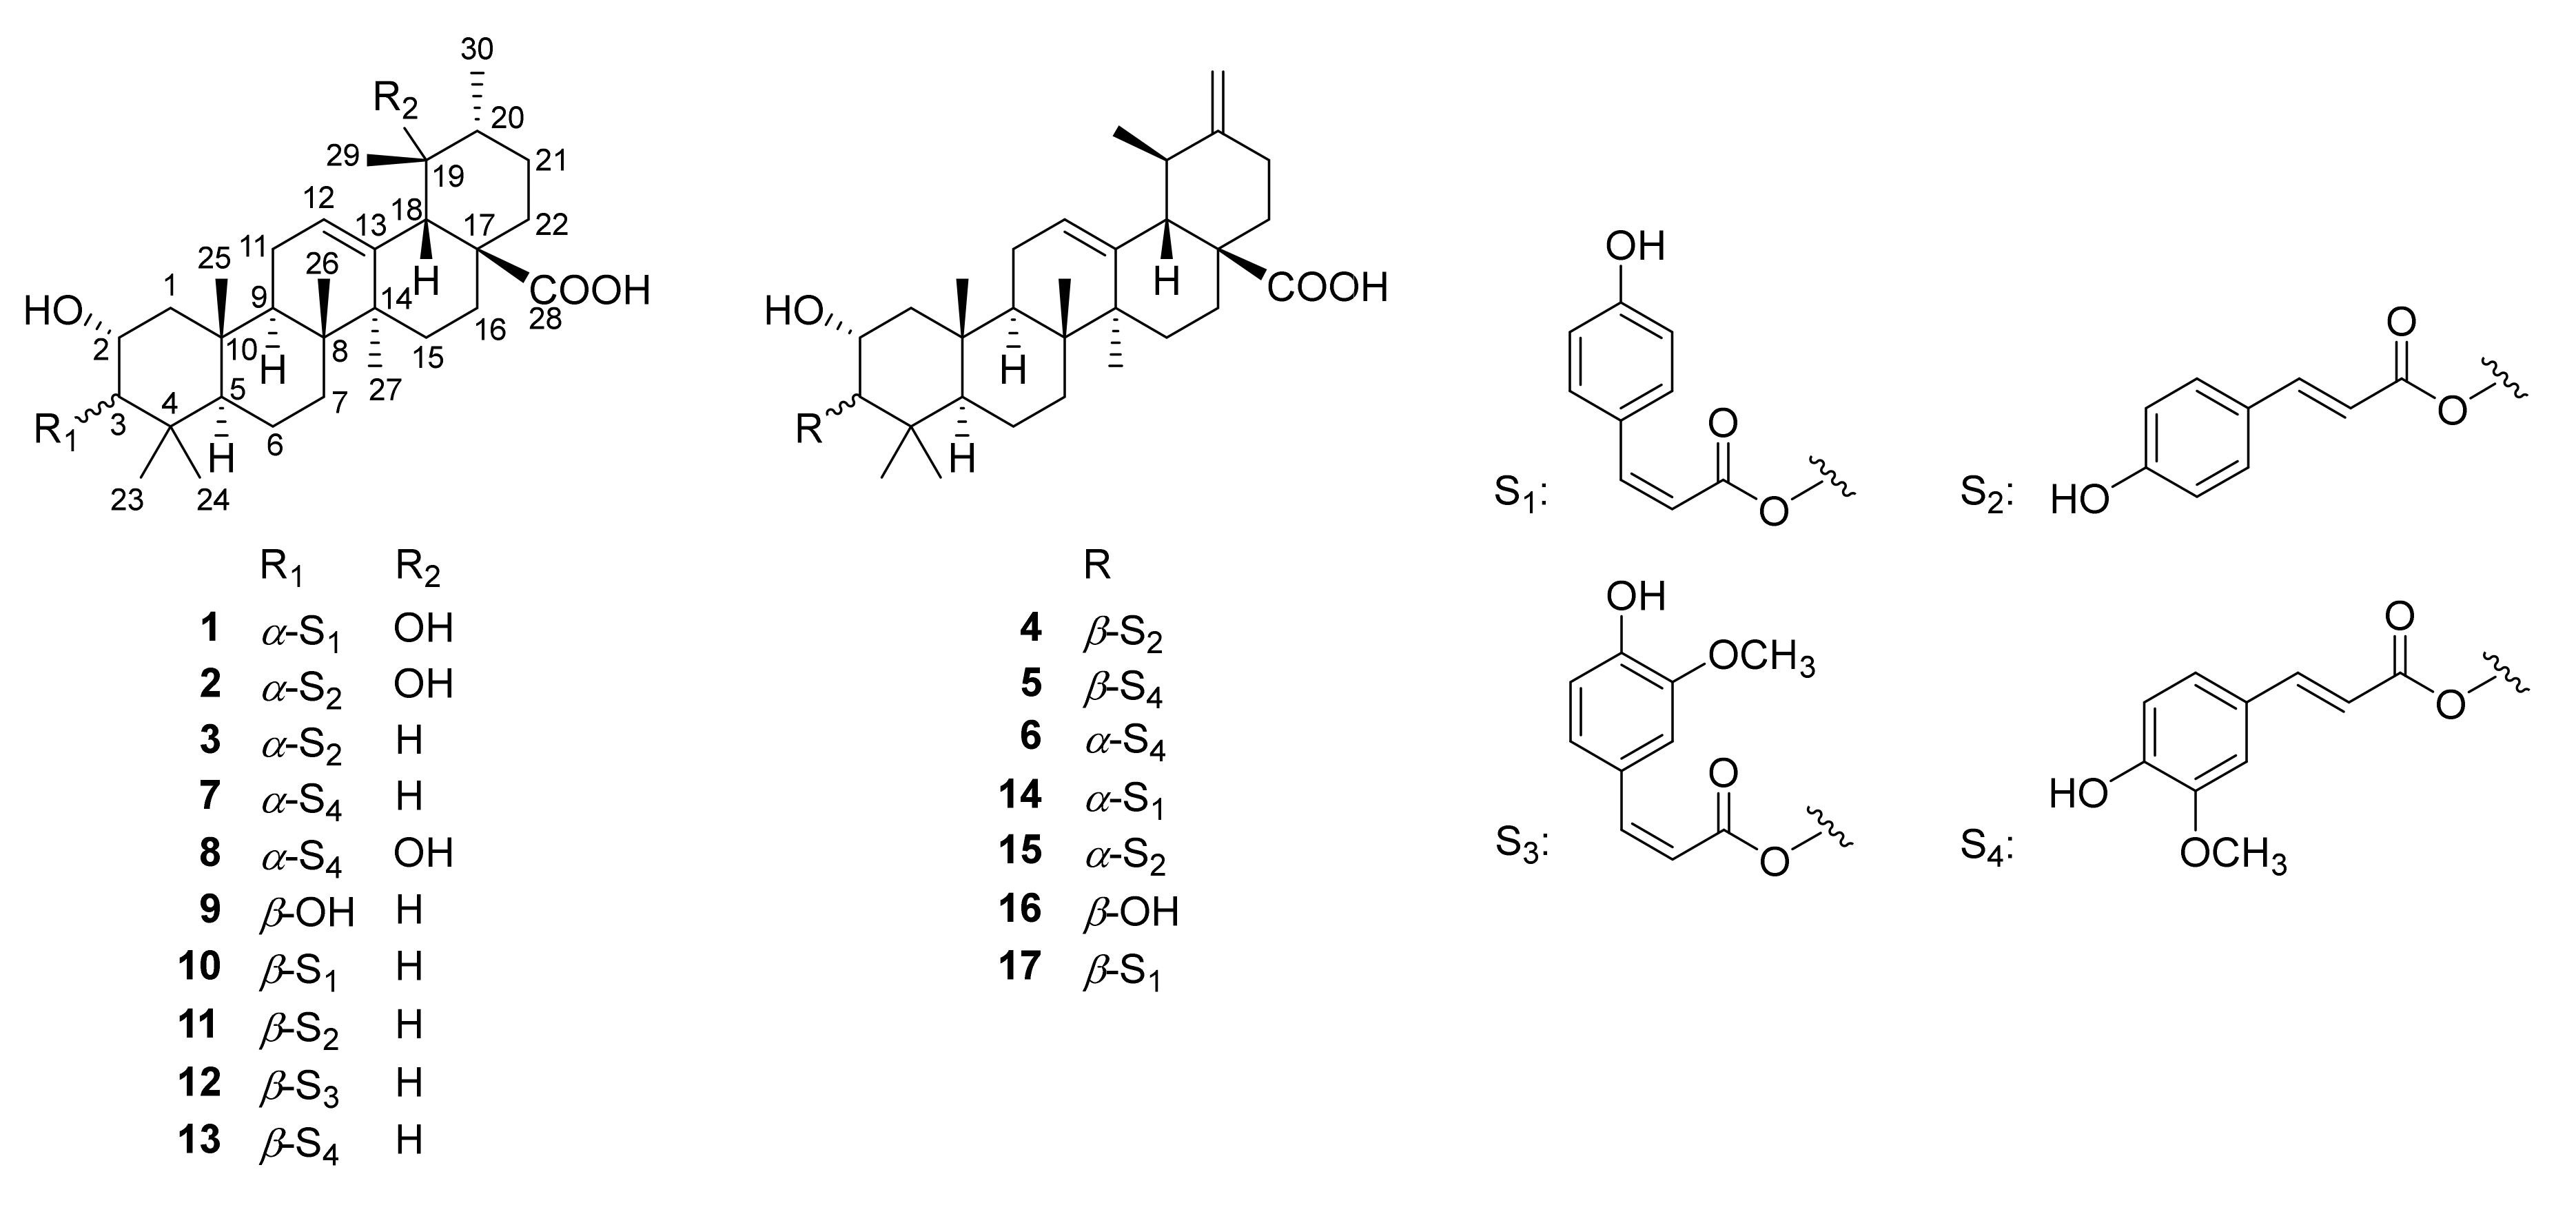
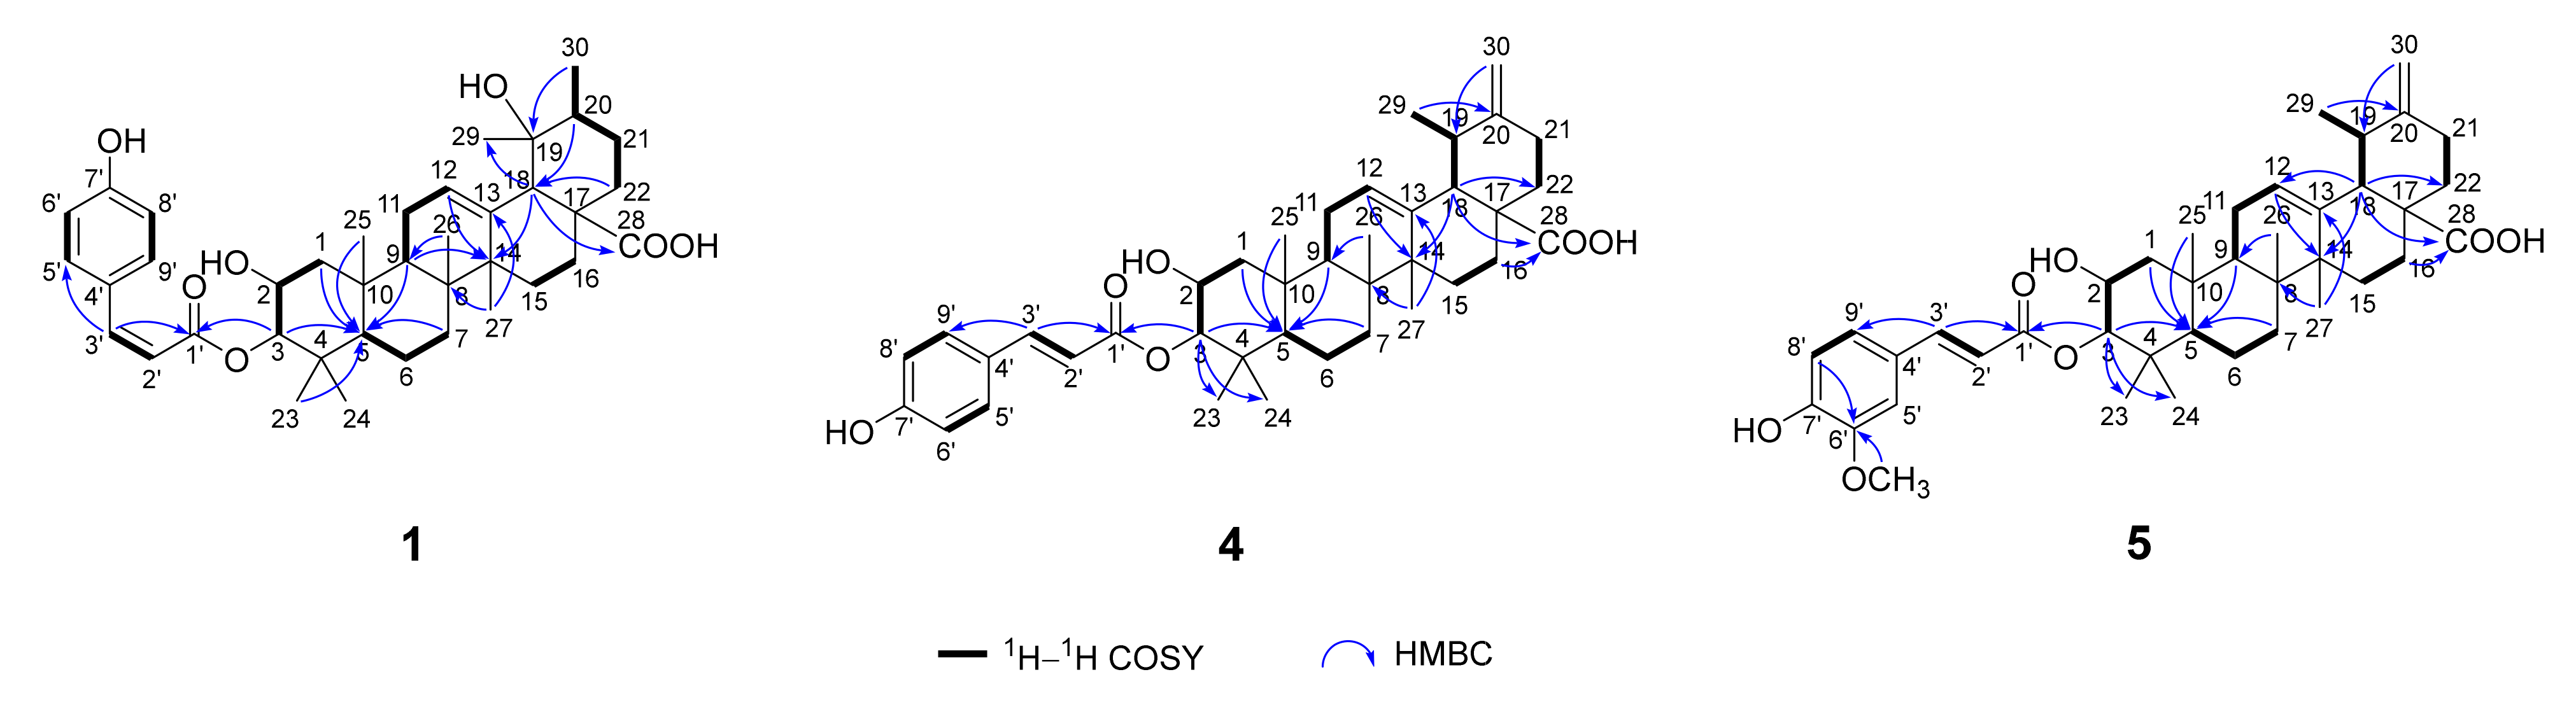
2. Results
3. Experimental Section
3.1. General Experimental Procedures
3.2. Plant Material
3.3. Extraction and Isolation
3.4. PTP1B Inhibition Assay
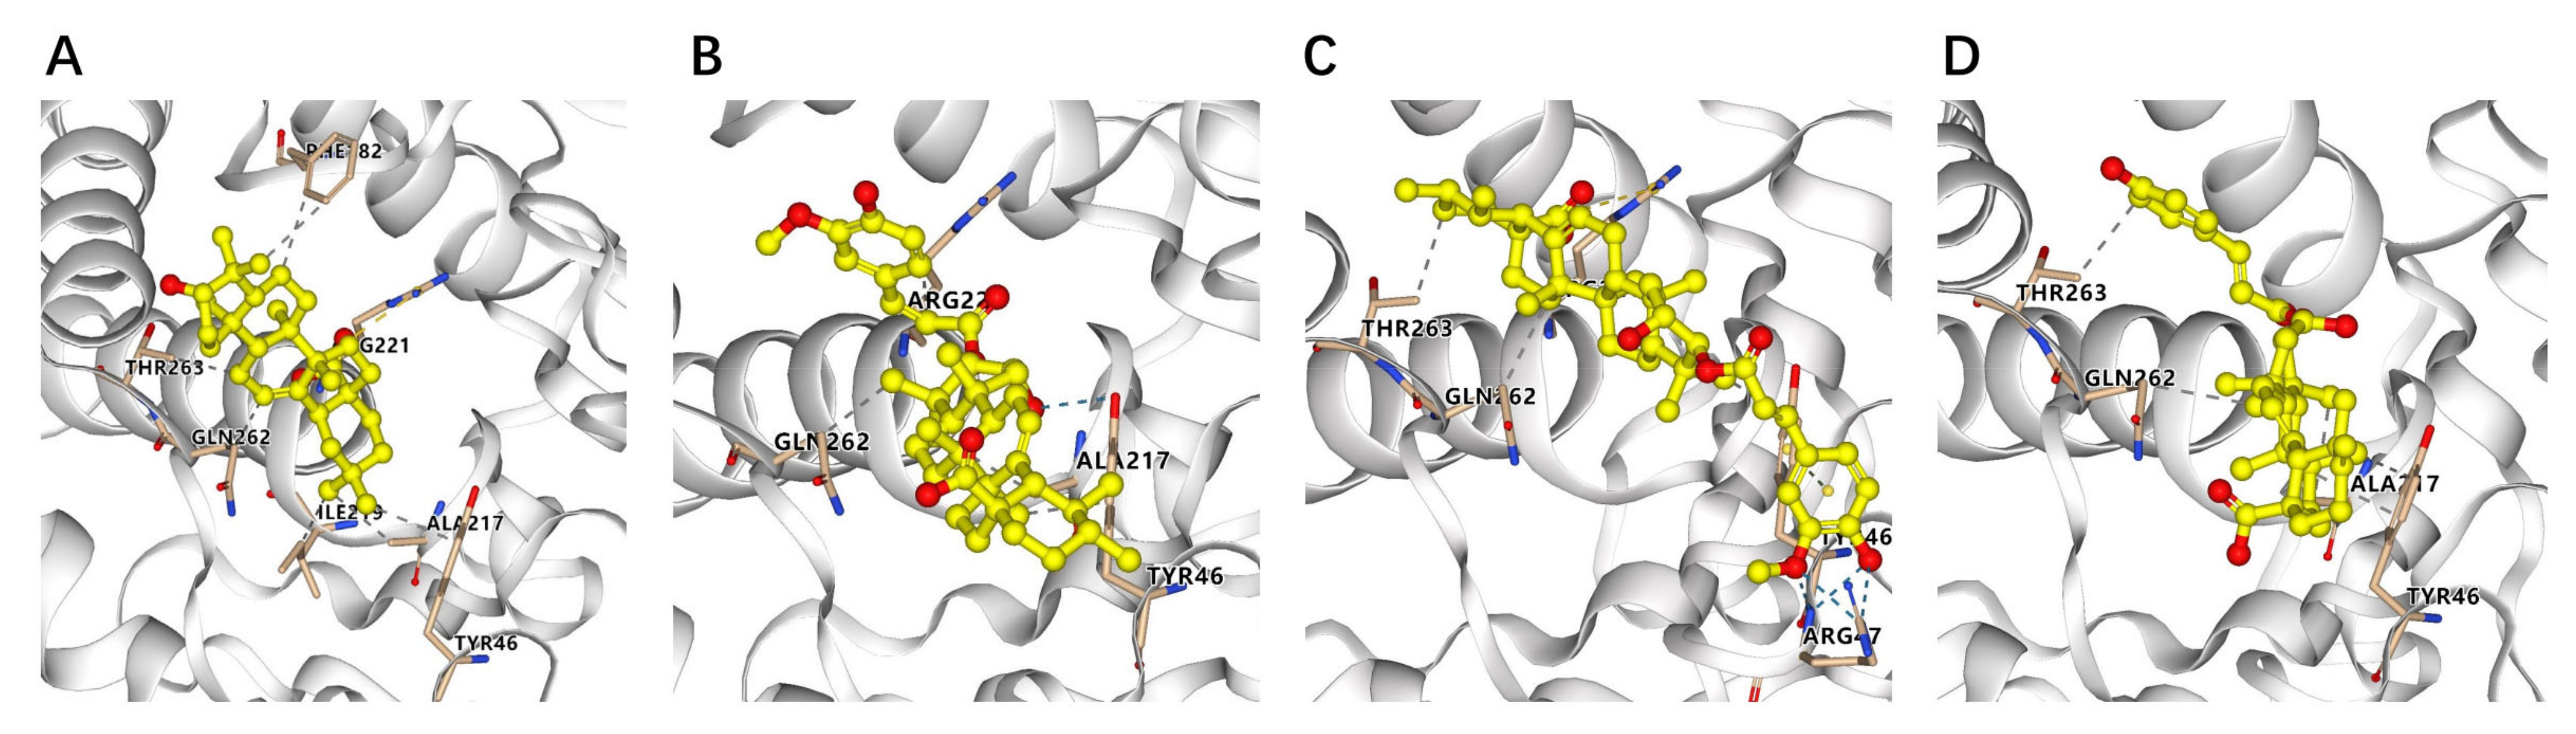
3.5. Molecular Docking Analysis
4. Conclusions
Supplementary Materials
Author Contributions
Funding
Institutional Review Board Statement
Informed Consent Statement
Data Availability Statement
Conflicts of Interest
References
- Galicia-Garcia, U.; Benito-Vicente, A.; Jebari, S.; Larrea-Sebal, A.; Siddiqi, H.; Uribe, K.B.; Ostolaza, H.; Martín, C. Pathophysiology of type 2 diabetes mellitus. Int. J. Mol. Sci. 2020, 21, 6275. [Google Scholar] [CrossRef] [PubMed]
- Burns, C.; Sirisena, I. Type 2 diabetes-etiology, epidemiology, pathogenesis, treatment. In Metabolic Syndrome: A Comprehensive Textbook; Ahima, R.S., Ed.; Springer International Publishing: Cham, Switzerland, 2014; pp. 1–19. [Google Scholar]
- Salmeen, A.; Andersen, J.N.; Myers, M.P.; Tonks, N.K.; Barford, D. Molecular basis for the dephosphorylation of the activation segment of the insulin receptor by protein tyrosine phosphatase 1B. Mol. Cell 2000, 6, 1401–1412. [Google Scholar] [CrossRef] [PubMed]
- Dubé, N.; Tremblay, M.L. Involvement of the small protein tyrosine phosphatases TC-PTP and PTP1B in signal transduction and diseases: From diabetes, obesity to cell cycle, and cancer. Biochim. Biophys. Acta 2005, 1754, 108–117. [Google Scholar] [CrossRef] [PubMed]
- Elchebly, M.; Payette, P.; Michaliszyn, E.; Cromlish, W.; Collins, S.; Loy, A.L.; Normandin, D.; Cheng, A.; Himms-Hagen, J.; Chan, C.C.; et al. Increased insulin sensitivity and obesity resistance in mice lacking the protein tyrosine phosphatase-1B gene. Science 1999, 283, 1544–1548. [Google Scholar] [CrossRef] [PubMed]
- Jensen-Cody, S.; Coyne, E.S.; Ding, X.; Sebin, A.; Vogel, J.; Goldstein, J.; Rosahl, T.W.; Zhou, H.H.; Jacobs, H.; Champy, M.F.; et al. Loss of low-molecular-weight protein tyrosine phosphatase shows limited improvement in glucose tolerance but causes mild cardiac hypertrophy in mice. Am. J. Physiol. Endocrinol. Metab. 2022, 322, E517–E527. [Google Scholar] [CrossRef] [PubMed]
- Zhang, Z.; Shang, Z.P.; Jiang, Y.; Qu, Z.X.; Yang, R.Y.; Zhang, J.; Lin, Y.X.; Zhao, F. Selective inhibition of PTP1B by new anthraquinone glycosides from Knoxia valerianoides. J. Nat. Prod. 2022, 85, 2836–2844. [Google Scholar] [CrossRef]
- Zhao, J.F.; Li, L.H.; Guo, X.J.; Zhang, H.X.; Tang, L.L.; Ding, C.H.; Liu, W.S. Identification of natural product inhibitors of PTP1B based on high-throughput virtual screening strategy: In silico, in vitro and in vivo studies. Int. J. Biol. Macromol. 2023, 243, 125292. [Google Scholar] [CrossRef]
- Liu, R.; Mathieu, C.; Berthelet, J.; Zhang, W.; Dupret, J.M.; Rodrigues Lima, F. Human protein tyrosine phosphatase 1B (PTP1B): From structure to clinical inhibitor perspectives. Int. J. Mol. Sci. 2022, 23, 7027. [Google Scholar] [CrossRef] [PubMed]
- Newman, D.J.; Cragg, G.M. Natural products as sources of new drugs over the nearly four decades from 01/1981 to 09/2019. J. Nat. Prod. 2020, 83, 770–803. [Google Scholar] [CrossRef]
- Jiang, C.S.; Liang, L.F.; Guo, Y.W. Natural products possessing protein tyrosine phosphatase 1B (PTP1B) inhibitory activity found in the last decades. Acta Pharmacol. Sin. 2012, 33, 1217–1245. [Google Scholar] [CrossRef]
- Liu, Z.; Gao, H.; Zhao, Z.; Huang, M.; Wang, S.; Zhan, J. Status of research on natural protein tyrosine phosphatase 1B inhibitors as potential antidiabetic agents: Update. Biomed. Pharmacother. 2023, 157, 113990. [Google Scholar] [CrossRef]
- Ramírez-Briones, E.; Rodríguez Macías, R.; Casarrubias Castillo, K.; del Río, R.E.; Martínez-Gallardo, N.; Tiessen, A.; Ordaz-Ortiz, J.; Cervantes-Hernández, F.; Délano-Frier, J.P.; Zañudo-Hernández, J. Fruits of wild and semi-domesticated Diospyros tree species have contrasting phenological, metabolic, and antioxidant activity profiles. J. Sci. Food Agric. 2019, 99, 6020–6031. [Google Scholar] [CrossRef] [PubMed]
- Yahia, E.M.; Gutierrez-Orozco, F.; Leon, C.A.D. Phytochemical and antioxidant characterization of the fruit of black sapote (Diospyros digyna Jacq.). Food Res. Int. 2011, 44, 2210–2216. [Google Scholar] [CrossRef]
- Rauf, A.; Uddin, G.; Patel, S.; Khan, A.; Halim, S.A.; Bawazeer, S.; Ahmad, K.; Muhammad, N.; Mubarak, M.S. Diospyros, an under-utilized, multi-purpose plant genus: A review. Biomed. Pharmacother. 2017, 91, 714–730. [Google Scholar] [CrossRef] [PubMed]
- Thuong, P.T.; Lee, C.H.; Dao, T.T.; Nguyen, P.H.; Kim, W.G.; Lee, S.J.; Oh, W.K. Triterpenoids from the leaves of Diospyros kaki (Persimmon) and their inhibitory effects on protein tyrosine phosphatase 1B. J. Nat. Prod. 2008, 71, 1775–1778. [Google Scholar] [CrossRef]
- Ramírez-Briones, E.; Rodríguez-Macías, R.; Salcedo-Pérez, E.; Ramírez-Chávez, E.; Molina-Torres, J.; Tiessen, A.; Ordaz-Ortiz, J.; Martínez-Gallardo, N.; Délano-Frier, J.P.; Zañudo-Hernández, J. Seasonal changes in the metabolic profiles and biological activity in leaves of Diospyros digyna and D. rekoi “Zapote” trees. Plants 2019, 8, 449. [Google Scholar] [CrossRef] [PubMed]
- Taniguchi, S.; Imayoshi, Y.; Kobayashi, E.; Takamatsu, Y.; Ito, H.; Hatano, T.; Sakagami, H.; Tokuda, H.; Nishino, H.; Sugita, D.; et al. Production of bioactive triterpenes by Eriobotrya japonica calli. Phytochemistry 2002, 59, 315–323. [Google Scholar] [CrossRef]
- Ogura, M.; Cordell, G.A.; Farnsworth, N.R. Jacoumaric acid, a new triterpene ester from Jacaranda caucana. Phytochemistry 1977, 16, 286–287. [Google Scholar] [CrossRef]
- Häberlein, H.; Tschiersch, K.P. Triterpenoids and flavonoids from Leptospermum scoparium. Phytochemistry 1994, 35, 765–768. [Google Scholar] [CrossRef]
- Cai, Y.H.; Guo, Y.; Li, Z.; Wu, D.; Li, X.; Zhang, H.; Yang, J.; Lu, H.; Sun, Z.; Luo, H.B.; et al. Discovery and modelling studies of natural ingredients from Gaultheria yunnanensis (FRANCH.) against phosphodiesterase-4. Eur. J. Med. Chem. 2016, 114, 134–140. [Google Scholar] [CrossRef]
- Ito, H.; Kobayashi, E.; Li, S.H.; Hatano, T.; Sugita, D.; Kubo, N.; Shimura, S.; Itoh, Y.; Yoshida, T. Megastigmane glycosides and an acylated triterpenoid from Eriobotrya japonica. J. Nat. Prod. 2001, 64, 737–740. [Google Scholar] [CrossRef] [PubMed]
- Shimizu, M.; Eumitsu, N.; Shirota, M.; Matsumoto, K.; Tezuka, Y. A new triterpene ester from Eriobotrya japonica. Chem. Pharm. Bull. 1996, 44, 2181–2182. [Google Scholar] [CrossRef]
- Glen, A.T.; Lawrie, W.; McLean, J.; Younes, M.E.G. Triterpenoid constituents of rose-bay willow-herb. J. Chem. Soc. C 1967, 510–515. [Google Scholar] [CrossRef]
- Chao, I.C.; Chen, Y.; Gao, M.H.; Lin, L.G.; Zhang, X.Q.; Ye, W.C.; Zhang, Q.W. Simultaneous determination of α-glucosidase inhibitory triterpenoids in Psidium guajava using HPLC–DAD–ELSD and pressurized liquid extraction. Molecules 2020, 25, 1278. [Google Scholar] [CrossRef] [PubMed]
- Wang, C.; Wu, P.; Tian, S.; Xue, J.; Xu, L.; Li, H.; Wei, X. Bioactive pentacyclic triterpenoids from the leaves of Cleistocalyx operculatus. J. Nat. Prod. 2016, 79, 2912–2923. [Google Scholar] [CrossRef] [PubMed]
- Lee, C.K. Ursane triterpenoids from leaves of Melaleuca leucadendron. Phytochemistry 1998, 49, 1119–1122. [Google Scholar] [CrossRef]
- Zhou, J.; Sun, N.; Zhang, H.; Zheng, G.; Liu, J.; Yao, G. Rhodomollacetals A–C, PTP1B inhibitory diterpenoids with a 2,3:5,6-di-seco-grayanane skeleton from the leaves of Rhododendron molle. Org. Lett. 2017, 19, 5352–5355. [Google Scholar] [CrossRef]
- Trott, O.; Olson, A.J. AutoDock Vina: Improving the speed and accuracy of docking with a new scoring function, efficient optimization, and multithreading. J. Comput. Chem. 2010, 31, 455–461. [Google Scholar] [CrossRef]


| No. | 1 b | 2 b | 3 c | ||||
|---|---|---|---|---|---|---|---|
| δH | δC | δH | δC | δH | δC | ||
| 1 | β | 1.65 | 43.2 | 1.71 | 43.5 | 2.05 | 44.1 |
| α | 1.37 | 1.38 | 1.86, m | ||||
| 2 | 4.11, dt (11.0, 4.1) | 66.2 | 4.12, dt (10.4, 4.1) | 66.2 | 4.50, dt (11.4, 4.3) | 65.2 | |
| 3 | 5.00, d (4.1) | 81.4 | 5.03, d (4.1) | 81.7 | 5.62, d (4.3) | 81.4 | |
| 4 | 39.6 | 39.8 | 39.2 | ||||
| 5 | 1.19, m | 51.1 | 1.30 | 51.3 | 1.56, m | 50.9 | |
| 6 | α | 1.47 | 19.3 | 1.50 | 19.3 | 1.49, m | 18.8 |
| β | 1.47 | 1.45 | 1.34 | ||||
| 7 | α | 1.59, m | 34.1 | 1.60 | 34.2 | 1.67, m | 33.8 |
| β | 1.34 | 1.35 | 1.41 | ||||
| 8 | 41.4 | 41.4 | 40.6 | ||||
| 9 | 1.82 | 48.6 | 1.94, m | 48.8 | 2.00 | 48.6 | |
| 10 | 39.6 | 39.7 | 39.2 | ||||
| 11 | α | 2.04, m | 24.8 | 2.06, m | 24.9 | 2.12 | 24.2 |
| β | 1.45 | 1.36 | 2.02 | ||||
| 12 | 5.32, m | 129.4 | 5.34, m | 129.4 | 5.51, m | 125.9 | |
| 13 | 140.2 | 140.3 | 139.9 | ||||
| 14 | 42.8 | 42.8 | 43.0 | ||||
| 15 | β | 1.83 | 29.7 | 1.83 | 29.7 | 2.37, m | 29.1 |
| α | 1.03 | 1.02 | 1.21, m | ||||
| 16 | α | 2.60, m | 26.7 | 2.61, m | 26.7 | 2.11 | 25.4 |
| β | 1.53, m | 1.54 | 1.96 | ||||
| 17 | 48.8 | 49.0 | 48.5 | ||||
| 18 | 2.54, s | 55.2 | 2.54, s | 55.2 | 2.67, m | 54.0 | |
| 19 | 73.8 | 73.8 | 1.45 | 39.9 | |||
| 20 | 1.31 | 43.3 | 1.33 | 43.2 | 1.04 | 39.9 | |
| 21 | α | 1.73 | 27.4 | 1.73 | 27.4 | 1.40 | 31.6 |
| β | 1.27 | 1.23 | 1.48 | ||||
| 22 | β | 1.74 | 39.2 | 1.75 | 39.2 | 2.00 | 38.0 |
| α | 1.64 | 1.65 | 2.00 | ||||
| 23 | 0.91, s | 28.7 | 0.92, s | 28.7 | 1.13, s | 28.9 | |
| 24 | 1.00, s | 22.4 | 1.01, s | 22.3 | 0.96, s | 21.9 | |
| 25 | 1.04, s | 17.0 | 1.07, s | 17.0 | 1.00, s | 17.1 | |
| 26 | 0.81, s | 17.7 | 0.84, s | 17.7 | 1.08, s | 18.0 | |
| 27 | 1.36, s | 25.1 | 1.44, s | 25.1 | 1.25, s | 24.5 | |
| 28 | 182.4 | 182.4 | 180.6 | ||||
| 29 | 1.23, s | 27.2 | 1.23, s | 27.2 | 1.00 | 22.5 | |
| 30 | 0.95, d (6.7) | 16.8 | 0.96, d (6.6) | 16.8 | 1.00 | 18.0 | |
| 1’ | 168.6 | 169.5 | 168.4 | ||||
| 2’ | 5.87, d (13.0) | 117.5 | 6.40, d (15.9) | 116.0 | 6.78, d (15.9) | 116.6 | |
| 3’ | 6.88, d (13.0) | 144.8 | 7.63, d (15.9) | 146.4 | 8.03, d (15.9) | 145.5 | |
| 4’ | 127.9 | 127.4 | 126.7 | ||||
| 5’ | 7.66, d (8.7) | 133.8 | 7.47, d (8.6) | 131.3 | 7.52, d (8.6) | 131.1 | |
| 6’ | 6.75, d (8.7) | 116.0 | 6.82, d (8.6) | 117.0 | 7.15, d (8.6) | 117.2 | |
| 7’ | 160.0 | 161.3 | 161.8 | ||||
| 8’ | 6.75, d (8.7) | 116.0 | 6.82, d (8.6) | 117.0 | 7.15, d (8.6) | 117.2 | |
| 9’ | 7.66, d (8.7) | 133.8 | 7.47, d (8.6) | 131.3 | 7.52, d (8.6) | 131.1 | |
| No. | 4 | 5 | 6 | ||||
|---|---|---|---|---|---|---|---|
| δH | δC | δH | δC | δH | δC | ||
| 1 | β | 2.33 | 49.0 | 2.33 | 49.1 | 2.03 | 44.1 |
| α | 1.42, m | 1.41, m | 1.86, m | ||||
| 2 | 4.32, ddd (10.8, 4.3, 3.7) | 66.8 | 4.32, ddd (10.8, 4.3, 3.7) | 66.9 | 4.49, dt (10.8, 4.5) | 65.1 | |
| 3 | 5.28, d (10.8) | 85.5 | 5.29, d (10.8) | 85.5 | 5.64, br s | 81.4 | |
| 4 | 40.4 | 40.3 | 39.2 | ||||
| 5 | 1.10, m | 56.0 | 1.11, m | 56.1 | 1.53 | 50.9 | |
| 6 | α | 1.51 | 19.1 | 1.53 | 19.1 | 1.47 | 18.7 |
| β | 1.37 | 1.38 | 1.33 | ||||
| 7 | α | 1.57 | 33.7 | 1.56 | 33.8 | 1.62, m | 33.7 |
| β | 1.35 | 1.37 | 1.39 | ||||
| 8 | 40.3 | 40.5 | 40.6 | ||||
| 9 | 1.74, m | 48.4 | 1.76, m | 48.5 | 1.95 | 48.5 | |
| 10 | 38.7 | 38.8 | 39.2 | ||||
| 11 | α | 1.98 | 24.2 | 1.99 | 24.2 | 2.06 | 24.1 |
| β | 1.98 | 1.27 | 1.27 | ||||
| 12 | 5.47, m | 126.2 | 5.48, m | 126.2 | 5.49, m | 126.3 | |
| 13 | 139.5 | 139.5 | 139.5 | ||||
| 14 | 43.1 | 43.1 | 43.0 | ||||
| 15 | β | 2.31 | 29.1 | 2.32 | 29.1 | 2.33 | 29.0 |
| α | 1.24, m | 1.25, m | 1.22, m | ||||
| 16 | α | 2.30 | 25.3 | 2.32 | 25.4 | 2.30 | 25.3 |
| β | 2.12 | 2.10 | 2.09 | ||||
| 17 | 48.7 | 48.8 | 48.7 | ||||
| 18 | 2.77, d (11.8) | 56.0 | 2.78, d (11.8) | 56.1 | 2.76, d (11.6) | 56.0 | |
| 19 | 2.48, m | 38.2 | 2.48, m | 38.2 | 2.44, m | 38.2 | |
| 20 | 154.2 | 154.3 | 154.2 | ||||
| 21 | α | 2.27 | 33.2 | 2.30 | 33.2 | 2.28 | 33.2 |
| β | 2.43, m | 2.45, m | 2.40 | ||||
| 22 | β | 2.14 | 40.1 | 2.15 | 40.2 | 2.12, m | 40.1 |
| α | 2.03 | 2.02 | 2.02 | ||||
| 23 | 1.09, s | 29.5 | 1.10, s | 29.5 | 1.14, s | 28.9 | |
| 24 | 1.06, s | 18.7 | 1.05, s | 18.8 | 0.96, s | 22.5 | |
| 25 | 1.00, s | 17.4 | 1.01, s | 17.4 | 0.98, s | 17.1 | |
| 26 | 1.03, s | 17.9 | 1.04, s | 17.9 | 1.05, s | 17.9 | |
| 27 | 1.22, s | 24.2 | 1.23, s | 24.3 | 1.17, s | 24.2 | |
| 28 | 179.8 | 179.9 | 179.8 | ||||
| 29 | 1.13, d (6.4) | 17.1 | 1.14, d (6.1) | 17.1 | 1.11, d (6.1) | 17.1 | |
| 30 | a | 4.84, br s | 105.6 | 4.84, br s | 105.6 | 4.83, br s | 105.6 |
| b | 4.79, br s | 4.79, br s | 4.79, br s | ||||
| 1′ | 168.4 | 168.4 | 168.4 | ||||
| 2′ | 6.70, d (15.9) | 116.6 | 6.75, d (15.8) | 116.7 | 6.89, d (15.9) | 116.7 | |
| 3′ | 8.02, d (15.9) | 145.3 | 8.04, d (15.8) | 145.6 | 8.07, d (15.9) | 146.0 | |
| 4′ | 126.7 | 127.2 | 127.1 | ||||
| 5′ | 7.57, d (8.5) | 131.1 | 7.31, m | 112.0 | 7.24, m | 111.8 | |
| 6′ | 7.18, d (8.5) | 117.3 | 149.5 | 149.4 | |||
| 7′ | 161.8 | 151.5 | 151.5 | ||||
| 8′ | 7.18, d (8.5) | 117.3 | 7.23, m | 117.3 | 7.20, m | 117.2 | |
| 9′ | 7.57, d (8.5) | 131.1 | 7.23, m | 124.1 | 7.20, m | 124.5 | |
| Ome | 3.80, s | 56.4 | 3.72, s | 56.3 | |||
| Compounds | IC50 (μM) | Compounds | IC50 (μM) |
|---|---|---|---|
| 4 | 48.67 ± 5.17 | 11 | 26.20 ± 1.31 |
| 5 | 23.74 ± 0.73 | 12 | 16.20 ± 0.57 |
| 6 | 34.01 ± 4.88 | 13 | 10.32 ± 1.21 |
| 10 | 19.15 ± 0.22 | 15 | 17.12 ± 1.67 |
| Oleanolic acid a | 10.19 ± 0.12 |
Disclaimer/Publisher’s Note: The statements, opinions and data contained in all publications are solely those of the individual author(s) and contributor(s) and not of MDPI and/or the editor(s). MDPI and/or the editor(s) disclaim responsibility for any injury to people or property resulting from any ideas, methods, instructions or products referred to in the content. |
© 2024 by the authors. Licensee MDPI, Basel, Switzerland. This article is an open access article distributed under the terms and conditions of the Creative Commons Attribution (CC BY) license (https://creativecommons.org/licenses/by/4.0/).
Share and Cite
Huang, L.; Wang, Z.; Wang, F.; Wang, S.; Wang, D.; Gao, M.; Li, H.; Song, M.; Zhang, X. Triterpenoids from the Leaves of Diospyros digyna and Their PTP1B Inhibitory Activity. Molecules 2024, 29, 1640. https://doi.org/10.3390/molecules29071640
Huang L, Wang Z, Wang F, Wang S, Wang D, Gao M, Li H, Song M, Zhang X. Triterpenoids from the Leaves of Diospyros digyna and Their PTP1B Inhibitory Activity. Molecules. 2024; 29(7):1640. https://doi.org/10.3390/molecules29071640
Chicago/Turabian StyleHuang, Lan, Ziqi Wang, Fangxin Wang, Song Wang, Dezhi Wang, Meihua Gao, Hua Li, Min Song, and Xiaoqi Zhang. 2024. "Triterpenoids from the Leaves of Diospyros digyna and Their PTP1B Inhibitory Activity" Molecules 29, no. 7: 1640. https://doi.org/10.3390/molecules29071640
APA StyleHuang, L., Wang, Z., Wang, F., Wang, S., Wang, D., Gao, M., Li, H., Song, M., & Zhang, X. (2024). Triterpenoids from the Leaves of Diospyros digyna and Their PTP1B Inhibitory Activity. Molecules, 29(7), 1640. https://doi.org/10.3390/molecules29071640