
The Effect of Fermentation on the Chemical Constituents of Gastrodia Tuber Hallimasch Powder (GTHP) Estimated by UHPLC-Q-Orbitrap HRMS and HPLC
Abstract
1. Introduction
2. Results
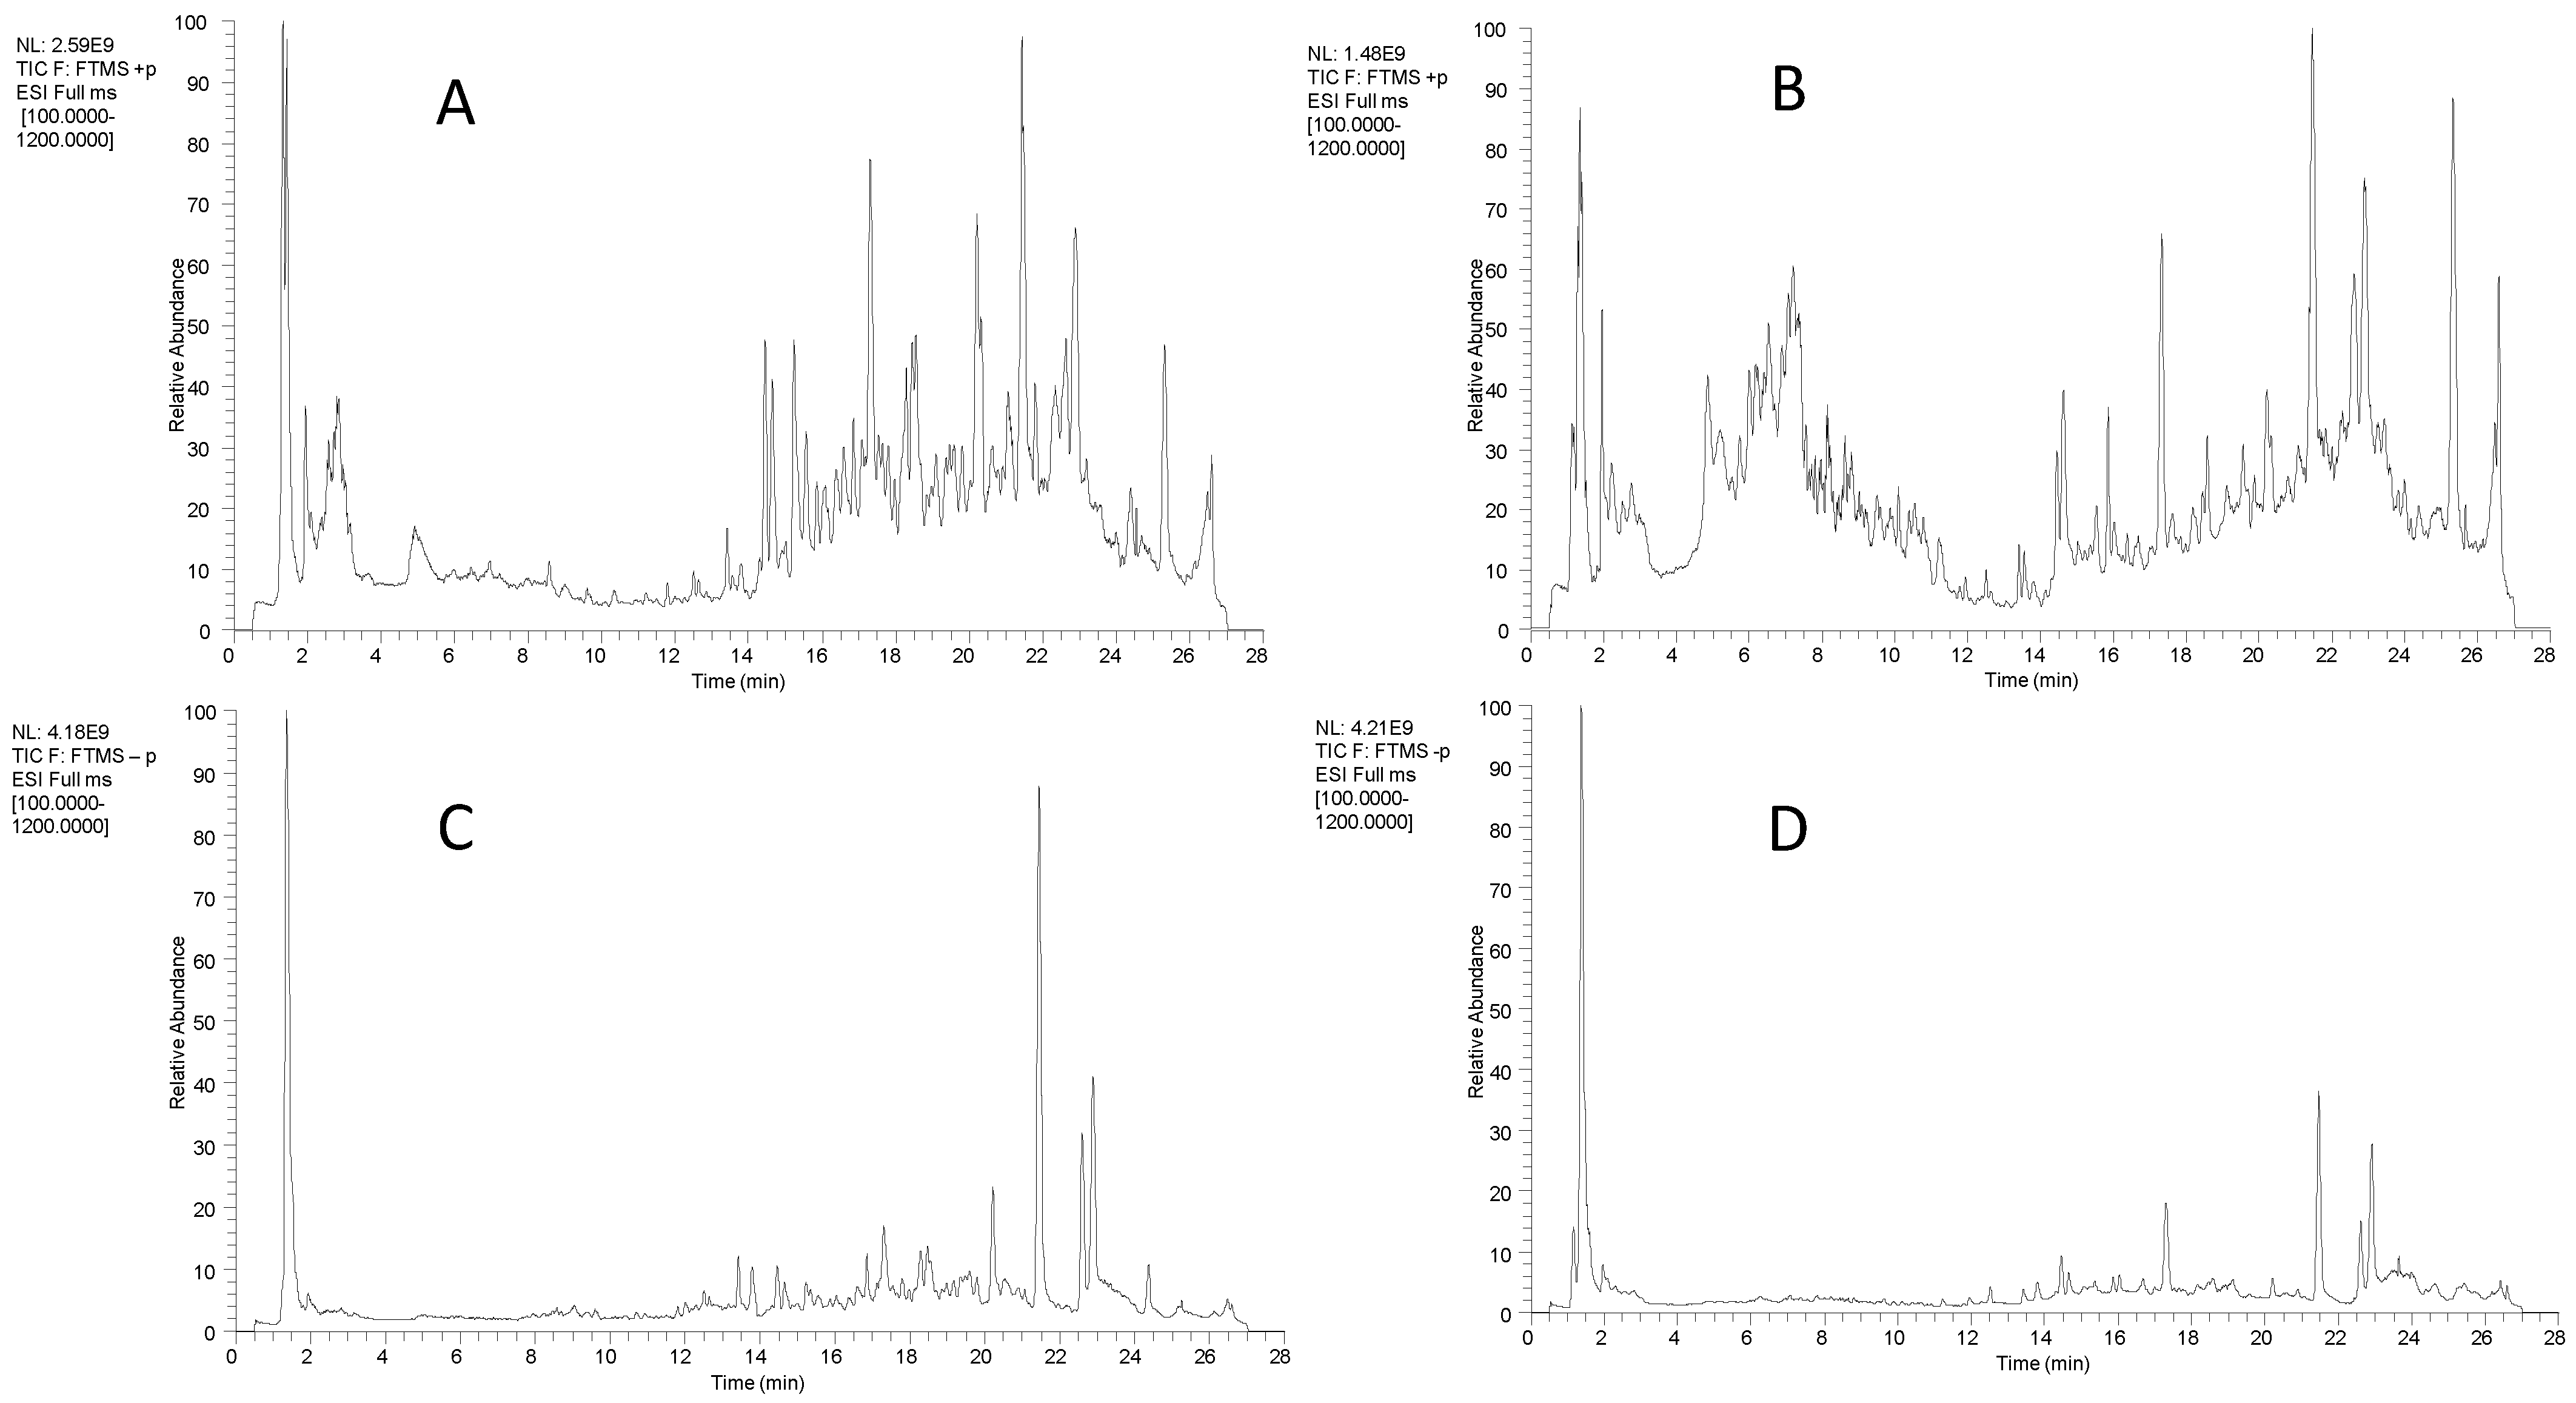
2.1. Results of UHPLC-Q-Orbitrap HRMS Analysis
2.1.1. Flavonoid Compounds of GTHP
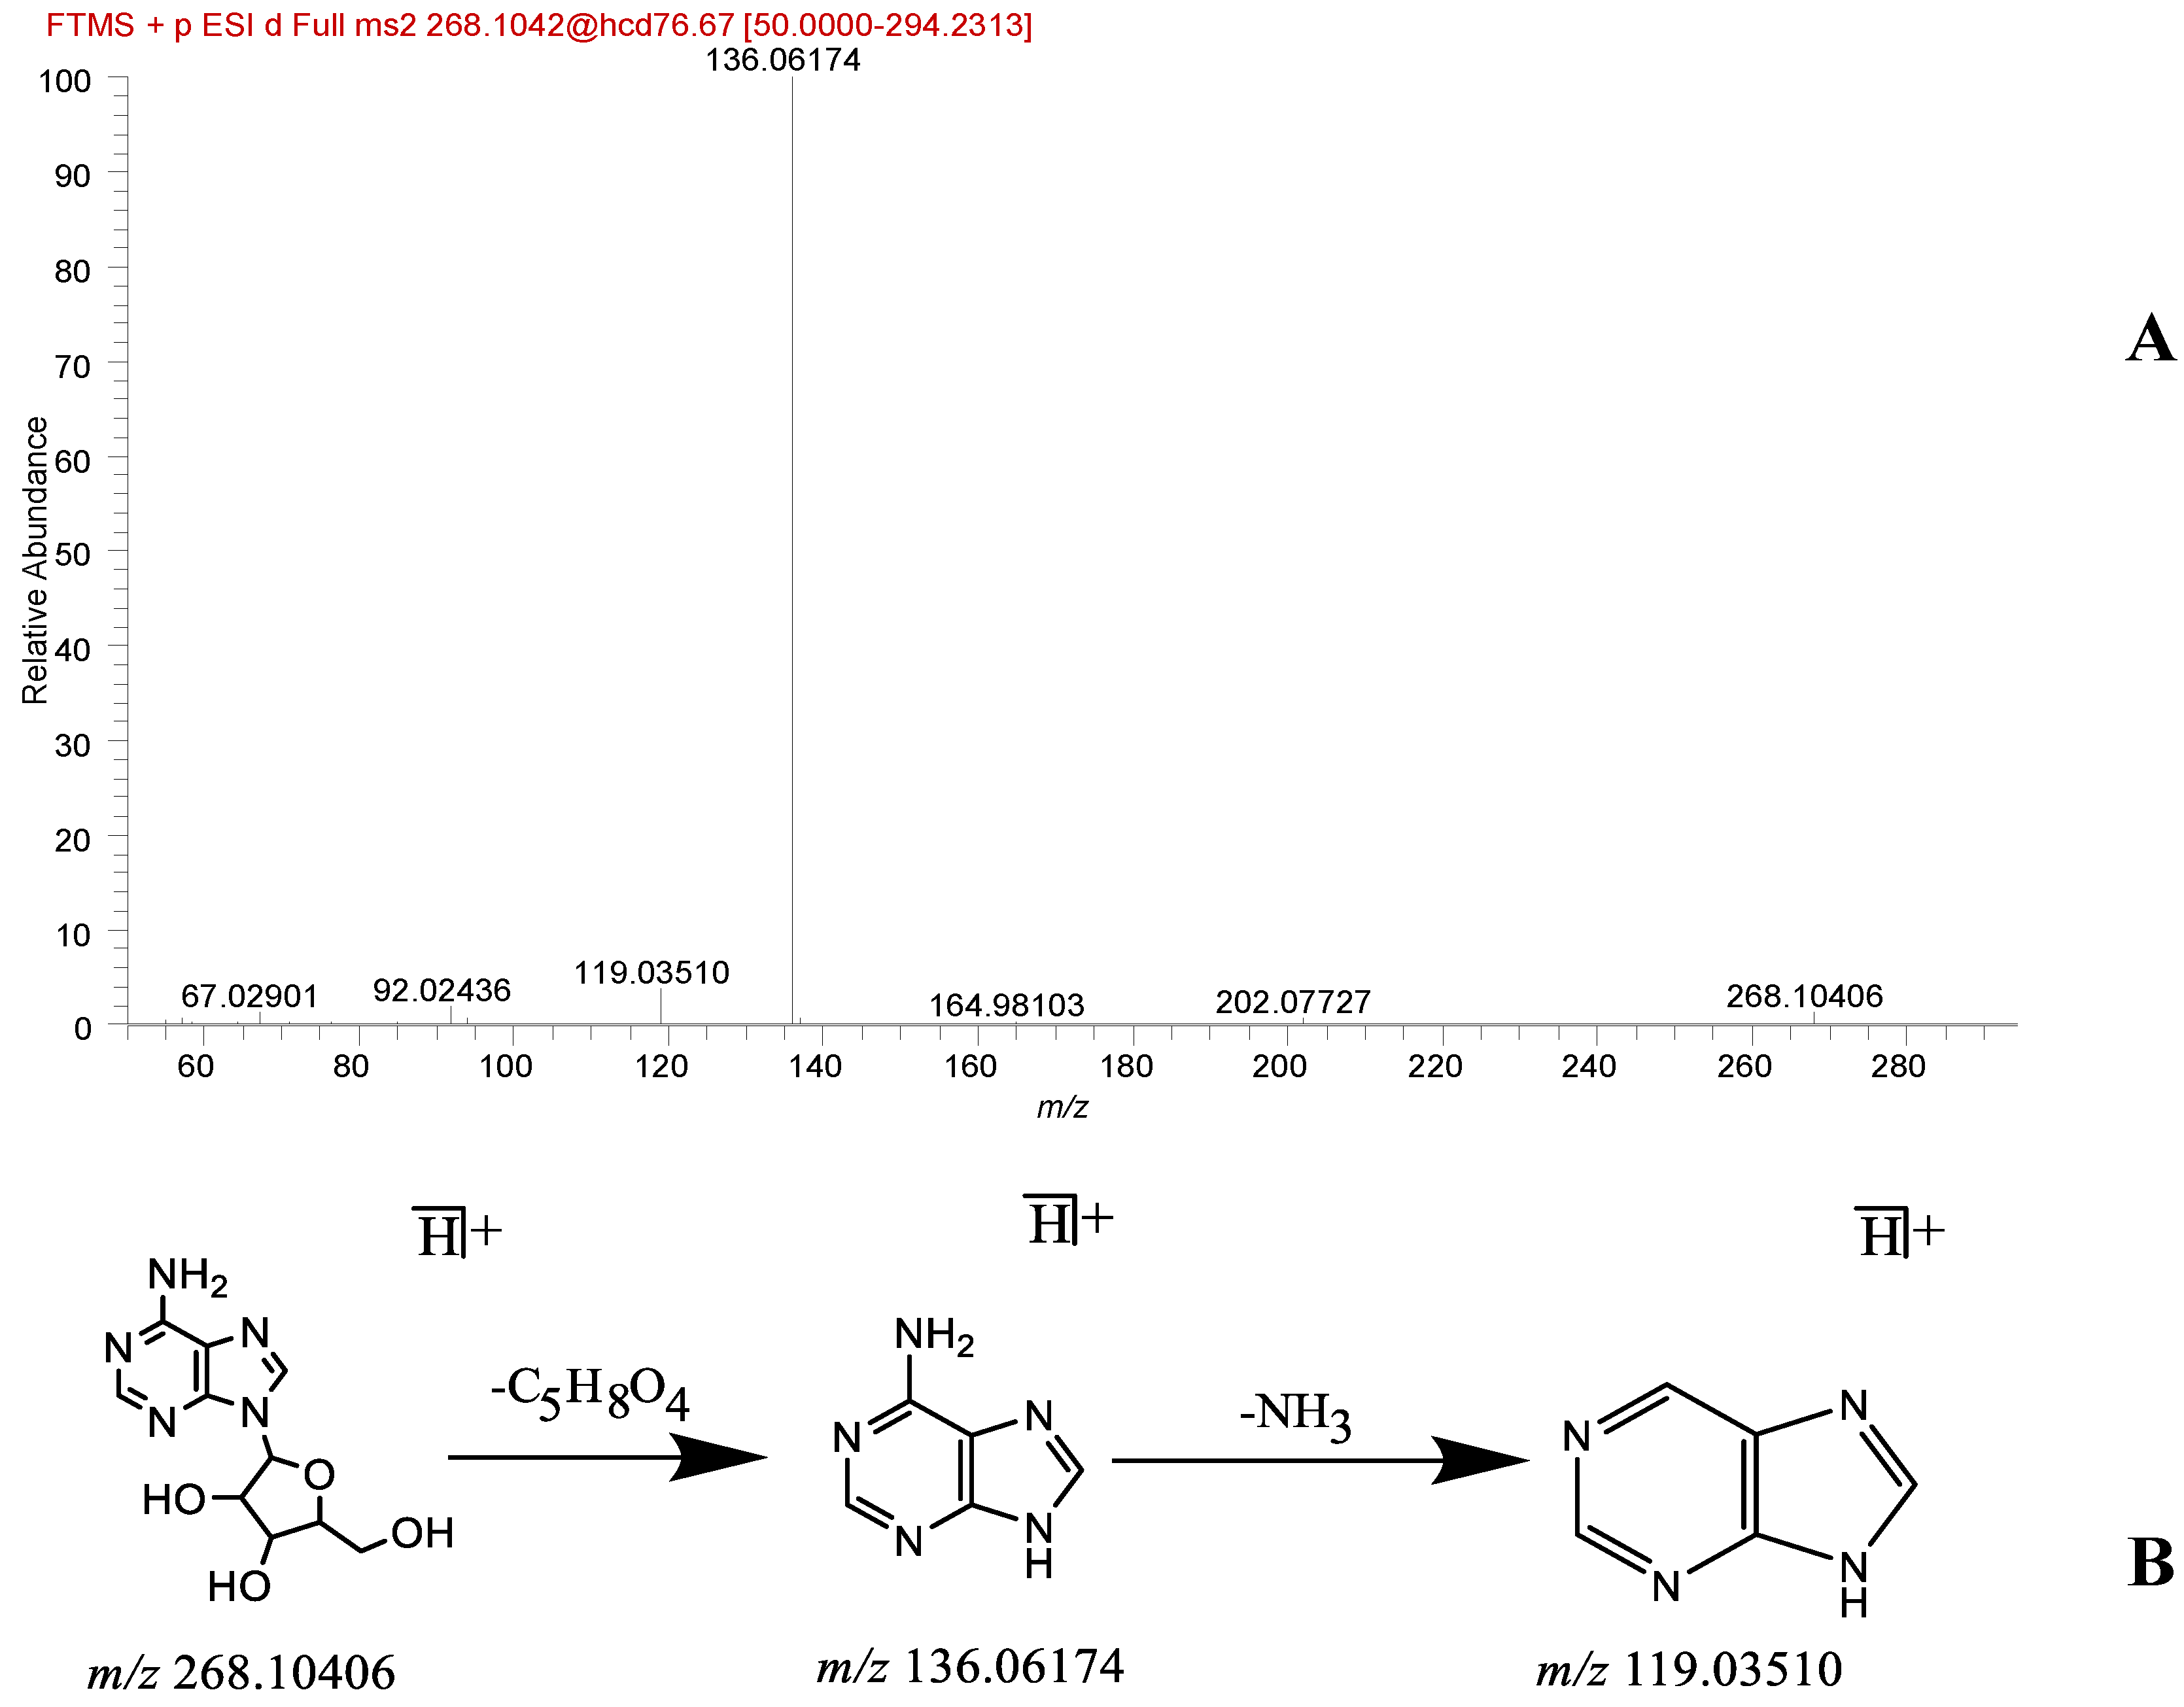
2.1.2. Organic Acids and Nucleoside Compounds in GTHP
2.1.3. Terpenoid Compounds in GTHP
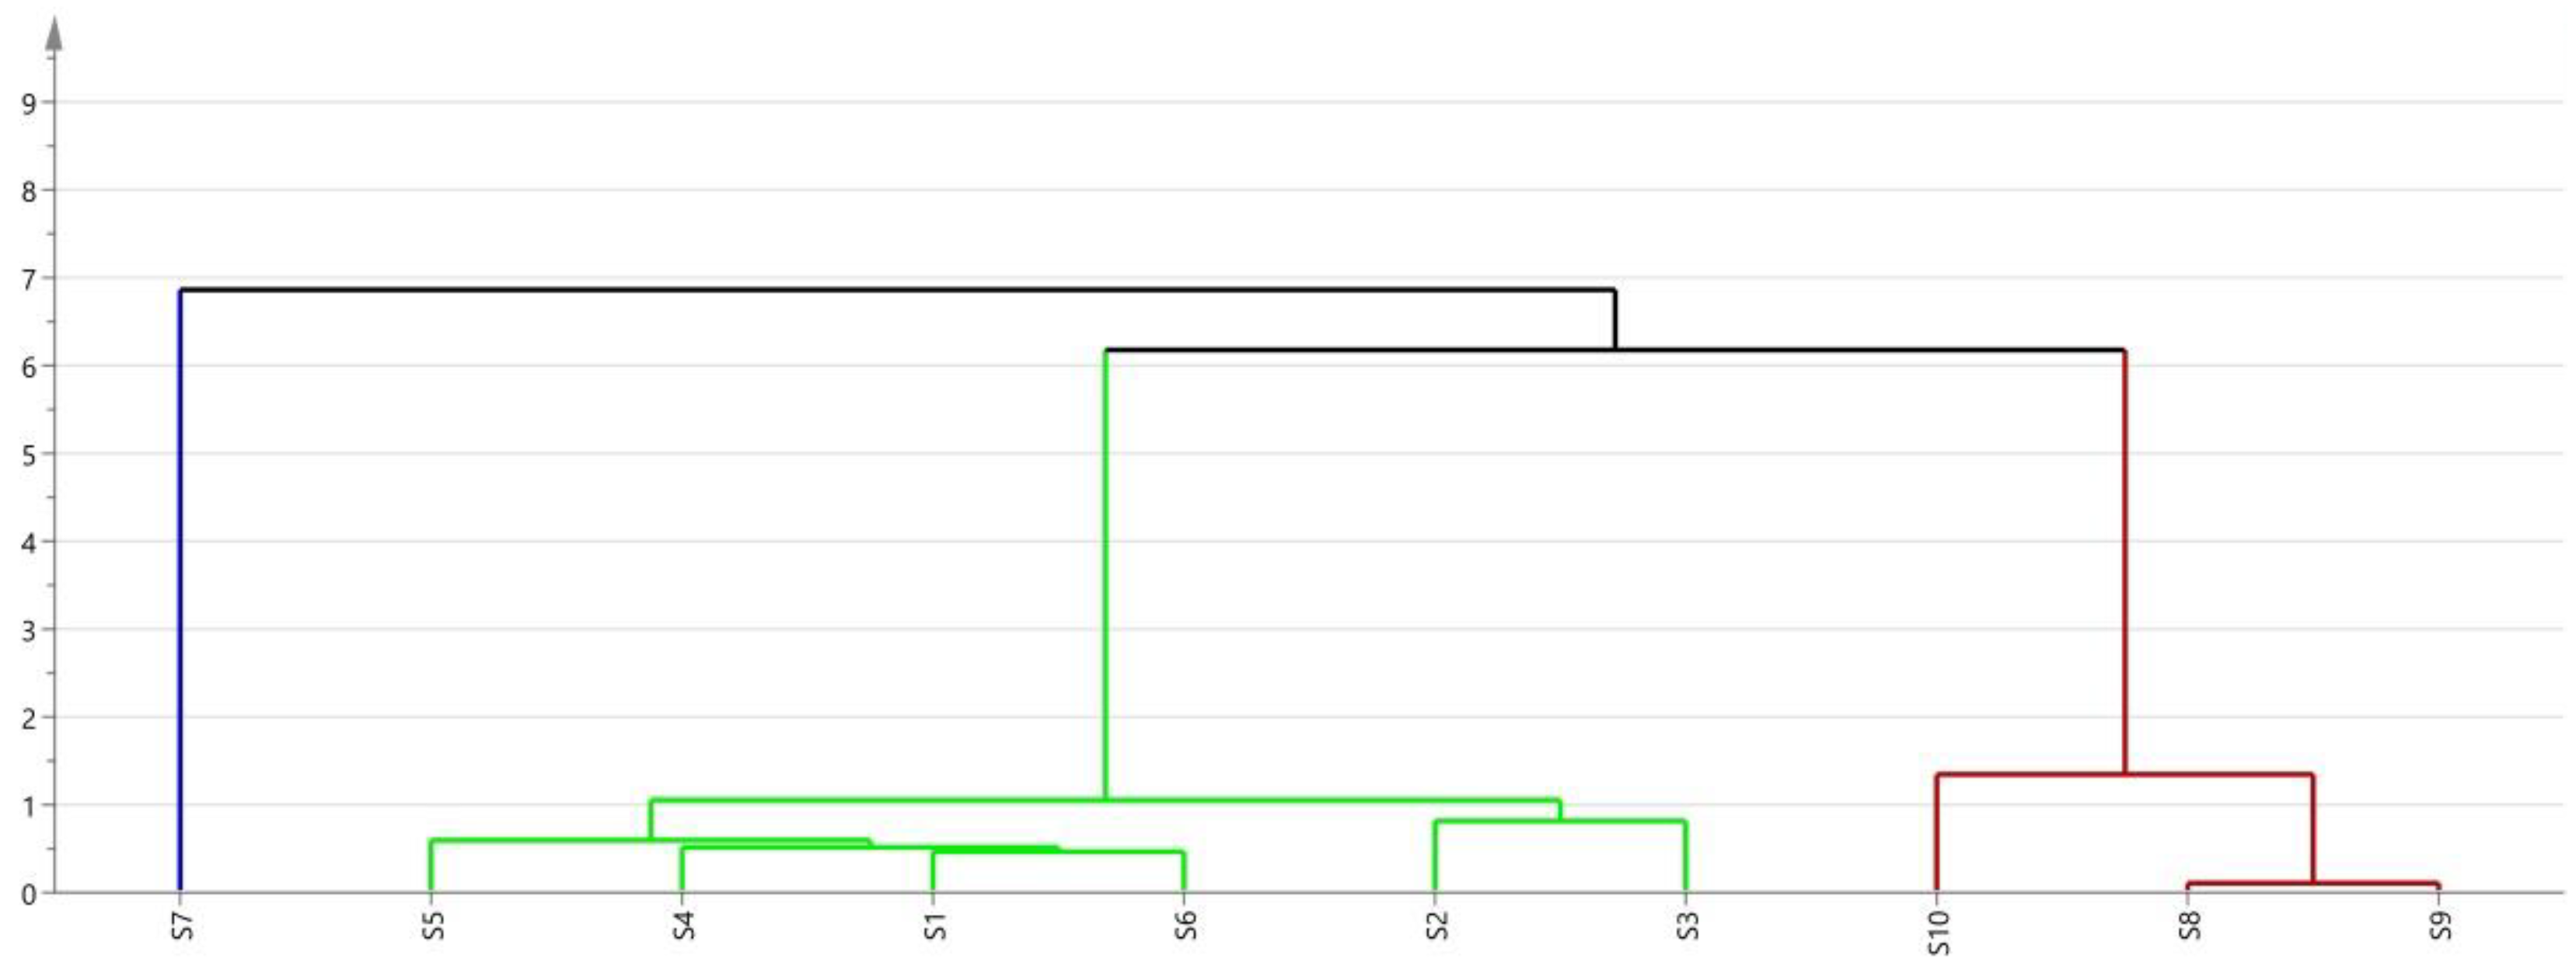
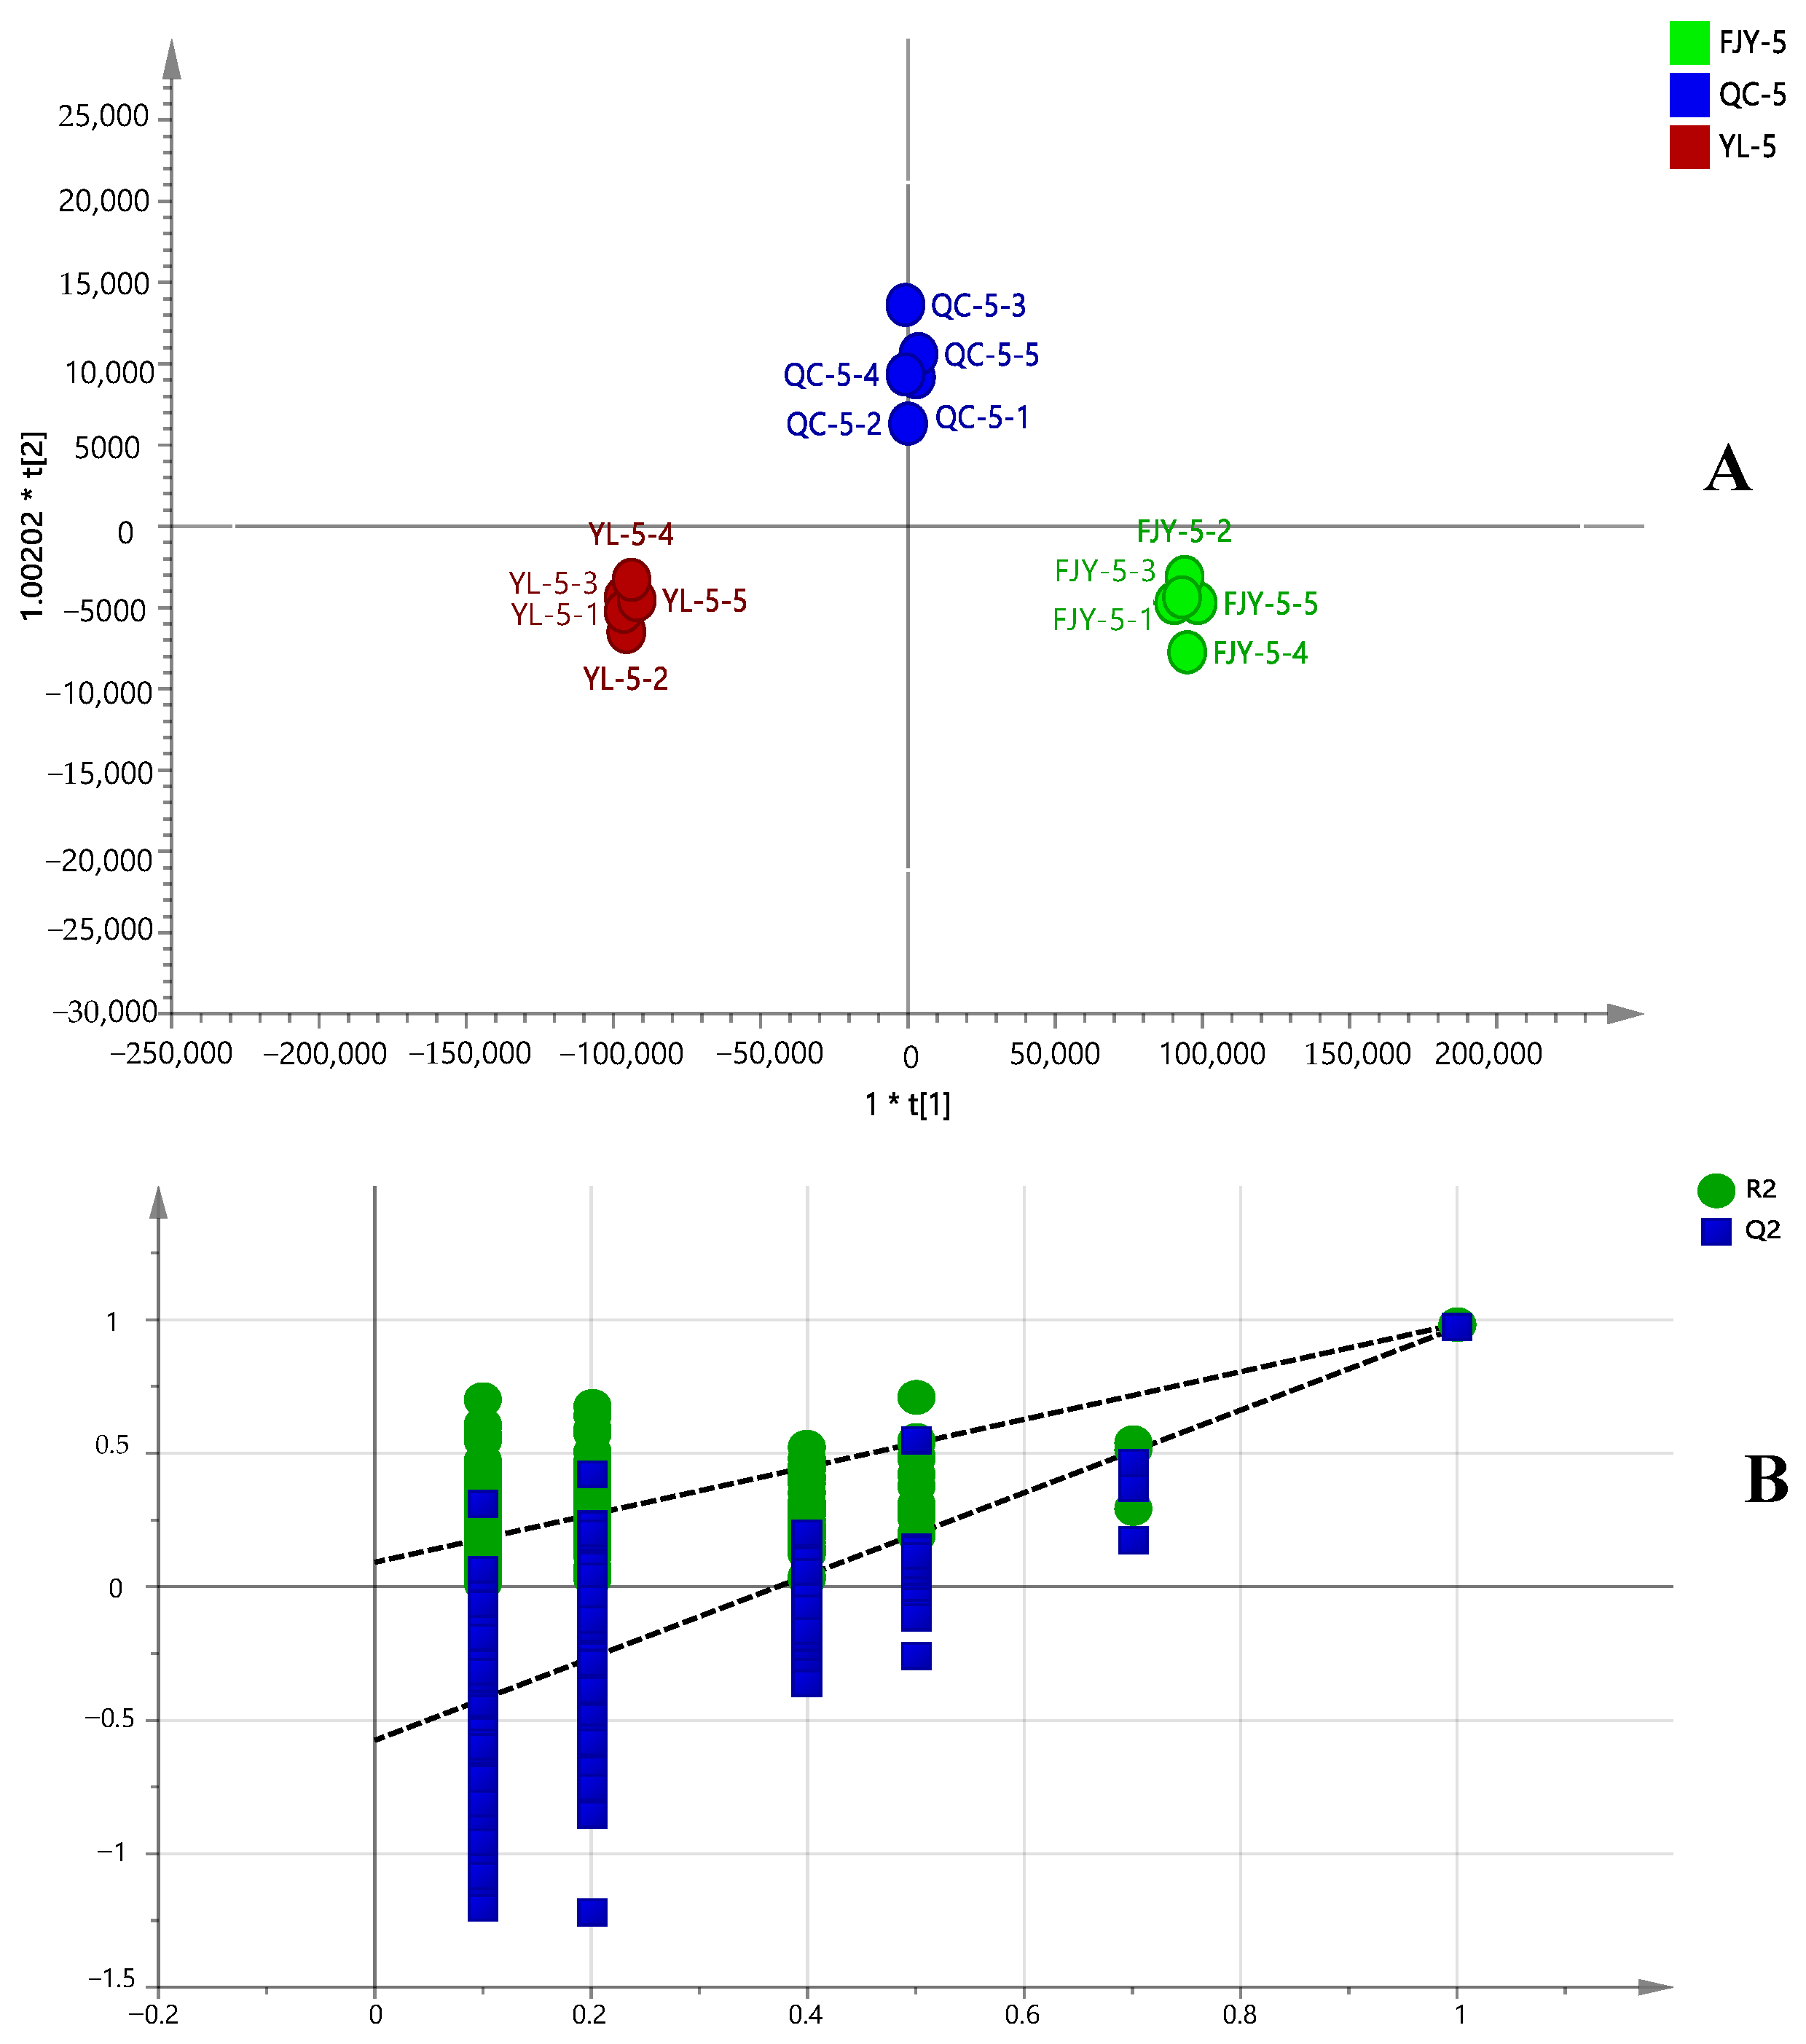
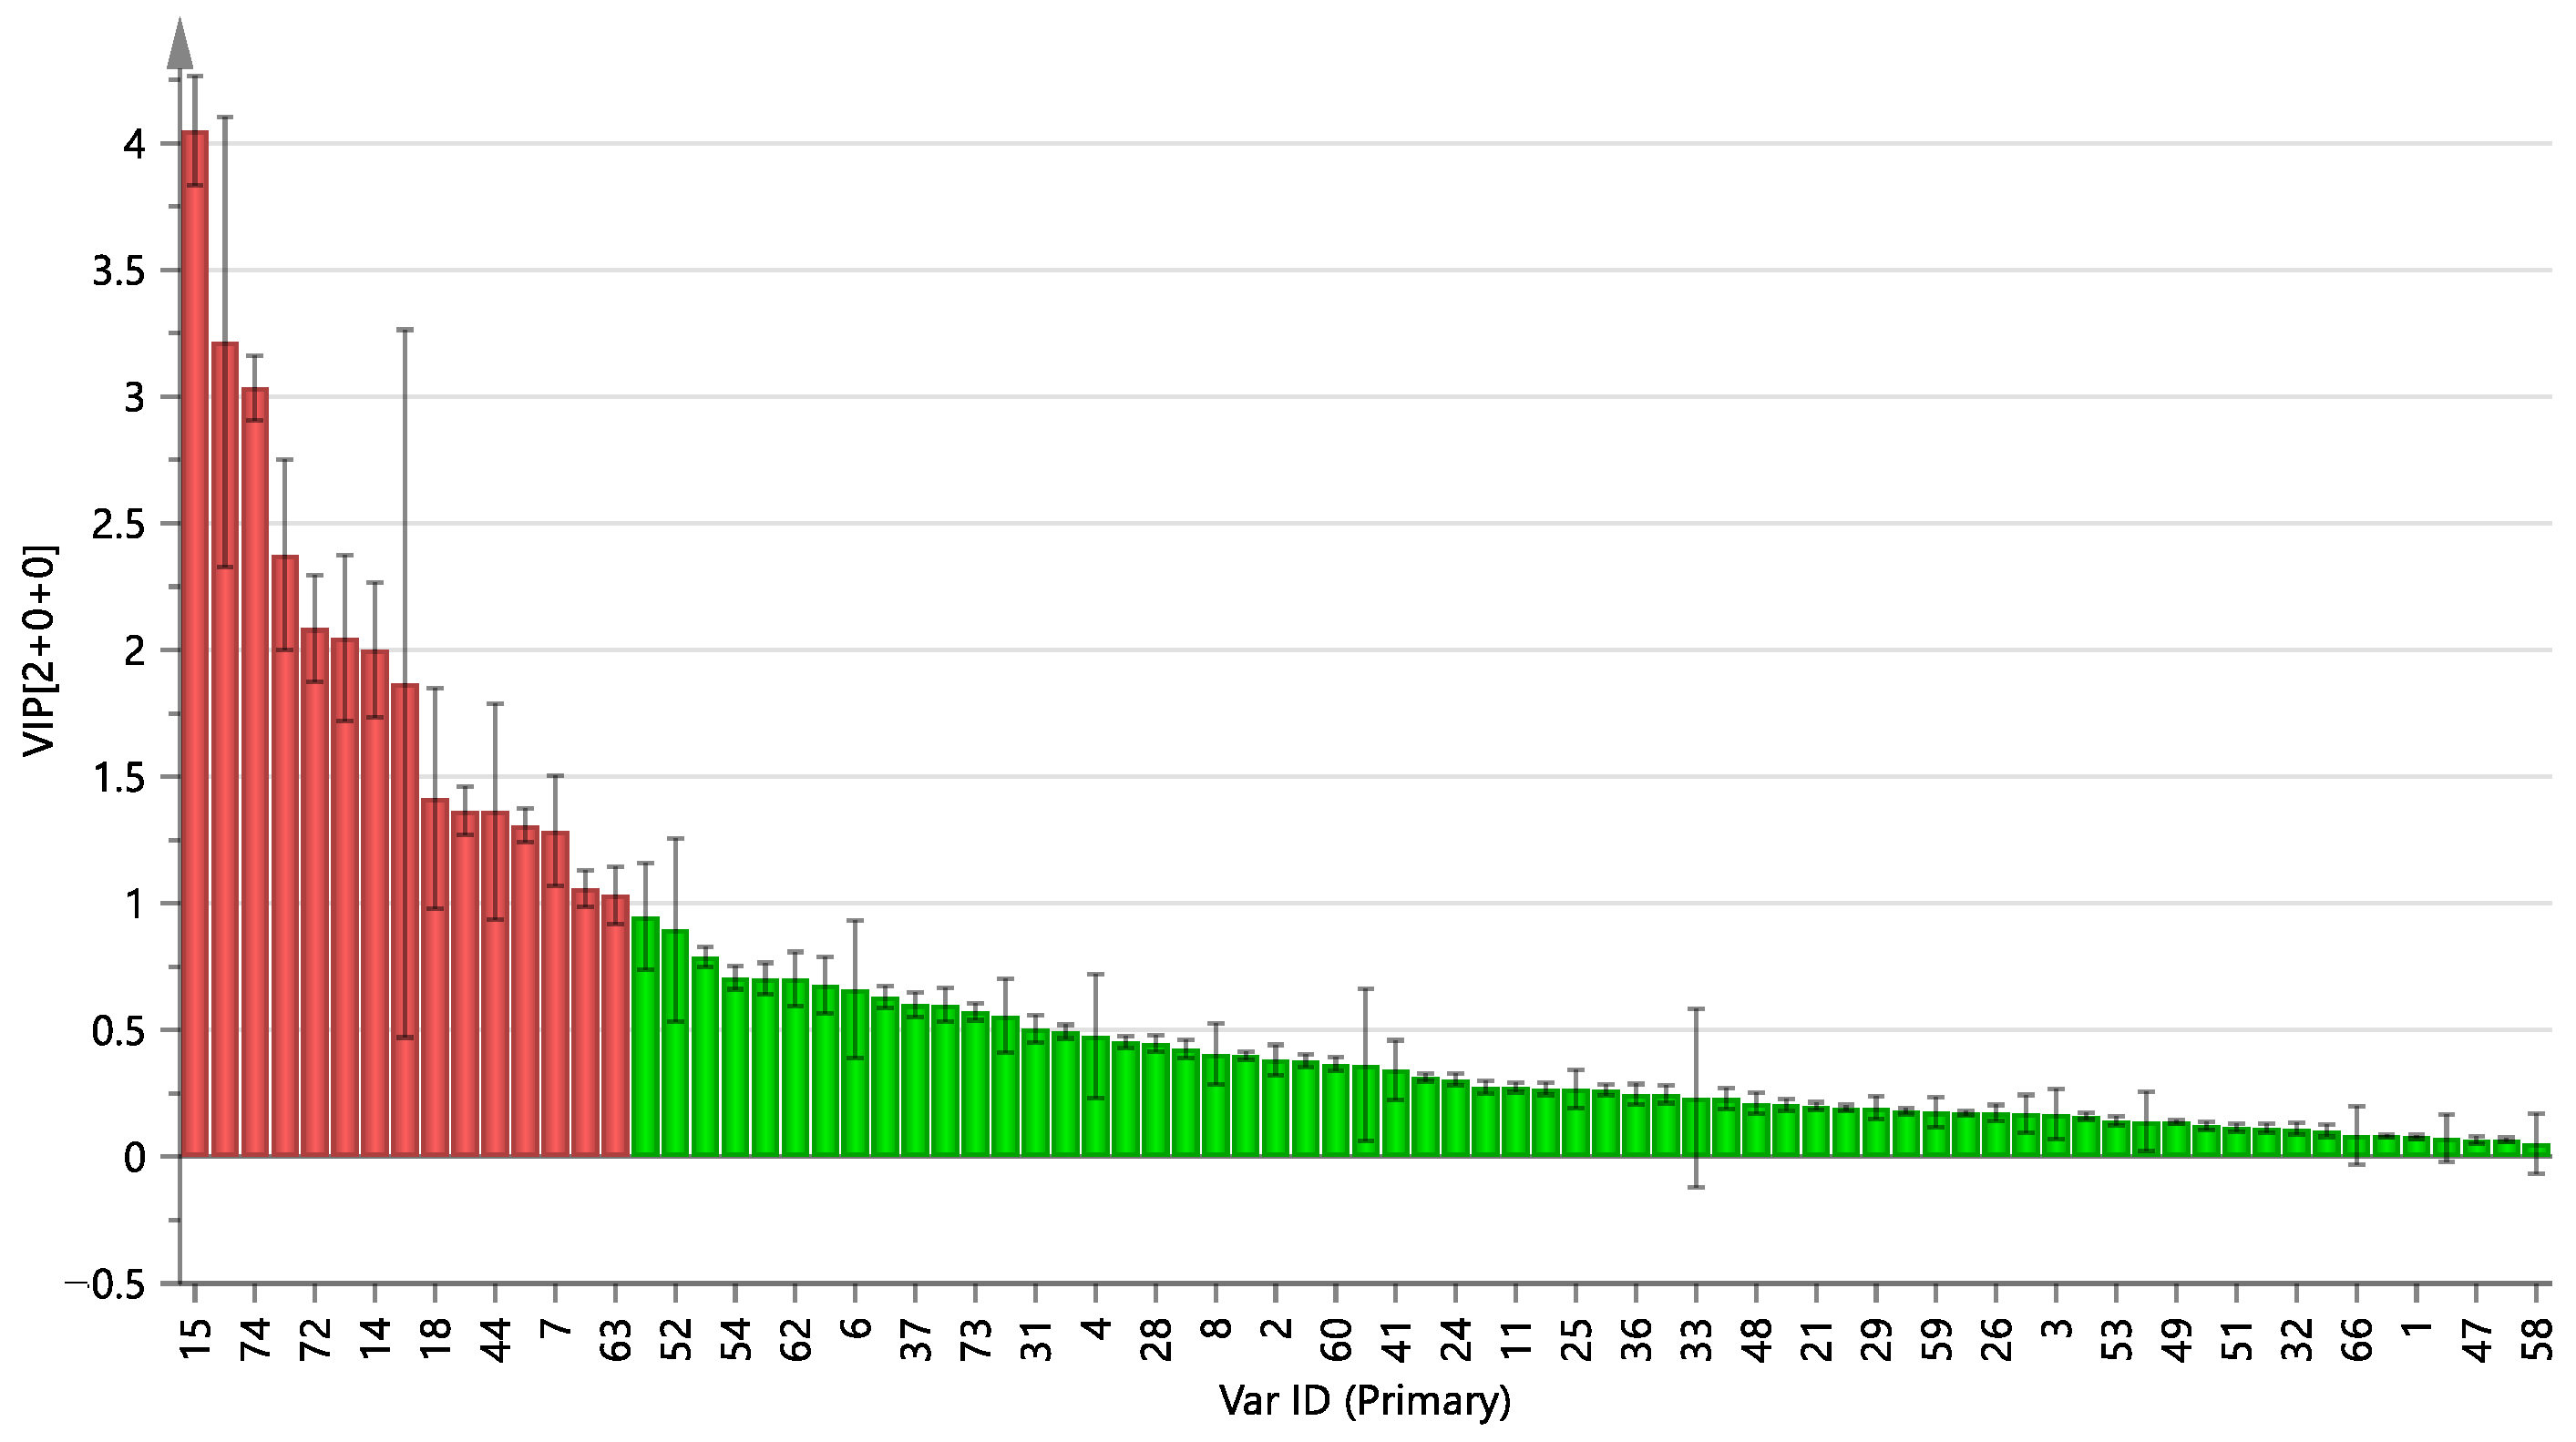
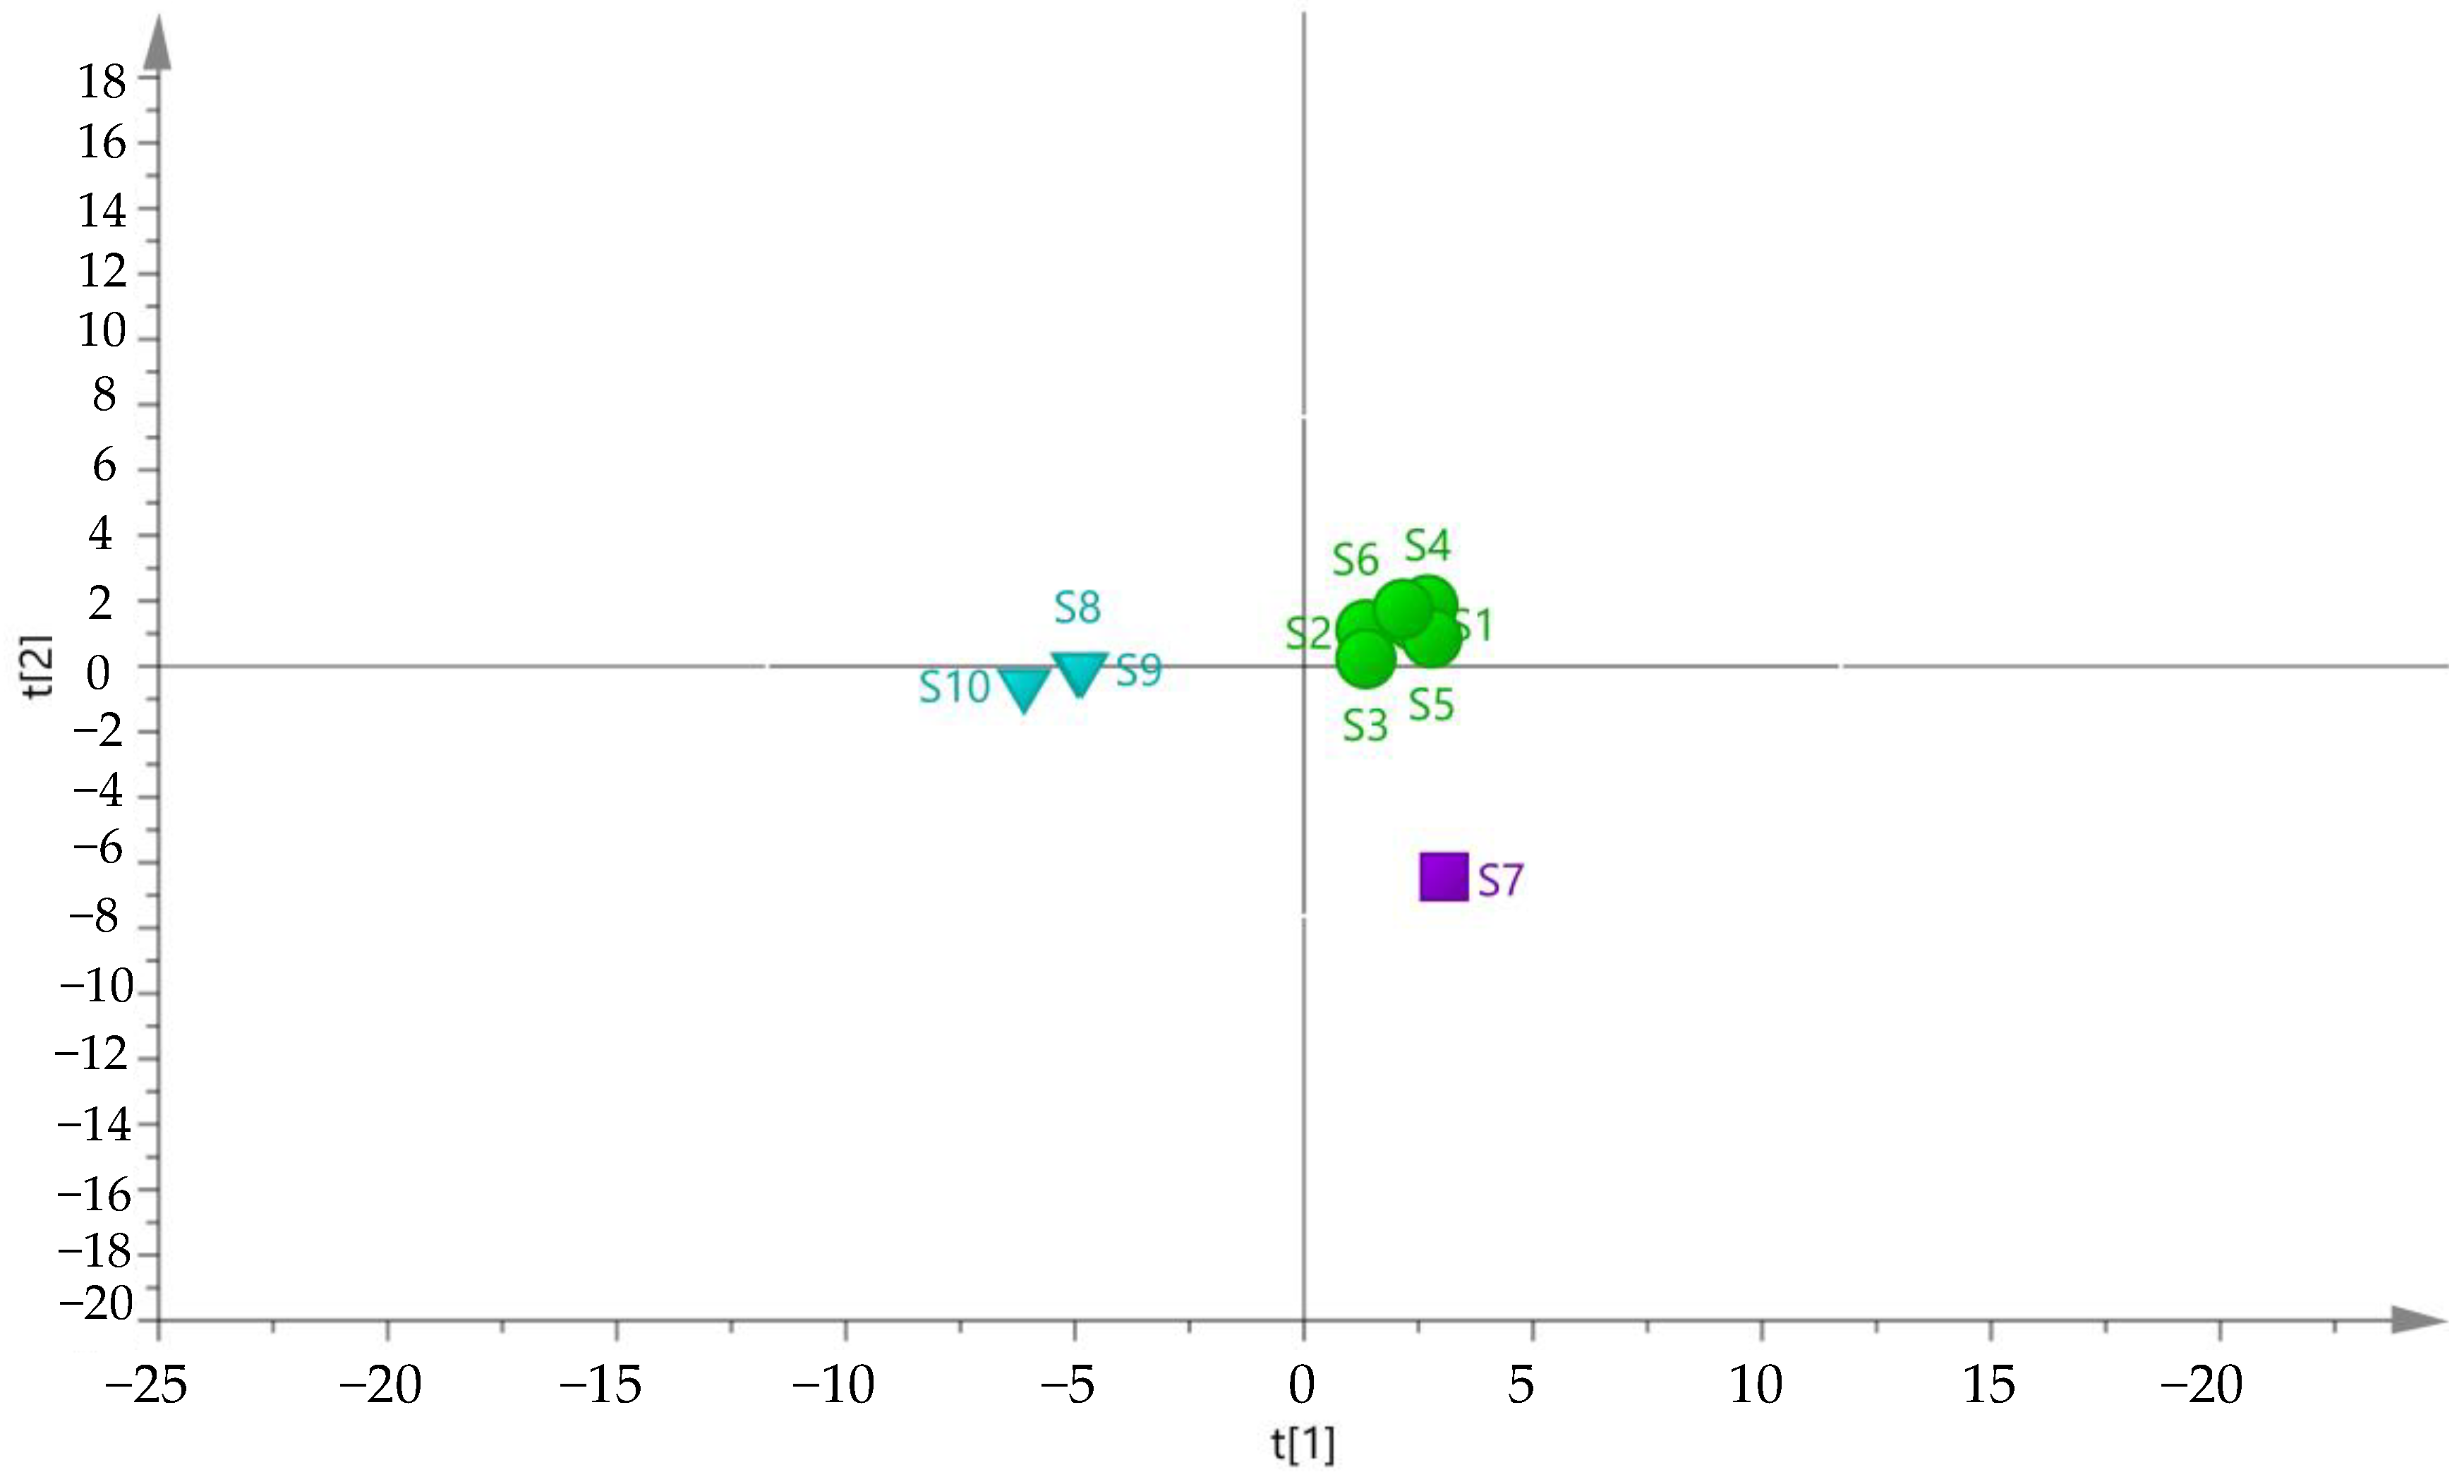
2.2. Orthogonal Projections to Latent Structures Discriminant Analysis of Pre- and Post-Fermented GTHP
2.3. Establishment of Fingerprinting and Multicomponent Content Determination of GTHP
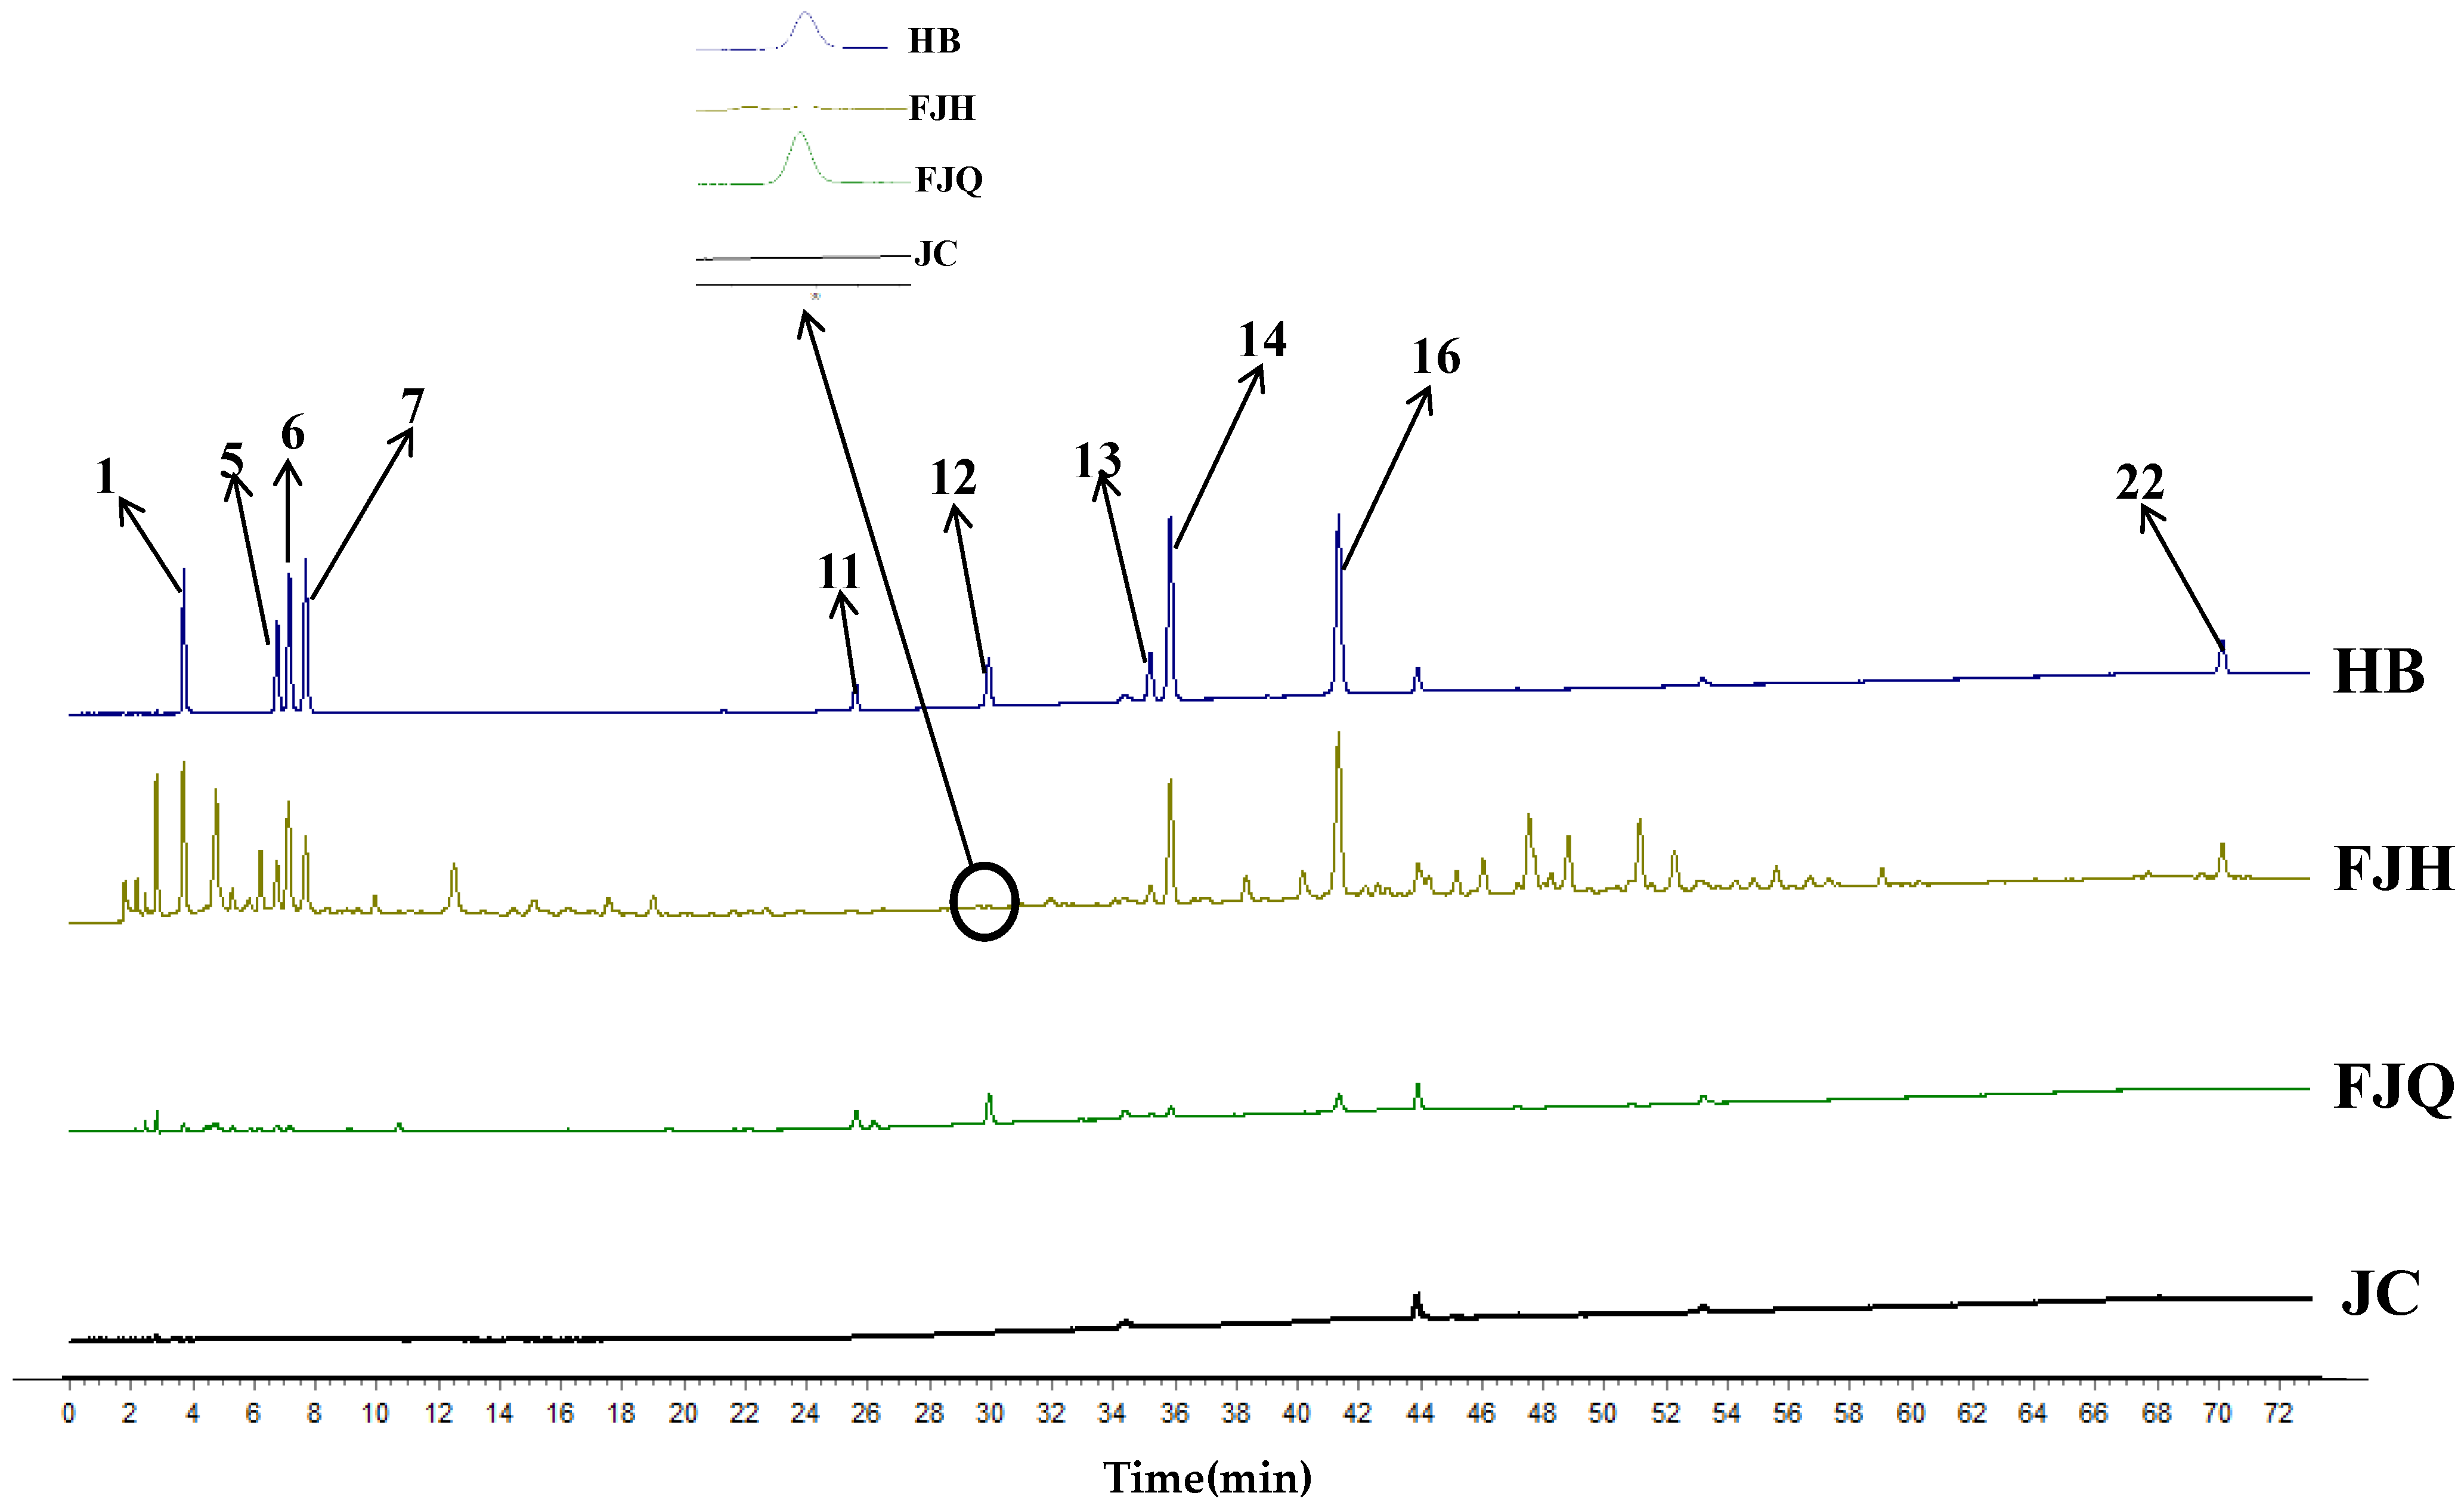
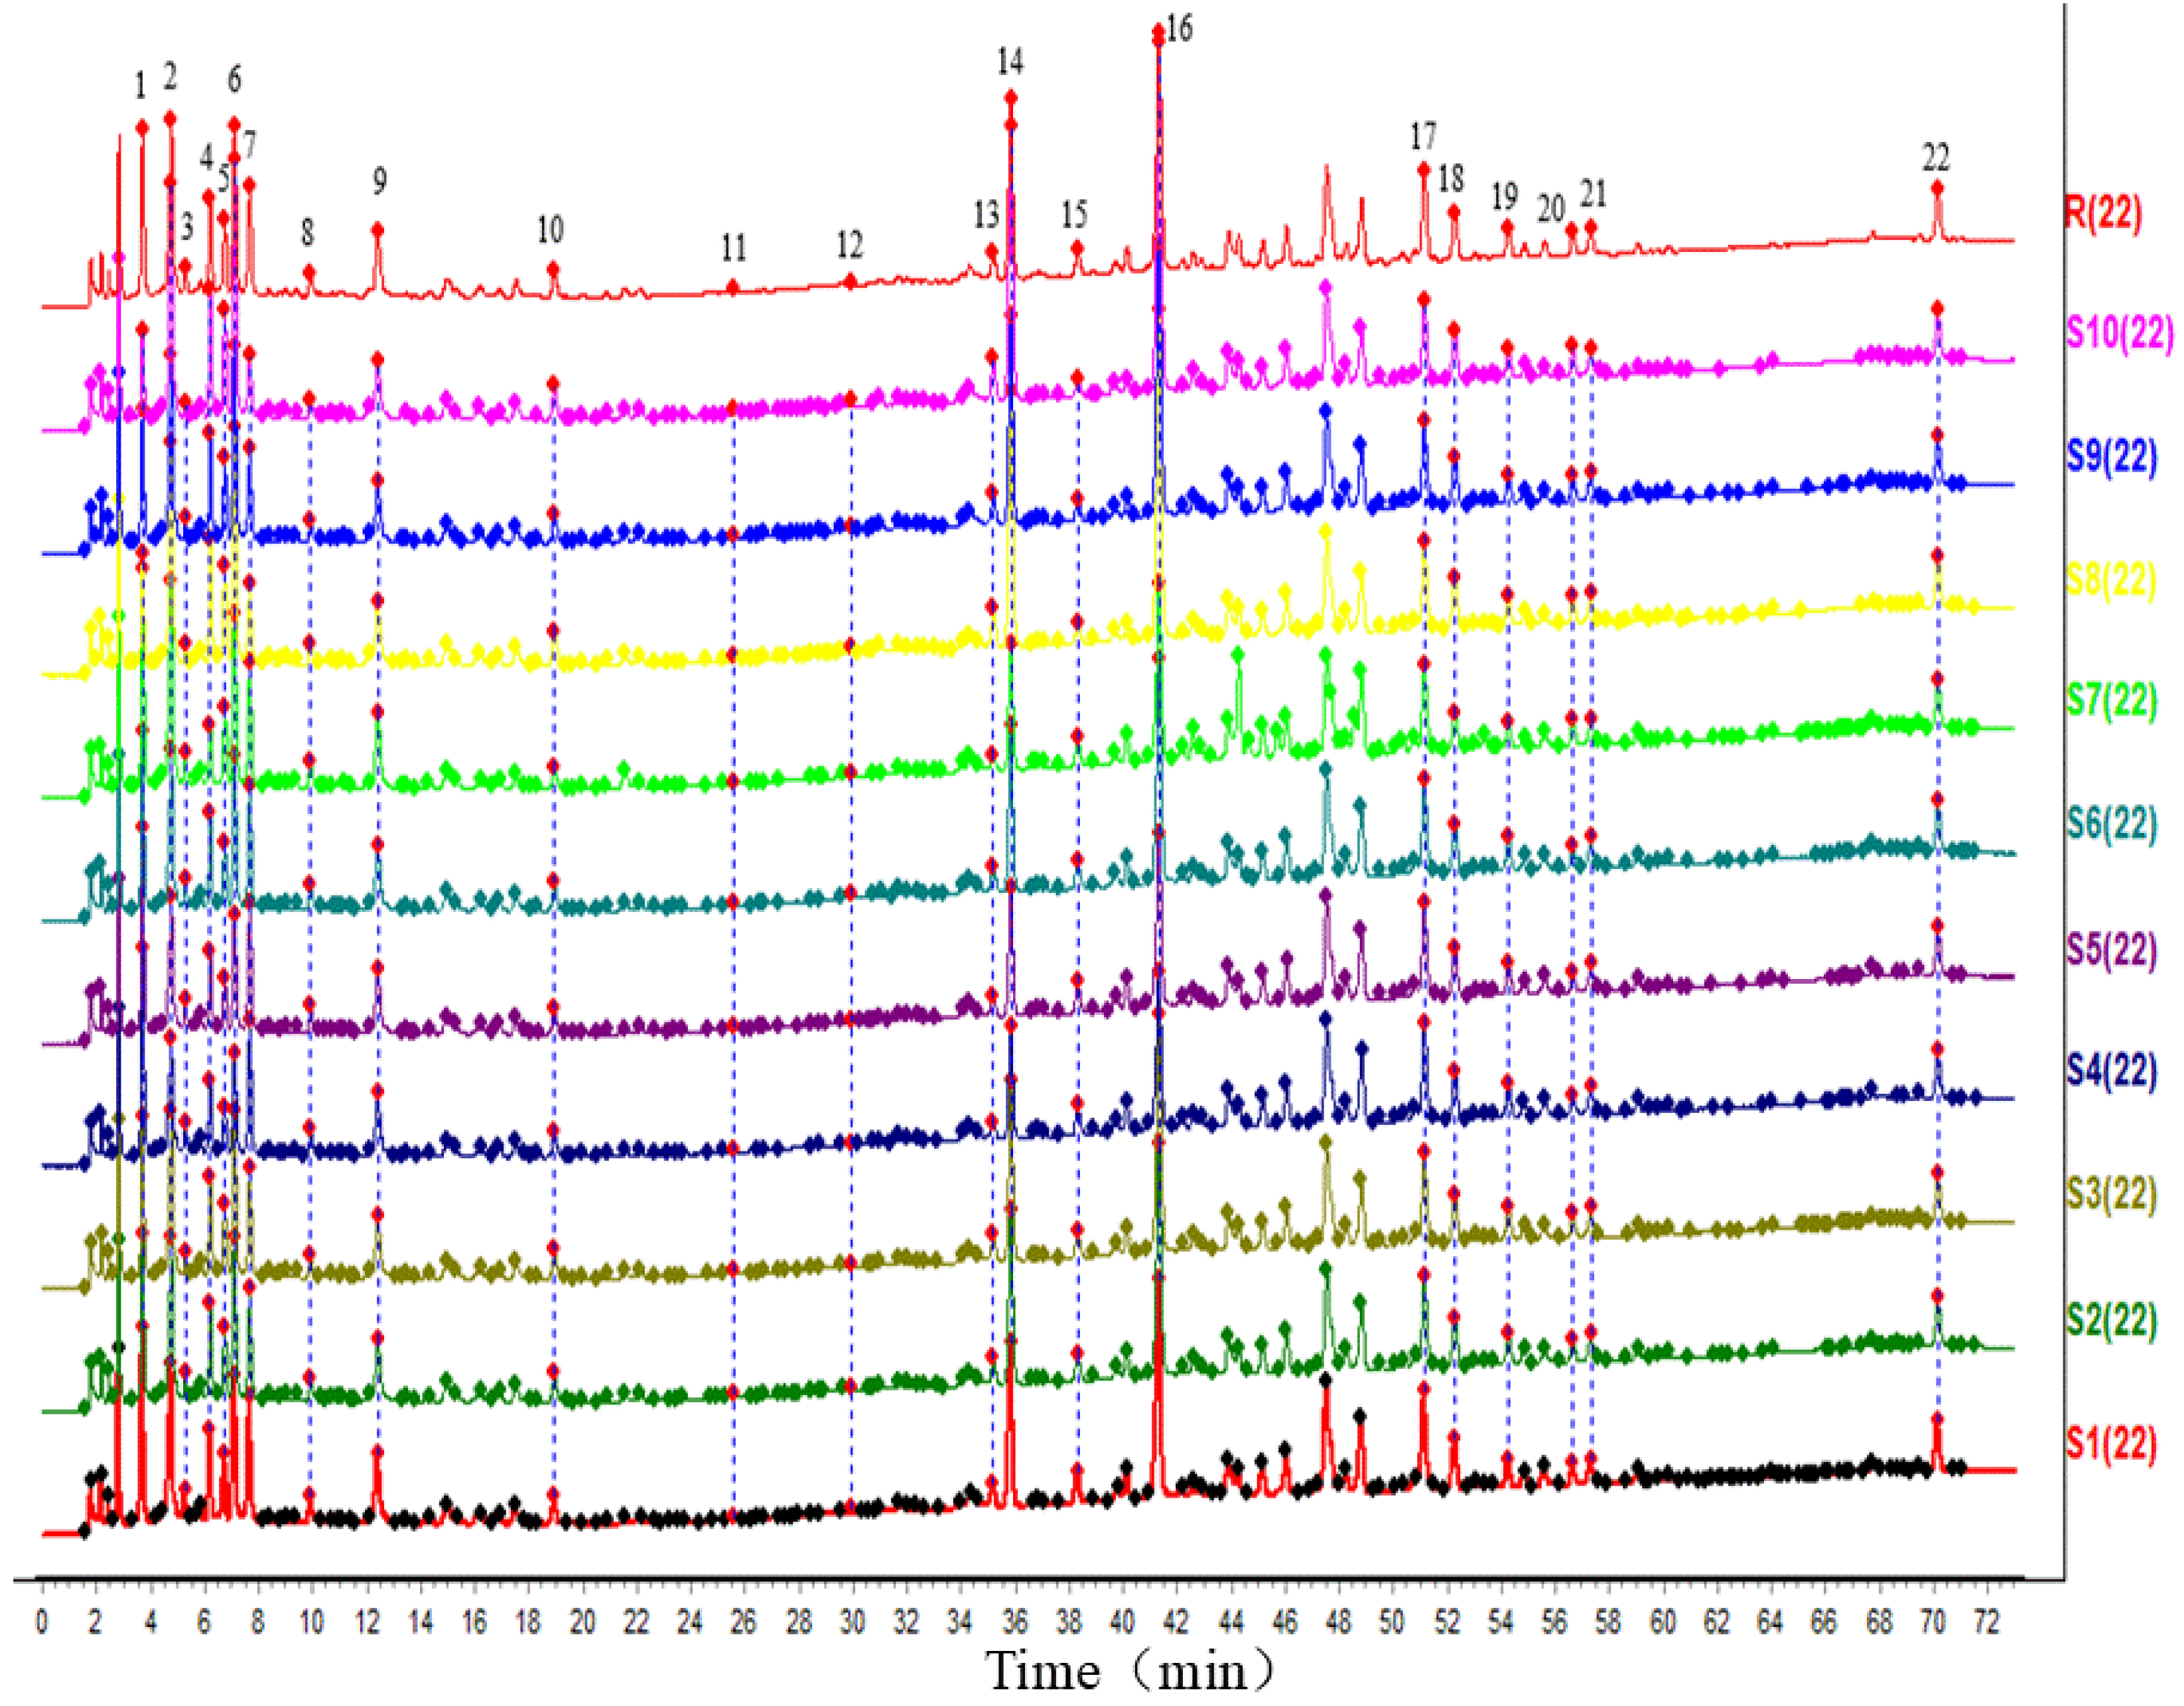
2.3.1. Establishment of Fingerprints for GTHP
2.3.2. Linear Investigation Results
2.3.3. Methodological Investigations
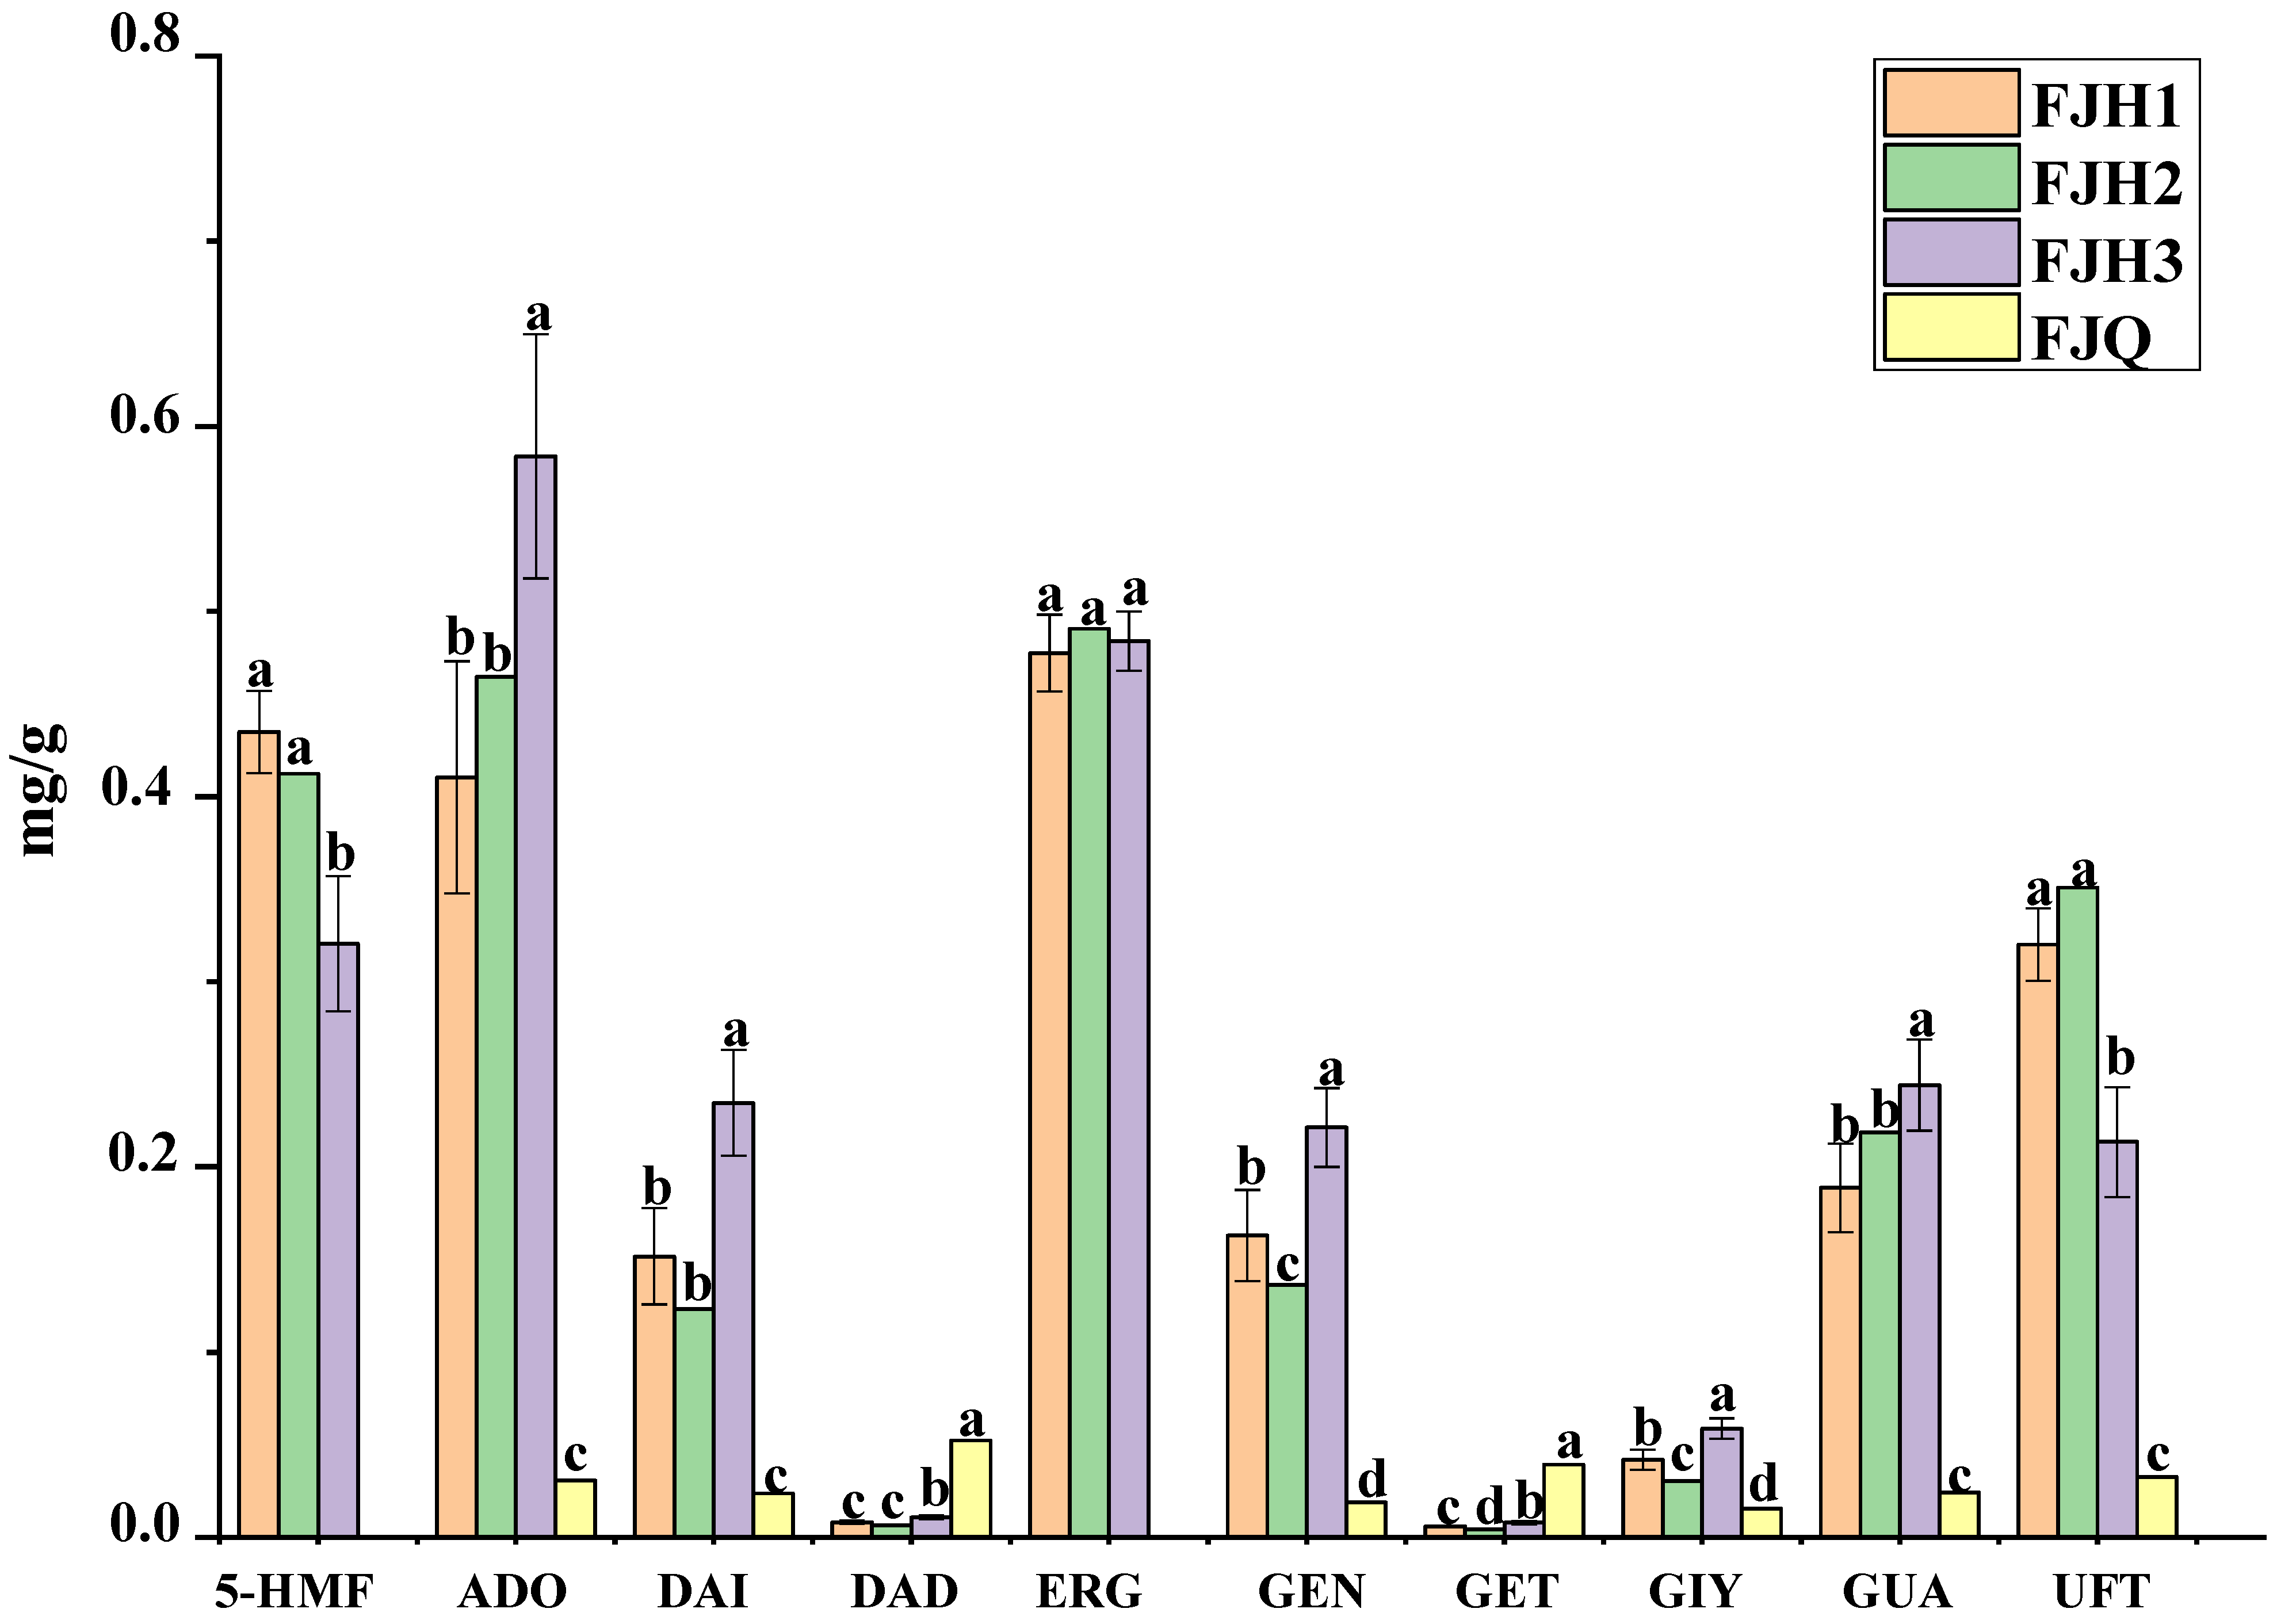
2.3.4. Content Analysis of GTHP Samples before and after Fermentation
3. Discussion
4. Materials and Methods
4.1. Materials
4.1.1. Experimental
4.1.2. Experimental Reagents and Medicinal Materials
4.2. Methods
4.2.1. Preparation of HRMS Test Solution
4.2.2. Preparation of HPLC Test Solutions
4.2.3. Preparation of Standard Solutions and Standard Curves for 10 Chemical Components
4.3. Analysis Conditions
4.3.1. UHPLC and Mass Spectrometry Conditions
4.3.2. HPLC Fingerprinting and Multicomponent Content Determination Conditions
4.4. Investigation of Linear Relationship
4.4.1. Precision Test
4.4.2. Stability Test
4.4.3. Repeatability Test
4.4.4. Sample Addition Recovery Test
4.4.5. LOD and LOQ Tests
4.5. Data Analysis and Processing
4.5.1. Data Processing UHPLC-Q-Orbitrap HRMS Chromatograms
4.5.2. Processing of GTHP Sample Content Determination Data
4.5.3. SPSS Software Processing of Pre- and Post-Fermentation GTHP Data
Author Contributions
Funding
Institutional Review Board Statement
Informed Consent Statement
Data Availability Statement
Acknowledgments
Conflicts of Interest
References
- Compiled by the State Pharmacopoeia Commission. National Standard for Pharmaceuticals: Upgrading of Chemical Drugs from Local to National Standard, Volume XIII. Natl. Pharmacopoeia Comm. 2002, 99. [Google Scholar]
- Ren, S.; Gao, Y.; Li, H.; Ma, H.; Han, X.; Yang, Z.; Chen, W. Research Status and Application Prospects of the Medicinal Mushroom Armillaria mellea. Appl. Biochem. Biotechnol. 2023, 195, 3491–3507. [Google Scholar] [CrossRef] [PubMed]
- Zhang, T.; Du, Y.; Liu, X.; Sun, X.; Cai, E.; Zhu, H.; Zhao, Y. Study on antidepressant-like effect of protoilludane sesquiterpenoid aromatic esters from Armillaria Mellea. Nat. Prod. Res. 2021, 35, 1042–1045. [Google Scholar] [CrossRef] [PubMed]
- Geng, Y.; Zhu, S.; Cheng, P.; Lu, Z.-M.; Xu, H.-Y.; Shi, J.-S.; Xu, Z.-H. Bioassay-guided fractionation of ethyl acetate extract from Armillaria mellea attenuates inflammatory response in lipopolysaccharide (LPS) stimulated BV-2 microglia. Phytomedicine 2017, 26, 55–61. [Google Scholar] [CrossRef] [PubMed]
- Baokui, X.; Zhang, Y. The Prevention and Treatment of Polysaccharide from the Rhizomorph of Armillaria mellea on Diabetic Cataract in Rat. Agric. Sci. Technol. 2014, 15, 1086–1088. [Google Scholar]
- Li, Z.; Wang, Y.; Jiang, B.; Li, W.; Zheng, L.; Yang, X.; Bao, Y.; Sun, L.; Huang, Y.; Li, Y. Structure, cytotoxic activity and mechanism of protoilludane sesquiterpene aryl esters from the mycelium of Armillaria mellea. J. Ethnopharmacol. 2016, 184, 119–127. [Google Scholar] [CrossRef] [PubMed]
- Dörfer, M.; Heine, D.; König, S.; Gore, S.; Werz, O.; Hertweck, C.; Gressler, M.; Hoffmeister, D. Melleolides impact fungal translation via elongation factor 2. Org. Biomol. Chem. 2019, 17, 4906–4916. [Google Scholar] [CrossRef]
- Gong, H.-Q. Oral Hypoglycemic Effects of Polysaccharides from Amillariella Mellea and Their Mechanisms. Master’s Thesis, Northeast Normal University, Changchun, China, 2018. [Google Scholar]
- Zhang, K.; Zhang, T.-T.; Guo, R.-R.; Ye, Q.; Zhao, H.-L.; Huang, X.-H. The regulation of key flavor of traditional fermented food by microbial metabolism: A review. Food Chem. X 2023, 19, 100871. [Google Scholar] [CrossRef]
- Zhang, P.; Li, S.; Li, J.; Wei, F.; Cheng, X.; Zhang, G.; Ma, S.; Liu, B. Identification of Ophiocordyceps sinensis and its artificially cultured Ophiocordyceps mycelia by ultra-performance liquid chromatography/Orbitrap fusion mass spectrometry and chemometrics. Molecules 2018, 23, 1013. [Google Scholar] [CrossRef]
- Wang, Y.; Wang, R.; Zhang, Z.; Chen, Y.; Sun, M.; Qiao, J.; Du, Z. Analysis of Chemical Constituents of Traditional Chinese Medicine Jianqu before and after Fermentation Based on LC-MS/MS. Molecules 2022, 28, 53. [Google Scholar] [CrossRef]
- Liu, W.; Luo, X.; Qiu, S.; Huang, W.; Su, Y.; Li, L. Determining the changes in metabolites of Dendrobium officinale juice fermented with starter cultures containing Saccharomycopsis fibuligera FBKL2.8DCJS1 and Lactobacillus paracasei FBKL1.3028 through untargeted metabolomics. BMC Microbiol. 2023, 23, 67. [Google Scholar] [CrossRef] [PubMed]
- Ai, S.; Tang, W.; Guo, R.L.; Li, J.Q.; Yang, W.; He, Z.G. Research progress on Chinese herbal medicine fermentation and profile of active substances derived. Zhongguo Zhongyao Zazhi 2019, 44, 1110–1118. [Google Scholar]
- Meng, C.; Han, Q.; Wang, X.; Liu, X.; Fan, X.; Liu, R.; Wang, Q.; Wang, C. Determination and Quantitative Comparison of Nucleosides in two Cordyceps by HPLC–ESI–MS-MS. J. Chromatogr. Sci. 2019, 57, 426–433. [Google Scholar] [CrossRef]
- Rashed, M.S.; Saadallah, A.A.; Rahbeeni, Z.; Eyaid, W.; Seidahmed, M.Z.; Al-Shahwan, S.; Salih, M.A.; Osman, M.E.; Al-Amoudi, M.; Al-Ahaidib, L. Determination of urinary S-sulphocysteine, xanthine and hypoxanthine by liquid chromatography–electrospray tandem mass spectrometry. Biomed. Chromatogr. 2005, 19, 223–230. [Google Scholar] [CrossRef] [PubMed]
- Qin, W.-H.; Yang, Y.; Li, Q.; Wang, Y.-H.; Guo, Y.-L.; Hua, L.; Liu, F. Analysis of chemical compositions from Nepal Cordyceps by UPLC-Q-TOF-MS. Chin. J. New Drugs 2019, 28, 1574–1581. [Google Scholar]
- Shi, N.; Liu, Q.; Liu, Y.; Chen, L.; Zhang, H.; Huang, H.; Ma, L. Characterization of the Soluble Products Formed during the Hydrothermal Conversion of Biomass-Derived Furanic Compounds by Using LC–MS/MS. ACS Omega 2020, 5, 23322–23333. [Google Scholar] [CrossRef]
- Chen, X.; Huang, Z.-F.; Liu, Y.-H.; Liu, Y.-H.; Chen, Y.; Qin, D.-Y.; Yi, Z.-H. Study on metabolites in vivo of Dangefentong Capsules based on UHPLC-Q/Orbitrap-MS/MS. Chin. J. Tradit. Chin. Med. 2022, 47, 5052–5063. [Google Scholar]
- Sun, G.-D.; Huo, J.-H.; Pan, W.-J.; Wang, W.-M. Identification and characterization of major chemical compounds in Sophorae Fructus based on UPLC-Q-TOF/MS. Chin. Herb. Med. 2019, 50, 3774–3783. [Google Scholar]
- Yang, J.-S.; Su, Y.-L.; Wang, Y.-L.; Feng, X.-Z.; Yu, D.-Q.; Liang, X.-T. Studies on the chemical constituents of armillaria mellea mycelium v. isolation and characterization of armillarilin and armillarinin. J. Pharm. 1990, 25, 24–28. [Google Scholar]
- Yang, J.; Chen, Y.; Feng, X.; Yu, D.; Liang, X. Chemical constituents of Armillaria mellea mycelium I. Isolation and characterization of armillarin and armillaridin. Planta Medica 1984, 50, 288–290. [Google Scholar] [CrossRef]
- Yang, J.-S.; Cong, P.-Z. Mass spectrometric study of the aromatic acid esters of sesquiterpene alcohols in the mycelium of Nectobacterium spp. J. Chem. 1988, 11, 1093–1100. [Google Scholar]
- Dabur, R.; Mittal, A. Detection and qualitative analysis of fatty acid amides in the urine of alcoholics using HPLC-QTOF-MS. Alcohol 2016, 52, 71–78. [Google Scholar] [CrossRef] [PubMed]
- Li, J.; Wang, Y.-W.; Zhang, Q.; Zhang, W.; Hu, Y.-X.; Zhang, M.-D.; Bai, T.-Y.; Zhou, M.-Y. Qualitative and quantitative analysis of Xiao’er Jiegan Granules by HPLC-Q-Exactive MS and HPLC-MS/MS technology. Chin. J. Hosp. Pharm. 2023, 43, 868–876. [Google Scholar]
- Dong, F.; Li, Z.-X.; Jia, C.-M.; Sun, Y.-Z.; Sun, Z.-H.; Song, X.-Y.; Wang, M.-Q. Component analysis of sesame oil based on UPLC/Q-TOF MS/MS. China Oil Grease 2022, 47, 130–136. [Google Scholar]
- Nowak, R.; Nowacka-Jechalke, N.; Pietrzak, W.; Gawlik-Dziki, U. A new look at edible and medicinal mushrooms as a source of ergosterol and ergosterol peroxide-UHPLC-MS/MS analysis. Food Chem. 2022, 369, 130927. [Google Scholar] [CrossRef] [PubMed]
- Windarsih, A.; Bakar, N.K.A.; Dachriyanus; Yuliana, N.D.; Riswanto, F.D.O.; Rohman, A. Analysis of Pork in Beef Sausages Using LC-Orbitrap HRMS Untargeted Metabolomics Combined with Chemometrics for Halal Authentication Study. Molecules 2023, 28, 5964. [Google Scholar] [CrossRef] [PubMed]
- Rangsinth, P.; Sharika, R.; Pattarachotanant, N.; Duangjan, C.; Wongwan, C.; Sillapachaiyaporn, C.; Nilkhet, S.; Wongsirojkul, N.; Prasansuklab, A.; Tencomnao, T. Potential Beneficial Effects and Pharmacological Properties of Ergosterol, a Common Bioactive Compound in Edible Mushrooms. Foods 2023, 12, 2529. [Google Scholar] [CrossRef] [PubMed]
- Zablocki, J.A.; Wu, L.; Shryock, J.; Belardinelli, L. Partial A1 adenosine receptor agonists from a molecular perspective and their potential use as chronic ventricular rate control agents during atrial fibrillation (AF). Curr. Top. Med. Chem. 2004, 4, 839–854. [Google Scholar] [CrossRef]
- Basheer, R.; Strecker, R.E.; Thakkar, M.M.; McCarley, R.W. Adenosine and sleep–wake regulation. Prog. Neurobiol. 2004, 73, 379–396. [Google Scholar] [CrossRef]
- Hansen, S.; Wood, D.K.; Higgins, J.M. 5-(Hydroxymethyl) furfural restores low-oxygen rheology of sickle trait blood in vitro. Br. J. Haematol. 2020, 188, 985–993. [Google Scholar] [CrossRef]
- Liu, A.; Zhao, X.; Li, H.; Liu, Z.; Liu, B.; Mao, X.; Guo, L.; Bi, K.; Jia, Y. 5-Hydroxymethylfurfural, an antioxidant agent from Alpinia oxyphylla Miq. improves cognitive impairment in Aβ1–42 mouse model of Alzheimer’s disease. Int. Immunopharmacol. 2014, 23, 719–725. [Google Scholar] [CrossRef] [PubMed]
- Xiang, Z.; Liu, S.; Qiu, J.; Lin, H.; Li, D.; Jiang, J. Identification and quality evaluation of Chinese rice wine using UPLC-PDA-QTOF/MS with dual-column separation. Phytomedicine 2023, 108, 154498. [Google Scholar] [CrossRef] [PubMed]
- Ramesh, D.; Vijayakumar, B.G.; Kannan, T. Therapeutic potential of uracil and its derivatives in countering pathogenic and physiological disorders. Eur. J. Med. Chem. 2020, 207, 112801. [Google Scholar] [CrossRef] [PubMed]
- Fan, L.; Pan, Z.; Liao, X.; Zhong, Y.; Guo, J.; Pang, R.; Chen, X.; Ye, G.; Su, Y. Uracil restores susceptibility of methicillin-resistant Staphylococcus aureus to aminoglycosides through metabolic reprogramming. Front. Pharmacol. 2023, 14, 1133685. [Google Scholar] [CrossRef]
- Perez-Pardo, P.; Dodiya, H.B.; Broersen, L.M.; Douna, H.; van Wijk, N.; Lopes da Silva, S.; Garssen, J.; Keshavarzian, A.; Kraneveld, A.D. Gut–brain and brain–gut axis in Parkinson’s disease models: Effects of a uridine and fish oil diet. Nutr. Neurosci. 2018, 21, 391–402. [Google Scholar] [CrossRef]
- Schmidt, A.P.; Lara, D.R.; de Faria Maraschin, J.; da Silveira Perla, A.; Souza, D.O. Guanosine and GMP prevent seizures induced by quinolinic acid in mice. Brain Res. 2000, 864, 40–43. [Google Scholar] [CrossRef] [PubMed]
- Ubaid, M.; Salauddin; Shadani, M.A.; Kawish, S.; Albratty, M.; Makeen, H.A.; Alhazmi, H.A.; Najmi, A.; Zoghebi, K.; Halawi, M.A. Daidzein from Dietary Supplement to a Drug Candidate: An Evaluation of Potential. ACS Omega 2023, 8, 32271–32293. [Google Scholar] [CrossRef]
- Jafari, S.; Shoghi, M.; Khazdair, M.R. Pharmacological Effects of Genistein on Cardiovascular Diseases. Evid.-Based Complement. Altern. Med. 2023, 2023, 8250219. [Google Scholar] [CrossRef]


| Serial Number | Sort | Compound | Retention Time | Molecular Formula | Ion Mode | Calculated Value (m/z) | Measured Value (m/z) | Error Value/×10−6 | Fragmentation | Identification Method | FJH | FJQ |
|---|---|---|---|---|---|---|---|---|---|---|---|---|
| 1 | Alkaloid | Choline | 1.29 | C5H13NO | [M + H]+ | 104.10699 | 104.10683 | −1.54 | 60.08076, 58.06512 | Database | + | + |
| 2 | Alkaloid | Trigonelline | 1.38 | C7H7NO2 | [M + H]+ | 138.05496 | 138.0549 | −0.40 | 110.05998, 94.06508 | Database | + | + |
| 3 | Nucleoside | Cytidine * | 1.41 | C9H13N3O5 | [M + H]+ | 244.09279 | 244.09276 | −0.12 | 112.05054 | Database, literature [14] | + | + |
| 4 | Nucleoside | Cytosine | 1.44 | C4H5N3O | [M + H]+ | 112.05054 | 112.05040 | −1.24 | 95.02391, 94.03985, 69.04473 | Database, literature [14] | + | + |
| 5 | Alkaloid | Betaine * | 1.88 | C5H11NO2 | [M + H]+ | 118.08626 | 118.08625 | −0.08 | 58.06511, 59.07307 | Database | + | + |
| 6 | Vitamin | Nicotinic acid * | 1.94 | C6H5NO2 | [M + H]+ | 124.03931 | 124.03925 | −0.44 | 80.04941, 96.04428, 78.03378 | Database | + | + |
| 7 | Nucleoside | 2,6-Dihydroxypurine * | 1.99 | C5H4N4O2 | [M − H]− | 151.02615 | 151.02625 | 0.66 | 108.02042 | Database, literature [15] | + | + |
| 8 | Nucleoside | Uridine * | 2.00 | C9H12N2O6 | [M + H]+ | 245.07681 | 245.07684 | 0.12 | 113.03448 | Database, literature [14] | + | + |
| 9 | Other | Fumaric acid | 2.03 | C4H4O4 | [M − H]− | 115.00368 | 115.00382 | 1.20 | 71.01396 | Database | + | − |
| 10 | Other | 2-Furoic acid | 2.09 | C5H4O3 | [M − H]− | 111.00877 | 111.00905 | 2.55 | 67.01904 | Database | + | + |
| 11 | Other | 2-Deoxypentose | 2.20 | C5H10O4 | [M − H]− | 133.05063 | 133.05081 | 1.34 | 115.00375, 71.01393 | Database | + | − |
| 12 | Nucleoside | Adenosine * | 2.44 | C10H13N5O4 | [M + H]+ | 268.10403 | 268.10406 | 0.11 | 136.06174, 119.03510 | Database, literature [14,16] | + | + |
| 13 | Nucleoside | Guanine | 2.49 | C5H5N5O | [M + H]+ | 152.05669 | 152.05663 | −0.37 | 135.03009, 128.04570, 110.03478 | Database | + | + |
| 14 | Nucleoside | Guanosine * | 2.60 | C10H13N5O5 | [M + H]+ | 284.09894 | 284.09885 | −0.32 | 152.05670 | Database, literature [14] | + | + |
| 15 | Nucleoside | Uracil * | 2.64 | C4H4N2O2 | [M + H]+ | 113.03455 | 113.03448 | −0.62 | 96.00786 | Database, literature [14] | + | + |
| 16 | Vitamin | Ascorbic acid * | 3.30 | C6H8O6 | [M − H]− | 175.02481 | 175.0253 | 2.79 | 115.00316, 71.01390 | Database | + | − |
| 17 | Furfurals | 5-Methyl-2-furaldehyde * | 4.63 | C6H6O2 | [M + H]+ | 111.04406 | 111.04408 | 0.22 | 83.04917, 55.05423 | Database | + | − |
| 18 | Other | Indoline | 4.81 | C8H9N | [M + H]+ | 120.08078 | 120.08072 | −0.47 | 103.05418, 93.06983 | Database | + | + |
| 19 | Furfurals | 5-hydroxymethylfurfural * | 4.91 | C6H6O3 | [M + H]+ | 127.03898 | 127.03900 | 0.23 | 109.02830 | Database, literature [17] | + | − |
| 20 | Amino acids | D-phenylalanine * | 5.04 | C9H11NO2 | [M − H]− | 164.07170 | 164.07182 | 0.73 | 147.04529 | Database | + | + |
| 21 | Amino acids | 3-Hydroxy-3-methylglutaricacid | 5.18 | C6H10O5 | [M − H]− | 161.04561 | 161.04591 | 1.86 | 59.01392, 99.04560 | Database | + | + |
| 22 | Organic acids | Methylsuccinic acid | 5.44 | C5H8O4 | [M − H]− | 131.03498 | 131.03531 | 2.52 | 87.04517 | Database | + | + |
| 23 | Other | Porphobilinogen | 5.59 | C10H14N2O4 | [M − H]− | 225.08808 | 225.08815 | 0.31 | 71.01408, 59.01390 | Database | + | + |
| 24 | Organic acids | Pantothenic acid | 5.78 | C9H17NO5 | [M + H]+ | 220.11795 | 220.11795 | 0.00 | 202.10733, 184.09677 | Database | + | + |
| 25 | Organic acids | 3,4-Dihydroxyphenylacetic acid | 5.81 | C8H8O4 | [M − H]− | 167.03498 | 167.03497 | −0.06 | 123.04532 | Database | + | + |
| 26 | Organic acids | 3-Hydroxy-3-methylbutanoic acid | 6.46 | C5H10O3 | [M − H]− | 117.05572 | 117.05588 | 1.37 | 115.04015 | Database | + | + |
| 27 | Other | DL-Mandelic acid | 6.81 | C8H8O3 | [M − H]− | 151.04007 | 151.04005 | −0.12 | 107.05027 | Database | + | − |
| 28 | Organic acids | 5-Hydroxyindole-3-acetic acid | 6.89 | C10H9NO3 | [M + H]+ | 192.06552 | 192.06572 | 1.04 | 146.06006, 147.06815 | Database | + | − |
| 29 | Other | Levetiracetam * | 7.44 | C8H14N2O2 | [M + H]+ | 171.11280 | 171.11287 | 0.41 | 126.09128, 89.07086 | Database | + | + |
| 30 | Other | Salicylic acid | 7.73 | C7H6O3 | [M − H]− | 137.02442 | 137.02446 | 0.29 | 93.03464 | Database | + | + |
| 31 | Other | 2-Isopropylmalic acid | 7.91 | C7H12O5 | [M − H]− | 175.06120 | 175.06129 | 0.51 | 115.04014, 85.06591 | Database | + | + |
| 32 | Organic acids | Terephthalic acid | 8.56 | C8H6O4 | [M − H]− | 165.01930 | 165.01939 | 0.55 | 121.02962 | Database | + | + |
| 33 | Other | L-Iditol | 8.79 | C6H14O6 | [M − H]− | 181.07176 | 181.07173 | −0.17 | 71.01383, 101.02444, 89.02440 | Database | + | + |
| 34 | Organic acids | benzoic acid * | 9.18 | C7H6O2 | [M − H]− | 121.02950 | 121.02961 | 0.91 | 93.03453 | Database | + | + |
| 35 | flavonoid | Daidzin * | 9.86 | C21H20O9 | [M − H]− | 415.10346 | 415.10333 | −0.30 | 253.05060 | Database | + | + |
| 36 | flavonoid | Glycitin | 10.09 | C22H22O10 | [M + H]+ | 447.12857 | 447.12881 | 0.53 | 285.07568 | Database | + | − |
| 37 | Amide | Phenacetin * | 10.33 | C10H13NO2 | [M + H]+ | 180.10191 | 180.10208 | 0.94 | 162.09142 | Database | + | − |
| 38 | flavonoid | Puerarin | 10.67 | C21H20O9 | [M − H]− | 415.10345 | 415.10315 | −0.74 | 267.07166 | Database | + | − |
| 39 | Organic acids | Mesaconicacid | 10.78 | C5H6O4 | [M − H]− | 129.01933 | 129.01918 | −1.18 | 57.03464 | Database | + | + |
| 40 | flavonoid | Genistin * | 11.23 | C21H20O10 | [M − H]− | 431.09837 | 431.09869 | 0.74 | 268.03806 | Database | + | + |
| 41 | Other | Azelaic acid | 12.03 | C9H16O4 | [M − H]− | 187.09758 | 187.09756 | −0.12 | 125.09720, 97.06583 | Database | + | + |
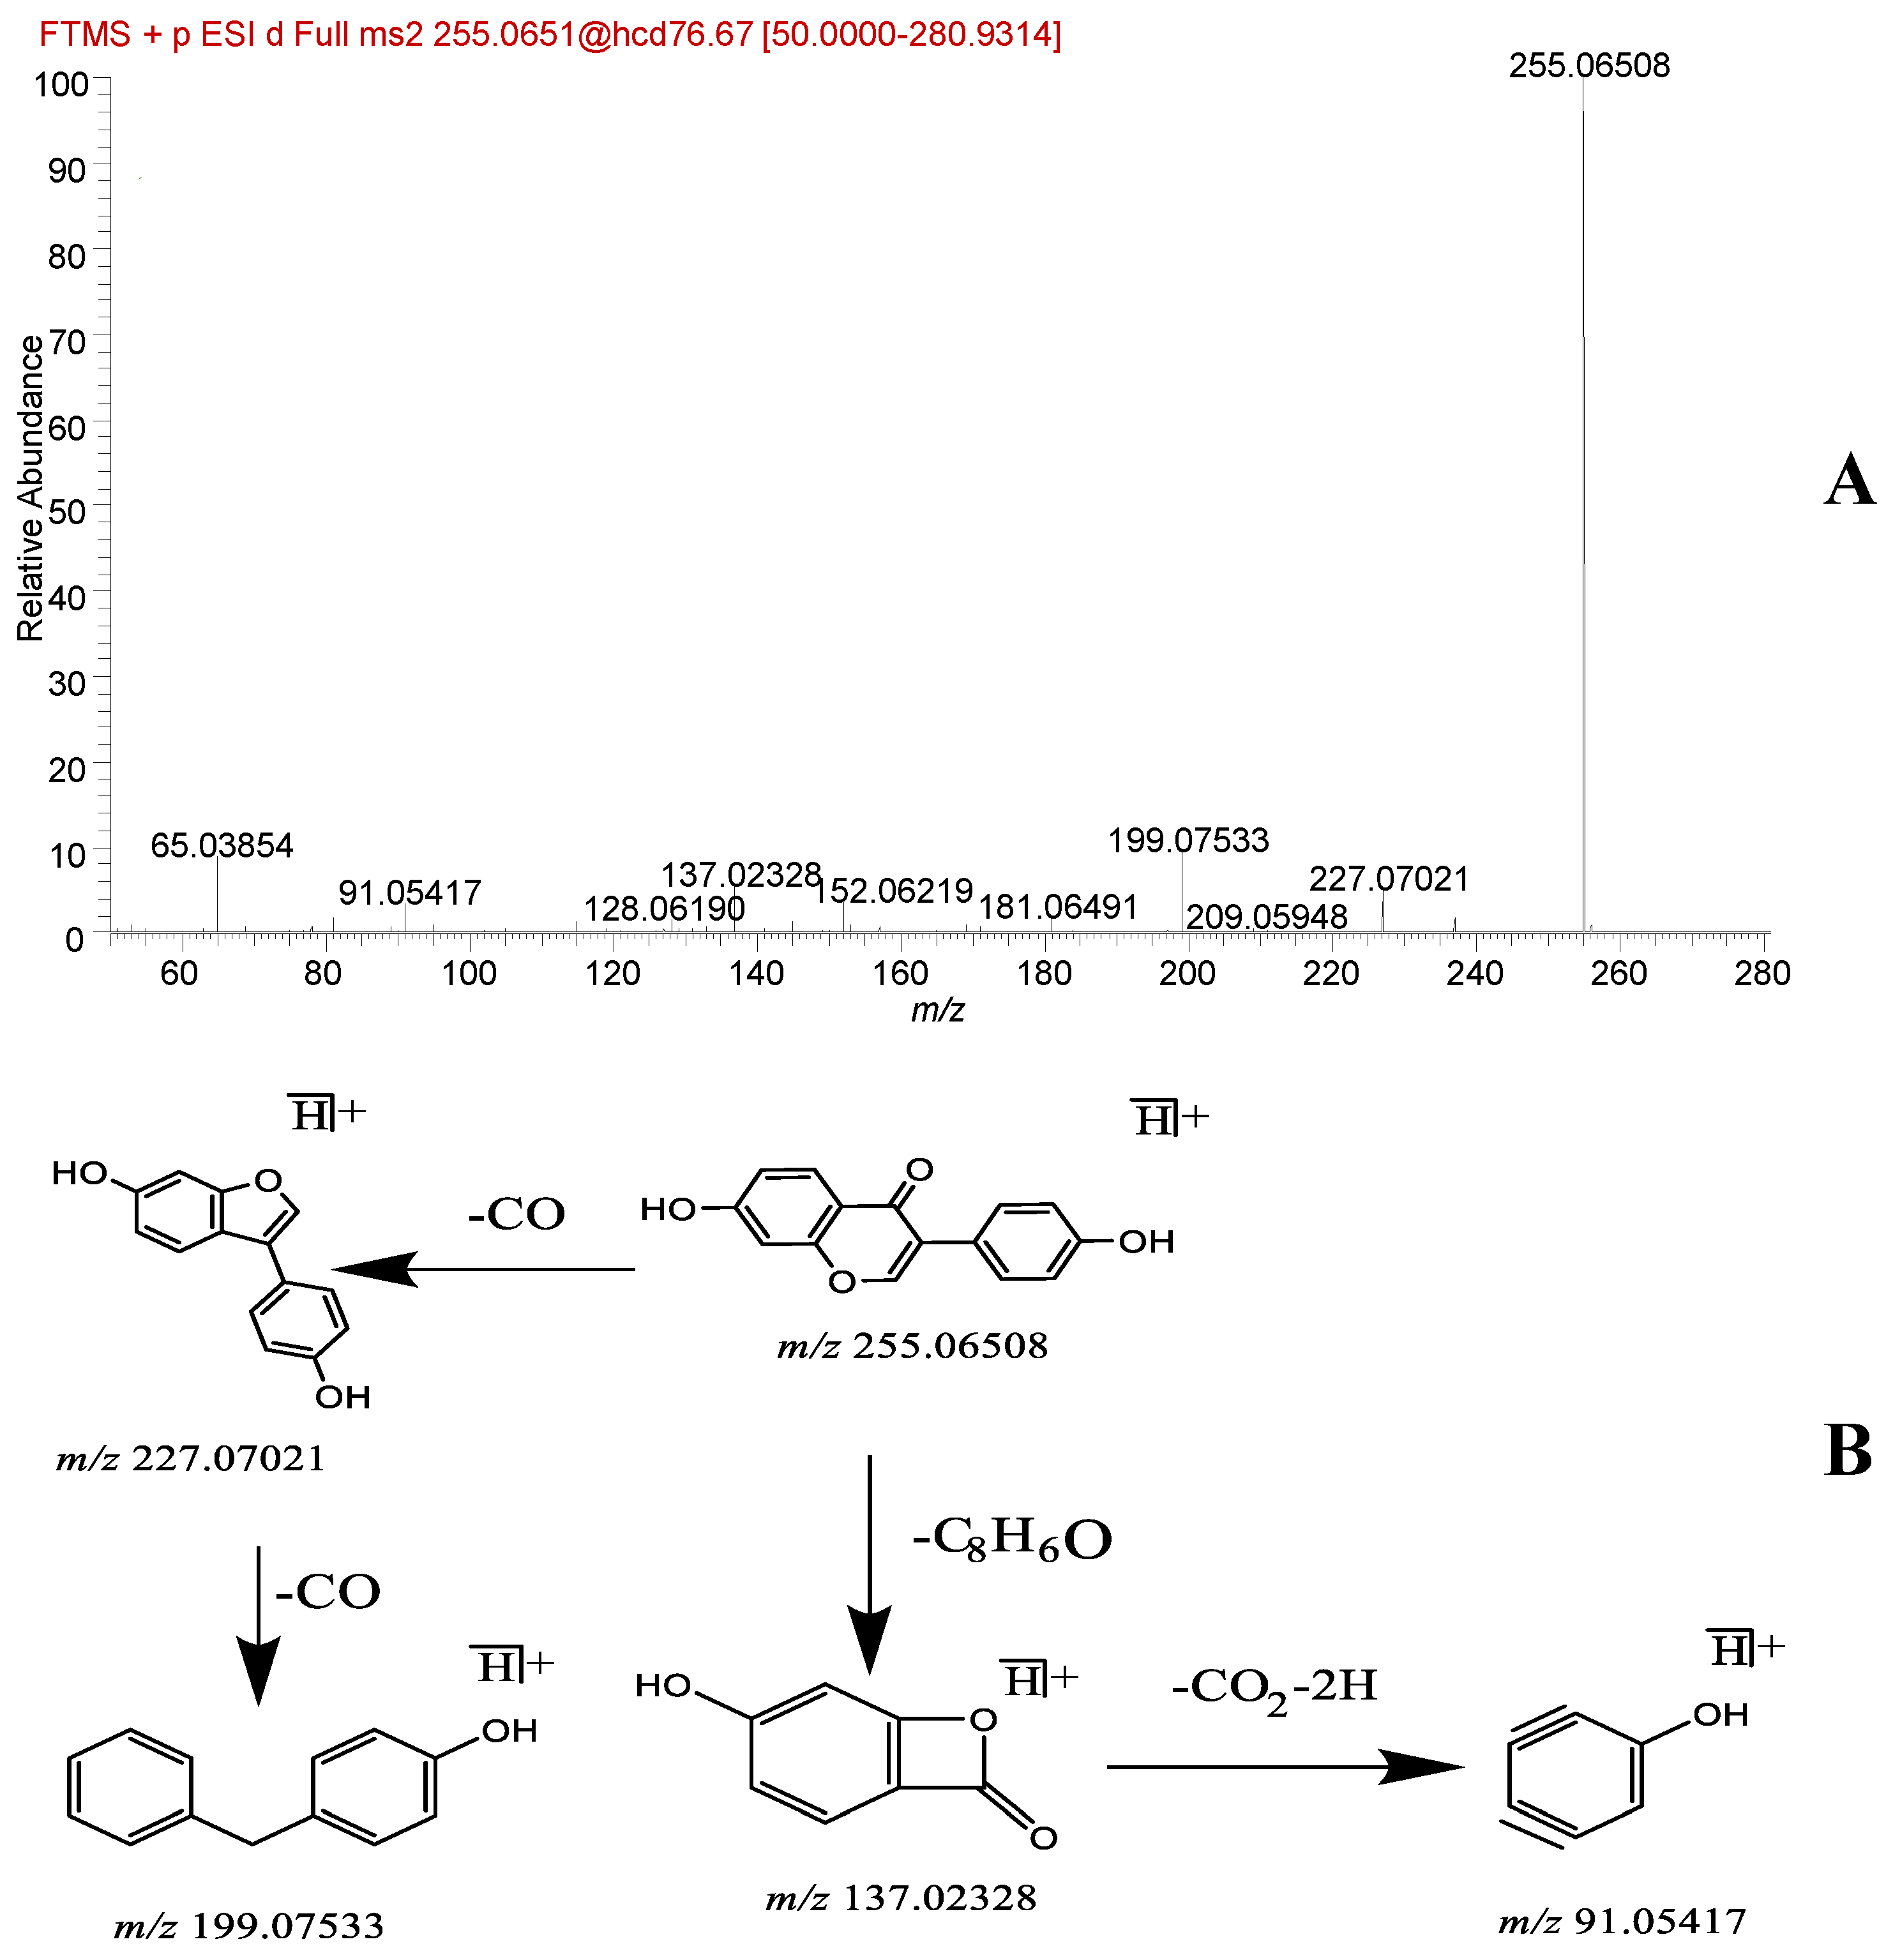
| 42 | flavonoid | Daidzein * | 12.48 | C15H10O4 | [M + H]+ | 255.06519 | 255.06508 | −0.43 | 227.07021, 199.07533, 137.02328, 91.05417 | Database, literature [18] | + | + |
| 43 | flavonoid | Chrysin | 12.54 | C15H10O4 | [M − H]− | 253.05063 | 253.05075 | 0.47 | 209.06131 | Database | + | + |
| 44 | flavonoid | Glycitein * | 12.68 | C16H12O5 | [M − H]− | 283.06119 | 283.06122 | 0.08 | 268.03796 | Database | + | + |
| 45 | flavonoid | 4’,7-Dihydroxyflavanone | 12.70 | C15H12O4 | [M + H]+ | 257.08084 | 257.08072 | −0.47 | 91.05438, 81.03360 | Database | + | + |
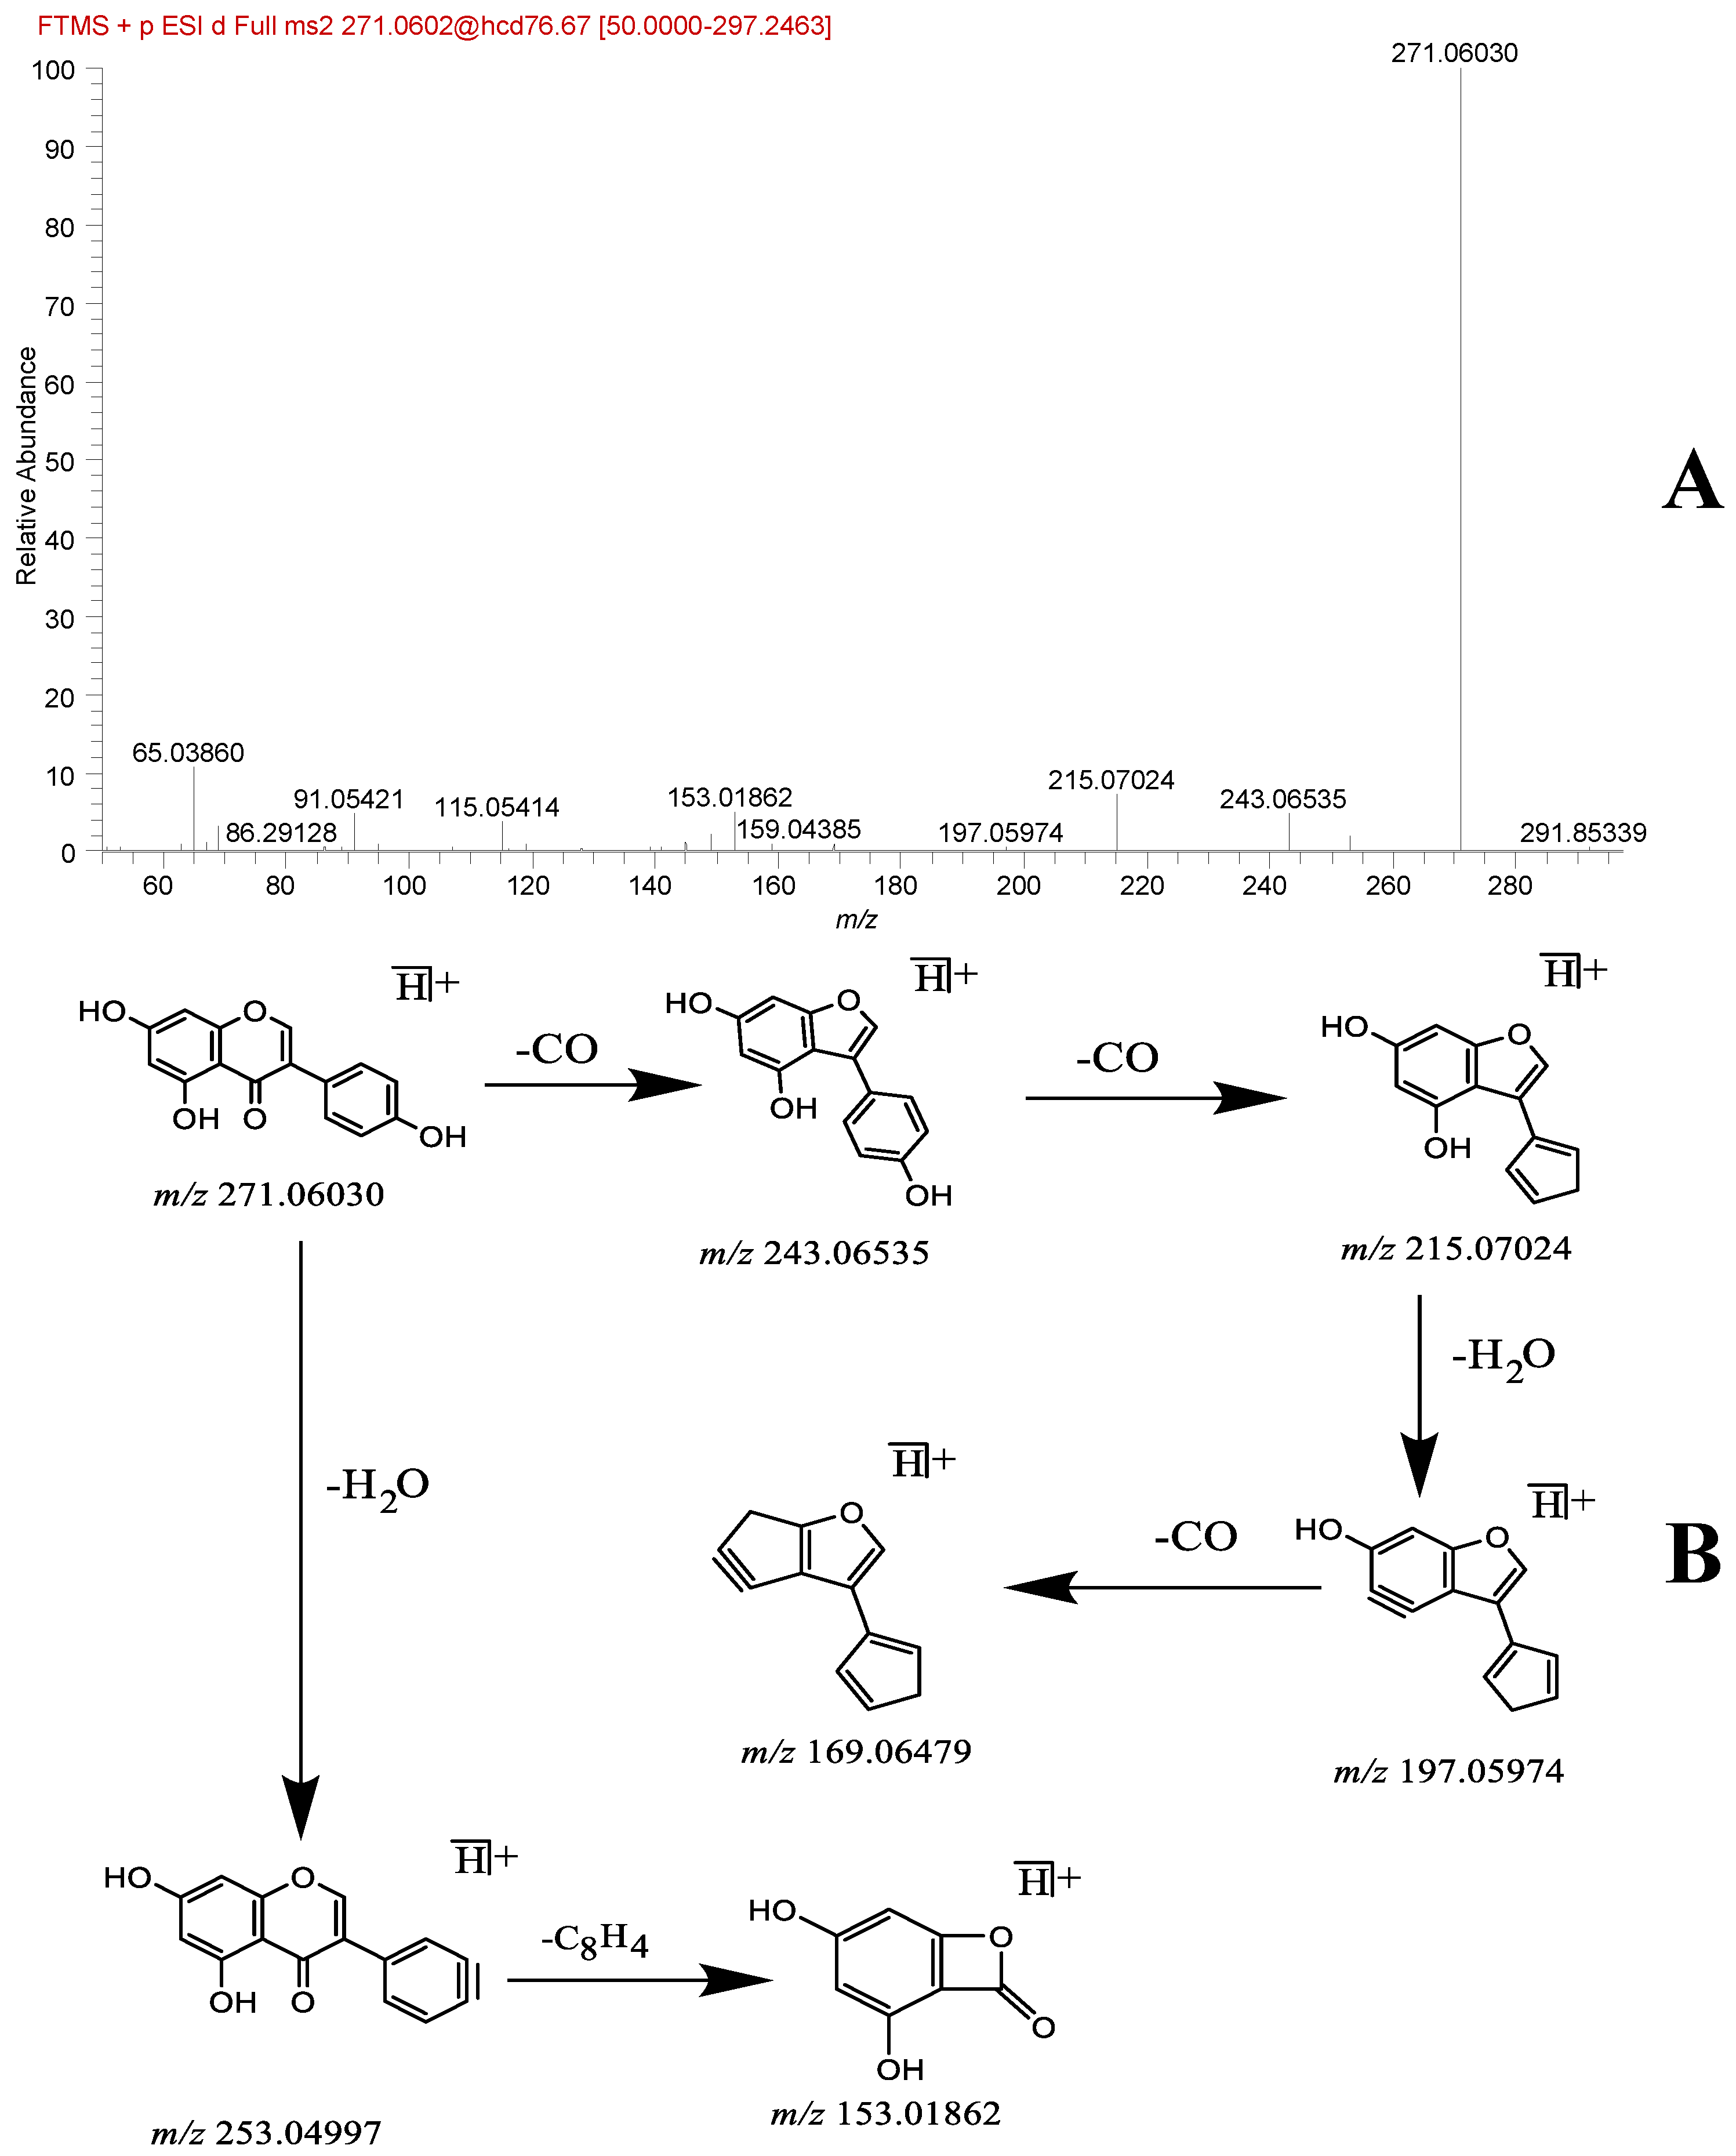
| 46 | flavonoid | Genistein * | 13.43 | C15H10O5 | [M + H]+ | 271.06009 | 271.06030 | 0.74 | 253.04997, 243.06535, 215.07024, 197.05974, 169.06479, 153.01862 | Database, literature [19] | + | + |
| 47 | flavonoid | Naringenin * | 13.48 | C15H12O5 | [M − H]− | 271.06120 | 271.06152 | 1.18 | 151.00377, 119.05029, 107.01385 | Database | + | + |
| 48 | flavonoid | Fisetin | 13.49 | C15H10O6 | [M − H]− | 285.04046 | 285.04071 | 0.88 | 135.00868 | Database | + | + |
| 49 | flavonoid | Kaempferide * | 13.52 | C16H12O6 | [M − H]− | 299.05611 | 299.05618 | 0.23 | 285.09622 | Database | + | + |
| 50 | Other | Cycluron | 14.12 | C11H22N2O | [M + H]+ | 199.18049 | 199.18042 | −0.35 | 72.04436 | Database | + | + |
| 51 | Terpenoids | Armillarinin | 14.23 | C24H29O7Cl | [M + H]+ | 465.16746 | 465.16757 | 0.24 | 199.01570 | Database, literature [20] | + | − |
| 52 | Terpenoids | Soyasaponin I | 14.45 | C48H78O18 | [M + H]+ | 943.52609 | 943.526 | −0.10 | 441.37283, 599.39441, 797.46838 | Database | + | + |
| 53 | Sphingolipid | 2-Amino-1,3,4-octadecanetriol | 14.70 | C18H39NO3 | [M + H]+ | 318.30027 | 318.30026 | −0.03 | 300.29114 | Database | + | + |
| 54 | Terpenoids | Armillarilin | 14.89 | C24H30O7 | [M + H]+ | 431.20643 | 431.20645 | 0.05 | 165.05458 | Database, literature [20] | + | − |
| 55 | Steroid | Estriol | 15.4 | C18H24O3 | [M + H]+ | 289.17982 | 289.17978 | −0.14 | 159.08081 | Database | + | − |
| 56 | Terpenoids | Armillarin | 15.83 | C24H30O6 | [M + H]+ | 415.21152 | 415.21149 | −0.07 | 165.05475 | Database, literature [21] | + | + |
| 57 | Terpenoids | Dehydroeburicoic acid | 16.23 | C31H48O3 | [M + H]+ | 469.36762 | 469.36755 | −0.15 | 451.35825 | Database | + | − |
| 58 | Terpenoids | Armillaribin | 16.72 | C24H28O5 | [M + H]+ | 397.20095 | 397.20105 | 0.25 | 215.14302, 165.05461 | Database, literature [22] | + | + |
| 59 | Other | Piptamine | 16.81 | C23H41N | [M + H]+ | 332.33118 | 332.33112 | −0.18 | 240.26860, 91.05413 | Database | + | + |
| 60 | flavonoid | ar-Turmerone | 16.87 | C15H20O | [M + H]+ | 217.15869 | 217.15857 | −0.55 | 91.05415 | Database | + | − |
| 61 | Terpenoids | Armillaricin | 16.92 | C24H27O5Cl | [M + H]+ | 431.16198 | 431.16202 | 0.09 | 215.14302, 199.01567, 187.14812 | Database, literature [22] | + | − |
| 62 | Other | Cetrimonium | 16.97 | C19H41N | [M + H]+ | 284.33118 | 284.33118 | 0.01 | 60.08073 | Database | + | − |
| 63 | Other | Coriolic acid | 17.22 | C18H32O3 | [M − H]− | 295.22787 | 295.22809 | 0.75 | 277.21747, 195.13911 | Database | + | + |
| 64 | Terpenoids | Melleolide | 17.24 | C23H28O6 | [M + H]+ | 401.19587 | 401.1958 | −0.17 | 233.15363 | Database, literature [22] | + | − |
| 65 | Other | Phthalic anhydride | 18.29 | C8H4O3 | [M + H]+ | 149.02332 | 149.02328 | −0.27 | 121.02829 | Database | + | − |
| 66 | Esters | Dioctyl phthalate | 19.81 | C24H38O4 | [M + H]+ | 391.28427 | 391.28436 | 0.19 | 71.08540 | Database | + | + |
| 67 | Amide | Linoleamide | 19.96 | C18H33NO | [M + H]+ | 280.26349 | 280.26355 | 0.21 | 263.23700, 245.22643 | Database, literature [23] | + | + |
| 68 | Sphingolipid | D-Sphingosine | 20.09 | C18H37NO2 | [M + H]+ | 300.28971 | 300.28976 | 0.17 | 282.27960, 283.26321 | Database | + | + |
| 69 | Esters | 1-Linoleoyl glycerol | 20.51 | C21H38O4 | [M + H]+ | 355.28429 | 355.284 | −0.81 | 91.05740 | Database | + | + |
| 70 | Amide | Palmitamide | 21.14 | C16H33NO | [M + H]+ | 256.26349 | 256.26324 | −0.98 | 74.06001, 69.06985, 57.06992, 55.05424 | Database | + | + |
| 71 | Organic acids | Linoleic acid | 21.47 | C18H32O2 | [M − H]− | 279.23295 | 279.23306 | 0.38 | 261.22192 | Database, literature [24] | + | + |
| 72 | Amide | Oleamide | 21.49 | C18H35NO | [M + H]+ | 282.27914 | 282.279 | −0.50 | 265.25250 | Database, literature [23,25] | + | + |
| 73 | Organic acids | Palmitoleic Acid | 21.65 | C16H30O2 | [M + H]+ | 255.23186 | 255.23196 | 0.40 | 237.22130 | Database | + | + |
| 74 | Steroid | Ergosterol * | 21.85 | C28H44O | [M + H]+ | 397.34649 | 397.34674 | 0.63 | 379.33572 | Database | + | − |
| 75 | Steroid | Ergosterol endoperoxide | 21.97 | C28H44O3 | [M + H]+ | 429.33632 | 429.33643 | 0.25 | 411.32599, 393.31552 | Database, literature [26] | + | − |
| 76 | Organic acids | Palmitic acid * | 22.58 | C16H32O2 | [M − H]− | 255.23295 | 255.23296 | 0.03 | 256.23624 | Database, literature [25] | + | + |
| 77 | Organic acids | Oleic acid | 22.89 | C18H34O2 | [M − H]− | 281.24860 | 281.24869 | 0.31 | 282.25192 | Database | + | + |
| 78 | Esters | Linolenic acid ethyl ester | 23.57 | C20H34O2 | [M + H]+ | 307.26316 | 307.26355 | 1.28 | 123.11696 | Database | + | − |
| 79 | Esters | Ethyl oleate | 26.10 | C20H38O2 | [M + H]+ | 311.29446 | 311.29456 | 0.33 | 265.25259 | Database | + | + |
| ID | Similarity | ID | Similarity |
|---|---|---|---|
| S1 | 0.971 | S6 | 0.984 |
| S2 | 0.992 | S7 | 0.975 |
| S3 | 0.986 | S8 | 0.999 |
| S4 | 0.978 | S9 | 0.999 |
| S5 | 0.998 | S10 | 0.996 |
| Compound | Regression Equation | R2 | Linear Range (µg/mL) |
|---|---|---|---|
| Uracil | Y = 9,189,836.9096 X − 8756.4263 | 0.9998 | 0.99–32.84 |
| Guanosine | Y = 6,907,785.2972 X − 6209.2408 | 0.9998 | 1.03–34.34 |
| Adenosine | Y = 6,569,226.0327 X − 10,826.0629 | 0.9996 | 1.77–58.82 |
| 5-HMF | Y = 5,677,358.0948 X − 12,014.4694 | 0.9996 | 2.22–74.12 |
| Daidzin | Y = 9,104,442.8249 X − 2582.8260 | 0.9997 | 0.30–10.15 |
| Genistin | Y = 18,562,283.4133 X − 5566.5236 | 0.9997 | 0.27–8.92 |
| Glycitein | Y = 13,180,712.1644 X − 5008.3407 | 0.9997 | 0.40–13.24 |
| Daidzein | Y = 18,397,395.8876 X − 17,212.7445 | 0.9998 | 1.08–36.03 |
| Genistein | Y = 29,448,803.7592 X − 3572.4452 | 0.9997 | 0.76–25.29 |
| Ergosterol | Y = 2,134,505.6341 X − 2630.5954 | 0.9999 | 1.91–63.73 |
| Compound | Sampling Volume/g | Sample Content/mg | Addition/mg | Measured Amount/mg | Recovery Rate/% | Average Recovery Rate/% | RSD/% |
|---|---|---|---|---|---|---|---|
| Uracil | 0.5001 | 0.1754 | 0.1620 | 0.3335 | 97.59 | 99.34 | 1.48 |
| 0.5004 | 0.1755 | 0.1620 | 0.3382 | 100.43 | |||
| 0.5003 | 0.1755 | 0.1620 | 0.3389 | 100.86 | |||
| 0.5001 | 0.1754 | 0.1620 | 0.3381 | 100.43 | |||
| 0.5002 | 0.1755 | 0.1620 | 0.3336 | 97.59 | |||
| 0.5001 | 0.1754 | 0.1620 | 0.3360 | 99.14 | |||
| Guanosine | 0.5001 | 0.1093 | 0.0997 | 0.2066 | 97.59 | 98.06 | 2.12 |
| 0.5004 | 0.1093 | 0.0997 | 0.2071 | 98.09 | |||
| 0.5003 | 0.1093 | 0.0997 | 0.2085 | 99.50 | |||
| 0.5001 | 0.1093 | 0.0997 | 0.2088 | 99.80 | |||
| 0.5002 | 0.1093 | 0.0997 | 0.2032 | 94.18 | |||
| 0.5001 | 0.1093 | 0.0997 | 0.2082 | 99.20 | |||
| Adenosine | 0.5001 | 0.2323 | 0.2085 | 0.4367 | 98.03 | 98.77 | 1.81 |
| 0.5004 | 0.2325 | 0.2085 | 0.4421 | 100.53 | |||
| 0.5003 | 0.2324 | 0.2085 | 0.4386 | 98.90 | |||
| 0.5001 | 0.2323 | 0.2085 | 0.4321 | 95.83 | |||
| 0.5002 | 0.2324 | 0.2085 | 0.4423 | 100.67 | |||
| 0.5001 | 0.2323 | 0.2085 | 0.4380 | 98.66 | |||
| 5-HMF | 0.5001 | 0.2062 | 0.2230 | 0.4252 | 98.21 | 98.26 | 2.87 |
| 0.5004 | 0.2063 | 0.2230 | 0.4365 | 103.23 | |||
| 0.5003 | 0.2063 | 0.2230 | 0.4219 | 96.68 | |||
| 0.5001 | 0.2062 | 0.2230 | 0.4227 | 97.09 | |||
| 0.5002 | 0.2062 | 0.2230 | 0.4276 | 99.28 | |||
| 0.5001 | 0.2062 | 0.2230 | 0.4182 | 95.07 | |||
| Daidzin | 0.5001 | 0.0033 | 0.0055 | 0.0086 | 96.36 | 98.18 | 2.34 |
| 0.5004 | 0.0033 | 0.0055 | 0.0088 | 100.00 | |||
| 0.5003 | 0.0033 | 0.0055 | 0.0087 | 98.18 | |||
| 0.5001 | 0.0033 | 0.0055 | 0.0089 | 101.82 | |||
| 0.5002 | 0.0033 | 0.0055 | 0.0086 | 96.36 | |||
| 0.5001 | 0.0033 | 0.0055 | 0.0086 | 96.36 | |||
| Genistin | 0.5001 | 0.0022 | 0.0035 | 0.0056 | 97.14 | 96.67 | 1.21 |
| 0.5004 | 0.0022 | 0.0035 | 0.0055 | 94.29 | |||
| 0.5003 | 0.0022 | 0.0035 | 0.0056 | 97.14 | |||
| 0.5001 | 0.0022 | 0.0035 | 0.0056 | 97.14 | |||
| 0.5002 | 0.0022 | 0.0035 | 0.0056 | 97.14 | |||
| 0.5001 | 0.0022 | 0.0035 | 0.0056 | 97.14 | |||
| Glycitein | 0.5001 | 0.0152 | 0.0311 | 0.0462 | 99.68 | 98.34 | 2.09 |
| 0.5004 | 0.0152 | 0.0311 | 0.0465 | 100.64 | |||
| 0.5003 | 0.0152 | 0.0311 | 0.0453 | 96.78 | |||
| 0.5001 | 0.0152 | 0.0311 | 0.0449 | 95.50 | |||
| 0.5002 | 0.0152 | 0.0311 | 0.0455 | 97.43 | |||
| 0.5001 | 0.0152 | 0.0311 | 0.0463 | 100.00 | |||
| Daidzein | 0.5001 | 0.0617 | 0.0757 | 0.1364 | 98.68 | 99.10 | 1.79 |
| 0.5004 | 0.0617 | 0.0757 | 0.1368 | 99.21 | |||
| 0.5003 | 0.0617 | 0.0757 | 0.1342 | 95.77 | |||
| 0.5001 | 0.0617 | 0.0757 | 0.1377 | 100.40 | |||
| 0.5002 | 0.0617 | 0.0757 | 0.1376 | 100.26 | |||
| 0.5001 | 0.0617 | 0.0757 | 0.1376 | 100.26 | |||
| Genistein | 0.5001 | 0.0683 | 0.0841 | 0.1497 | 96.79 | 99.07 | 1.66 |
| 0.5004 | 0.0683 | 0.0841 | 0.1532 | 100.95 | |||
| 0.5003 | 0.0683 | 0.0841 | 0.1524 | 100.00 | |||
| 0.5001 | 0.0683 | 0.0841 | 0.1528 | 100.48 | |||
| 0.5002 | 0.0683 | 0.0841 | 0.1507 | 97.98 | |||
| 0.5001 | 0.0683 | 0.0841 | 0.1509 | 98.22 | |||
| Ergosterol | 0.5001 | 0.2453 | 0.2313 | 0.4677 | 96.15 | 99.65 | 2.60 |
| 0.5004 | 0.2455 | 0.2313 | 0.4748 | 99.14 | |||
| 0.5003 | 0.2454 | 0.2313 | 0.4857 | 103.89 | |||
| 0.5001 | 0.2453 | 0.2313 | 0.4759 | 99.70 | |||
| 0.5002 | 0.2454 | 0.2313 | 0.4727 | 98.27 | |||
| 0.5001 | 0.2453 | 0.2313 | 0.4784 | 100.78 |
| Sample | Uracil | Guanosine | Adenosine | 5-HMF | Daidzin | Genistin | Glycitein | Daidzein | Genistein | Ergosterol |
|---|---|---|---|---|---|---|---|---|---|---|
| S1 | 0.3304 | 0.2040 | 0.4271 | 0.4582 | 0.0085 | 0.0061 | 0.0434 | 0.1560 | 0.1697 | 0.4910 |
| S2 | 0.3018 | 0.1987 | 0.4512 | 0.4015 | 0.0087 | 0.0061 | 0.0462 | 0.1731 | 0.1838 | 0.4917 |
| S3 | 0.2935 | 0.2095 | 0.4741 | 0.4140 | 0.0092 | 0.0063 | 0.0466 | 0.1773 | 0.1859 | 0.4841 |
| S4 | 0.3369 | 0.1445 | 0.3113 | 0.4427 | 0.0069 | 0.0053 | 0.0336 | 0.1125 | 0.1262 | 0.4504 |
| S5 | 0.3417 | 0.1806 | 0.3569 | 0.4508 | 0.0075 | 0.0057 | 0.0369 | 0.1285 | 0.1397 | 0.4523 |
| S6 | 0.3151 | 0.1948 | 0.4415 | 0.4418 | 0.0086 | 0.0063 | 0.0447 | 0.1631 | 0.1728 | 0.4956 |
| S7 | 0.3508 | 0.2185 | 0.4646 | 0.4123 | 0.0066 | 0.0043 | 0.0304 | 0.1234 | 0.1365 | 0.4906 |
| S8 | 0.2187 | 0.2547 | 0.6121 | 0.3363 | 0.0112 | 0.0088 | 0.0613 | 0.2439 | 0.2288 | 0.4980 |
| S9 | 0.2400 | 0.2158 | 0.5083 | 0.3465 | 0.0096 | 0.0071 | 0.0526 | 0.2023 | 0.1971 | 0.4666 |
| S10 | 0.1814 | 0.2617 | 0.6307 | 0.2788 | 0.0117 | 0.0080 | 0.0625 | 0.2570 | 0.2375 | 0.4878 |
| S11 | 0.0327 | 0.0244 | 0.0308 | / | 0.0524 | 0.0394 | 0.0156 | 0.0237 | 0.0190 | / |
| Control | Batch Number | Manufacturing Company |
|---|---|---|
| Cytidine | B20073 | Shanghai Yuanye Biotechnology Co., Shanghai, China |
| Betaine | PS012048 | Chengdu Pusi Biotechnology Co., Chengdu, China |
| Nicotinic acid | PS020097 | Chengdu Pusi Biotechnology Co., Chengdu, China |
| 2,6-Dihydroxypurine | PS020191 | Chengdu Pusi Biotechnology Co., Chengdu, China |
| Uridine | 887-200202 | China National Institute for the Control of Pharmaceutical and Biological Products, Beijing, China |
| Adenosine | 110879-200202 | China National Institute for the Control of Pharmaceutical and Biological Products, Beijing, China |
| Guanosine | PS010291 | Chengdu Pusi Biotechnology Co., Chengdu, China |
| Uracil | U13135C30 | Chengdu Pusi Biotechnology Co., Chengdu, China |
| Ascorbic acid | J04A10R84808 | Shanghai Yuanye Biotechnology Co., Shanghai, China |
| 5-Methyl-2-furaldehyde | J23S6X3622 | Shanghai Yuanye Biotechnology Co., Shanghai, China |
| 5-hydroxymethylfurfural | H81835D5F | Shanghai Jiji Biochemical Technology Co., Shanghai, China |
| D-phenylalanine | H06A8H33287 | Shanghai Yuanye Biotechnology Co., Shanghai, China |
| Levetiracetam | PS230518-15 | Chengdu Pusi Biotechnology Co., Chengdu, China |
| Benzoic acid | PS161011-06 | Chengdu Pusi Biotechnology Co., Chengdu, China |
| Daidzin | PS011899 | Chengdu Pusi Biotechnology Co., Chengdu, China |
| Phenacetin | PS230518-16 | Chengdu Pusi Biotechnology Co., Chengdu, China |
| Genistin | 111709-200501 | China National Institute for the Control of Pharmaceutical and Biological Products, Beijing, China |
| Daidzein | B20227 | Shanghai Yuanye Biotechnology Co., Shanghai, China |
| Glycitein | PS011931 | Chengdu Pusi Biotechnology Co., Chengdu, China |
| Genistein | 111704-200501 | China National Institute for the Control of Pharmaceutical and Biological Products, Beijing, China |
| Naringenin | PS010355 | Chengdu Pusi Biotechnology Co., Chengdu, China |
| Kaempferide | PS011599 | Chengdu Pusi Biotechnology Co., Chengdu, China |
| Ergosterol | 111845-202105 | China National Institute for the Control of Pharmaceutical and Biological Products, Beijing, China |
| Palmitic acid | PS001166 | Chengdu Pusi Biotechnology Co., Chengdu, China |
Disclaimer/Publisher’s Note: The statements, opinions and data contained in all publications are solely those of the individual author(s) and contributor(s) and not of MDPI and/or the editor(s). MDPI and/or the editor(s) disclaim responsibility for any injury to people or property resulting from any ideas, methods, instructions or products referred to in the content. |
© 2024 by the authors. Licensee MDPI, Basel, Switzerland. This article is an open access article distributed under the terms and conditions of the Creative Commons Attribution (CC BY) license (https://creativecommons.org/licenses/by/4.0/).
Share and Cite
Wu, Y.; Zhang, H.; Zhu, J.; Zhang, Z.; Ma, S.; Zhao, Y.; Wang, Y.; Yuan, J.; Guo, X.; Li, Y.; et al. The Effect of Fermentation on the Chemical Constituents of Gastrodia Tuber Hallimasch Powder (GTHP) Estimated by UHPLC-Q-Orbitrap HRMS and HPLC. Molecules 2024, 29, 1663. https://doi.org/10.3390/molecules29071663
Wu Y, Zhang H, Zhu J, Zhang Z, Ma S, Zhao Y, Wang Y, Yuan J, Guo X, Li Y, et al. The Effect of Fermentation on the Chemical Constituents of Gastrodia Tuber Hallimasch Powder (GTHP) Estimated by UHPLC-Q-Orbitrap HRMS and HPLC. Molecules. 2024; 29(7):1663. https://doi.org/10.3390/molecules29071663
Chicago/Turabian StyleWu, Yaning, Hongwei Zhang, Jianguang Zhu, Zhenling Zhang, Songbo Ma, Yongqi Zhao, Yiming Wang, Jun Yuan, Xing Guo, Yajing Li, and et al. 2024. "The Effect of Fermentation on the Chemical Constituents of Gastrodia Tuber Hallimasch Powder (GTHP) Estimated by UHPLC-Q-Orbitrap HRMS and HPLC" Molecules 29, no. 7: 1663. https://doi.org/10.3390/molecules29071663
APA StyleWu, Y., Zhang, H., Zhu, J., Zhang, Z., Ma, S., Zhao, Y., Wang, Y., Yuan, J., Guo, X., Li, Y., & Zhang, S. (2024). The Effect of Fermentation on the Chemical Constituents of Gastrodia Tuber Hallimasch Powder (GTHP) Estimated by UHPLC-Q-Orbitrap HRMS and HPLC. Molecules, 29(7), 1663. https://doi.org/10.3390/molecules29071663