
Poly(Acrylic Acid)-Sodium Alginate Superabsorbent Hydrogels Synthesized Using Electron-Beam Irradiation—Part III: An Evaluation of Their Degradation in Soil


Abstract

1. Introduction
2. Results and Discussion
2.1. Hydrogel Degradation Assessment in Soil
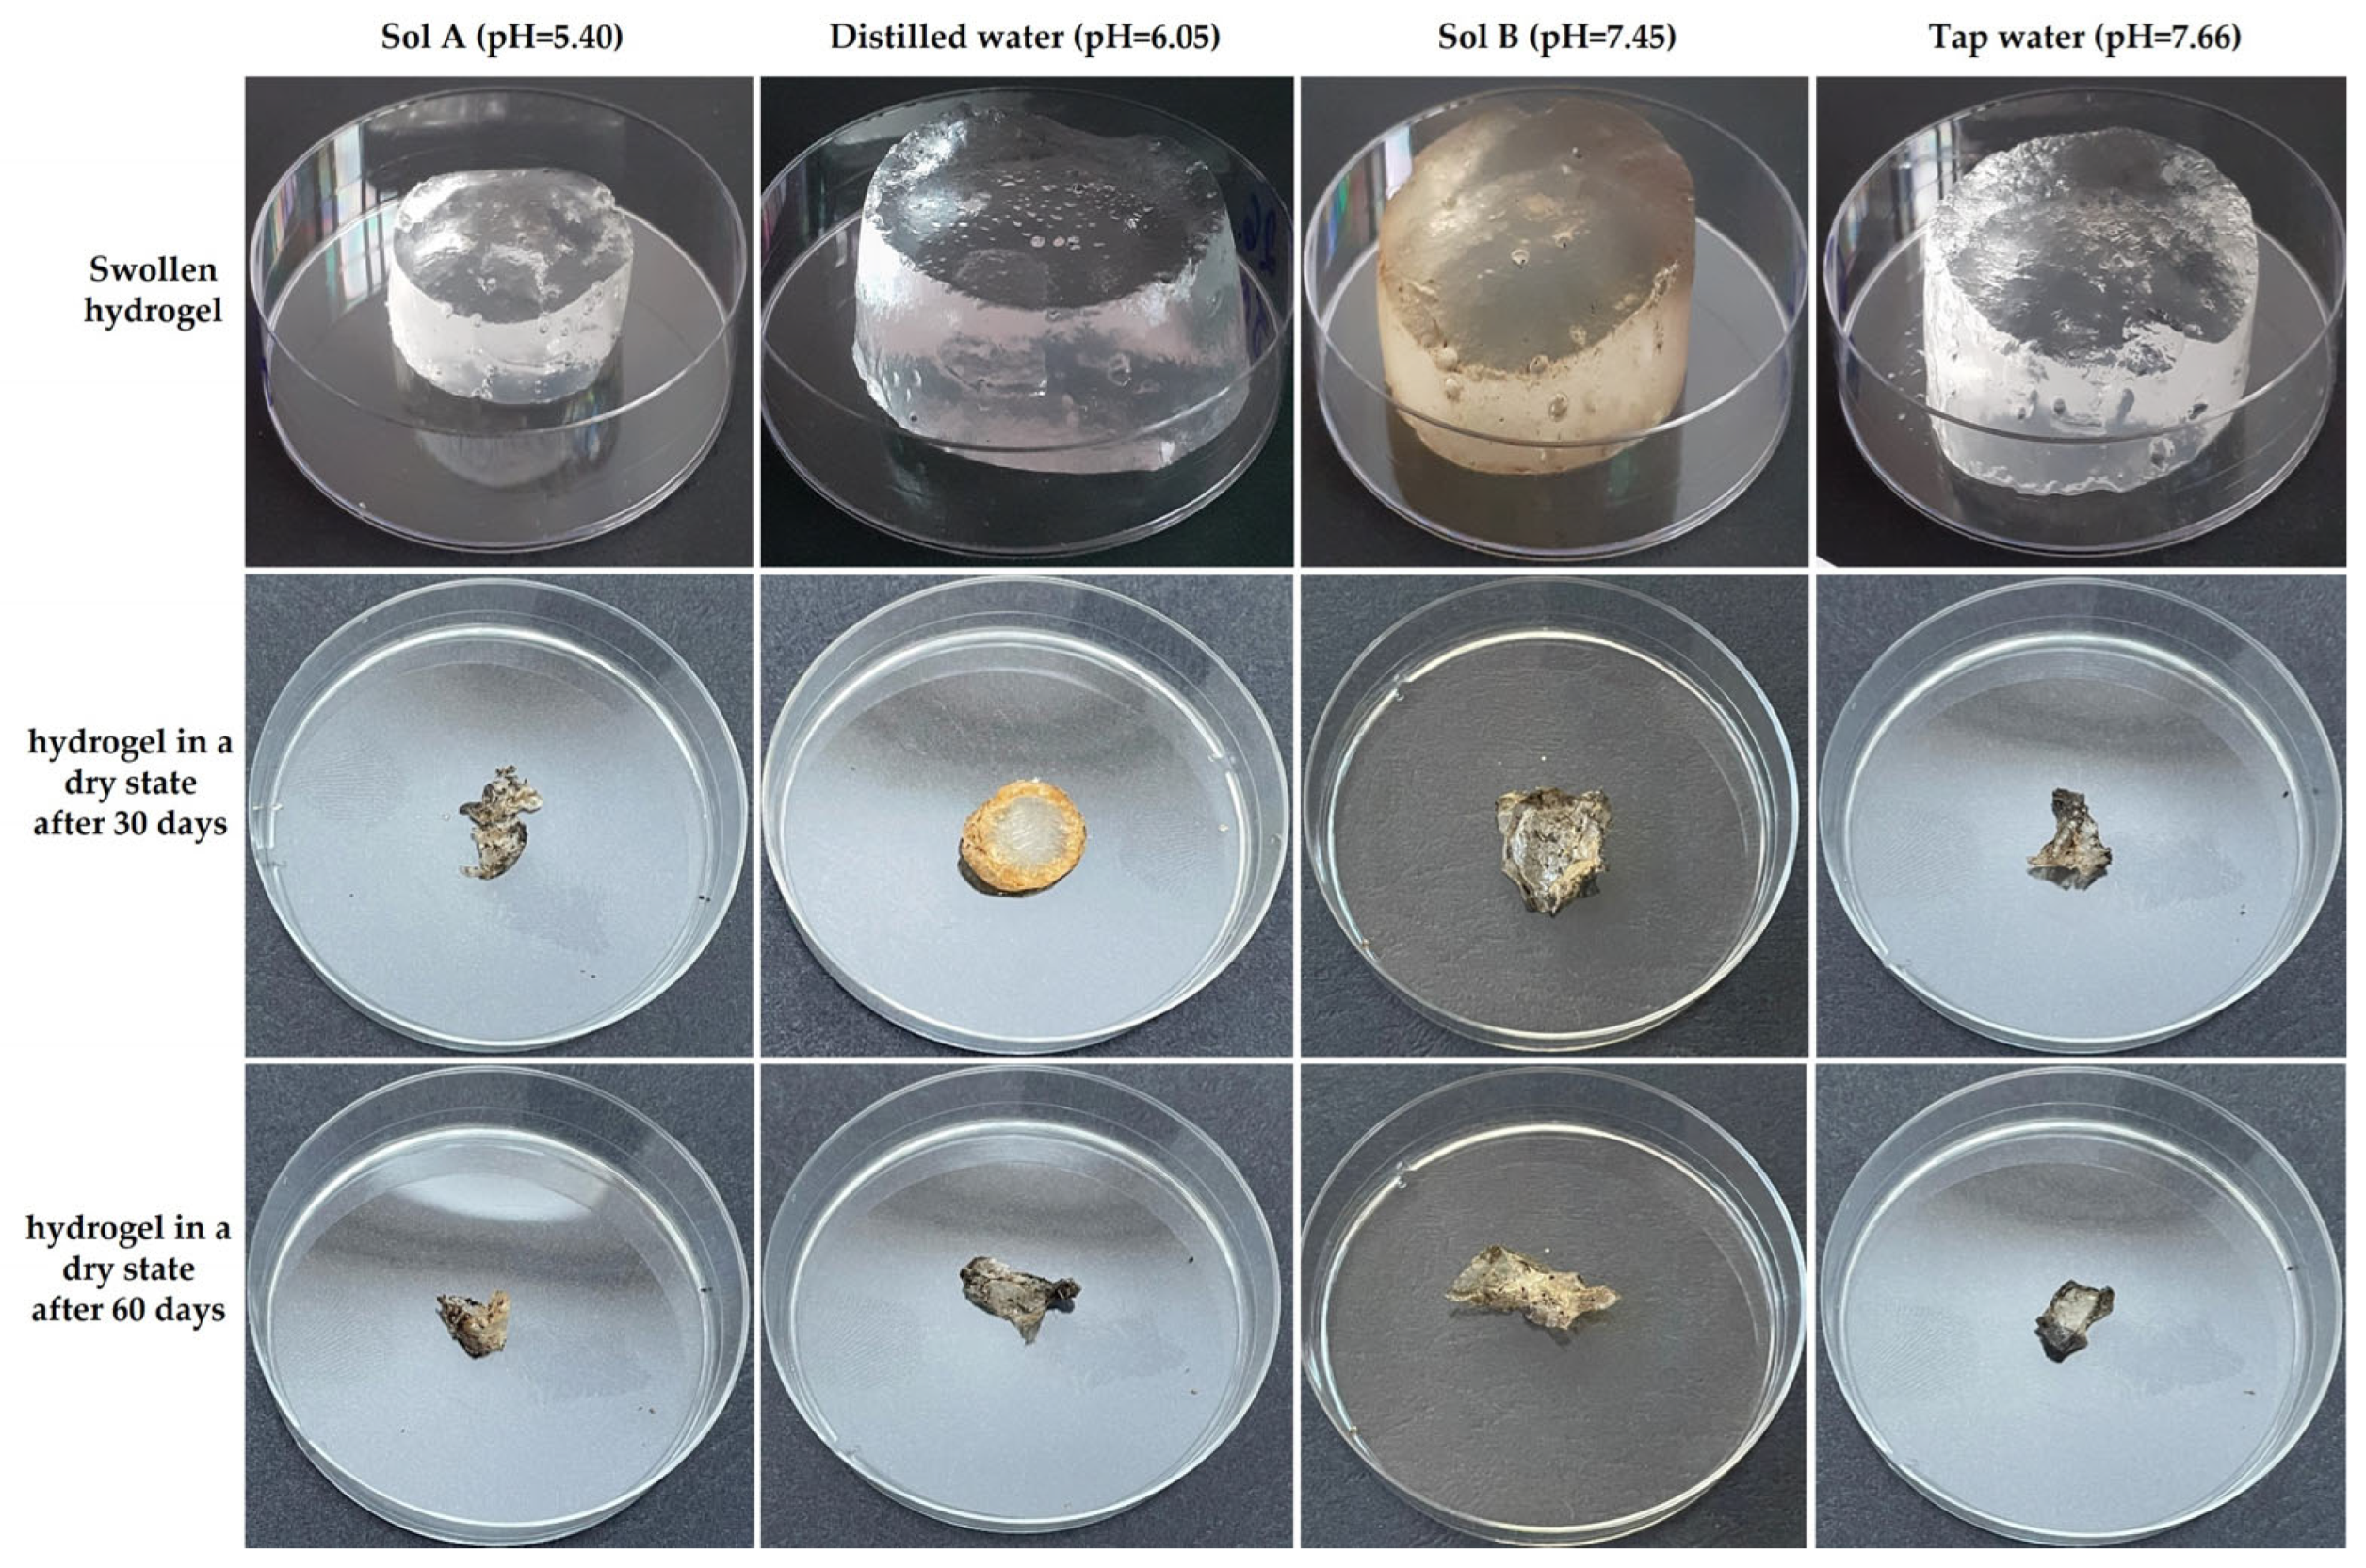
2.1.1. Hydrogel Swelling Assessment in Four Swelling Media
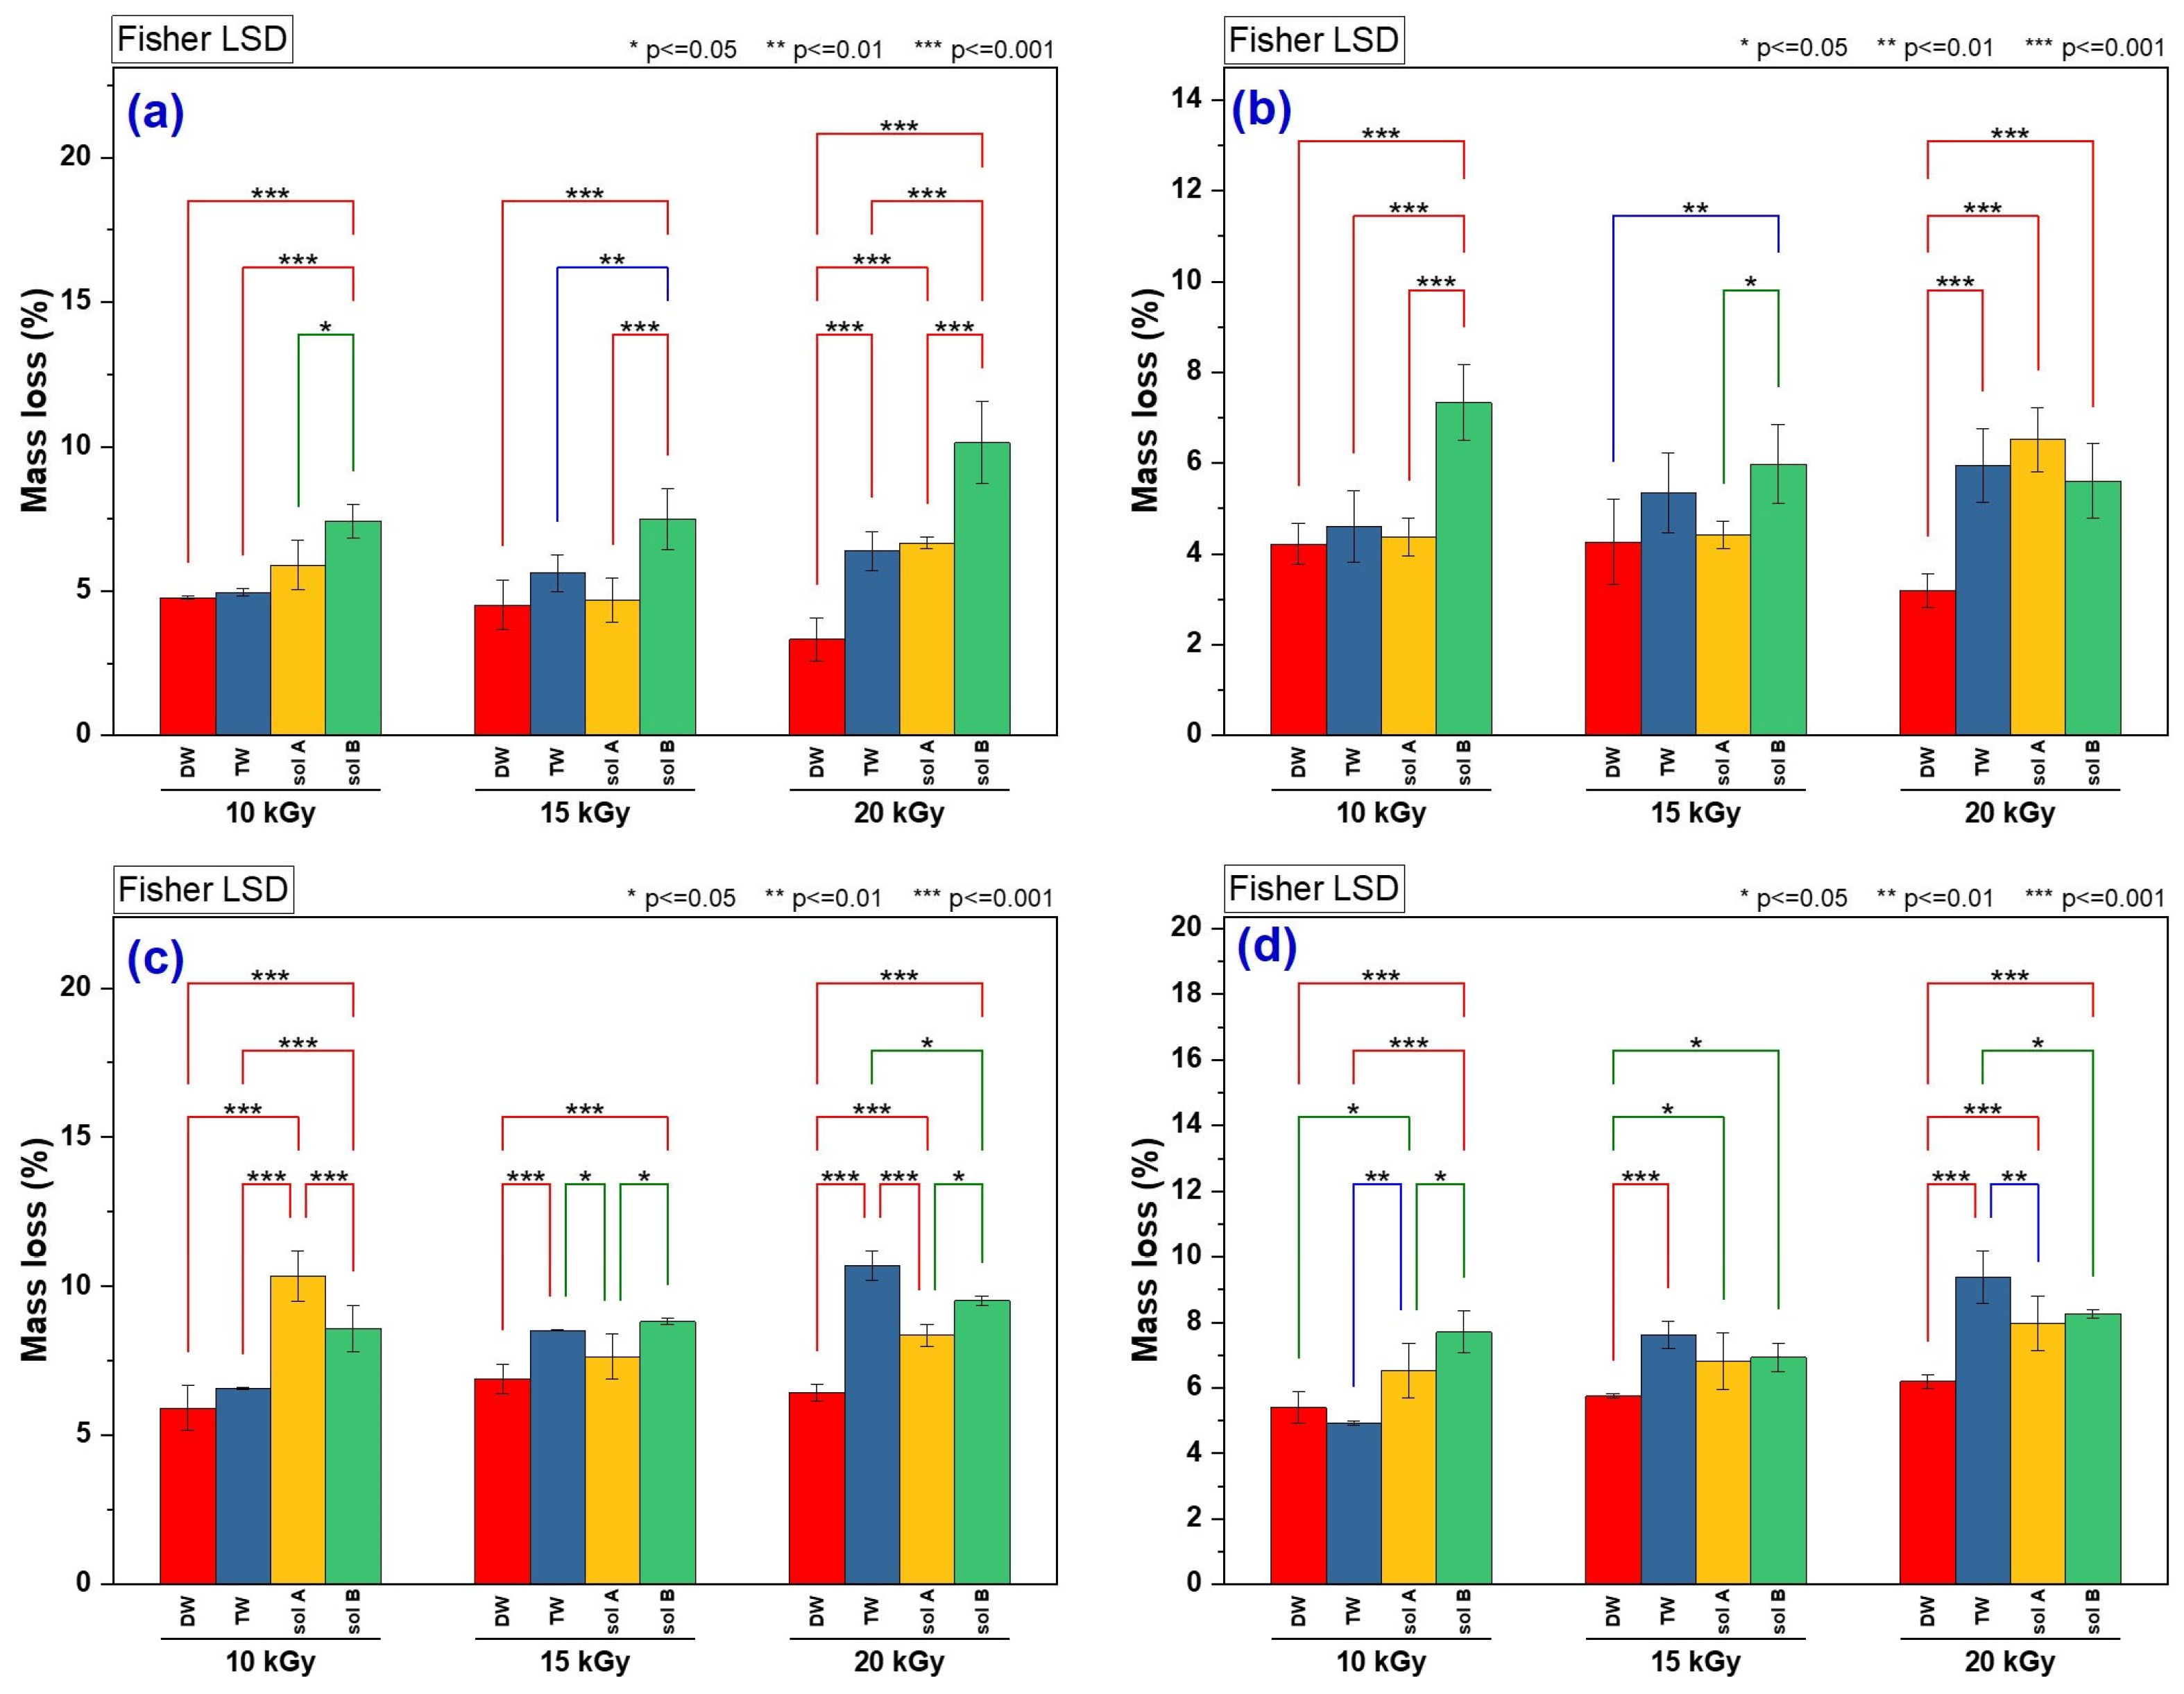
2.1.2. Hydrogel Mass Loss Assessment in Soil
2.1.3. Hydrogel Cross-Link Density, Mesh Size and Swelling at Equilibrium Assessment After Burial in Soil
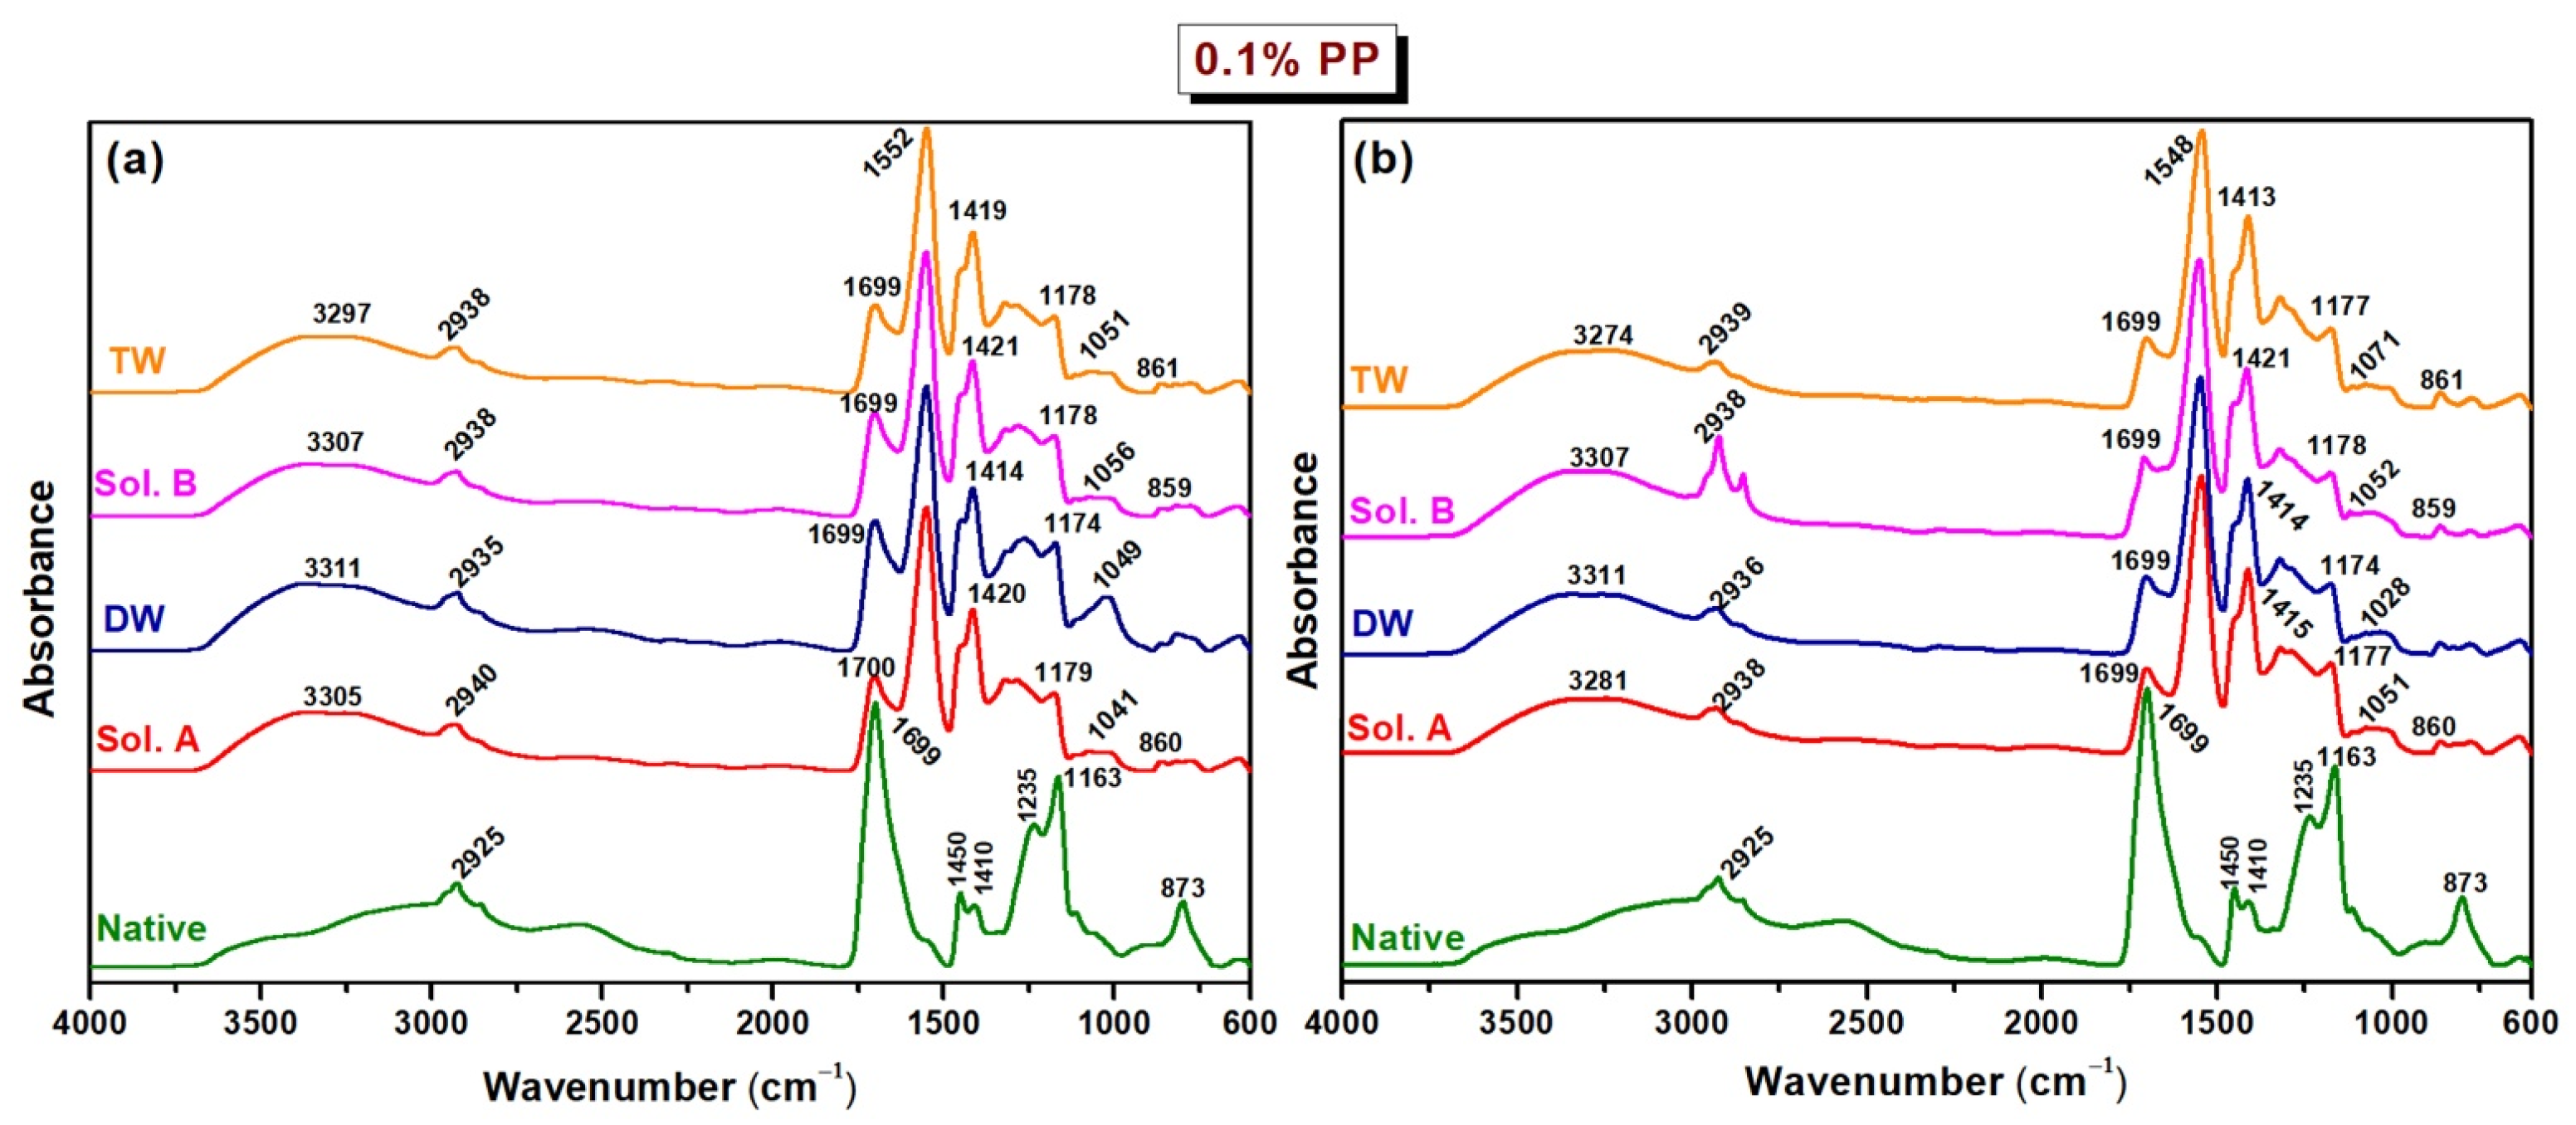
2.2. FTIR
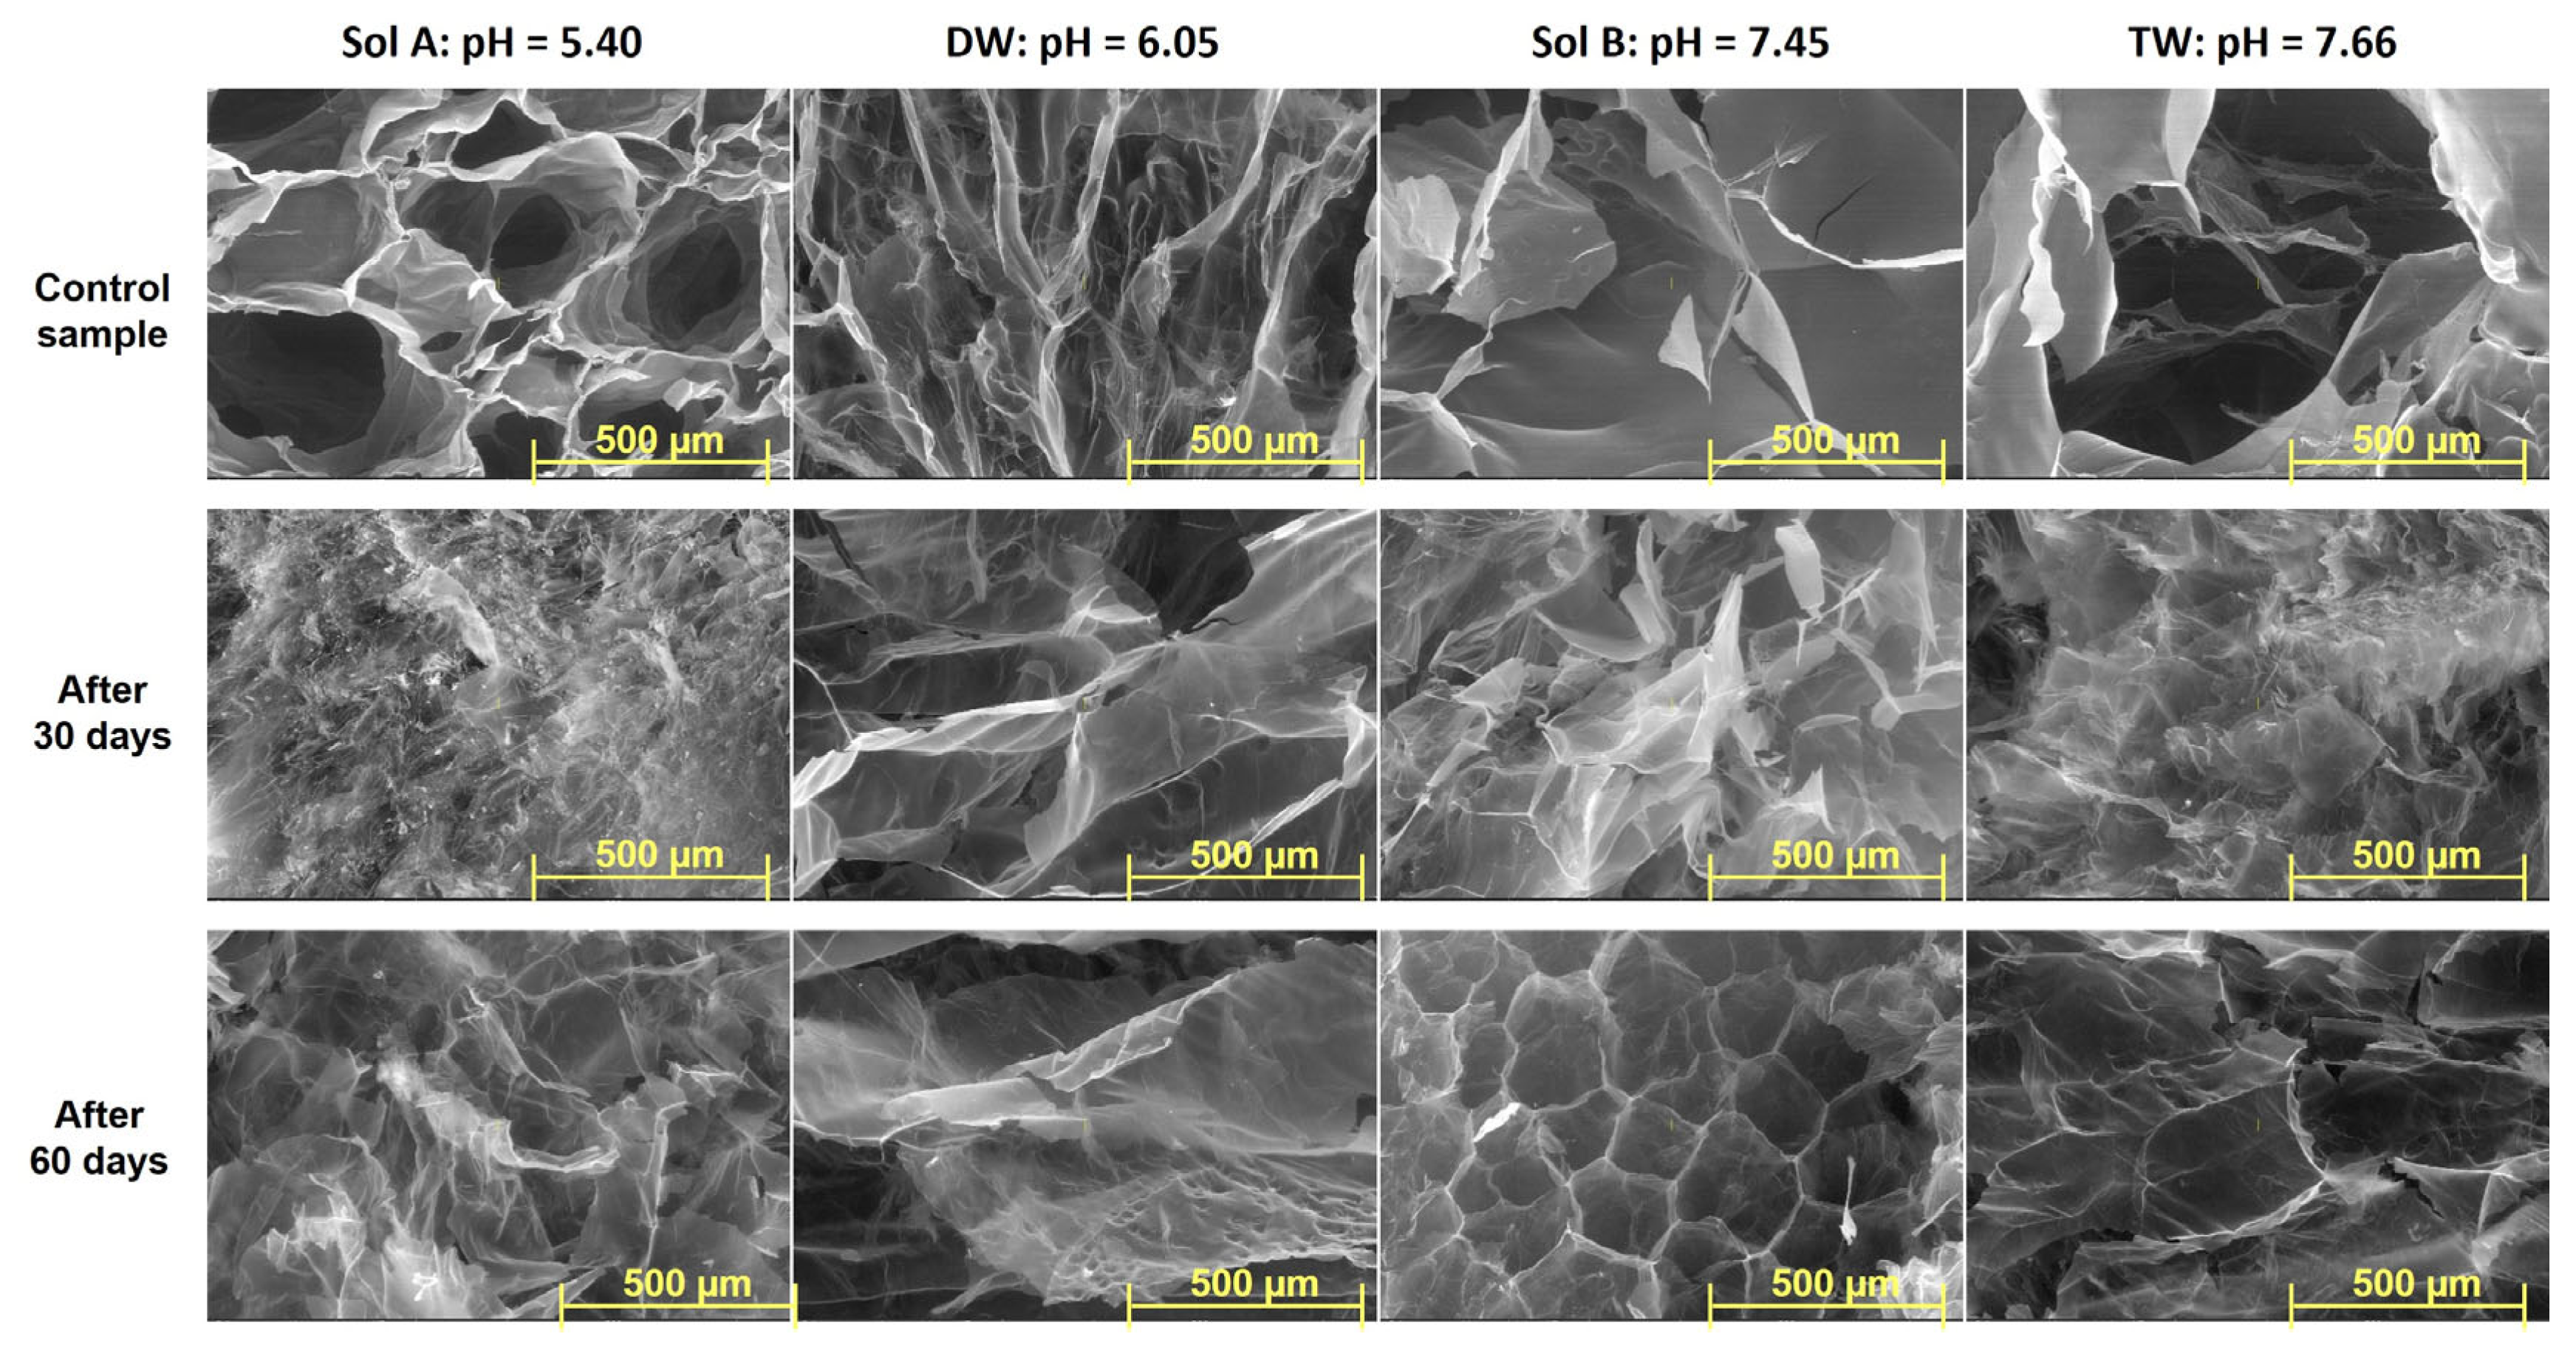
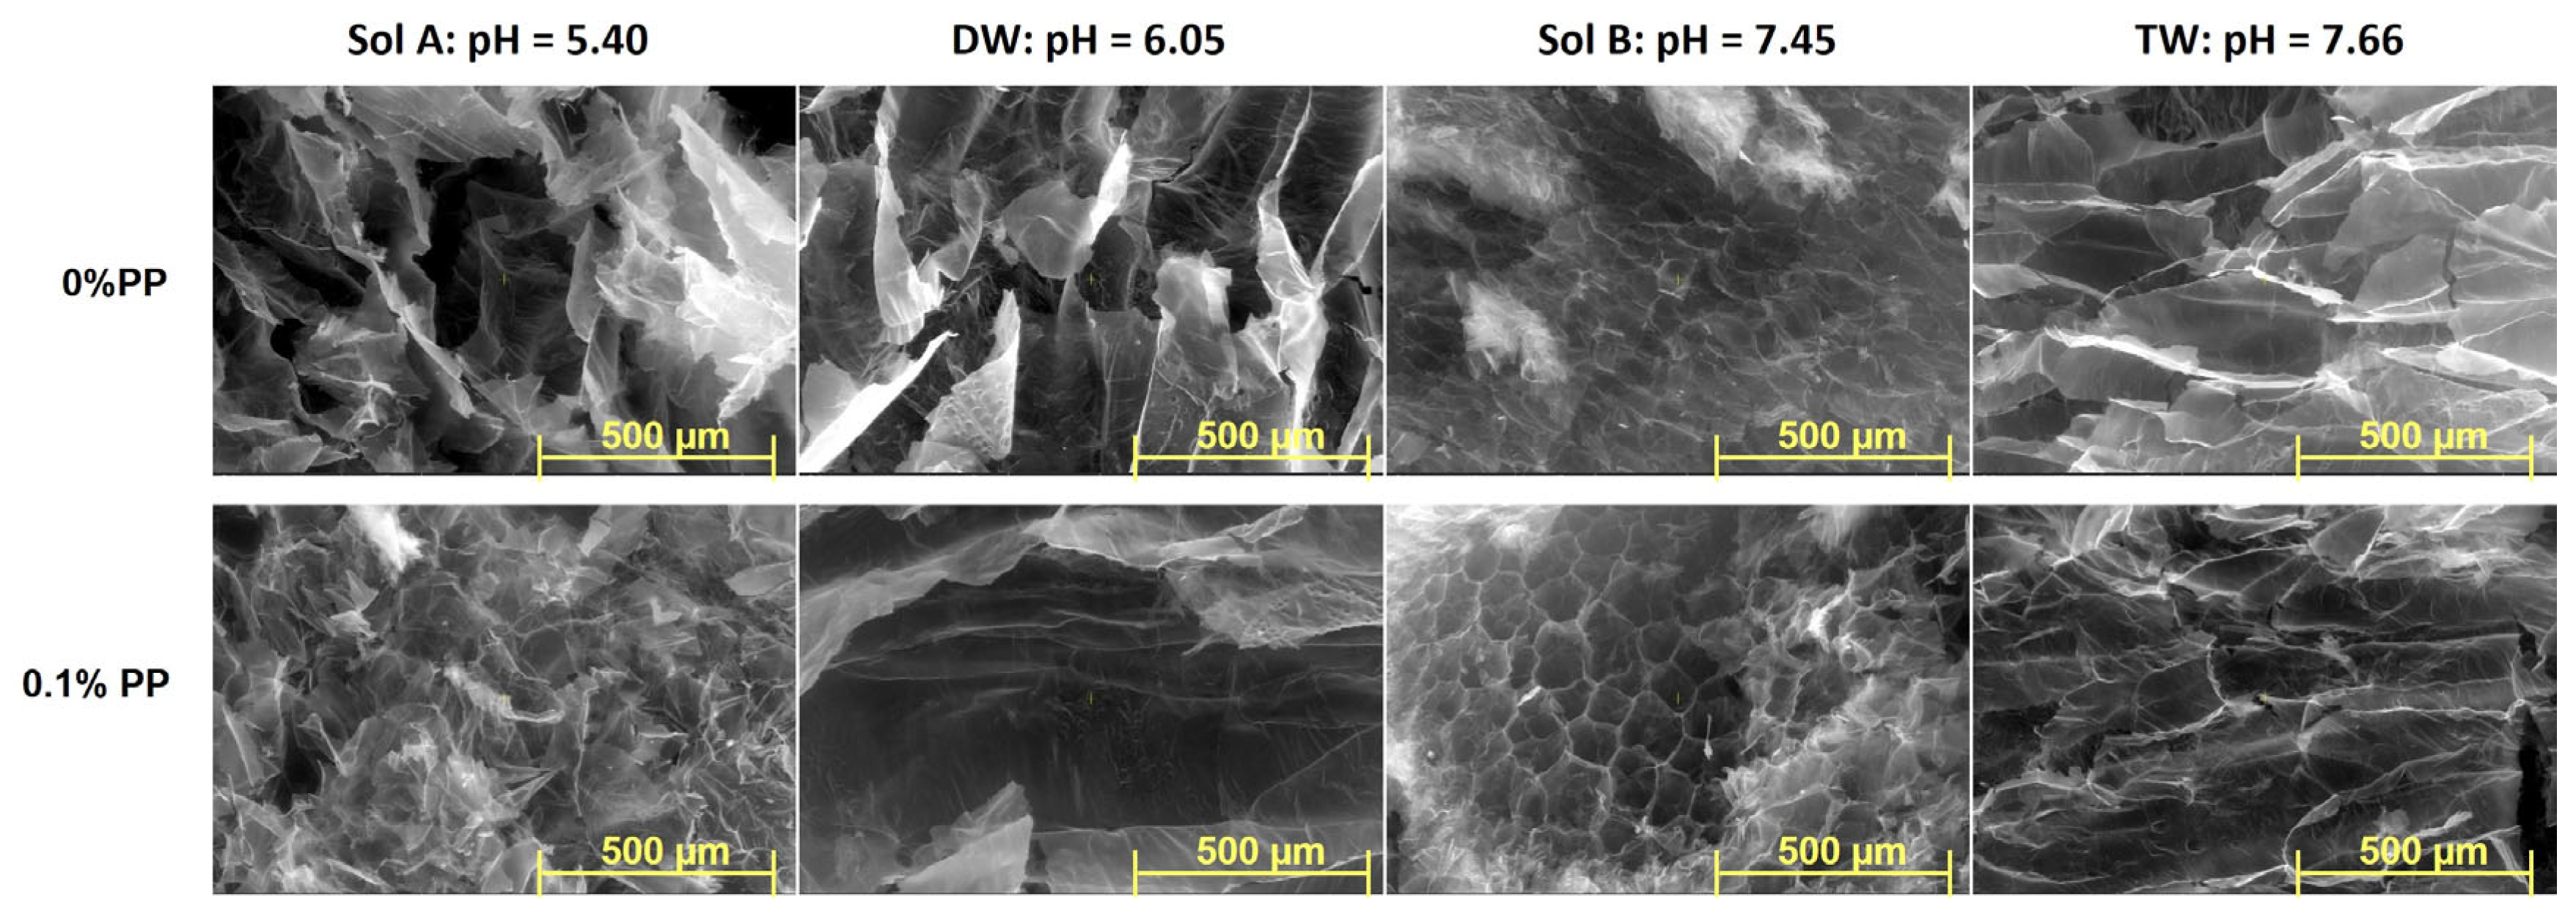
2.3. SEM
3. Materials and Methods
3.1. Method of Hydrogel Swelling Determination
3.2. Method of Mass Loss Determination
3.3. Methods of Cross-Link Density, Mesh Size and Swelling at Equilibrium Determination
3.4. Structural Characterization by FT-IR Technique
3.5. Morphological Characterization by SEM Technique
4. Conclusions
Author Contributions
Funding
Institutional Review Board Statement
Informed Consent Statement
Data Availability Statement
Acknowledgments
Conflicts of Interest
References
- Hidayat, E.; Sarbani, N.M.M.; Lahiri, S.K.; Samitsu, S.; Yonemura, S.; Mitoma, Y.; Harada, H. Effects of sodium alginate-poly(acrylic acid) cross-linked hydrogel beads on soil conditioner in the absence and presence of phosphate and carbonate ions. Case Stud. Chem. Environ. Eng. 2024, 9, 100642. [Google Scholar] [CrossRef]
- Wantzen, K.; Mol, J. Soil erosion from agriculture and mining: A threat to tropical stream ecosystems. Agriculture 2013, 3, 660–683. [Google Scholar] [CrossRef]
- Bibi, A.; Rehman, S.U.; Faiz, R.; Akhtar, T.; Nawaz, M.; Bibi, S. Effect of surfactants on swelling capacity and kinetics of alginate-chitosan/CNTs hydrogel. Mater. Res. Express 2019, 6, 085065. [Google Scholar] [CrossRef]
- Vundavalli, R.; Vundavalli, S.; Nakka, M.; Rao, D.S. Biodegradable nano-hydrogels in agricultural farming—Alternative source for water resources. Proc. Mat. Sci. 2015, 10, 548–554. [Google Scholar] [CrossRef]
- Saleem, S.; Sharma, K.; Sharma, A.K.; Sharma, V.; Kumar, V.; Kumar, V. Development of biodegradable gum guggul-based hydrogel as an efficient moisture-retaining agent for agricultural applications. Adsorption 2024, 30, 1749–1769. [Google Scholar] [CrossRef]
- Khodadadi-Dehkordi, D.; Seyyedboveir, S. Evaluation of super AB A 200 superabsorbent on water use efficiency and yield response factor of SCKaroun701 corn under deficit irrigation. Adv. Environ. Biol. 2013, 7, 4615–4623. [Google Scholar]
- Mittal, H.; Al Alili, A.; Morajkar, P.P.; Alhassan, S.M. Crosslinked hydrogels of polyethylenimine and graphene oxide to treat cr (VI) contaminated wastewater. Colloid. Surf. A 2021, 630, 127533. [Google Scholar] [CrossRef]
- Bashir, S.; Hina, M.; Iqbal, J.; Rajpar, A.H.; Mujtaba, M.A.; Alghamdi, N.A.; Wageh, S.; Ramesh, K.; Ramesh, S. Fundamental Concepts of Hydrogels: Synthesis, Properties, and Their Applications. Polymers 2020, 12, 2702. [Google Scholar] [CrossRef]
- Mahinroosta, M.; Jomeh Farsangi, Z.; Allahverdi, A.; Shakoori, Z. Hydrogels as intelligent materials: A brief review of synthesis, properties and applications. Mater. Today Chem. 2018, 8, 42–55. [Google Scholar] [CrossRef]
- Palanivelu, S.D.; Armir, N.A.Z.; Zulkifli, A.; Hair, A.H.A.; Salleh, K.M.; Lindsey, K.; Che-Othman, M.H.; Zakaria, S. Hydrogel Application in Urban Farming: Potentials and Limitations—A Review. Polymers 2022, 14, 2590. [Google Scholar] [CrossRef]
- Reghioua, A.; Barkat, D.; Jawad, A.H.; Abdulhameed, A.S.; Rangabhashiyam, S.; Khan, M.R.; Alothman, Z.A. Magnetic chitosan-glutaraldehyde/Zinc Oxide/Fe3O4 nanocomposite: Optimization and adsorptive mechanism of remazol brilliant blue Rdye removal. J. Polym. Environ. 2021, 29, 3932–3947. [Google Scholar] [CrossRef]
- EL Kaim Billah, R.; Lgaz, H.; Jimenez, D.G.; Pal, P.; Trujillo-Navarrete, B.; Ahrouch, M.; Algethami, J.S.; Abdellaoui, Y.; Majdoubi, H.; Alrashdi, A.A.; et al. Experimental and Theoretical Studies on Nitrate Removal Using Epichlorohydrin-Modified Cross-Linked Chitosan Derived from Shrimp Waste. Environ. Sci. Pollut. Res. 2023, 30, 107772–107789. [Google Scholar] [CrossRef] [PubMed]
- Jozwiak, T.; Filipkowska, U.; Szymczyk, P.; Rodziewicz, J.; Mielcarek, A. Effect of ionic and covalent crosslinking agents on properties of chitosan beads and sorption effectiveness of Reactive Black 5 dye. React. Funct. Polym. 2017, 114, 58–74. [Google Scholar] [CrossRef]
- Guilherme, M.; Aouada, F.; Fajardo, A.; Martins, A.; Paulino, A.; Davi, M.; Rubira, A.; Muniz, E. Superabsorbent hydrogels based on polysaccharides for application in agriculture as soil conditioner and nutrient carrier: A review. Eur. Polym. J. 2015, 72, 365–385. [Google Scholar] [CrossRef]
- Rizwan, M.; Gilani, S.R.; Durani, A.I.; Naseem, S. Materials diversity of hydrogel: Synthesis, polymerization process and soil conditioning properties in agricultural field. J. Adv. Res. 2021, 33, 15–40. [Google Scholar] [CrossRef]
- Oladosu, Y.; Rafii, M.; Arolu, F.; Chukwu, S.C.; Salisu, M.A.; Fagbohun, I.K.; Muftaudeen, T.K.; Swaray, S.; Bello Haliru, S. Superabsorbent Polymer Hydrogels for Sustainable Agriculture: A Review. Horticulturae 2022, 8, 605. [Google Scholar] [CrossRef]
- Nnadi, F.; Brave, C. Environmentally friendly superabsorbent polymers for water conservation in agricultural lands. J. Soil. Sci. Environ. Manag. 2011, 2, 206–211. Available online: https://academicjournals.org/journal/JSSEM/article-full-text-pdf/9FD3D7E2147 (accessed on 5 February 2025).
- Ramli, R.A. Slow release fertilizer hydrogels: A review. Polym. Chem. 2019, 10, 6073–6090. [Google Scholar] [CrossRef]
- Abobatta, W. Impact of hydrogel polymer in agricultural sector. Adv. Agric. Environ. Sci. 2018, 1, 59–64. Available online: https://ologyjournals.com/aaeoa/aaeoa_00011.pdf (accessed on 5 February 2025). [CrossRef]
- Jaramillo-Quiceno, N.; Duque Carmona, A.S.; Serna Serna, J.; Carmona, D.M.; Torres-Taborda, M.; Hincapie-Llanos, G.A.; Santa Marín, J.F.; Alvarez-Lopez, C. Enhancing soil water retention and plant growth with thermal crosslinked silk sericin-based hydrogel. J. Environ. Chem. Eng. 2024, 12, 112260. [Google Scholar] [CrossRef]
- Demitri, C.; Scalera, F.; Madaghiele, M.; Sannino, A.; Maffezzoli, A. Potential of cellulose-based superabsorbent hydrogels as water reservoir in agriculture. Int. J. Polym. Sci. 2013, 2013, 435073. [Google Scholar] [CrossRef]
- Azeredo, H.; Waldron, K. Crosslinking in polysaccharide and protein films and coatings for food contact—A review. Trends Food Sci. Tech. 2016, 52, 109–122. [Google Scholar] [CrossRef]
- Krasnopeeva, E.L.; Panova, G.G.; Yakimansky, A.V. Agricultural Applications of Superabsorbent Polymer Hydrogels. Int. J. Mol. Sci. 2022, 23, 15134. [Google Scholar] [CrossRef] [PubMed]
- El-Asmar, J.; Jaafar, H.; Bashour, I.; Farran, M.T.; Saoud, I.P. Hydrogel Banding Improves Plant Growth, Survival, and Water Use Efficiency in Two Calcareous Soils. Clean-Soil. Air Water 2017, 45, 1700251. [Google Scholar] [CrossRef]
- Ullah, F.; Othman, M.B.H.; Javed, F.; Ahmad, Z.; Akil, H.M. Classification, processing and application of hydrogels: A review. Mat. Sci. Eng. C-Mater. 2015, 57, 414–433. [Google Scholar] [CrossRef]
- Ramos Campos, E.V.; de Oliveira, J.L.; Fraceto, L.F.; Singh, B. Polysaccharides as safer release systems for agrochemicals. Agron. Sustain. Dev. 2014, 35, 47–66. [Google Scholar] [CrossRef]
- Zhao, L.; Zhou, Y.; Zhang, J.; Liang, H.; Chen, X.; Tan, H. Natural Polymer-Based Hydrogels: From Polymer to Biomedical Applications. Pharmaceutics 2023, 15, 2514. [Google Scholar] [CrossRef]
- Tariq, Z.; Iqbal, D.N.; Rizwan, M.; Ahmad, M.; Faheem, M.; Ahmed, M. Significance of biopolymer-based hydrogels and their applications in agriculture: A review in perspective of synthesis and their degree of swelling for water holding. RSC Adv. 2023, 13, 24731–24754. [Google Scholar] [CrossRef]
- El Idrissi, A.; Channab, B.E.; Essamlali, Y.; Zahouily, M. Superabsorbent hydrogels based on natural polysaccharides: Classification, synthesis, physicochemical properties, and agronomic efficacy under abiotic stress conditions: A review. Int. J. Biol. Macromol. 2024, 258, 128909. [Google Scholar] [CrossRef]
- Zumstein, M.T.; Schintlmeister, A.; Nelson, T.F.; Baumgartner, R.; Woebken, D.; Wagner, M.; Kohler, H.-P.E.; McNeill, K.; Sander, M. Biodegradation of synthetic polymers in soils: Tracking carbon into CO2 and microbial biomass. Sci. Adv. 2018, 4, eaas9024. Available online: https://www.science.org/doi/10.1126/sciadv.aas9024 (accessed on 5 February 2025). [CrossRef]
- Grima, S.; Bellon-Maurel, V.; Feuilloley, P.; Silvestre, F. Aerobic Biodegradation of Polymers in Solid-State Conditions: A Review of Environmental and Physicochemical Parameter Settings in Laboratory Simulations. J. Polym. Environ. 2000, 8, 183–195. Available online: https://link.springer.com/article/10.1023/A:1015297727244 (accessed on 5 February 2025). [CrossRef]
- Lucas, N.; Bienaime, C.; Belloy, C.; Queneudec, M.; Silvestre, F.; Nava-Saucedo, J.-E. Polymer biodegradation: Mechanisms and estimation techniques. Chemosphere 2008, 73, 429–442. [Google Scholar] [CrossRef] [PubMed]
- Adjuik, T.A.; Nokes, S.E.; Montross, M.D. Biodegradability of bio-based and synthetic hydrogels as sustainable soil amendments: A review. J. Appl. Polym. Sci. 2023, 140, e53655. [Google Scholar] [CrossRef]
- Hecht, H.; Srebnik, S. Structural Characterization of Sodium Alginate and Calcium Alginate. Biomacromolecules 2016, 17, 2160–2167. [Google Scholar] [CrossRef] [PubMed]
- Phang, Y.-N.; Chee, S.-Y.; Lee, C.-O.; Teh, Y.-L. Thermal and microbial degradation of alginate-based superabsorbent polymer. Polym. Degrad. Stabil. 2011, 96, 1653–1661. [Google Scholar] [CrossRef]
- Song, B.; Liang, H.; Sun, R.; Peng, P.; Jiang, Y.; She, D. Hydrogel synthesis based on lignin/sodium alginate and application in agriculture. Int. J. Biol. Macromol. 2020, 144, 219–230. [Google Scholar] [CrossRef]
- Craciun, G.; Calina, I.C.; Demeter, M.; Scarisoreanu, A.; Dumitru, M.; Manaila, E. Poly(Acrylic Acid)-Sodium Alginate Superabsorbent Hydrogels Synthesized by Electron Beam Irradiation Part I: Impact of Initiator Concentration and Irradiation Dose on Structure, Network Parameters and Swelling Properties. Materials 2023, 16, 4552. [Google Scholar] [CrossRef]
- Manaila, E.; Craciun, G. Poly(acrylic Acid)-Sodium Alginate Superabsorbent Hydrogels Synthesized by Electron-Beam Irradiation—Part II: Swelling Kinetics and Absorption Behavior in Various Swelling Media. Gels 2024, 10, 609. [Google Scholar] [CrossRef]
- Manaila, E.; Demeter, M.; Calina, I.C.; Craciun, G. NaAlg-g-AA Hydrogels: Candidates in Sustainable Agriculture Applications. Gels 2023, 9, 316. [Google Scholar] [CrossRef]
- Distilled Water: Uses, Safety and Side Effects. Available online: https://svalbardi.com/blogs/water/distilled (accessed on 6 February 2025).
- Wu, y.; Liu, Q.; Liu, D.; Cao, X.P.; Yuan, B.; Zhao, M. CO2 responsive expansion hydrogels with programmable swelling for in-depth CO2 conformance control in porous media. Fuel 2023, 332, 126047. [Google Scholar] [CrossRef]
- ALSamman, M.T.; Sánchez, J. Chitosan- and Alginate-Based Hydrogels for the Adsorption of Anionic and Cationic Dyes from Water. Polymers 2022, 14, 1498. [Google Scholar] [CrossRef] [PubMed]
- Lin, H.; Zhou, J.; Yingde, C.; Gunasekaran, S. Synthesis and Characterization of pH- and Salt-Responsive Hydrogels Based on Etherificated Sodium Alginate. J. Appl. Polym. Sci. 2010, 115, 3161–3167. [Google Scholar] [CrossRef]
- Hossain, M.; Afroz, S.; Islam, M.U.; Moshiul Alam, A.K.M.; Khan, R.A.; Alam, A. Synthesis and characterization of polyvinyl alcohol/water-hyacinth (Eichhornia crassipes) based hydrogel by applying gamma radiation. J. Polym. Res. 2021, 28, 167. [Google Scholar] [CrossRef]
- Turioni, C.; Guerrini, G.; Squartini, A.; Morari, F.; Maggini, M.; Gross, S. Biodegradable Hydrogels: Evaluation of Degradation as a Function of Synthesis Parameters and Environmental Conditions. Soil. Syst. 2021, 5, 47. [Google Scholar] [CrossRef]
- Wu, Q.; Zhang, J.; Liu, X.; Chang, T.; Wang, Q.; Shaghaleh, H.; Hamoud, Y.A. Effects of biochar and vermicompost on microorganisms and enzymatic activities in greenhouse soil. Front. Environ. Sci. 2023, 10, 1060277. [Google Scholar] [CrossRef]
- Wang, F.; Wang, X.; Song, N. Biochar and vermicompost improve the soil properties and the yield and quality of cucumber (Cucumis sativus L.) grown in plastic shed soil continuously cropped for different years. Agric. Ecosyst. Environ. 2021, 315, 107425. [Google Scholar] [CrossRef]
- Pramanik, P.; Ghosh, G.K.; Banik, P. Effect of microbial inoculation during vermicomposting of different organic substrates on microbial status and quantification and documentation of acid phosphatase. Waste Manag. 2009, 29, 574–578. [Google Scholar] [CrossRef]
- Manaila, E.; Craciun, G.; Calina, I.C. Sodium Alginate-g-Acrylamide/Acrylic Acid hydrogels obtained by electron beam irradiation for soil conditioning. Int. J. Mol. Sci. 2023, 24, 104. [Google Scholar] [CrossRef]
- Tamariz, E.; Rios-Ramrez, A. Biodegradation of Medical Purpose Polymeric Materials and Their Impact on Biocompatibility. In Biodegradatio—Life of Science; Chamy, R., Rosenkranz, F., Eds.; InTech: London, UK, 2013; Available online: https://www.intechopen.com/chapters/45099 (accessed on 6 February 2025).
- Zambare, V.; Din, M.F.M. Introductory Chapter: Biodegradation—New Insights. In Bioremediation for Global Environmental Conservation; Shiomi, N., Zambare, V., Din, M.F.M., Eds.; InTech: London, UK, 2023; Available online: https://www.intechopen.com/chapters/87625 (accessed on 6 February 2025).
- Glaser, A.J. Biological degradation of polymers in the environment. In Plastics in the Environment; Gomiero, A., Ed.; InTech: London, UK, 2019; Available online: https://www.intechopen.com/chapters/66340 (accessed on 6 February 2025).
- Silva, R.R.A.; Marques, C.S.; Arruda, T.R.; Teixeira, S.C.; de Oliveira, T.V. Biodegradation of Polymers: Stages, Measurement, Standards and Prospects. Macromol 2023, 3, 371–399. [Google Scholar] [CrossRef]
- Pan, Z.; Brassart, L. Constitutive modelling of hydrolytic degradation in hydrogels. J. Mech. Phys. Solids 2022, 167, 105016. [Google Scholar] [CrossRef]
- Liang, D.; Du, C.; Ma, F.; Shen, Y.; Wu, K.; Zhou, J. Degradation of Polyacrylate in the Outdoor Agricultural Soil Measured by FTIR-PAS and LIBS. Polymers 2018, 10, 1296. [Google Scholar] [CrossRef] [PubMed]
- Jiao, T.; Lian, Q.; Lian, W.; Wang, Y.; Li, D.; Reis, R.L.; Oliveira, J.M. Properties of Collagen/Sodium Alginate Hydrogels for Bioprinting of Skin Models. J. Bionic Eng. 2023, 20, 105–118. [Google Scholar] [CrossRef]
- Durpekova, S.; Di Martino, A.; Dusankova, M.; Drohsler, P.; Sedlarik, V. Biopolymer Hydrogel Based on Acid Whey and Cellulose Derivatives for Enhancement Water Retention Capacity of Soil and Slow Release of Fertilizers. Polymers 2021, 13, 3274. [Google Scholar] [CrossRef]
- Karadag, E.; Saraydin, D. Swelling studies of super water retainer acrylamide/crotonic acid hydrogels crosslinked by trimethylolpropane triacrylate and 1,4-butanediol dimethacrylate. Polym. Bull. 2002, 48, 299–307. Available online: https://link.springer.com/article/10.1007/s00289-002-0029-8 (accessed on 6 February 2025). [CrossRef]
- Karadag, E.; Saraydin, D.; Sahiner, N.; Güven, O. Radiation induced acrylamide/citric acid hydrogelas and their swelling behaviors. J. Macromol. Sci. A 2001, 38, 1105–1121. Available online: https://www.tandfonline.com/doi/full/10.1081/MA-100107132 (accessed on 6 February 2025). [CrossRef]
- Niu, C.; Li, X.; Wang, Y.; Liu, X.; Shi, J.; Wang, X. Design and performance of a poly(vinyl alcohol)/silk fibroin enzymatically crosslinked semiinterpenetrating hydrogel for a potential hydrophobic drug delivery. RSC Adv. 2019, 9, 41074–41082. Available online: https://pubs.rsc.org/en/content/articlelanding/2019/ra/c9ra09344c (accessed on 6 February 2025). [CrossRef]
- Xu, Y.; Hanna, M.A. Preparation and properties of biodegradable foams from starch acetate and poly (tetramethylene adipateco-terephthalate). Carbohydr. Polym. 2005, 59, 521–529. [Google Scholar] [CrossRef]
- Salimia, M.; Motamedib, E.; Motesharezedeha, B.; Hosseinia, H.M.; Alikhania, H.A. Starch-g-poly(acrylic acid-co-acrylamide) composites reinforced with natural char nanoparticles toward environmentally benign slow-release urea fertilizers. J. Environ. Chem. Eng. 2020, 8, 103765. [Google Scholar] [CrossRef]
- Călina, I.; Demeter, M.; Crăciun, G.; Scărișoreanu, A.M.; Mănăilă, E. The influence of the structural architecture on the swelling kinetics and the physical-chemical behavior of sodium alginate-based hydrogels cross-linked with ionizing radiation. Gels 2024, 10, 588. [Google Scholar] [CrossRef]
- Yiamsawas, D.; Kangwansupamonkon, W.; Chailapakul, O.; Kiatkamjornwong, S. Synthesis and Swelling Properties of Poly[Acrylamide-Co-(Crotonic Acid)] Superabsorbents. React. Funct. Polym. 2007, 67, 865–882. [Google Scholar] [CrossRef]
- Ding, Z.Y.; Aklonis, J.J.; Salovey, R. Model Filled Polymers. VI. Determination of the Crosslink Density of Polymeric Beads by Swelling. J. Polym. Sci. Part. B Polym. Phys. 1991, 29, 1035–1038. Available online: https://onlinelibrary.wiley.com/doi/pdf/10.1002/polb.1991.090290815 (accessed on 6 February 2025). [CrossRef]
- Gudeman, L.F.; Peppas, N.A. PH-Sensitive Membranes from Poly(Vinyl Alcohol)/Poly(Acrylic Acid) Interpenetrating Networks. J. Membr. Sci. 1995, 107, 239–248. [Google Scholar] [CrossRef]
- Lee, B.H.; Li, B.; Guelcher, S.A. Gel Microstructure Regulates Proliferation and Differentiation of MC3T3-E1 Cells Encapsulated in Alginate Beads. Acta Biomater. 2012, 8, 1693–1702. [Google Scholar] [CrossRef] [PubMed]
- Liu, D.; Yang, M.; Wang, D.; Jing, X.; Lin, Y.; Feng, L.; Duan, X. DPD Study on the Interfacial Properties of PEO/PEO-PPO-PEO/PPO Ternary Blends: Effects of Pluronic Structure and Concentration. Polymers 2021, 13, 2866. [Google Scholar] [CrossRef]


| Swelling Media | 0% PP (Type I) | 0.1% PP (Type I) | ||||
|---|---|---|---|---|---|---|
| 10 kGy | 15 kGy | 20 kGy | 10 kGy | 15 kGy | 20 kGy | |
| 0% PP (Type I) | ||||||
| Sol. A (pH = 5.40) | 4119 ± 231 abC | 4655 ± 234 aC | 3747 ± 221 bC | 5965 ± 401 aC | 4975 ± 240 bC | 3700 ± 202 cC |
| Distilled water (pH = 6.05) | 13,244 ± 730 aA | 9160 ± 266 bB | 3981 ± 255 cC | 17,066 ± 1138 aA | 8562 ± 565 bB | 4768 ± 352 cB |
| Sol. B (pH = 7.45) | 10,500 ± 474 bB | 11,943 ± 461 aA | 7639 ± 411 cA | 12,139 ± 473 aB | 10,740 ± 311 bA | 8573 ± 496 cA |
| Tap water (pH = 7.66) | 10,672 ± 408 aB | 8404 ± 419 bB | 6040 ± 333 cB | 11,341 ± 775 aB | 9079 ± 446 bB | 7732 ± 459 bA |
| Swelling Media | 30 Days | 60 Days | ||||
|---|---|---|---|---|---|---|
| 10 kGy | 15 kGy | 20 kGy | 10 kGy | 15 kGy | 20 kGy | |
| 0% PP (Type I) | ||||||
| Sol. A (pH = 5.40) | 5.90 ± 0.86 abB | 4.68 ± 0.77 bB | 6.67 ± 0.20 aB | 10.34 ± 0.85 aA | 7.66 ± 0.75 bAB | 8.36 ± 0.38 bC |
| Distilled water (pH = 6.05) | 4.77 ± 0.05 aB | 4.52 ± 0.87 aB | 3.33 ± 0.74 aC | 5.92 ± 0.75 aB | 6.90 ± 0.50 aB | 6.43 ± 0.27 aD |
| Sol. B (pH = 7.45) | 7.42 ± 0.58 bA | 7.49 ± 1.04 abA | 10.14 ± 1.42 aA | 8.59 ± 0.79 aA | 8.82 ± 0.10 aA | 10.52 ± 0.16 aB |
| Tap water (pH = 7.66) | 4.95 ± 0.14 bB | 5.62 ± 0.64 abAB | 6.39 ± 0.67 aB | 6.58 ± 0.05 cB | 8.54 ± 0.02 bA | 10.70 ± 0.49 aA |
| 0.1% PP (Type II) | ||||||
| Sol. A (pH = 5.40) | 4.37 ± 0.42 bB | 4.42 ± 0.31 bA | 6.52 ± 0.71 aA | 6.52 ± 0.83 aAB | 6.82 ± 0.87 aAB | 7.97 ± 0.84 aA |
| Distilled water (pH = 6.05) | 4.22 ± 0.45 aB | 4.26 ± 0.94 aA | 3.19 ± 0.38 aB | 5.41 ± 0.47 bBC | 5.75 ± 0.07 abB | 6.19 ± 0.20 aB |
| Sol. B (pH = 7.45) | 7.34 ± 0.84 aA | 5.98 ± 0.87 aA | 5.61 ± 0.82 aA | 7.70 ± 0.64 abA | 6.93 ± 0.44 bAB | 8.26 ± 0.12 aA |
| Tap water (pH = 7.66) | 4.60 ± 0.78 aB | 5.35 ± 0.88 aA | 5.95 ± 0.81 aA | 4.94 ± 0.06 cC | 7.63 ± 0.41 bA | 9.38 ± 0.80 aA |
| Source | Type I | Type II | ||||||
|---|---|---|---|---|---|---|---|---|
| 30 Days | 60 Days | 30 Days | 60 Days | |||||
| F Value | p Value | F Value | p Value | F Value | p Value | F Value | p Value | |
| Sol. A | 6.55041 | 0.031 | 12.158 | 0.00775 | 17.47761 | 0.00314 | 2.43607 | 0.16808 |
| DW | 4.13098 | 0.07446 | 2.43342 | 0.16832 | 2.68745 | 0.14676 | 5.19525 | 0.04905 |
| Sol. B | 6.27388 | 0.03385 | 3.17573 | 0.11463 | 3.47624 | 0.0994 | 6.4635 | 0.03186 |
| TW | 5.27011 | 0.04773 | 159.34982 | <0.0001 | 2.01043 | 0.21465 | 55.81697 | 1.32695 × 10⁻⁴ |
| 10 kGy | 15.94506 | 9.75789 × 10⁻⁴ | 25.44076 | 1.91662 × 10⁻⁴ | 15.37189 | 0.0011 | 13.72213 | 0.00161 |
| 15 kGy | 7.82764 | 0.00916 | 11.08274 | 0.0032 | 3.12963 | 0.08749 | 6.44115 | 0.01582 |
| 20 kGy | 30.37944 | 1.00924 × 10⁻⁴ | 81.34161 | <0.0001 | 13.04047 | 0.0019 | 14.95515 | 0.00121 |
| Dose (kGy) | Sol. A (pH = 5.4) | Distilled Water (pH = 6.05) | Sol. B (pH = 7.45) | Tap Water (pH = 7.66) |
|---|---|---|---|---|
| 0% PP (type I) | ||||
| 10 | 75.25 | 24.11 | 15.77 | 32.93 |
| 15 | 63.68 | 52.65 | 17.76 | 51.96 |
| 20 | 25.34 | 93.09 | 3.75 | 67.45 |
| 0.1% PP (type II) | ||||
| 10 | 49.20 | 28.20 | 4.90 | 7.39 |
| 15 | 54.30 | 34.98 | 15.89 | 42.62 |
| 20 | 22.24 | 94.04 | 47.24 | 57.65 |
| Dose (kGy) | Sol. A (pH = 5.4) |
DW (pH = 6.05) |
Sol. B (pH = 7.45) |
TW (pH = 7.66) |
Sol. A (pH = 5.4) |
DW (pH = 6.05) |
Sol. B (pH = 7.45) |
TW (pH = 7.66) |
|---|---|---|---|---|---|---|---|---|
| q × 103 (mol/cm3) | Change (%) | |||||||
| 30 Days | ||||||||
| 0% PP (Type I) | ||||||||
| 10 | 0.421 ± 0.02 bC | 0.710 ± 0.01 cA | 0.734 ± 0.01 cA | 0.656 ± 0.01 cB | −49.88 | −15.48 | −12.62 | −21.90 |
| 15 | 0.448 ± 0.01 bC | 1.085 ± 0.03 bA | 0.946 ± 0.03 bB | 1.003 ± 0.04 bB | −76.53 | −43.16 | −50.45 | −47.46 |
| 20 | 2.517 ± 0.07 aB | 1.926 ± 0.05 aC | 2.726 ± 0.07 aA | 1.559 ± 0.04 aD | −74.72 | −80.66 | −72.63 | −84.34 |
| 0.1% PP (Type II) | ||||||||
| 10 | 0.801 ± 0.01 cB | 1.027 ± 0.02 cA | 1.012 ± 0.03 cA | 0.989 ± 0.02 cA | −28.29 | −8.06 | −9.40 | −11.46 |
| 15 | 1.001 ± 0.04 bC | 1.739 ± 0.05 bA | 1.521 ± 0.06 bB | 1.636 ± 0.04 bAB | −66.16 | −41.21 | −48.58 | −44.69 |
| 20 | 1.777 ± 0.06 aC | 2.022 ± 0.05 aB | 2.308 ± 0.08 aA | 1.972 ± 0.05 aB | −73.75 | −70.13 | −65.91 | −70.87 |
| 60 days | ||||||||
| 0% PP (Type I) | ||||||||
| 10 | 0.287 ± 0.01 cC | 0.683 ± 0.01 cA | 0.702 ± 0.02 cA | 0.619 ± 0.01 cB | −65.83 | −18.69 | −16.43 | −26.31 |
| 15 | 0.430 ± 0.011 bC | 0.871 ± 0.02 bB | 0.836 ± 0.02 bB | 0.962 ± 0.02 bA | −77.48 | −54.37 | −56.21 | −49.61 |
| 20 | 2.506 ± 0.07 aA | 1.306 ± 0.03 aC | 2.224 ± 0.06 aB | 1.334 ± 0.02 aC | −74.83 | −86.88 | −77.67 | −86.60 |
| 0.1% PP (Type II) | ||||||||
| 10 | 0.769 ± 0.02 cB | 0.982 ± 0.03 cA | 0.990 ± 0.02 cA | 0.936 ± 0.02 cA | −31.15 | −12.09 | −11.37 | −16.20 |
| 15 | 0.893 ± 0.02 bD | 1.668 ± 0.04 bA | 1.400 ± 0.03 bC | 1.520 ± 0.04 bB | −69.81 | −43.61 | −52.67 | −48.61 |
| 20 | 1.680 ± 0.05 aB | 2.008 ± 0.05 aA | 2.037 ± 0.05 aA | 1.654 ± 0.04 aB | −75.18 | −70.34 | −69.91 | −75.57 |
| Dose (kGy) | Sol. A (pH = 5.4) | DW (pH = 6.05) | Sol. B (pH = 7.45) | TW (pH = 7.66) | Sol. A (pH = 5.4) | DW (pH = 6.05) | Sol. B (pH = 7.45) | TW (pH = 7.66) |
|---|---|---|---|---|---|---|---|---|
| ξ (nm) | Change (%) | |||||||
| 30 Days | ||||||||
| 0% PP (Type I) | ||||||||
| 10 | 224.27 ± 7.07 aA | 155.70 ± 2.08 aBC | 152.06 ± 2.03 aC | 164.57 ± 2.54 aB | +61.58 | +12.18 | +9.55 | +18.57 |
| 15 | 215.37 ± 4.43 aA | 116.12 ± 2.13 bC | 127.80 ± 2.51 bB | 122.68 ± 3.00 bBC | +175.06 | +48.30 | +63.22 | +56.68 |
| 20 | 66.63 ± 1.29 bC | 80.29 ± 1.50 cB | 63.01 ± 1.16 cD | 93.07 ± 1.48 cA | +160.27 | +213.63 | +146.13 | +263.55 |
| 0.1% PP (Type II) | ||||||||
| 10 | 152.46 ± 0.02 aA | 128.17 ± 1.43 aB | 129.57 ± 2.58 aB | 131.60 ± 1.89 aB | +25.69 | +5.66 | +6.82 | +8.49 |
| 15 | 128.32 ± 3.77 bA | 87.24 ± 1.58 bC | 95.82 ± 2.56 bB | 91.06 ± 1.69 bBC | +112.45 | +44.44 | +58.64 | +50.76 |
| 20 | 84.18 ± 2.06 cA | 76.89 ± 1.27 cB | 70.13 ± 1.62 cC | 78.25 ± 1.40 cB | +152.79 | +130.90 | +110.60 | +134.98 |
| 60 days | ||||||||
| 0% PP (Type I) | ||||||||
| 10 | 293.48 ± 7.17 aA | 159.89 ± 2.18 aC | 156.84 ± 2.97 aC | 171.39 ± 2.65 aB | +111.44 | +15.19 | +13.00 | +23.48 |
| 15 | 221.60 ± 4.26 bA | 135.34 ± 2.27 bB | 139.30 ± 1.93 bB | 126.26 ± 1.81 bC | +183.01 | +72.85 | +77.91 | +61.25 |
| 20 | 66.83 ± 1.38 cC | 105.32 ± 1.59 cA | 72.63 ± 1.36 cB | 103.75 ± 1.35 cA | +161.05 | +311.41 | +183.71 | +305.27 |
| 0.1% PP (Type II) | ||||||||
| 10 | 156.97 ± 2.49 aA | 132.35 ± 2.68 aB | 131.54 ± 2.00 aB | 136.78 ± 1.98 aB | +29.41 | +9.11 | +8.44 | +12.76 |
| 15 | 138.98 ± 2.43 bA | 89.80 ± 1.32 bD | 101.47 ± 1.37 bB | 95.83 ± 1.54 bC | +130.10 | +48.68 | +68.00 | +58.66 |
| 20 | 87.53 ± 1.69 cB | 77.28 ± 1.42 cB | 76.51 ± 1.31 cA | 88.48 ± 1.60 cA | +162.85 | +132.07 | +129.76 | +165.71 |
| Dose (kGy) | Sol. A (pH = 5.4) | DW (pH = 6.05) | Sol. B (pH = 7.45) | TW (pH = 7.66) | Sol. A (pH = 5.4) | DW (pH = 6.05) | Sol. B (pH = 7.45) | TW (pH = 7.66) |
|---|---|---|---|---|---|---|---|---|
| Seq (%) | Change (%) | |||||||
| 30 Days | ||||||||
| 0% PP (Type I) | ||||||||
| 10 | 30,948 ± 835 aA | 22,652 ± 259 aBC | 22,199 ± 253 aC | 23,751 ± 314 aB | +48.70 | +8.84 | +6.66 | +14.12 |
| 15 | 30,576 ± 538 aA | 18,028 ± 283 bC | 19,569 ± 328 bB | 18,895 ± 396 bBC | +126.51 | +33.55 | +44.97 | +39.97 |
| 20 | 14,106 ± 233 bC | 16,546 ± 264 cB | 13,448 ± 212 cD | 18,774 ± 255 bA | +139.41 | +180.82 | +128.24 | +218.64 |
| 0.1% PP (Type II) | ||||||||
| 10 | 35,071 ± 535 aA | 30,233 ± 289 aB | 30,514 ± 519 aB | 30,923 ± 380 aB | +52.03 | +31.05 | +32.27 | +34.05 |
| 15 | 26,731 ± 671 bA | 19,218 ± 297 bC | 20,823 ± 476 bB | 19,935 ± 317 bBC | +107.36 | +49.08 | +61.53 | +54.64 |
| 20 | 16,034 ± 336 cA | 14,839 ± 210 cB | 13,715 ± 271 cC | 15,061 ± 230 cB | +121.22 | +104.73 | +89.22 | +107.80 |
| 60 days | ||||||||
| 0% PP (Type I) | ||||||||
| 10 | 38,953 ± 814 aA | 23,173 ± 271 aC | 22,794 ± 369 aC | 24,591 ± 325 aB | +87.16 | +11.34 | +9.52 | +18.15 |
| 15 | 31,332 ± 515 bA | 20,551 ± 295 bB | 21,065 ± 249 bB | 19,367 ± 237 cC | +132.11 | +52.24 | +56.05 | +43.47 |
| 20 | 14,142 ± 250 cC | 20,868 ± 269 bA | 15,185 ± 243 cB | 20,602 ± 230 bA | +140.02 | +254.18 | +157.72 | +249.66 |
| 0.1% PP (Type II) | ||||||||
| 10 | 35,956 ± 487 aA | 31,073 ± 538 aB | 30,913 ± 403 aB | 31,963 ± 396 aB | +55.86 | +34.70 | +34.00 | +38.55 |
| 15 | 28,621 ± 429 bA | 19,698 ± 247 bD | 21,869 ± 253 bB | 20,825 ± 287 bC | +122.02 | +52.80 | +69.65 | +61.55 |
| 20 | 16,578 ± 273 cA | 14,902 ± 234 cB | 14,776 ± 216 cB | 16,732 ± 259 cA | +128.73 | +105.60 | +103.86 | +130.85 |
| Dose (kGy) | Sol. A (pH = 5.40) | Distilled Water (pH = 6.05) | Sol. B (pH = 7.45) | Tap Water (pH = 7.66) | ||||||||
|---|---|---|---|---|---|---|---|---|---|---|---|---|
| q | ξ | Seq | q | ξ | Seq | q | ξ | Seq | q | ξ | Seq | |
| 0% PP (type I) | ||||||||||||
| 10 | −31.83 | 30.86 | 25.87 | −3.80 | 2.69 | 2.30 | −4.36 | 3.14 | 2.68 | −5.64 | 4.14 | 3.54 |
| 15 | −4.02 | 2.89 | 2.47 | −19.72 | 16.55 | 13.99 | −11.63 | 9.00 | 7.64 | −4.09 | 2.92 | 2.50 |
| 20 | −0.44 | 0.30 | 0.26 | −32.19 | 31.17 | 26.12 | −18.42 | 15.27 | 12.92 | −14.43 | 11.48 | 9.74 |
| 0.1% PP (type II) | ||||||||||||
| 10 | −4.00 | 2.96 | 2.52 | −4.38 | 3.26 | 2.78 | −2.17 | 1.52 | 1.31 | −5.36 | 4.17 | 3.36 |
| 15 | −10.79 | 8.31 | 7.07 | −4.08 | 2.93 | 2.50 | −7.96 | 5.90 | 5.02 | −7.09 | 5.24 | 4.46 |
| 20 | −5.46 | 3.98 | 3.39 | −0.69 | 0.51 | 0.42 | −11.74 | 9.10 | 7.74 | −16.13 | 13.07 | 11.09 |
| Hydrogel Type | Frequency of ν(CH) Band (cm−1) at Different pH | Δν (cm−1) | |||||||
|---|---|---|---|---|---|---|---|---|---|
| Native | Sol. A | DW | Sol. B | TW | Sol. A | DW | Sol. B | TW | |
| Type I (0% PP) | 2932 | 2937 a | 2941 a | 2933 a | 2935 a | 5 a | 9 a | 1 a | 3 a |
| 2939 b | 2937 b | 2937 b | 2941 b | 7 b | 5 b | 5 b | 9 b | ||
| Type II (0.1% PP) | 2925 | 2940 a | 2936 a | 2938 a | 2938 a | 15 a | 11 a | 13 a | 13 a |
| 2938 b | 2936 b | 2938 b | 2939 b | 13 b | 11 b | 13 b | 14 b | ||
| Dose (kGy) | Cross-Link Density q × 103 (mol/cm3) | Mesh Size ξ (nm) | Swelling at Equilibrium Seq (%) |
|---|---|---|---|
| 0% PP (Type I) | |||
| 10 | 0.840 ± 0.07 | 138.8 ± 7.96 | 20,813 ± 1154 |
| 15 | 1.909 ± 0.09 | 78.3 ± 5.54 | 13,499 ± 388 |
| 20 | 9.958 ± 0.82 | 25.6 ± 1.44 | 5892 ± 374 |
| 0.1% PP (Type II) | |||
| 10 | 1.117 ± 0.11 | 121.3 ± 8.25 | 23,069 ± 1060 |
| 15 | 2.958 ± 0.24 | 60.4 ± 3.24 | 12,891 ± 802 |
| 20 | 6.770 ± 0.86 | 33.3 ± 2.86 | 7248 ± 533 |
| Swelling Media | Relevant Specifications |
|---|---|
| Distilled water | pH: 6.05 |
| Tap water | NH4+ < 0.05 mg/L; Ca2+ = 58.44 mg/L; Mg2+ = 35.44 mg/L; NO2− < 0.033 mg/L; NO3− = 5.02 mg/L; pH = 7.66 |
| Synthetic nutrient solution (Sol. A) | Liquid fertilizer for balcony flowers, produced by AGRO CS, Lucenec, Slovakia, was used according to the manufacturer’s instructions, 7.5 mL diluted in 1000 mL of distilled water. Total nitrogen: 3.6%; NO3− = 1.8%; NH4+ = 1.8%; P2O5 = 2.3%; K2O = 2.7%; pH = 5.40 [37,38,49]. |
| 100% natural organic nutrient solution (Sol. B) | Biopon, natural biohumus for vegetables and greens flowers, produced by Bros Sp. z o.o. sp. k., Poznan, Poland, was used according to the manufacturer’s instructions, 60 mL diluted in 1000 mL of distilled water. Total nitrogen: 0.02%; P2O5 = 0.02%; K2O = 0.05%; organic matter = 40.0%; pH = 7.45 [37,38,49]. |
| Soil Type | Agro-Technical Features |
|---|---|
| Universal soil for flowers, houseplants, planters, greenhouses and seedlings with high organic matter content (Florimax, produced by S.C. Biofit Exim S.R.L., Bucharest, Romania) | organic matter = 29–60%, mineral salts = 0.35–0–75%, mineral nitrogen = 25–50 ppm, potassium (water-soluble) = 52–85 ppm, phosphorus (soluble) = 32–55 ppm, pH neutral |
Disclaimer/Publisher’s Note: The statements, opinions and data contained in all publications are solely those of the individual author(s) and contributor(s) and not of MDPI and/or the editor(s). MDPI and/or the editor(s) disclaim responsibility for any injury to people or property resulting from any ideas, methods, instructions or products referred to in the content. |
© 2025 by the authors. Licensee MDPI, Basel, Switzerland. This article is an open access article distributed under the terms and conditions of the Creative Commons Attribution (CC BY) license (https://creativecommons.org/licenses/by/4.0/).
Share and Cite
Manaila, E.; Calina, I.C.; Dumitru, M.; Craciun, G. Poly(Acrylic Acid)-Sodium Alginate Superabsorbent Hydrogels Synthesized Using Electron-Beam Irradiation—Part III: An Evaluation of Their Degradation in Soil. Molecules 2025, 30, 1126. https://doi.org/10.3390/molecules30051126
Manaila E, Calina IC, Dumitru M, Craciun G. Poly(Acrylic Acid)-Sodium Alginate Superabsorbent Hydrogels Synthesized Using Electron-Beam Irradiation—Part III: An Evaluation of Their Degradation in Soil. Molecules. 2025; 30(5):1126. https://doi.org/10.3390/molecules30051126
Chicago/Turabian StyleManaila, Elena, Ion Cosmin Calina, Marius Dumitru, and Gabriela Craciun. 2025. "Poly(Acrylic Acid)-Sodium Alginate Superabsorbent Hydrogels Synthesized Using Electron-Beam Irradiation—Part III: An Evaluation of Their Degradation in Soil" Molecules 30, no. 5: 1126. https://doi.org/10.3390/molecules30051126
APA StyleManaila, E., Calina, I. C., Dumitru, M., & Craciun, G. (2025). Poly(Acrylic Acid)-Sodium Alginate Superabsorbent Hydrogels Synthesized Using Electron-Beam Irradiation—Part III: An Evaluation of Their Degradation in Soil. Molecules, 30(5), 1126. https://doi.org/10.3390/molecules30051126