Article

Cloud Point Behavior of Poly(trifluoroethyl methacrylate) in Supercritical CO2–Toluene Mixtures

Department of Mechanical and Nuclear Engineering, Virginia Commonwealth University (VCU), Richmond, VA 23284, USA
*
Author to whom correspondence should be addressed.
Molecules 2025, 30(6), 1199; https://doi.org/10.3390/molecules30061199
Submission received: 24 February 2025 / Revised: 4 March 2025 / Accepted: 5 March 2025 / Published: 7 March 2025

Abstract

:
Supercritical CO2 (scCO2) is a versatile solvent for polymer processing; however, many partially fluorinated polymers exhibit limited solubility in neat scCO2. Organic cosolvents such as toluene can enhance polymer–solvent interactions, thereby improving solubility. The cloud point behavior of poly(2,2,2-trifluoroethyl methacrylate) (poly(TFEMA)) at 3 wt% concentration in scCO2–toluene binary mixtures was investigated over a temperature range of 31.5–50 °C and toluene contents of 0–20 wt%. Solvent mixture densities were estimated using the Altuin–Gadetskii–Haar–Gallagher–Kell (AG–HGK) equation of state for CO2 and the Tait equation for toluene. For all compositions, the cloud point pressure was observed to increase linearly with temperature. The cloud point pressure decreased monotonically with increasing toluene concentration and at the highest concentration of 20 wt% was reduced by approximately 40% in comparison to neat scCO2. The addition of toluene lowered the solvent density, but the increase in solvent–solute molecular interactions resulted in the observed decrease in cloud point pressure. Toluene is shown to be an effective cosolvent for dissolving poly(TFEMA) in scCO2, offering a promising approach to lowering operating pressures in fluoropolymer processing. Our results provide valuable phase behavior data for designing scCO2-based extraction, impregnation, and particle formation processes involving poly(TFEMA).

1. Introduction

scCO2 is widely recognized as a versatile and environmentally benign solvent due to its tunable density, gas-like diffusivity, and liquid-like solvating power [1,2,3]. Although CO2 is a greenhouse gas, its use as a solvent in polymer processing is carbon neutral, since no additional carbon dioxide is produced. Consequently, it is considered environmentally “green”. These unique properties have enabled a broad range of applications, including high-purity film deposition [4,5,6,7], nanostructured material synthesis [8,9,10], polymer impregnation [11], supercritical fluid extractions [12,13,14,15], and the exfoliation of layered materials [16,17]. Despite its many advantages, scCO2 often exhibits insufficient solvating capacity for high-molecular-weight or polar polymers, necessitating high operating pressures to improve dissolution [18,19,20].
A widely adopted strategy to mitigate the solvating limitations of scCO2 while preserving most of its advantages is the use of a cosolvent to enhance solvent–solute interactions [12,21,22,23,24,25]. Recent studies have further highlighted how organic cosolvents influence polymer solubility in scCO2 [26,27,28,29], revealing that subtle differences in polymer polarity and molecular structure can significantly impact cloud point phenomena. Among the various available cosolvents, toluene has garnered significant attention due to its ability to enhance polymer solubility while remaining easily separable from the system upon depressurization [30,31,32,33]. Studies have demonstrated that incorporating toluene into scCO2 can substantially improve polymer dissolution by strengthening solute–solvent interactions [30,31,34]. However, most of these investigations focus on the density and phase behavior of scCO2–toluene mixtures or their critical loci, with limited systematic investigation of polymer cloud point behavior [30,35,36,37].
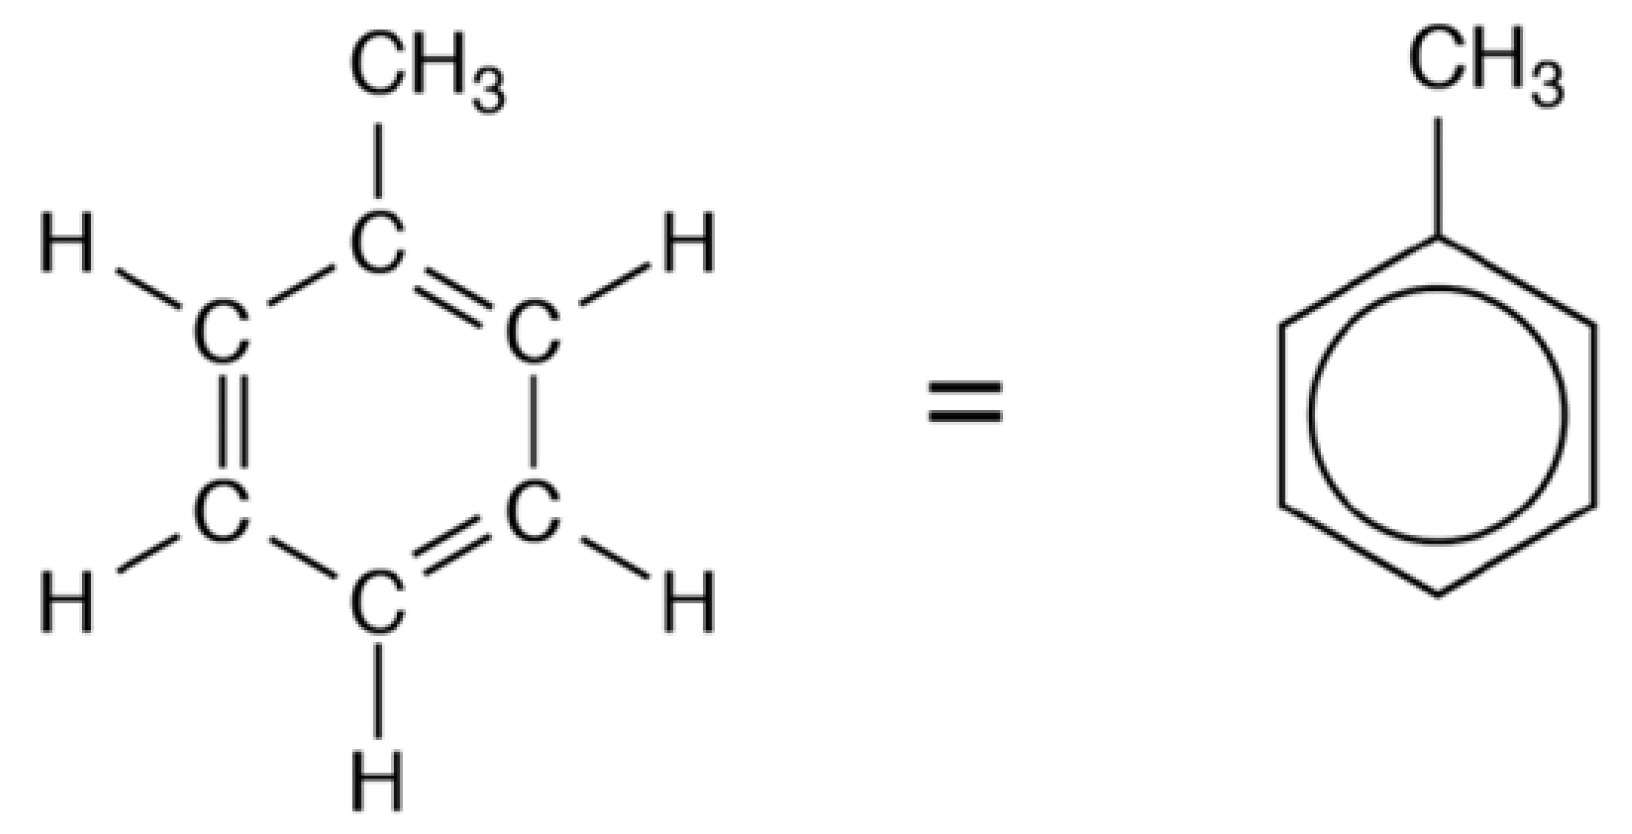
Partially fluorinated polymers, such as poly(TFEMA), are known for their chemical inertness, hydrophobicity, and low surface energy [35,38,39,40]. As illustrated in Figure 1, poly(TFEMA) features a trifluoroethyl moiety in its side chain, which results in excellent moisture resistance and suitability for advanced coatings and membrane applications [38,39]. Although poly(TFEMA) dissolves in neat scCO2 at sufficiently high pressures [35], practical implementations often demand lower operating pressures and narrower temperature windows. Toluene (Figure 2), an aromatic cosolvent whose dispersion parameters closely match certain fluorinated segments, should effectively broaden the processing window by reducing cloud point pressures [31,32,34]. This approach aligns with recent efforts to optimize cosolvent composition for partially fluorinated materials in scCO2, as documented for various fluoropolymers [26,27].
Although partially fluorinated polymers such as poly(TFEMA) offer significant advantages for protective and antifouling coatings, as well as membrane and device applications [35,38], the phase behavior of these materials in scCO2 with aromatic cosolvents remains insufficiently characterized [41]. Kwon et al. [35] examined the high-pressure phase equilibria of CO2 + TFEMA and CO2 + poly(TFEMA); however, the role of toluene in further shifting the polymer’s cloud point has not been systematically investigated, particularly at moderate cosolvent fractions (e.g., up to 20 wt%).
Precise determination of polymer cloud points is essential for designing processes for a wide range of applications. Our group, for instance, utilized scCO2 to anneal and crystallize perovskite thin films for photovoltaic applications, achieving enhanced crystallinity at low temperature [42,43,44,45]. More recently, our group employed scCO2 to incorporate poly(TFEMA) into perovskite films to enhance environmental stability. scCO2-assisted crystallization of perovskite in the presence of a dissolved polymer resulted in polymer incorporation into the film rather than a separate coating [46]. In this context, the dissolution and solubility thresholds of fluoropolymers, such as poly(TFEMA), are critical for informing processing conditions.
This paper experimentally investigates the cloud point behavior of poly(TFEMA) in scCO2–toluene mixtures. Cloud point pressure measurements were systematically conducted over a temperature range of 31.5 °C to 50 °C, with cosolvent concentrations varying from 0 wt% to 20 wt%. Mixture densities were estimated using the AG–HGK equation of state for CO2 [47] and the Tait equation for toluene [48]. The results confirm that toluene serves as an effective cosolvent, significantly lowering cloud point pressures compared to neat scCO2 and thereby expanding the processing window for poly(TFEMA).

2. Results and Discussion

2.1. Cloud Point Pressures as a Function of Temperature

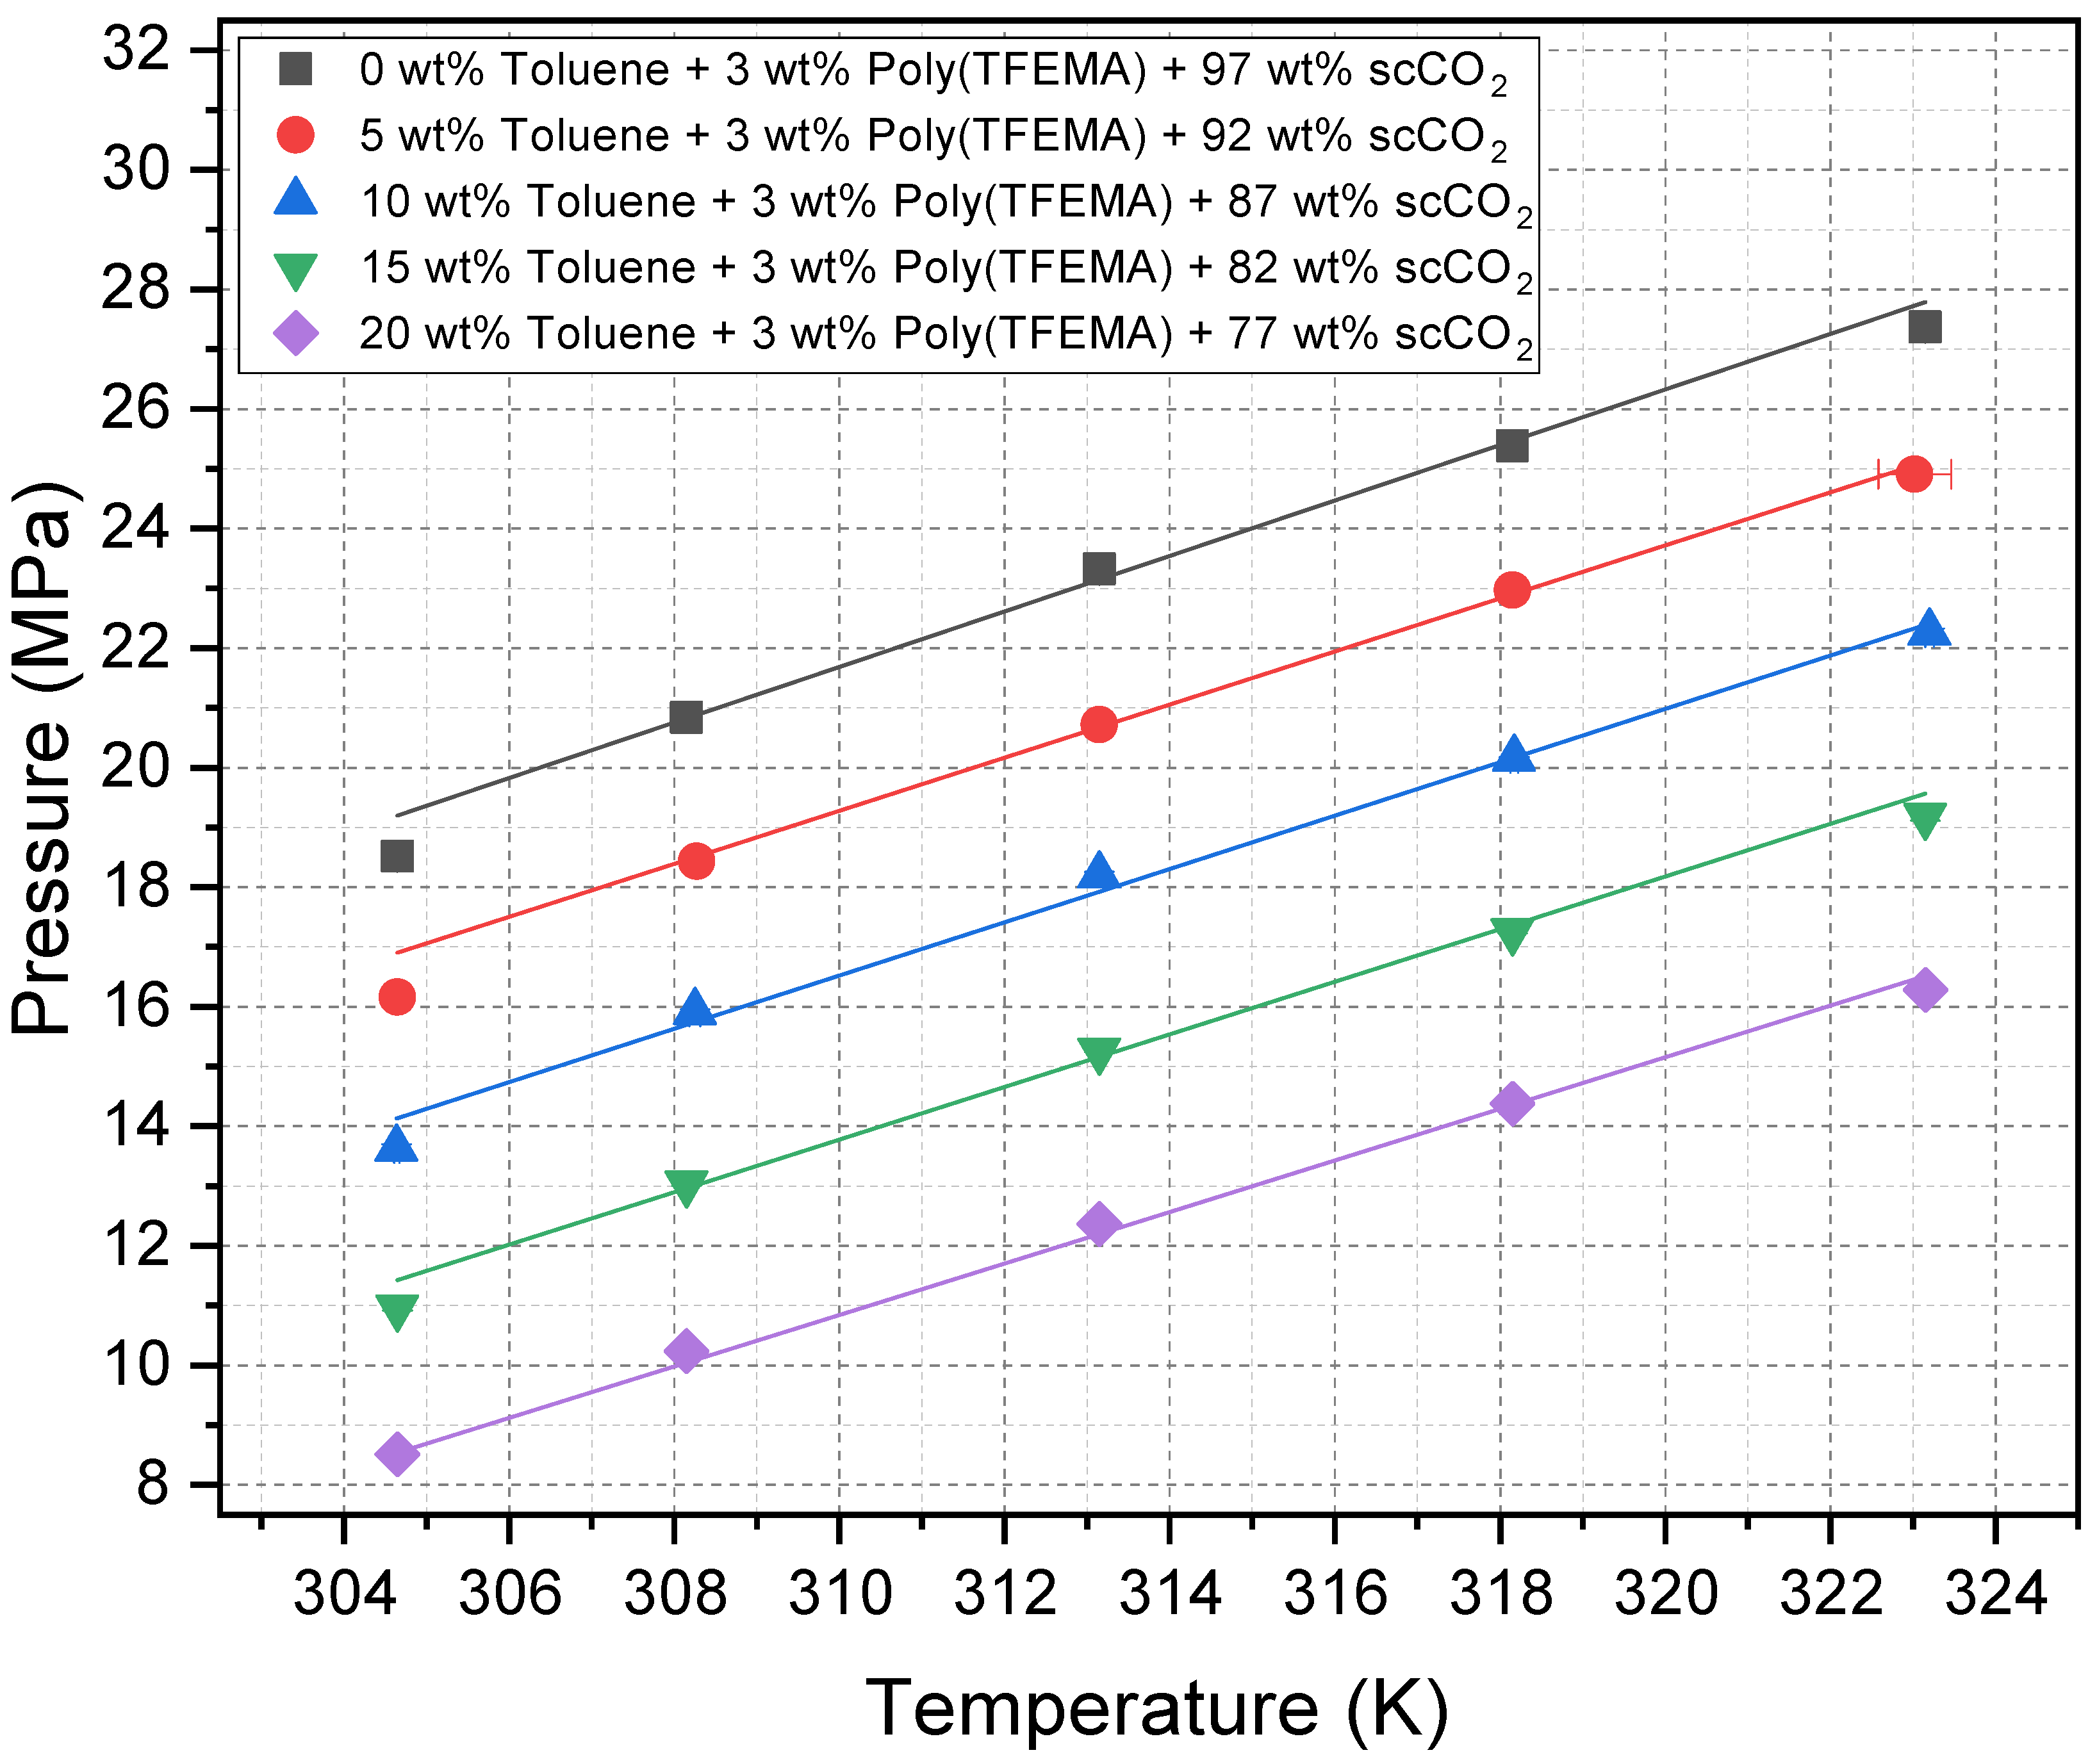
The cloud point pressures for poly(TFEMA) (3 wt%) in CO2–toluene mixtures were measured at temperatures ranging from 31.5 °C to 50 °C (304.65–323.15 K), with toluene concentrations of 0, 5, 10, 15, and 20 wt%. The experimental data are compiled in Table 1.
Figure 3 shows the corresponding cloud point pressure ( P cloud ) trends as a function of temperature for each toluene fraction. For all compositions, P cloud increases linearly with temperature. This well-known behavior reflects the decreasing density of scCO2 (and its mixtures) at higher temperatures. Therefore, in order to maintain poly(TFEMA) solubility, higher pressures are required. At any fixed temperature, P cloud decreases monotonically with increasing toluene concentration. Even at 5 wt%, toluene yields a substantial reduction in cloud point pressure relative to neat scCO2, reflecting the ability of toluene to enhance solvent–solute molecular interactions.
The polydispersity index (PDI) of the poly(TFEMA) used in this study is 2.1, with a number-averaged molecular weight of 31,283. The cloud point data depend on the molecular weight of the polymer, with higher-molecular-weight molecules exhibiting lower solubility. Therefore, the experimental cloud point curves shown in Figure 3 are influenced most strongly by the molecules at the higher end of the molecular weight distribution; these will drop out of solution first as the solvent pressure is reduced. The purpose of this paper is to illustrate the effectiveness of toluene as a cosolvent in reducing cloud point pressures, but it is important to recognize that the results presented here are molecular-weight dependent.

2.2. Effect of Toluene as a Cosolvent on Cloud Point Pressure

To further illustrate the effect of solvent composition, Figure 4 plots P cloud against toluene weight percent at each isothermal condition of 31.5, 35, 40, 45, and 50 °C (304.65, 308.15, 313.15, 318.15, and 323.15 K, respectively). In each isotherm, P cloud decreases nearly linearly with increasing toluene fraction. Although each isotherm is shifted to higher P cloud values at higher temperatures, the overall trends remain consistent. Thus, cosolvent addition reliably compensates for the tendency of supercritical fluids to lose solvent power with increasing temperature. The horizontal error bars in the figure represent the estimated uncertainly in the toluene weight percent and, which is primarily due to the uncertainty in the weight of CO2 added to the view cell for the reasons described in Section 3.3.
Because carbon dioxide and toluene are both categorized as non-polar molecules, it is not immediately obvious why the addition of toluene leads to the observed increase in polymer solubility. Hansen solubility parameters (HSPs) are useful for comparing three types of molecular interactions: dispersion (van der Waals), polarity (dipole interactions), and hydrogen bonding. A comparison of the Hansen solubility parameters (HSPs) for carbon dioxide, toluene, and poly(TFEMA) shows that all three have very low propensity for dipole–dipole interactions and hydrogen bonding. However, toluene and poly(TFEMA) have nearly identical dispersion parameters—18 and 17.5, respectively—while the dispersion parameter for carbon dioxide is much lower at 15.6. For this reason, toluene is expected to have stronger molecular interactions with poly(TFEMA) and act as a more effective solvent.

2.3. Density Trends of scCO2–Toluene Mixtures at Cloud Point Conditions

Figure 5 presents the calculated densities of scCO2–toluene mixtures at various temperatures (304.65–323.15 K) and toluene concentrations (0–20 wt%). At lower concentrations of toluene, the solvent density at the cloud point decreases with increasing temperature, consistent with the expected thermal expansion of the solvents. However, at higher toluene concentrations, the solvent density at the cloud point exhibits more complex behavior, first increasing with temperature before leveling off and then decreasing at higher temperatures. This rather surprising non-monotonic behavior is likely due to the temperature dependence of the van der Waals interaction between toluene and poly(TFEMA). At lower temperatures, the van der Waals interaction is strongest, leading to polymer solubility at lower solvent density. However, as the temperature increases, the van der Waals interaction decreases, requiring a higher solvent density at the cloud point.
Another way of interpreting the data of Figure 5 is to observe the change in cloud point density at a fixed temperature. At the lowest temperature, there is a much larger change in cloud point density with increasing toluene concentration due to the stronger toluene–poly(TFEMA) van der Waals interactions. As the temperature is increased, the toluene impact on cloud point density decreases and the curves begin to converge. At any given temperature, the presence of toluene reduces the overall density needed for the poly(TFEMA) cloud point compared to neat scCO2.
Although density typically correlates with solvating power, the higher dispersion parameter of toluene compensates for the lower density. Hence, cloud point pressures are reduced (indicating better solvation) despite the mixture’s lower density. This underscores the complexity of polymer solubility in supercritical fluids, where both density and solvent polarity must be considered.
The observed reduction in cloud point pressure with increasing toluene concentration highlights the effectiveness of cosolvent addition in enhancing poly(TFEMA) solubility in scCO2–toluene mixtures. To ensure reproducibility and provide a rigorous basis for these findings, we now present the experimental methods, measurement protocols, and computational approaches used to obtain and analyze the reported data.

3. Materials and Methods

3.1. Materials

  • Carbon Dioxide (CO2): High-purity ( 99.9995 % ) CO2 was purchased from Airgas (Philadelphia, PA, USA).
  • Poly(Trifluoroethyl Methacrylate) [Poly(TFEMA)]: The fluorinated polymer was obtained from Specific Polymers (Castries, France). The polymer was used as received without further purification. This polymer exhibits a molecular weight (Mn) of 31,283 g/mol, a weight-average molecular weight (Mw) of 65,501 g/mol, and a polydispersity index (PDI) of 2.1, as specified by the supplier.
  • Toluene: Toluene ( 99.8 % purity) was purchased from Sigma Aldrich (St. Louis, MO, USA).
All chemicals were handled and stored according to manufacturer guidelines.

3.2. Experimental Setup

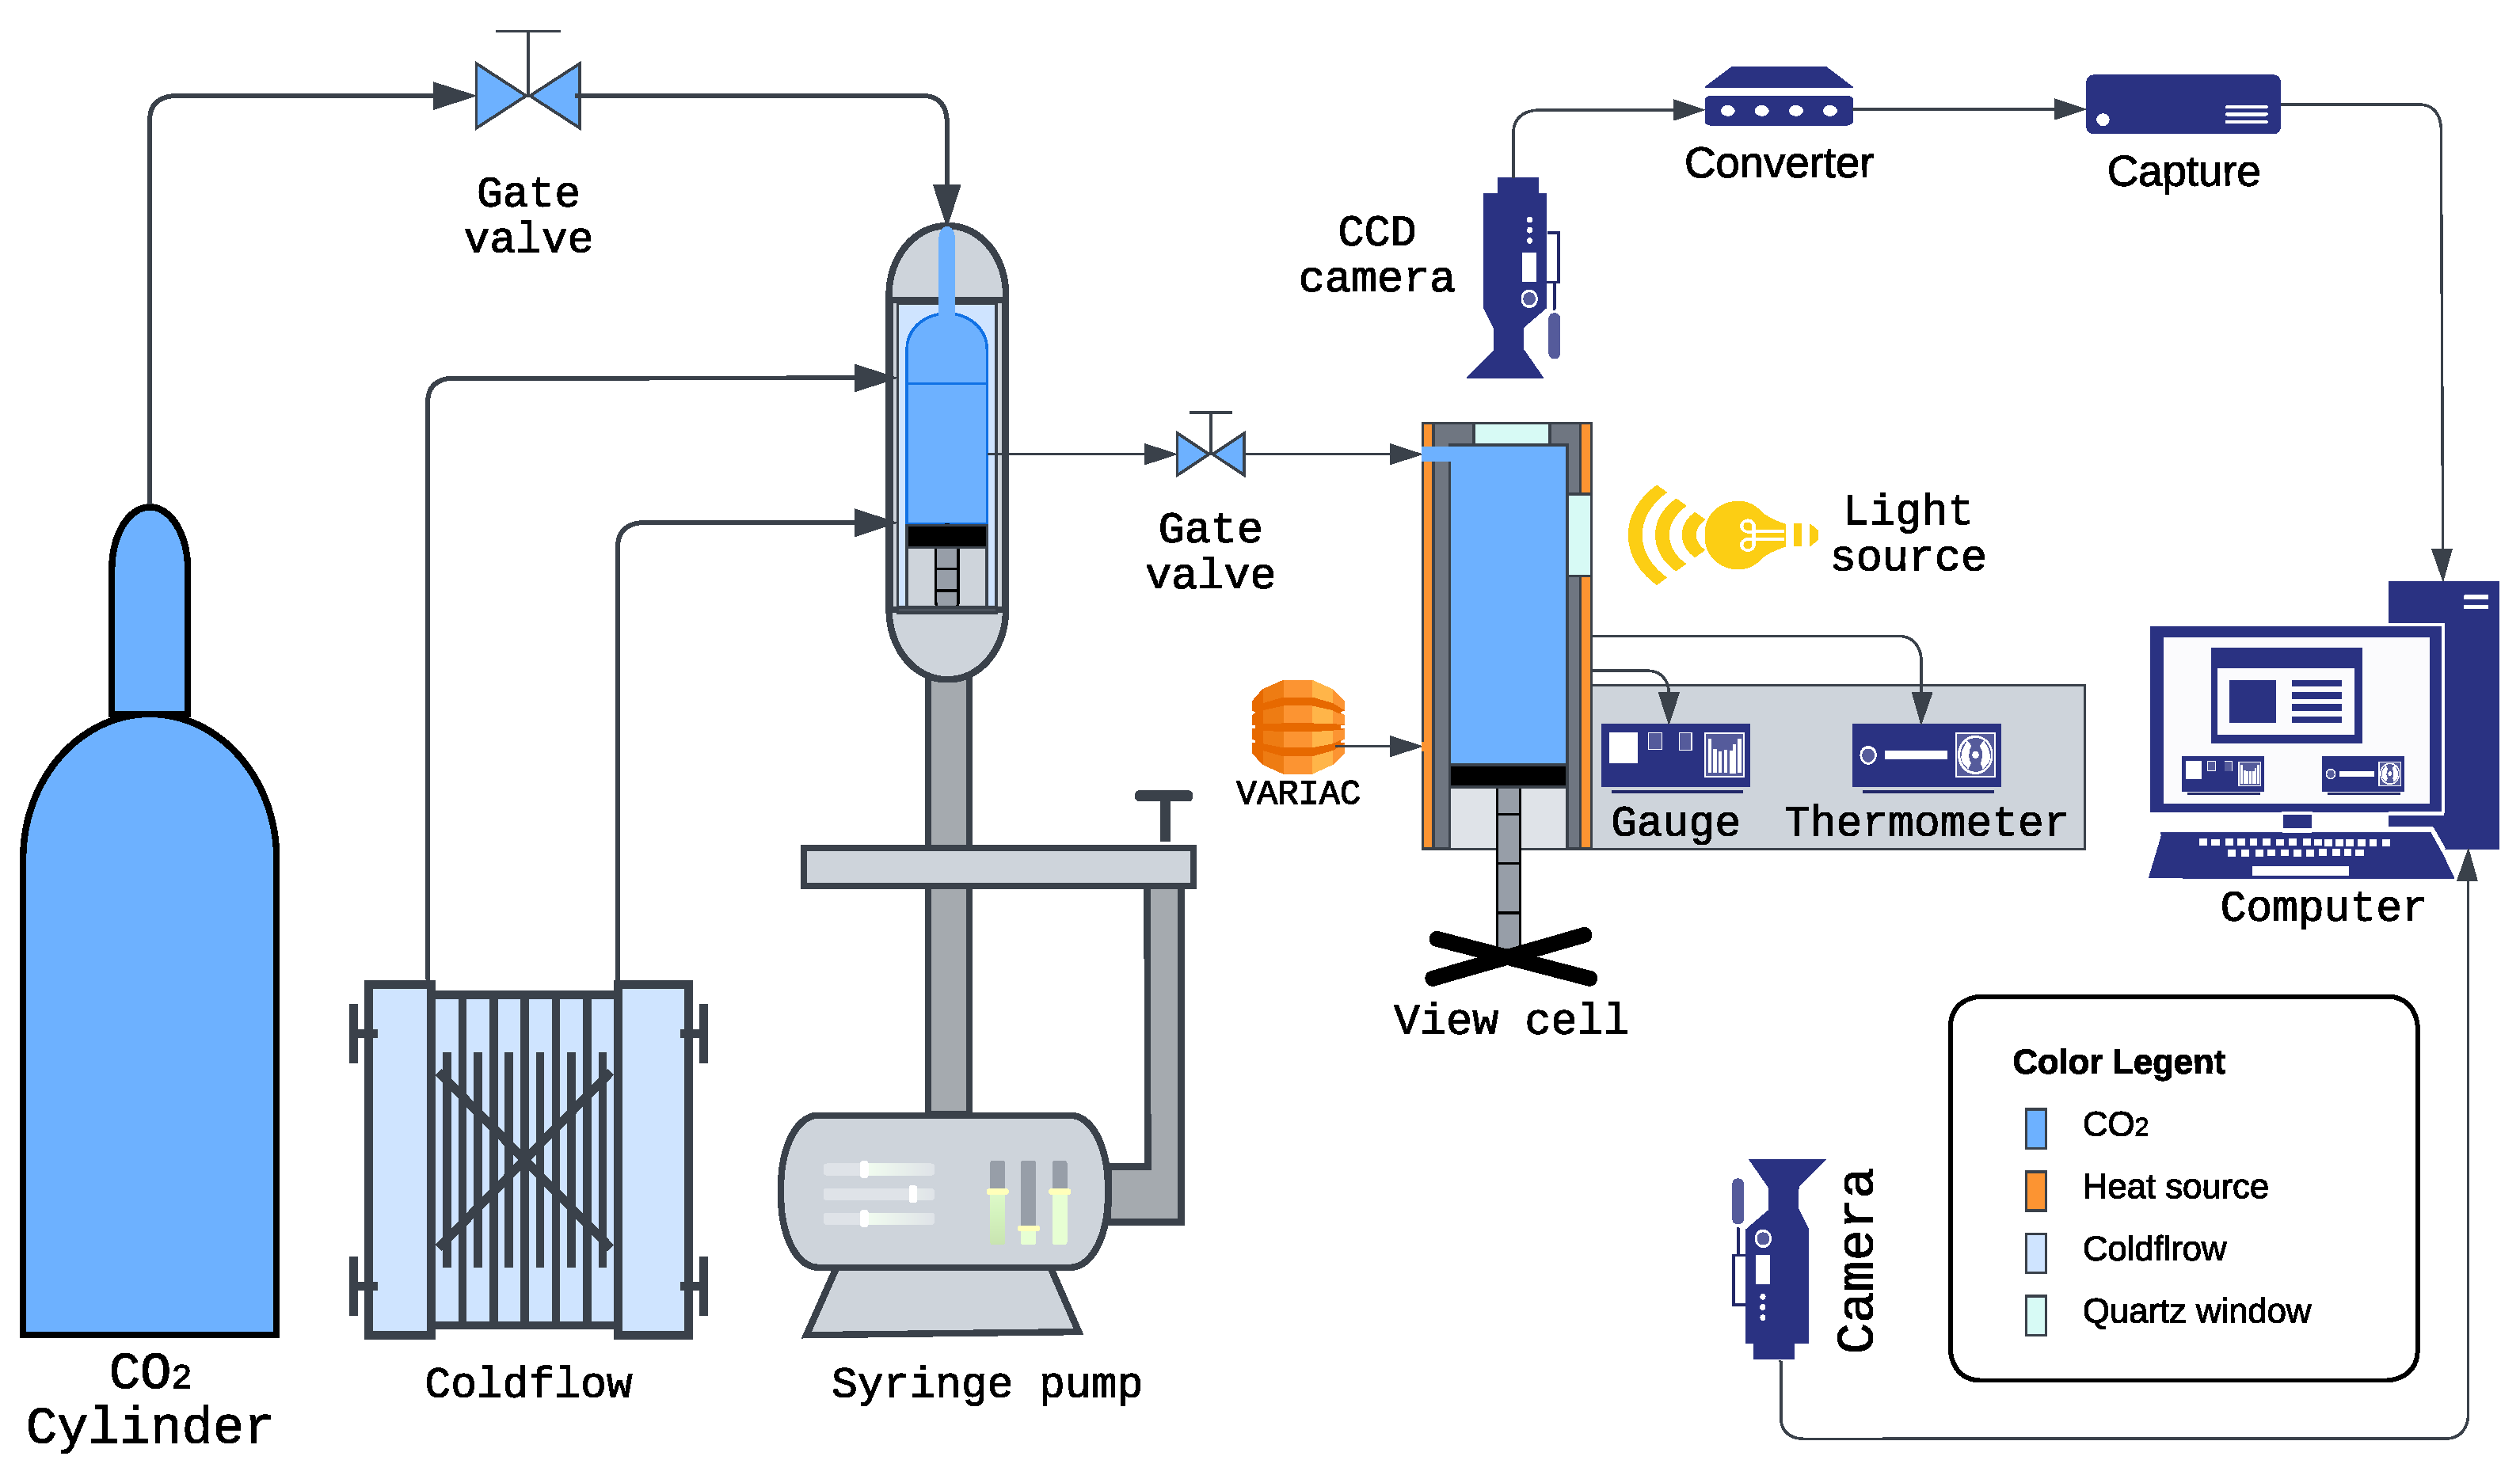
Figure 6 is a schematic diagram illustrating the various components of the experimental apparatus used to obtain information on the phase behavior of poly(TFEMA) in a supercritical fluid solvent. The main component of the system is a variable-volume view cell with temperature and pressure control. The following sections provide a detailed description of each component and its role within the integrated system.

3.2.1. Carbon Dioxide Delivery and Pressurization

High-purity CO2 was supplied from a carbon dioxide cylinder, which served as the primary source of pressurized fluid for the system. This cylinder was connected via high-pressure stainless steel tubing to a Teledyne Isco 260D syringe pump (Teledyne Isco, Lincoln, NE, USA). The syringe pump was used to pressurize the variable-volume view cell with CO2 to the desired operating levels. To maximize CO2 loading efficiency within the pump, a NESLAB CFT-25 refrigerated recirculator (Neslab Instruments, Inc., Portsmouth, NH, USA) was employed to reduce the reservoir temperature and increase the CO2 density, allowing larger quantities of CO2 to be stored in the syringe pump with fewer reload cycles. This arrangement provided a stable and continuous supply of pressurized CO2 for the subsequent experimental stages.

3.2.2. Phase Monitor (Variable-Volume View Cell)

Pressurized CO2 from the syringe pump was directed into the SFT Phase Monitor (Supercritical Fluid Technologies, Inc., Newark, DE, USA); a high-pressure view cell with a 30 mL maximum internal volume, sealed using an isolation valve. This variable-volume cell was used to control the pressure by adjusting its internal piston position, which advances at a rate of 14 turns per inch, displacing 0.36 mL per turn.
Temperature regulation was achieved through a proportional–integral–derivative (PID) controller attached to a resistance temperature detector (RTD), providing a temperature sensing accuracy of ±0.5% °C and ensuring stable experimental conditions. The quartz windows, measuring 1/2 inch thick and 7/8 inch in diameter, allow safe operation up to 10,000 psi and 300 °C, enabling reliable high-pressure and high-temperature phase behavior studies.
The Phase Monitor enabled direct visual observation of the polymer solution, making it possible to identify cloud point conditions by detecting the onset of turbidity, indicative of a transition from a single-phase to a multi-phase system.

3.2.3. Temperature Control

The Phase Monitor’s temperature was regulated using a combination of a heavy-insulated industrial heating tape (Model AWD-051-060) from HTS/Amptek (Stafford, TX, USA, 120V, 312W) and a Powerstat 3PN117C variable autotransformer (Warner Electric, South Beloit, IL, USA, 120V, 12A) (Variac). The heating tape was wrapped around the cylindrical section of the cell, while the Variac controlled the power supplied to the tape, enabling precise adjustment of the cell temperature between 31.2 °C and 50 °C. The temperature was continuously monitored using a thermocouple, ensuring that the experimental conditions remained within the specified range. This dual heating control mechanism provided thermal stability, crucial for reproducible measurements.

3.2.4. Pressure Measurement

Real-time pressure monitoring was achieved using an OMEGA PX309-10KGI high-performance pressure transducer (Omega Engineering Inc., Norwalk, CT, USA), rated for the experimental pressure range. The transducer output was displayed on an OMEGA DP400TP high-speed panel meter (Omega Engineering Inc., Norwalk, CT, USA), offering a system accuracy of ± 0.25 % of full scale, considering the transducer’s combined linearity, hysteresis, and repeatability. This setup enabled accurate measurement and real-time visualization of internal pressure conditions within the Phase Monitor, ensuring precise control of the experiment.

3.2.5. Optical Imaging and Video Recording

The cloud point was identified by observing visual changes in the solution’s turbidity. For this purpose, two cameras were utilized:
  • Vanxse CCTV Mini HD 1/3 CCD 960H Auto Iris Camera (Model BX2812, Shenzhen Kaixing Security Technology Co., Ltd., Shenzhen, China, NTSC): This camera was positioned to capture the optical appearance of the solution through the quartz window of the Phase Monitor. Changes in clarity, such as the onset of turbidity, indicated the cloud point.
  • Angetube 1080P Webcam (Model XZC827, Angetube, Shenzhen, China, USB): This camera recorded the digital displays of the DP400TP panel meter (showing real-time pressure in psi) and the thermometer (showing temperature in °C).
Both camera feeds were synchronized using OBS Studio 30.0.2 (OBS Project, Online Open-Source Community), which combined them into a single video file. This allowed simultaneous recording of the cloud point event and its corresponding temperature and pressure data, which provided a comprehensive record for analysis.

3.2.6. Data Acquisition and Analysis

The computer served as the central hub for data acquisition, where the synchronized video output from both cameras was stored. The OBS Studio software enabled real-time visualization and recording of the three critical elements:
  • The visual appearance of the polymer solution within the Phase Monitor.
  • The pressure reading displayed on the DP400TP panel meter.
  • The temperature reading from the system thermometer.
This unified recording approach ensured that the experimentalist could observe and analyze all relevant parameters simultaneously, simplifying the post-experiment analysis and interpretation of the results.

3.2.7. Overall System Integration

Figure 6 illustrates the interconnected components of the experimental setup. CO2 was delivered from the cylinder to the chilled syringe pump and then transferred to the Phase Monitor. The temperature of the Phase Monitor was regulated by the heating system, while pressure measurements were taken using the OMEGA transducer and panel meter. Visual observations were captured by the CCD camera, and operational data (pressure and temperature) were recorded by the webcam. This integrated system ensured high-precision cloud point measurements, facilitating detailed analysis of the fluoropolymer phase behavior in supercritical solvents.

3.3. Experimental Procedure

The experiments were carried out at a fixed polymer concentration of 3 wt% and varying toluene cosolvent concentrations (0 wt%, 5 wt%, 10 wt%, 15 wt%, and 20 wt%). The cloud point was determined over a temperature range from 31.5 °C (304.65 K) to 50 °C (323.15 K). Particular care was taken to ensure consistent initial conditions inside the view cell of the Phase Monitor and to accurately determine the mass of scCO2. The resulting data enabled a systematic investigation of the effect of toluene as a cosolvent on the solubility and phase behavior of poly(TFEMA) in scCO2.

3.3.1. Reference State and CO2 Loading

All experiments started from a reference state of 31.2 °C (304.35 K) and 1100 psi (7.58 MPa) in a nominal 30 mL Phase Monitor cell. Under these conditions, the density of CO2 was calculated to be approximately 623.24 kg·m−3 (as determined from an equation-of-state calculator), giving a mass of about 18.723 g of CO2 [47]. We adopted this mass (18.723 g) as the basis for calculating the solvent composition (scCO2 plus toluene) and the polymer mass necessary to achieve (3 wt%).
To independently estimate the CO2 loading experimentally, we employed a Parr Instrument Company pressure vessel (Model 4768, Parr Instrument Company, Moline, IL, USA). First, the vessel was charged with CO2 and weighed using an American Weigh Scales KGX-10 high-capacity precision scale (American Weigh Scales, Inc., Cumming, GA, USA). Then, a portion of the CO2 was transferred into an intermediary pipe, weighed again, and finally introduced into the Phase Monitor cell. By recording the mass loss from the Parr vessel after transferring CO2 to the Phase Monitor and ensuring that the Phase Monitor cell reached the set reference conditions (31.2 °C, 1100 psi, 30 mL volume), we obtained a total scCO2 mass of 19.8 g. This value is 1.08 g higher than the value obtained from the equation-of-state density calculation and was used to inform our uncertainty analysis and error bars.

3.3.2. Compositions and Preparation

Five cosolvent formulations were studied, each containing approximately 3 wt% poly(TFEMA) and 0–20 wt% toluene. The composition balance was scCO2. The five weight percentages studied were as follows:
(1)
0 wt% toluene + 3 wt% Poly(TFEMA) + 97 wt% CO2
(2)
5 wt% toluene + 3 wt% Poly(TFEMA) + 92 wt% CO2
(3)
10 wt% toluene + 3 wt% Poly(TFEMA) + 87 wt% CO2
(4)
15 wt% toluene + 3 wt% Poly(TFEMA) + 82 wt% CO2
(5)
20 wt% toluene + 3 wt% Poly(TFEMA) + 77 wt% CO2
While the mass of the polymer and toluene cosolvent were accurately determined by weighing each before deposition into the view cell, the mass of the scCO2 could only be estimated from the delivery pressure and temperature. For these experiments, we assumed that the mass of scCO2 remained constant at 18.723 g (based on the calculated density at 31.2 °C and 1100 psi and a cell volume of 30 mL). That is, we assumed that the presence of the polymer and cosolvent in the bottom of the view-cell chamber had a small influence on the scCO2 mass transferred at the reference pressure and temperature. At 1100 psi, the cosolvent and polymer are not completely dissolved in the scCO2 and should, therefore, not contribute significantly to the view-cell total pressure. However, they do occupy a small fraction of the view cell’s internal volume, which was difficult to estimate in the presence of scCO2 due to partial dissolution. We also attempted to determine the mass of scCO2 transferred into the view cell by weighing an intermediary transfer vessel before and after pressurization, but the low pressure differential and longer time required to stabilize the temperature resulted in cosolvent and polymer backflow into the transfer vessel. For this reason, we assumed a fixed mass of scCO2 and estimated the error to be within 5%. From the fixed mass of scCO2, the required masses of polymer and toluene were calculated to preserve a 3 wt% polymer fraction and the desired wt% of toluene. The specific compositions used in the experiments were as follows:
  • 0 wt% Toluene: 0.579 g of poly(TFEMA) + 18.723 g of scCO2.
  • 5 wt% Toluene: 1.01753 g (1.18 mL) of toluene + 0.61052 g of poly(TFEMA) + 18.723 g of scCO2.
  • 10 wt% Toluene: 2.15202 g (2.4957 mL) of toluene + 0.64561 g of poly(TFEMA) + 18.723 g of scCO2.
  • 15 wt% Toluene: 3.42486 g (3.9718 mL) of toluene + 0.68497 g of poly(TFEMA) + 18.723 g of scCO2.
  • 20 wt% Toluene: 4.86301 g (5.6396 mL) of toluene + 0.72945 g of poly(TFEMA) + 18.723 g of scCO2.
All experiments began by placing the appropriate amount of poly(TFEMA) and (when required) toluene into the Phase Monitor cell:
(a)
No toluene (0 wt%): A mass of 0.579 g of poly(TFEMA) alone was weighed on a Fisher Scientific (Waltham, MA, USA) Accu-124 analytical balance, then introduced into the cell.
(b)
Toluene-containing mixtures (5–20 wt%): The predetermined mass of poly(TFEMA) was first weighed and added to the cell. Afterward, the measured toluene (e.g., 1.18 mL for 5 wt%) was carefully pipetted into the cell.
(c)
Sealing and purging: After loading the cell with polymer and toluene (when applicable), the cell was sealed. CO2 was introduced gradually (at a flow rate of 10 mL/min) until the internal pressure reached roughly 600–700 psi (4.14–4.83 MPa). A brief purge was performed through the outlet valve to remove air; this was performed carefully so as to avoid loss of toluene or polymer. The outlet valve was then closed.
(d)
Pressurizing to reference state: The cell was wrapped with flexible heating tape and maintained at 31.2 °C using a Variac. The syringe pump was then used to increase the cell pressure to 1100 psi at a controlled flow (10–20 mL/min). Once the reference state (31.2 °C, 1100 psi) was stable, the inlet valve was closed to isolate the system.

3.3.3. Cloud Point Determination

Cloud points were measured by adjusting the view-cell volume and cell pressure while visually monitoring the solution turbidity along isotherms at 31.5, 35, 40, 45, and 50 °C.
Figure 7 shows the visual sequence for the polymer + scCO2 + toluene system observed through the cell’s quartz window. For each temperature and composition, the following procedure was used:
(1)
Single-phase formation: The internal volume of the cell was decreased (i.e., the piston moved inward) to increase pressure until the mixture appeared optically transparent in the cell’s quartz window. This corresponded to a single-phase region, as illustrated in Figure 7A.
(2)
Expansion to turbidity (cloud point): Next, the piston was slowly retracted, reducing the pressure at a controlled rate, until the first discernible turbidity was observed in the window (onset of clouding). This pressure was noted as P cloud . The visual appearance at this point is illustrated in Figure 7B, where the polymer-rich phase begins to form but the solution is only partially cloudy.
(3)
Further expansion: If the volume was expanded further, the system entered a fully two-phase region, exhibiting a milky or opaque appearance, as shown in Figure 7C. At this stage, the polymer is largely precipitated from the fluid phase.
(4)
Repetitions: Each temperature–composition combination was measured at least six times to ensure reproducibility. The mean P cloud value is reported, with typical standard deviations around ± 1 % .
The methodology described above was carried out uniformly for all five toluene compositions (0–20 wt%), ensuring that changes in polymer solubility could be attributed solely to the variation in the percentage of cosolvent weight.

3.4. Density Calculations

The density of the binary solvent (scCO2 + toluene) was calculated over the range of temperatures and pressures used in the cloud point study to better understand the influence of solvent chemical composition versus solvent density on the observed change in polymer solubility.

3.4.1. CO2 Density: AG–HGK Equation of State

CO2 densities were evaluated using the Altuin–Gadetskii (AG) far-field equation, combined with the Haar–Gallagher–Kell (HGK) approach near the critical region, collectively referred to here as the AG–HGK equation of state [47]. This hybrid equation of state (EoS) is particularly suited for describing CO2 in or near the critical region, where non-ideal behavior is pronounced. By capturing both far-field (AG) and near-critical (HGK) corrections, the AG–HGK model yields reliable density estimates over the relevant range of temperatures (31.5–50 °C) and pressures (8–30 MPa) of our study.

3.4.2. Toluene Density: Tait Equation

Toluene densities were computed via the Tait equation, which provides a flexible semi-empirical description of liquid compressibility across a wide range of temperatures and pressures [48,49]. The general form is
ρ ( P , T ) = ρ 0 ( T ) 1 C log 10 P + B ( T ) P 0 + B ( T ) ,
where P 0 = 0.1 MPa, C = 0.2219 , and B ( T ) is a temperature-dependent term encapsulating the compressibility of toluene. The reference density ρ 0 ( T ) and B ( T ) are both expressed as quadratic polynomials in T:
ρ 0 ( T ) = i = 0 2 a i T i = a 0 + a 1 T + a 2 T 2 .
B ( T ) = i = 0 2 b i T i = b 0 + b 1 T + b 2 T 2 .
The coefficients a i and b i are listed in Table 2 [48].
In expanded form, the density of toluene at any ( P , T ) can thus be written as
ρ Tol ( P , T ) = i = 0 2 a i T i 1 C log 10 P + i = 0 2 b i T i P 0 + i = 0 2 b i T i .
The above formulation reproduces our density data for toluene across the range of conditions relevant to the cloud point measurements [48].

3.4.3. Mixture Density: Mass-Weighted Mixing Law

After computing individual densities for CO2 and toluene at the required PT conditions, we estimate the density of the binary solvent (scCO2 + toluene) using the following mass-weighted mixing rule:
ρ mix = i x i · ρ i = x C O 2 · ρ C O 2 + x T o l · ρ T o l ,
where x C O 2 and x T o l are the respective mass fractions of CO2 and toluene, while ρ CO 2 and ρ Tol are the densities predicted by the AG–HGK EoS and the Tait equation, respectively. This mixing law, although approximate, provides a reasonable first-order estimate of the overall solvent density in our system.

4. Conclusions

In this study, we investigated the cloud point behavior of a 3 wt% solution of poly(TFEMA) (PDI = 2.1) in scCO2–toluene mixtures over 31.5–50 °C, with toluene concentrations ranging from 0 to 20 wt%. Given the broad molecular weight distribution, higher-molecular-weight fractions likely governed the observed cloud point transitions as they precipitated first.
Key findings include the following:
  • Cloud point trends: Cloud point pressures rise linearly with temperature, but fall with increasing toluene fraction, demonstrating how cosolvent addition effectively reduces the pressure required for polymer dissolution.
  • Density: Toluene lowers the overall mixture density but boosts solvent–solute interactions, primarily due to the similarity in dispersion parameters between toluene and poly(TFEMA), leading to enhanced solvating capability for fluoropolymers such as poly(TFEMA).
  • Process implications: At the highest cosolvent fraction of 20 wt%, we observed up to an approximately 40% reduction in cloud point pressure compared to neat scCO2, demonstrating a significant expansion of the processing window. These insights form a basis for designing supercritical fluid processes with lower pressure requirements, translating to potential energy savings and broader industrial applicability.
In conclusion, careful selection of the toluene content in scCO2 enables fine control of polymer solubility, striking a balance between density and molecular interaction effects. The methodologies described—AG–HGK for CO2, Tait equation for toluene, and a mass-weighted mixing rule—provide a comprehensive and practical framework for predicting mixture densities, thereby facilitating deeper understanding of the cloud point phenomena observed in supercritical fluid operations.

Author Contributions

Conceptualization, J.R.Z. and G.C.T.; methodology, J.R.Z. and G.C.T.; investigation, J.R.Z.; formal analysis, J.R.Z. and G.C.T.; writing—original draft preparation, J.R.Z.; writing—review and editing, J.R.Z. and G.C.T.; supervision, G.C.T. All authors have read and agreed to the published version of the manuscript.

Funding

This research received no external funding.

Institutional Review Board Statement

Not applicable.

Informed Consent Statement

Not applicable.

Data Availability Statement

Data supporting the findings of this study are available from the corresponding author upon reasonable request.

Conflicts of Interest

The authors declare no conflicts of interest.

Abbreviations

AGAltuin–Gadetskii
AG–HGKAltuin–Gadetskii–Haar–Gallagher–Kell
CO2Carbon dioxide
HSPsHansen solubility parameters
HGKHaar–Gallagher–Kell
PDIPolydispersity index
scCO2Supercritical carbon dioxide
TFEMA    Trifluoroethyl methacrylate
TolToluene
wt%Weight percent
KKelvin
kg·m−3Kilograms per cubic meter (density unit)
MPaMegapascal
psiPounds per square inch
TTemperature
B(T)Tait equation parameter dependent on temperature
CCompressibility parameter in Tait equation
P0Reference pressure (0.1 MPa)
PcloudCloud point pressure
ρ Density
ρ 0 ( T ) Reference density at temperature T
CCDCharge-coupled device
HDHigh definition
PIDProportional–integral–derivative (controller)
RTDResistance temperature detector
EoSEquation of state
OBSOpen Broadcaster Software

References

  1. Zhang, X.; Heinonen, S.; Levänen, E. Applications of supercritical carbon dioxide in materials processing and synthesis. RSC Adv. 2014, 4, 61137–61152. [Google Scholar] [CrossRef]
  2. Leitner, W. Designed to dissolve. Nature 2000, 405, 129–130. [Google Scholar] [CrossRef] [PubMed]
  3. Tutek, K.; Masek, A.; Kosmalska, A.; Cichosz, S. Application of Fluids in Supercritical Conditions in the Polymer Industry. Polymers 2021, 13, 729. [Google Scholar] [CrossRef] [PubMed]
  4. Blackburn, J.M.; Long, D.P.; Cabañas, A.; Watkins, J.J. Deposition of Conformal Copper and Nickel Films from Supercritical Carbon Dioxide. Science 2001, 294, 141–145. [Google Scholar] [CrossRef]
  5. Cabañas, A.; Long, D.P.; Watkins, J.J. Deposition of Gold Films and Nanostructures from Supercritical Carbon Dioxide. Chem. Mater. 2004, 16, 2028–2033. [Google Scholar] [CrossRef]
  6. Sajfrtová, M.; Cerhová, M.; Jandová, V.; Dřínek, V.; Daniš, S.; Matějová, L. The effect of type and concentration of modifier in supercritical carbon dioxide on crystallization of nanocrystalline titania thin films. J. Supercrit. Fluids 2018, 133, 211–217. [Google Scholar] [CrossRef]
  7. Wei, M.; Wang, K.; Yanagida, M.; Sugihara, H.; Morris, M.A.; Holmes, J.D.; Zhou, H. Supercritical fluid processing of mesoporous crystalline TiO2 thin films for highly efficient dye-sensitized solar cells. J. Mater. Chem. 2007, 17, 3888–3893. [Google Scholar] [CrossRef]
  8. Sanli, D.; Bozbag, S.E.; Erkey, C. Synthesis of nanostructured materials using supercritical CO2: Part I. Physical transformations. J. Mater. Sci. 2012, 47, 2995–3025. [Google Scholar] [CrossRef]
  9. Kaleva, A.; Heinonen, S.; Nikkanen, J.P.; Levänen, E. Synthesis and Crystallization of Titanium Dioxide in Supercritical Carbon Dioxide (scCO2). IOP Conf. Ser. Mater. Sci. Eng. 2017, 175, 012034. [Google Scholar] [CrossRef]
  10. Wei, T.Y.; Chen, C.H.; Chien, H.C.; Lu, S.Y.; Hu, C.C. A Cost-Effective Supercapacitor Material of Ultrahigh Specific Capacitances: Spinel Nickel Cobaltite Aerogels from an Epoxide-Driven Sol-Gel Process. Adv. Mater. 2010, 22, 347–351. [Google Scholar] [CrossRef]
  11. Naguib, H.E.; Park, C.B.; Song, S.W. Effect of Supercritical Gas on Crystallization of Linear and Branched Polypropylene Resins with Foaming Additives. Ind. Eng. Chem. Res. 2005, 44, 6685–6691. [Google Scholar] [CrossRef]
  12. Joshi, D.; Prausnitz, J. Supercritical Fluid Extraction with Mixed Solvents; Technical Report LBL-17154; Lawrence Berkeley National Laboratory, University of California: Berkeley, CA, USA, 1983. [Google Scholar]
  13. Khanyile, A.; Andrew, J.; Paul, V.; Sithole, B. A comparative study of supercritical fluid extraction and accelerated solvent extraction of lipophilic compounds from lignocellulosic biomass. Sustain. Chem. Pharm. 2022, 26, 100608. [Google Scholar] [CrossRef]
  14. Marco, I.D.; Riemma, S.; Iannone, R. Supercritical Carbon Dioxide Decaffeination Process: A Life Cycle Assessment Study. Chem. Eng. Trans. 2017, 57, 1699–1704. [Google Scholar] [CrossRef]
  15. do Espirito Santo, A.T.; Siqueira, L.M.; Almeida, R.N.; Vargas, R.M.F.; do N Franceschini, G.; Kunde, M.A.; Cappellari, A.R.; Morrone, F.B.; Cassel, E. Decaffeination of yerba mate by supercritical fluid extraction: Improvement, mathematical modelling and infusion analysis. J. Supercrit. Fluids 2021, 168, 105096. [Google Scholar] [CrossRef]
  16. Pu, N.W.; Wang, C.A.; Sung, Y.; Liu, Y.M.; Ger, M.D. Production of few-layer graphene by supercritical CO2 exfoliation of graphite. Mater. Lett. 2009, 63, 1987–1989. [Google Scholar] [CrossRef]
  17. Wang, Y.; Zhou, C.; Wang, W.; Zhao, Y. Preparation of Two Dimensional Atomic Crystals-BN, WS2 and MoS2 by Supercritical CO2 Assisted with Ultrasonic. Ind. Eng. Chem. Res. 2013, 52, 4379–4382. [Google Scholar] [CrossRef]
  18. Rindfleisch, F.; DiNoia, T.P.; McHugh, M.A. Solubility of Polymers and Copolymers in Supercritical CO2. J. Phys. Chem. 1996, 100, 15581–15587. [Google Scholar] [CrossRef]
  19. von Schnitzler, J.; Eggers, R. Mass transfer in polymers in a supercritical CO2-atmosphere. J. Supercrit. Fluids 1999, 16, 81–92. [Google Scholar] [CrossRef]
  20. Ting, Y.S.; Hsieh, C.M. Prediction of solid solute solubility in supercritical carbon dioxide with organic cosolvents from the PR + COSMOSAC equation of state. Fluid Phase Equilibria 2016, 431, 48–57. [Google Scholar] [CrossRef]
  21. Ekart, M.P.; Bennett, K.L.; Ekart, S.M.; Gurdrial, G.S.; Liotta, C.L.; Eckert, C.A. Cosolvent Interactions in Supercritical Fluid Solutions. AIChE J. 1993, 39, 235–248. [Google Scholar] [CrossRef]
  22. Tomasko, D.L.; Knutson, B.L.; Pouillot, F.; Liotta, C.L.; Eckert, C.A. Spectroscopic Study of Structure and Interactions in Cosolvent-Modified Supercritical Fluids. J. Phys. Chem. 1993, 97, 11823–11834. [Google Scholar] [CrossRef]
  23. Ren, H.; Song, J.; Xu, Q.; Yin, J. Solubility of the silver nitrate in supercritical carbon dioxide with ethanol and ethylene glycol as double cosolvents: Experimental determination and correlation. Chin. J. Chem. Eng. 2018, 27, 400–404. [Google Scholar] [CrossRef]
  24. Gurina, D.L.; Antipova, M.L.; Odintsova, E.G.; Petrenko, V.E. The study of peculiarities of parabens solvation in methanol- and acetone-modified supercritical carbon dioxide by computer simulation. J. Supercrit. Fluids 2017, 126, 47–54. [Google Scholar] [CrossRef]
  25. Yang, H.; Zhong, C. Modeling of the solubility of aromatic compounds in supercritical carbon dioxide–cosolvent systems using SAFT equation of state. J. Supercrit. Fluids 2005, 33, 99–106. [Google Scholar] [CrossRef]
  26. Ghoderao, P.N.; Lee, C.W.; Byun, H.S. Phase Behavior Investigation of the Vinyl Toluene and Poly(vinyl toluene) + Co-solvents in Supercritical CO2. J. Ind. Eng. Chem. 2023, 121, 92–99. [Google Scholar] [CrossRef]
  27. Wang, N.; Pei, C.; Zhong, Y.; Zhang, Y.; Liu, X.; Hou, J.; Yuan, Y.; Zhang, R. Molecular Dynamics Simulation of the Compatibility Between Supercritical Carbon Dioxide and Coating Resins Assisted by Co-Solvents. Materials 2024, 17, 6271. [Google Scholar] [CrossRef]
  28. Behera, U.S.; Prasad, S.K.; Baskaran, D.; Byun, H.S. Phase Behavior of Biodegradable Poly(L-lactic acid) in Supercritical Solvents and Cosolvents. J. CO2 Util. 2024, 79, 102658. [Google Scholar] [CrossRef]
  29. Baskaran, D.; Behera, U.S.; Byun, H.S. Assessment of Solubility Behavior of a Copolymer in Supercritical CO2 and Organic Solvents: Neural Network Prediction and Statistical Analysis. ACS Omega 2024, 9, 40941–40955. [Google Scholar] [CrossRef]
  30. Wu, W.; Ke, J.; Poliakoff, M. Phase Boundaries of CO2 + Toluene, CO2 + Acetone, and CO2 + Ethanol at High Temperatures and High Pressures. J. Chem. Eng. Data 2006, 51, 1398–1403. [Google Scholar] [CrossRef]
  31. Wu, J.; Pan, Q.; Rempel, G.L. Pressure-Density-Temperature Behavior of CO2/Acetone, CO2/Toluene, and CO2/Monochlorobenzene Mixtures in the Near-Critical Region. J. Chem. Eng. Data 2004, 49, 976–979. [Google Scholar] [CrossRef]
  32. Matsukawa, H.; Tsuji, T.; Otake, K. Measurement of the Density of Carbon Dioxide/Toluene Homogeneous Mixtures and Correlation with Equations of State. J. Chem. Thermodyn. 2022, 164, 106618. [Google Scholar] [CrossRef]
  33. Knez, Ž.; Škerget, M.; Ilič, L.; Lütge, C. Vapor–liquid equilibrium of binary CO2–organic solvent systems (ethanol, tetrahydrofuran, ortho-xylene, meta-xylene, para-xylene). J. Supercrit. Fluids 2008, 43, 383–389. [Google Scholar] [CrossRef]
  34. Zhang, H.; Liu, Z.; Han, B. Critical points and phase behavior of toluene-CO2 and toluene-H2-CO2 mixture in CO2-rich region. J. Supercrit. Fluids 2000, 18, 185–192. [Google Scholar] [CrossRef]
  35. Kwon, S.; Bae, W.; Lee, K.; Byun, H.S.; Kim, H. High Pressure Phase Behavior of Carbon Dioxide + 2,2,2-Trifluoroethyl Methacrylate and + Poly(2,2,2-trifluoroethyl methacrylate) Systems. J. Chem. Eng. Data 2007, 52, 89–92. [Google Scholar] [CrossRef]
  36. Zhang, G.; Wu, T.; Li, J.; Pang, Q.; Yang, H.; Liu, G.; Huang, H.; Zhu, Y. Dynamics Simulation of the Effect of Cosolvent on the Solubility and Tackifying Behavior of PDMS Tackifier in Supercritical CO2 Fracturing Fluid. Colloids Surfaces Physicochem. Eng. Asp. 2023, 662, 130985. [Google Scholar] [CrossRef]
  37. Prasad, S.K.; Behera, U.S.; Lee, C.W.; Byun, H.S. Impact of Cosolvent Concentration of Ternary and Binary Solution for Biodegradable Poly(D,L-lactic acid) under Supercritical Solvents. J. Supercrit. Fluids 2024, 207, 106208. [Google Scholar] [CrossRef]
  38. Ciardelli, F.; Rubino, G.; Ranieri, G.; Licciulli, A.; Laviano, R. Fluorinated polymeric materials for the protection of monumental buildings. Macromol. Symp. 2000, 152, 211–222. [Google Scholar] [CrossRef]
  39. Kwon, S.; Bae, W.; Kim, H. The Effect of CO2 in Free-radical Polymerization of 2,2,2-Trifluoroethyl Methacrylate. Korean J. Chem. Eng. 2004, 21, 910–914. [Google Scholar] [CrossRef]
  40. Ratcharak, O.; Sane, A. Surface coating with poly(trifluoroethyl methacrylate) through rapid expansion of supercritical CO2 solutions. J. Supercrit. Fluids 2014, 89, 106–112. [Google Scholar] [CrossRef]
  41. Byun, H.S.; Kim, C.R.; Yoon, S.D. Cloud-point measurement of binary and ternary mixtures for the P(MMA-co-PnFPA) in supercritical fluoric solvents. J. Supercrit. Fluids 2017, 120, 226–239. [Google Scholar] [CrossRef]
  42. Annohene, G.; Tepper, G.C. Low temperature formation of CH3NH3PbI3 perovskite films in supercritical carbon dioxide. J. Supercrit. Fluids 2019, 154, 104604. [Google Scholar] [CrossRef]
  43. Annohene, G.; Pascucci, J.; Pestov, D.; Tepper, G.C. Supercritical fluid-assisted crystallization of CH2NH3PbI3 perovskite films. J. Supercrit. Fluids 2020, 156, 104684. [Google Scholar] [CrossRef]
  44. Annohene, G.; Tepper, G.C. Efficient perovskite solar cells processed in supercritical carbon dioxide. J. Supercrit. Fluids 2021, 171, 105203. [Google Scholar] [CrossRef]
  45. Annohene, G.; Tepper, G. Moisture Stability of Perovskite Solar Cells Processed in Supercritical Carbon Dioxide. Molecules 2021, 26, 7570. [Google Scholar] [CrossRef] [PubMed]
  46. Handy, K.; Tepper, G.C. Incorporation of Poly(TFEMA) in Perovskite Thin Films Using a Supercritical Fluid. Molecules 2023, 28, 5385. [Google Scholar] [CrossRef]
  47. Pitzer, K.S.; Schreiber, D.R. Improving equation-of-state accuracy in the critical region; equations for carbon dioxide and neopentane as examples. Fluid Phase Equilibria 1988, 41, 1–17. [Google Scholar] [CrossRef]
  48. Rowane, A.J.; Mallepally, R.R.; Bamgbade, B.A.; Newkirk, M.S.; Baled, H.O.; Burgess, W.A.; Gamwo, I.K.; Tapriyal, D.; Enick, R.M.; McHugh, M.A. High-temperature, high-pressure viscosities and densities of toluene. J. Chem. Thermodyn. 2017, 115, 34–46. [Google Scholar] [CrossRef]
  49. Franck, E.U.; Wiegand, S.K.G. The Density of Toluene at High Pressures to 673 K and 300 MPa. Berichte Bunsenges. Phys. Chem. 2010, 102, 1794–1797. [Google Scholar] [CrossRef]
Figure 1. Chemical structure of poly(TFEMA). The polymer backbone originates from the methacrylate moiety, featuring an ester group linked to a 2,2,2-trifluoroethyl unit, which enhances its hydrophobicity and chemical resistance.
Molecules 30 01199 g001
Figure 2. Chemical structure of toluene, an aromatic hydrocarbon often employed as a cosolvent in scCO2 due to its moderate polarity and π π interaction capability, facilitating polymer dissolution.
Molecules 30 01199 g002
Figure 3. Cloud point pressure vs. temperature for 3 wt% poly(TFEMA) in scCO2 with varying toluene fractions (0–20 wt%). Error bars are within ±1% of reported values.
Molecules 30 01199 g003
Figure 4. Cloud point pressure vs. toluene wt% at five isothermal conditions: 304.65, 308.15, 313.15, 318.15, and 323.15 K.
Molecules 30 01199 g004
Figure 5. Calculated density of scCO2–toluene mixtures as a function of temperature at different toluene weight percentages (0–20 wt%).
Molecules 30 01199 g005
Figure 6. Schematic diagram of the experimental setup for cloud point measurements. The system integrates the CO2 supply, pressure and temperature control, and optical monitoring for accurate detection of cloud point phenomena.
Molecules 30 01199 g006
Figure 7. Camera images through the quartz window of the Phase Monitor showing (A) a fully dissolved (single-phase) polymer solution, (B) the onset of cloud formation (cloud point), and (C) significant phase separation (polymer precipitation).
Molecules 30 01199 g007
Table 1. Cloud point pressures for 3 wt% poly(TFEMA) in scCO2–toluene at different temperatures. Each value is an average of at least six measurements (±1%).
Temp.Cloud Point Pressure (MPa)
(°C)0 wt% Tol5 wt% Tol10 wt% Tol15 wt% Tol20 wt% Tol
31.518.5216.1613.6310.978.51
35.020.8418.4315.9113.0410.24
40.023.3220.7218.2015.2612.37
45.025.3822.9720.1517.2614.38
50.027.3724.9122.2619.1916.28
Table 2. Parameters for Equations (2) and (3) to calculate toluene densities with the Tait equation (Equation (1)) from 296 to 535 K and 10 to 300 MPa.
Equation (4): ρ0(T)/kg·m−3
10 3 · a 0 /kg·m−31.0267
10 · a 1 /kg·m−3· K 1 −2.5956
10 3 · a 2 /kg·m−3· K 2 −1.0127
Equation (5): B ( T ) /MPa
10 2 · b 0 /MPa3.9435
b 1 /MPa·K−1−1.3143
10 3 · b 2 /MPa·K−21.1164
Disclaimer/Publisher’s Note: The statements, opinions and data contained in all publications are solely those of the individual author(s) and contributor(s) and not of MDPI and/or the editor(s). MDPI and/or the editor(s) disclaim responsibility for any injury to people or property resulting from any ideas, methods, instructions or products referred to in the content.