
Physical and Functional Properties of Sweet Potato Flour: Influence of Variety and Drying Method

 , , ,
, , ,  ,
,
Abstract
1. Introduction
2. Results and Discussion
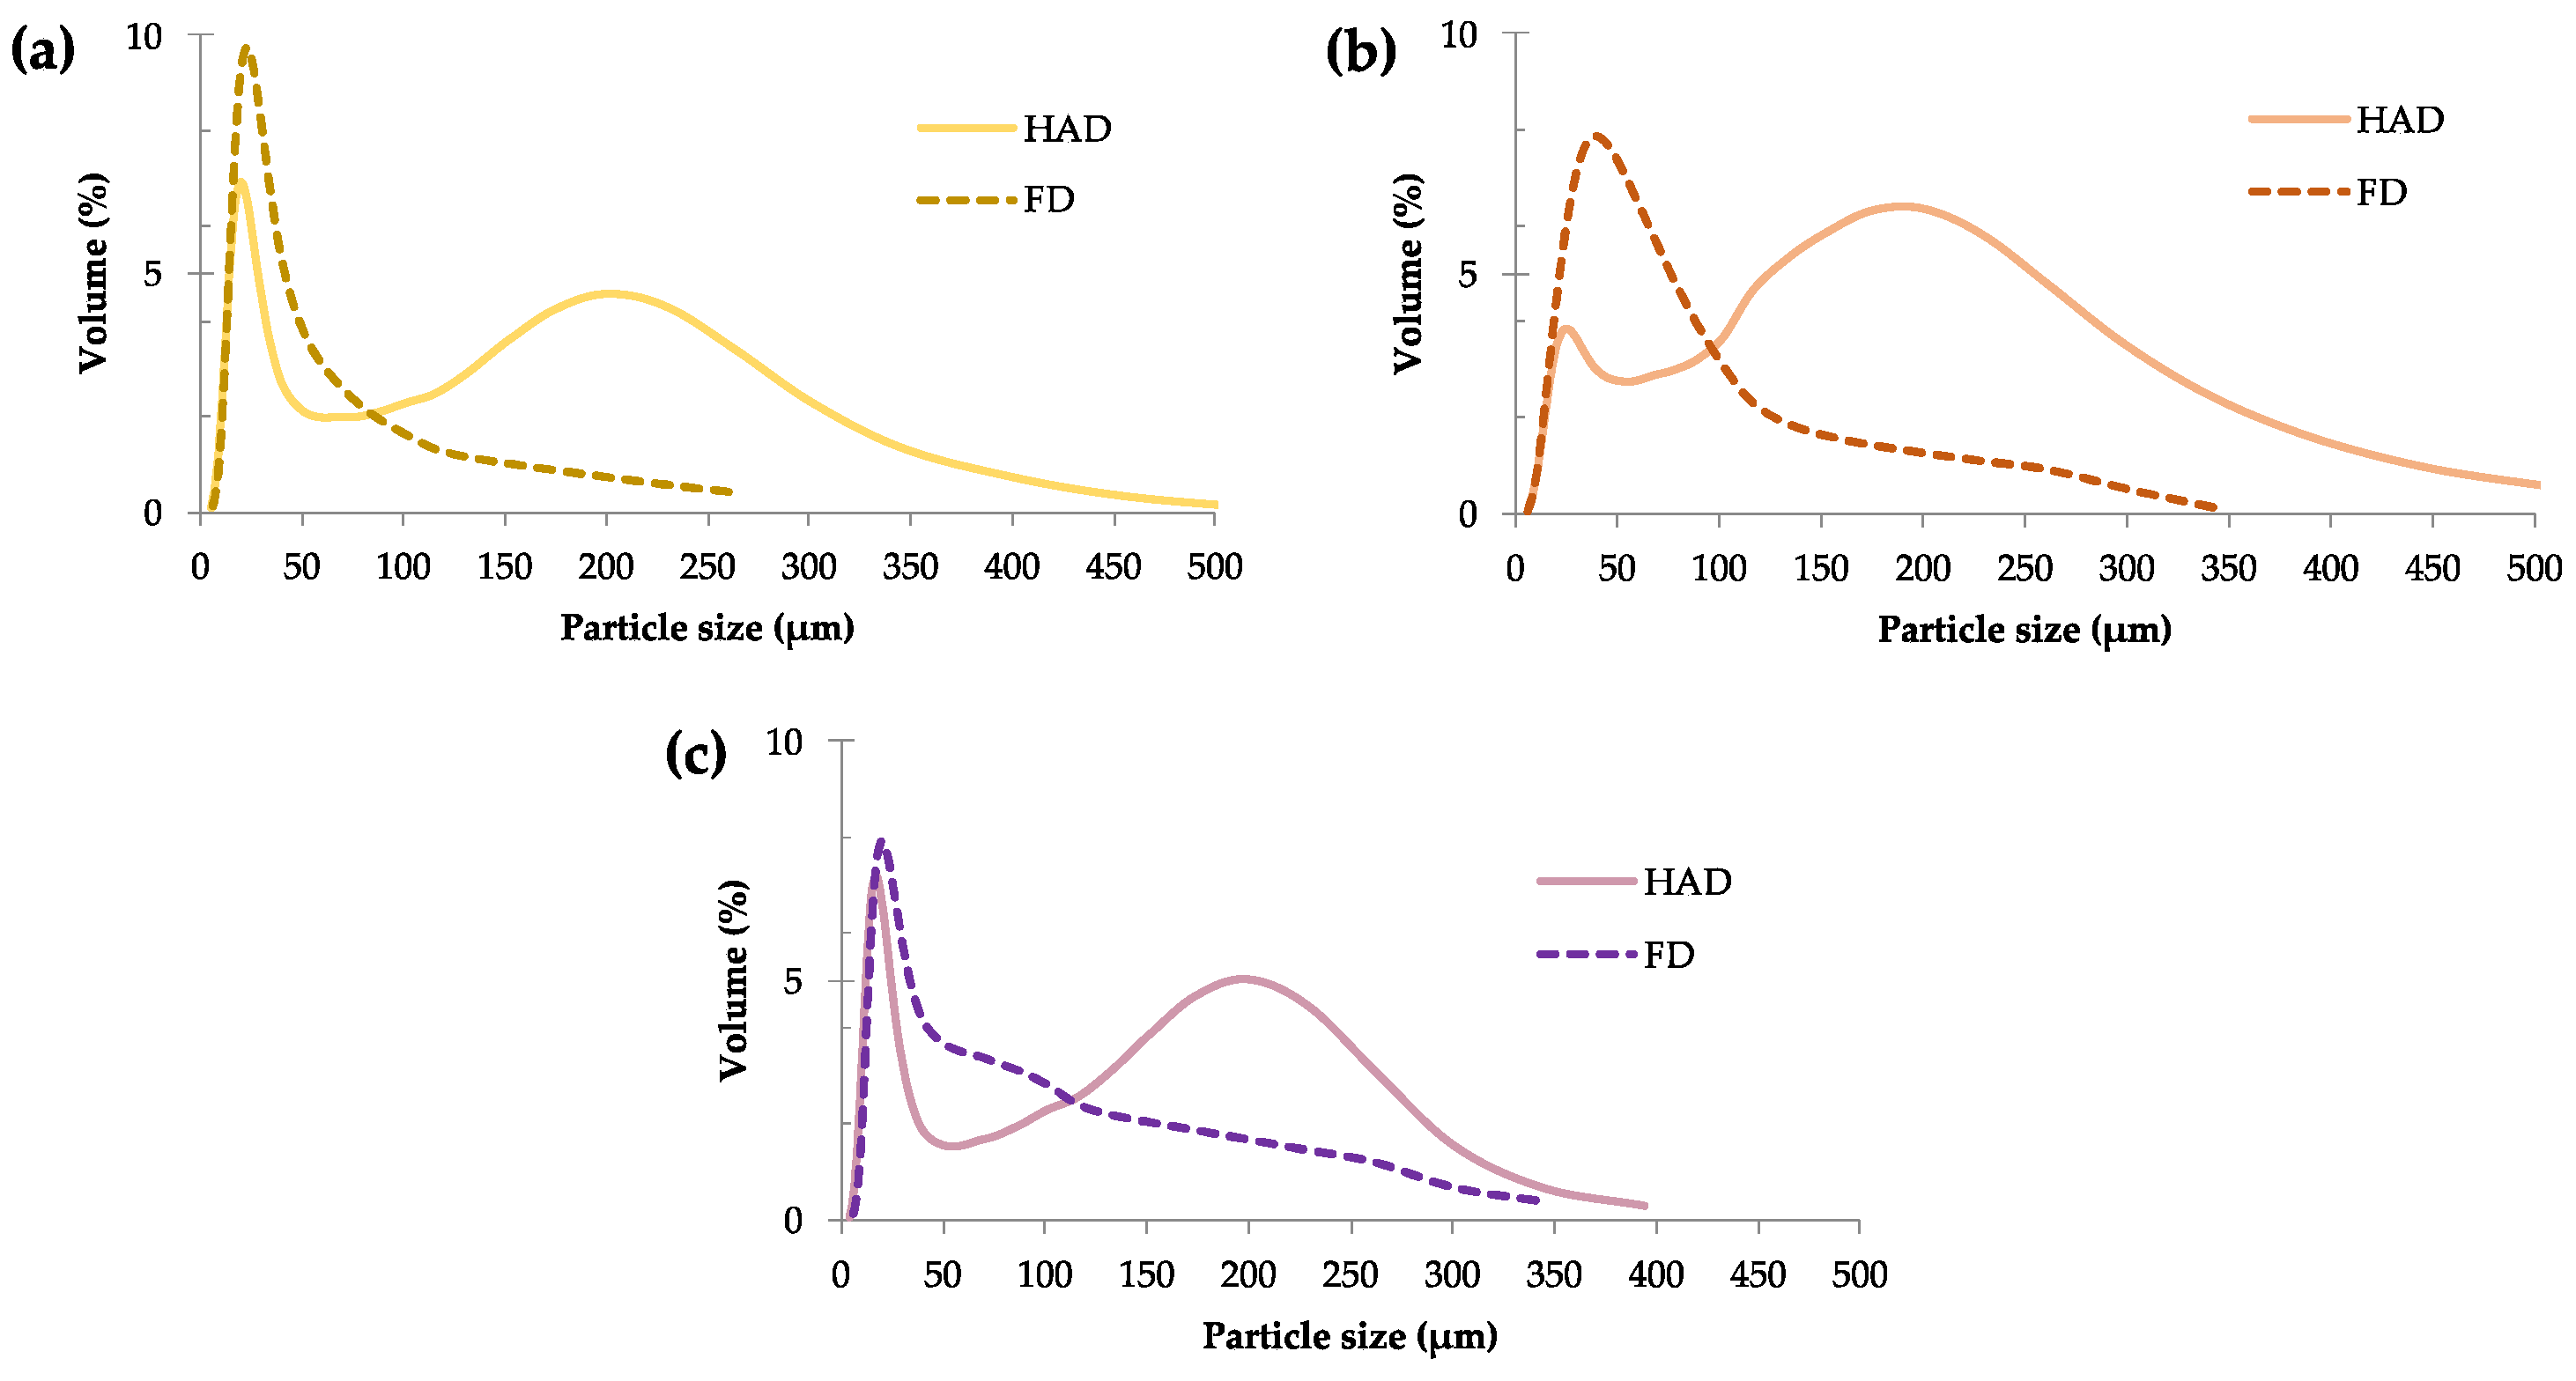
2.1. Particle Size Distribution
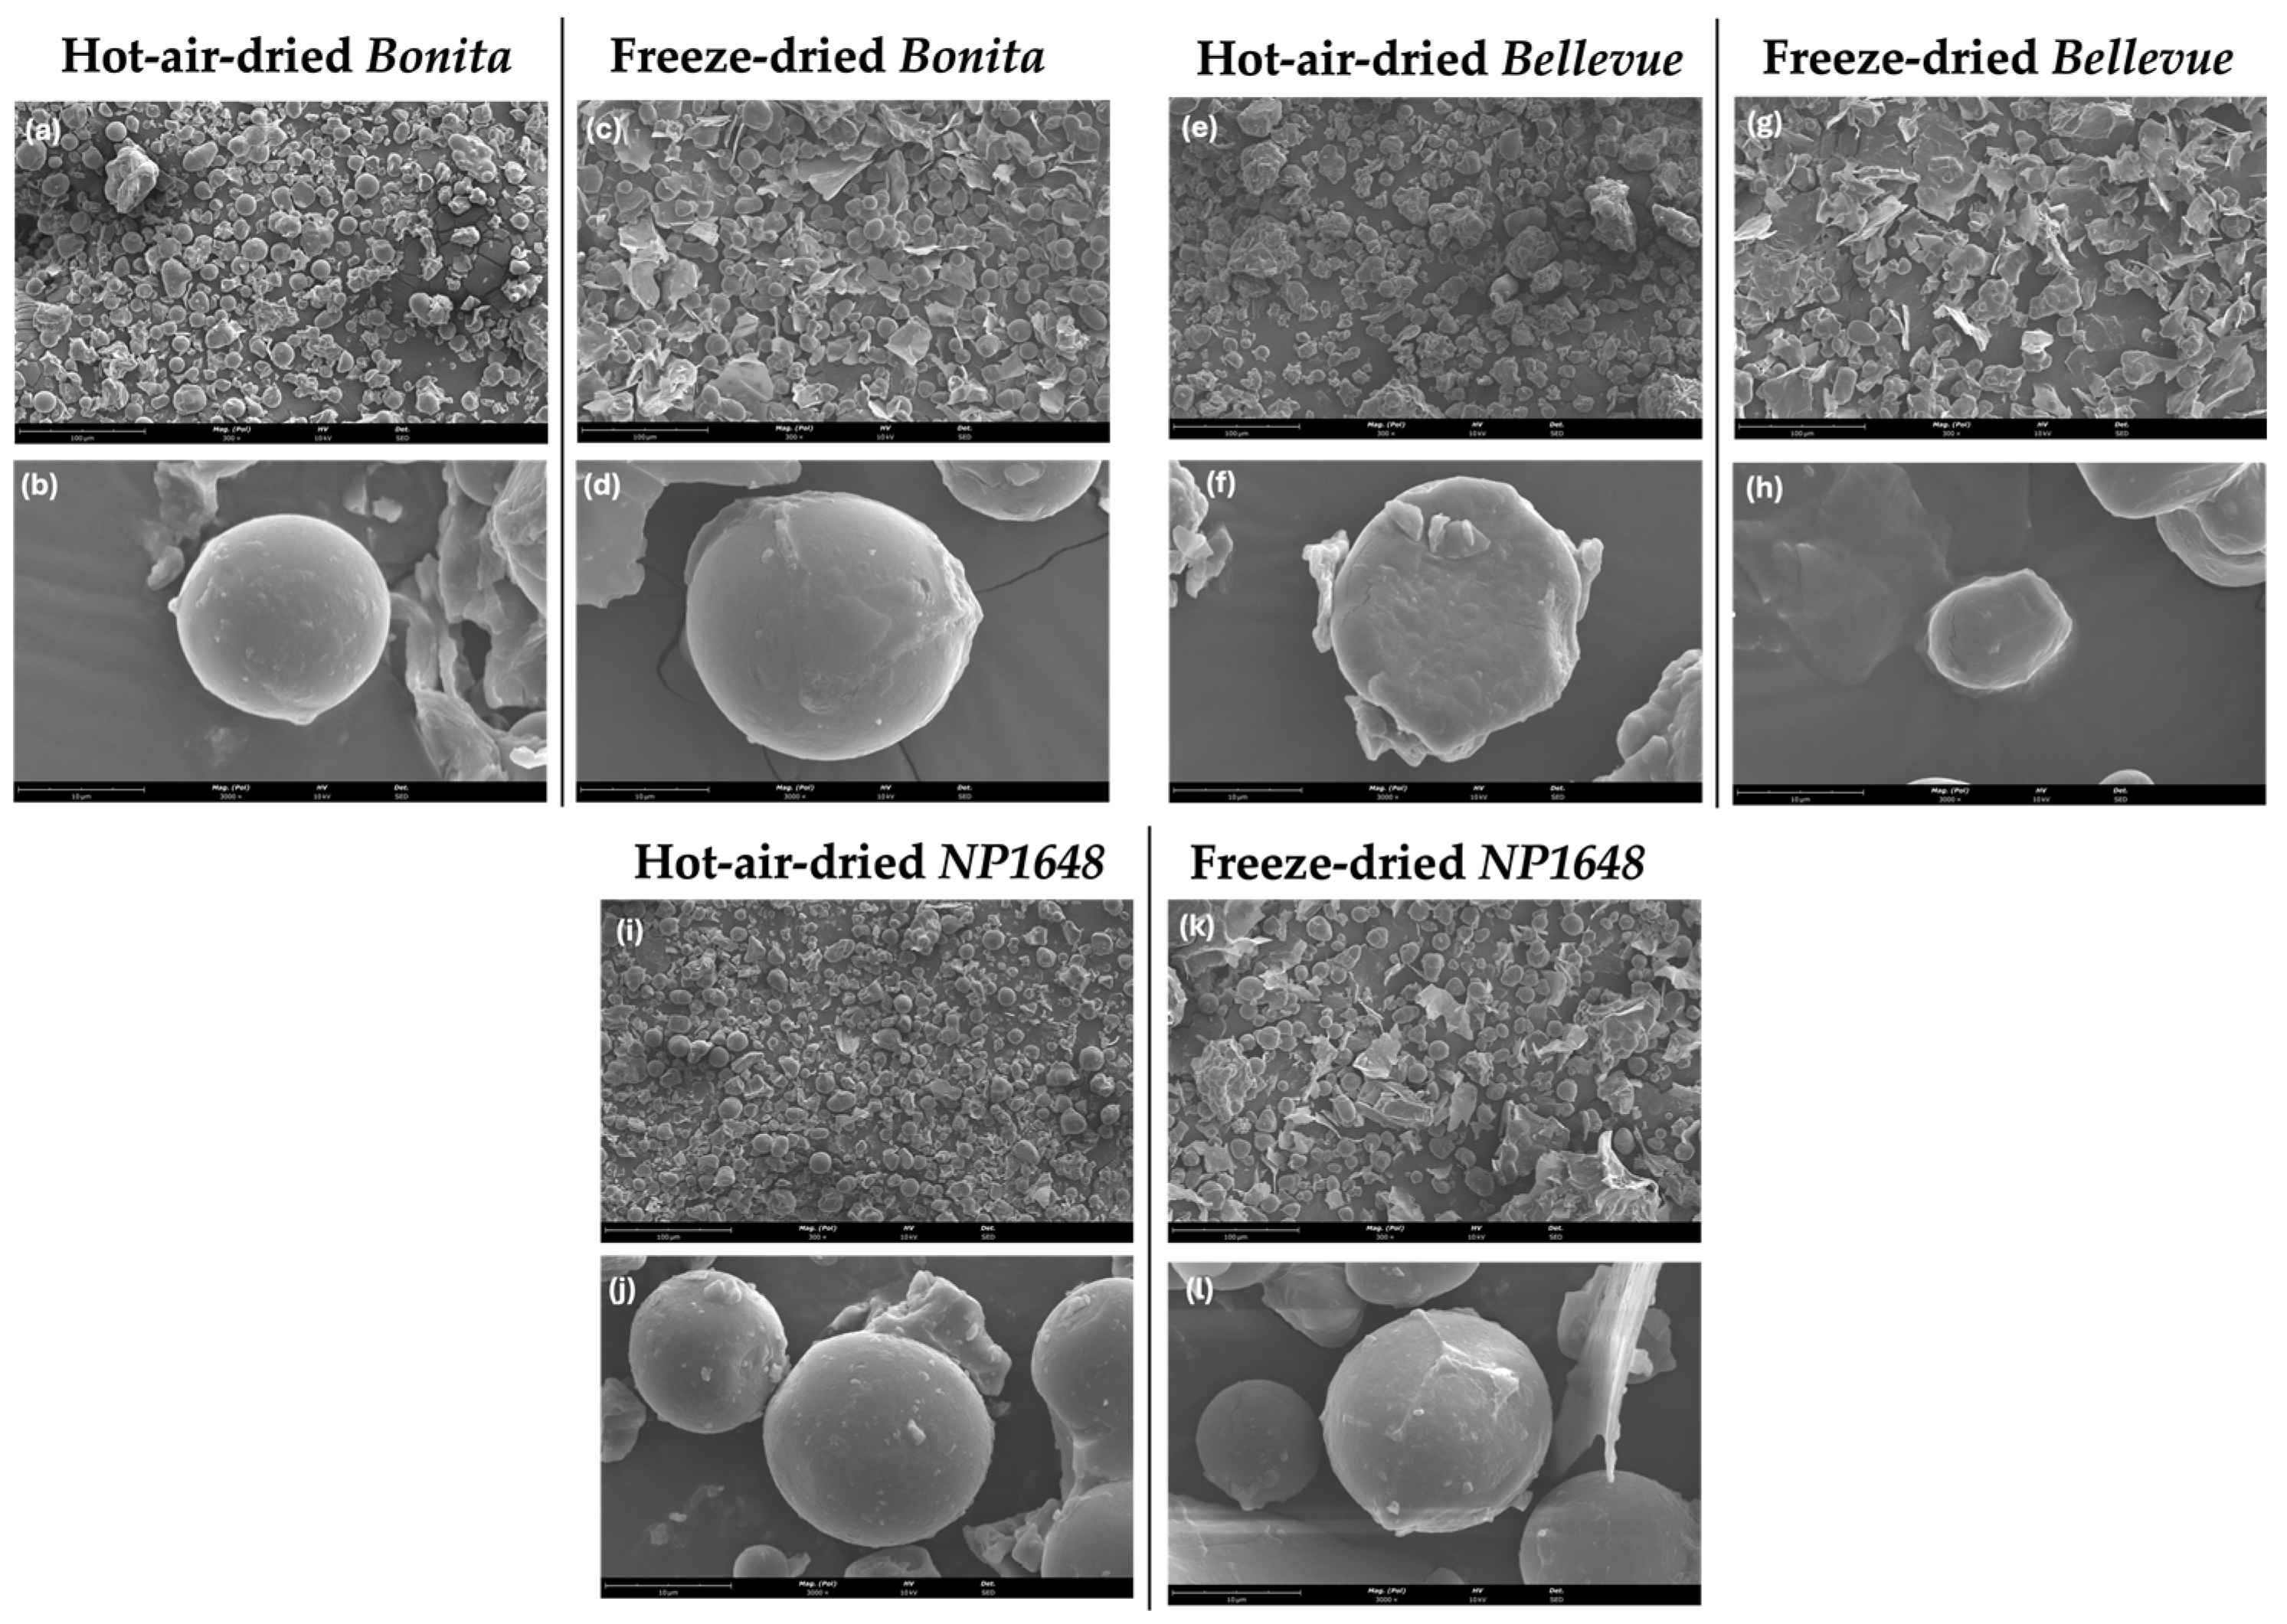
2.2. Morphology of Flour Particles
2.3. Bulk Density
2.4. Hydration and Lipophilic Properties
2.4.1. Water and Oil Absorption Capacities
2.4.2. Swelling Power and Water Solubility
2.5. Foaming and Emulsifying Properties
2.6. Gelatinisation Properties
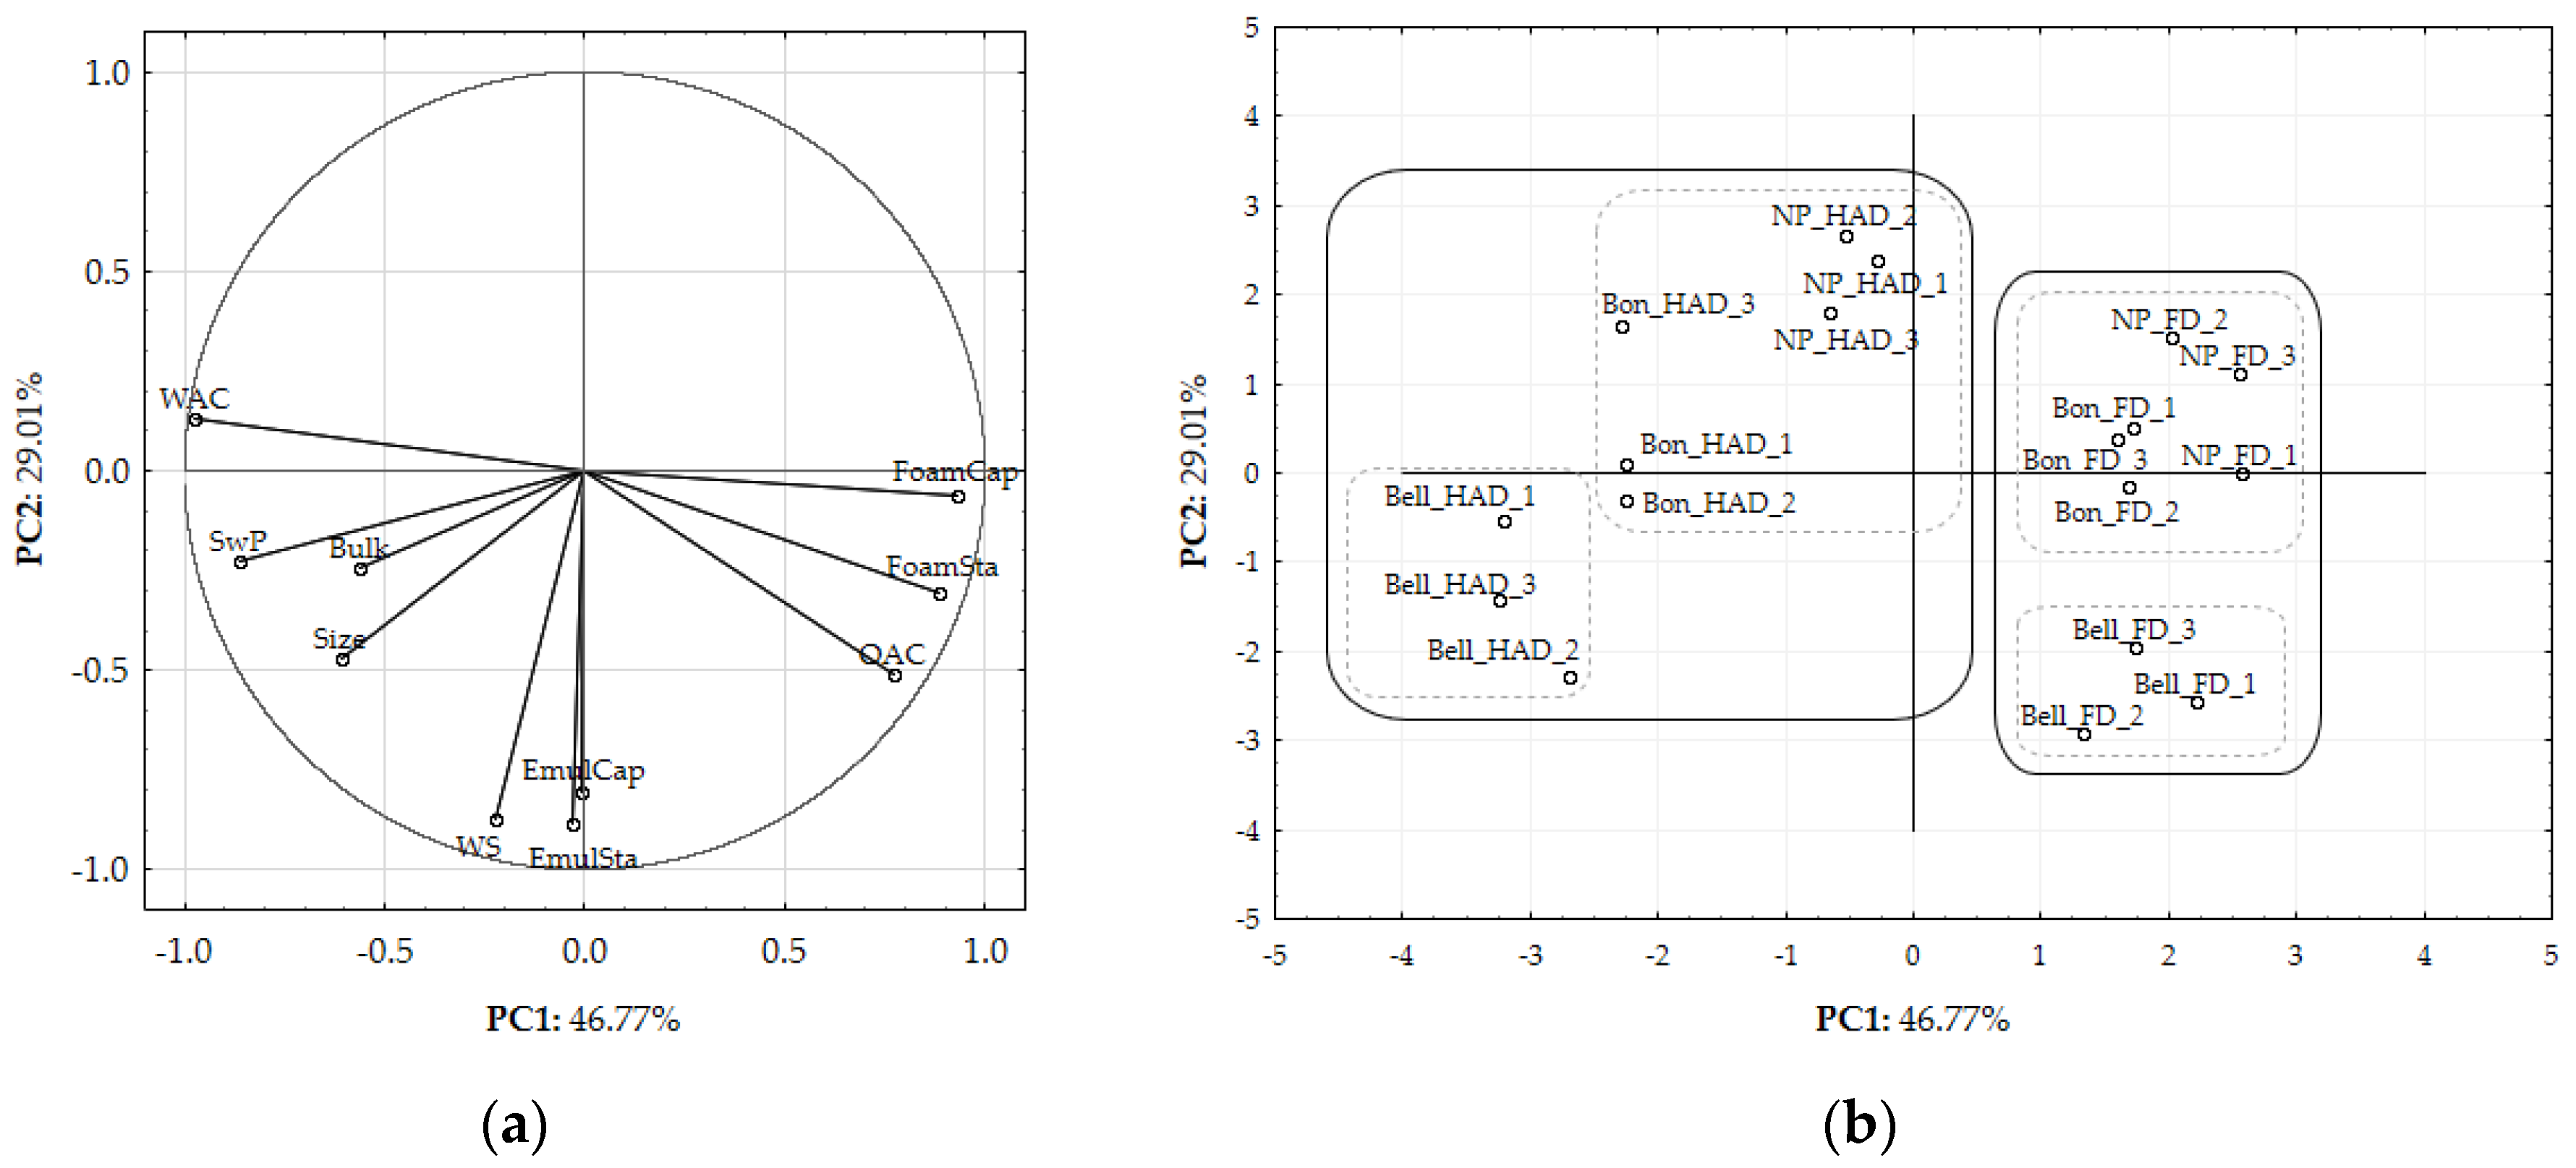
2.7. PCA Analysis
3. Materials and Methods
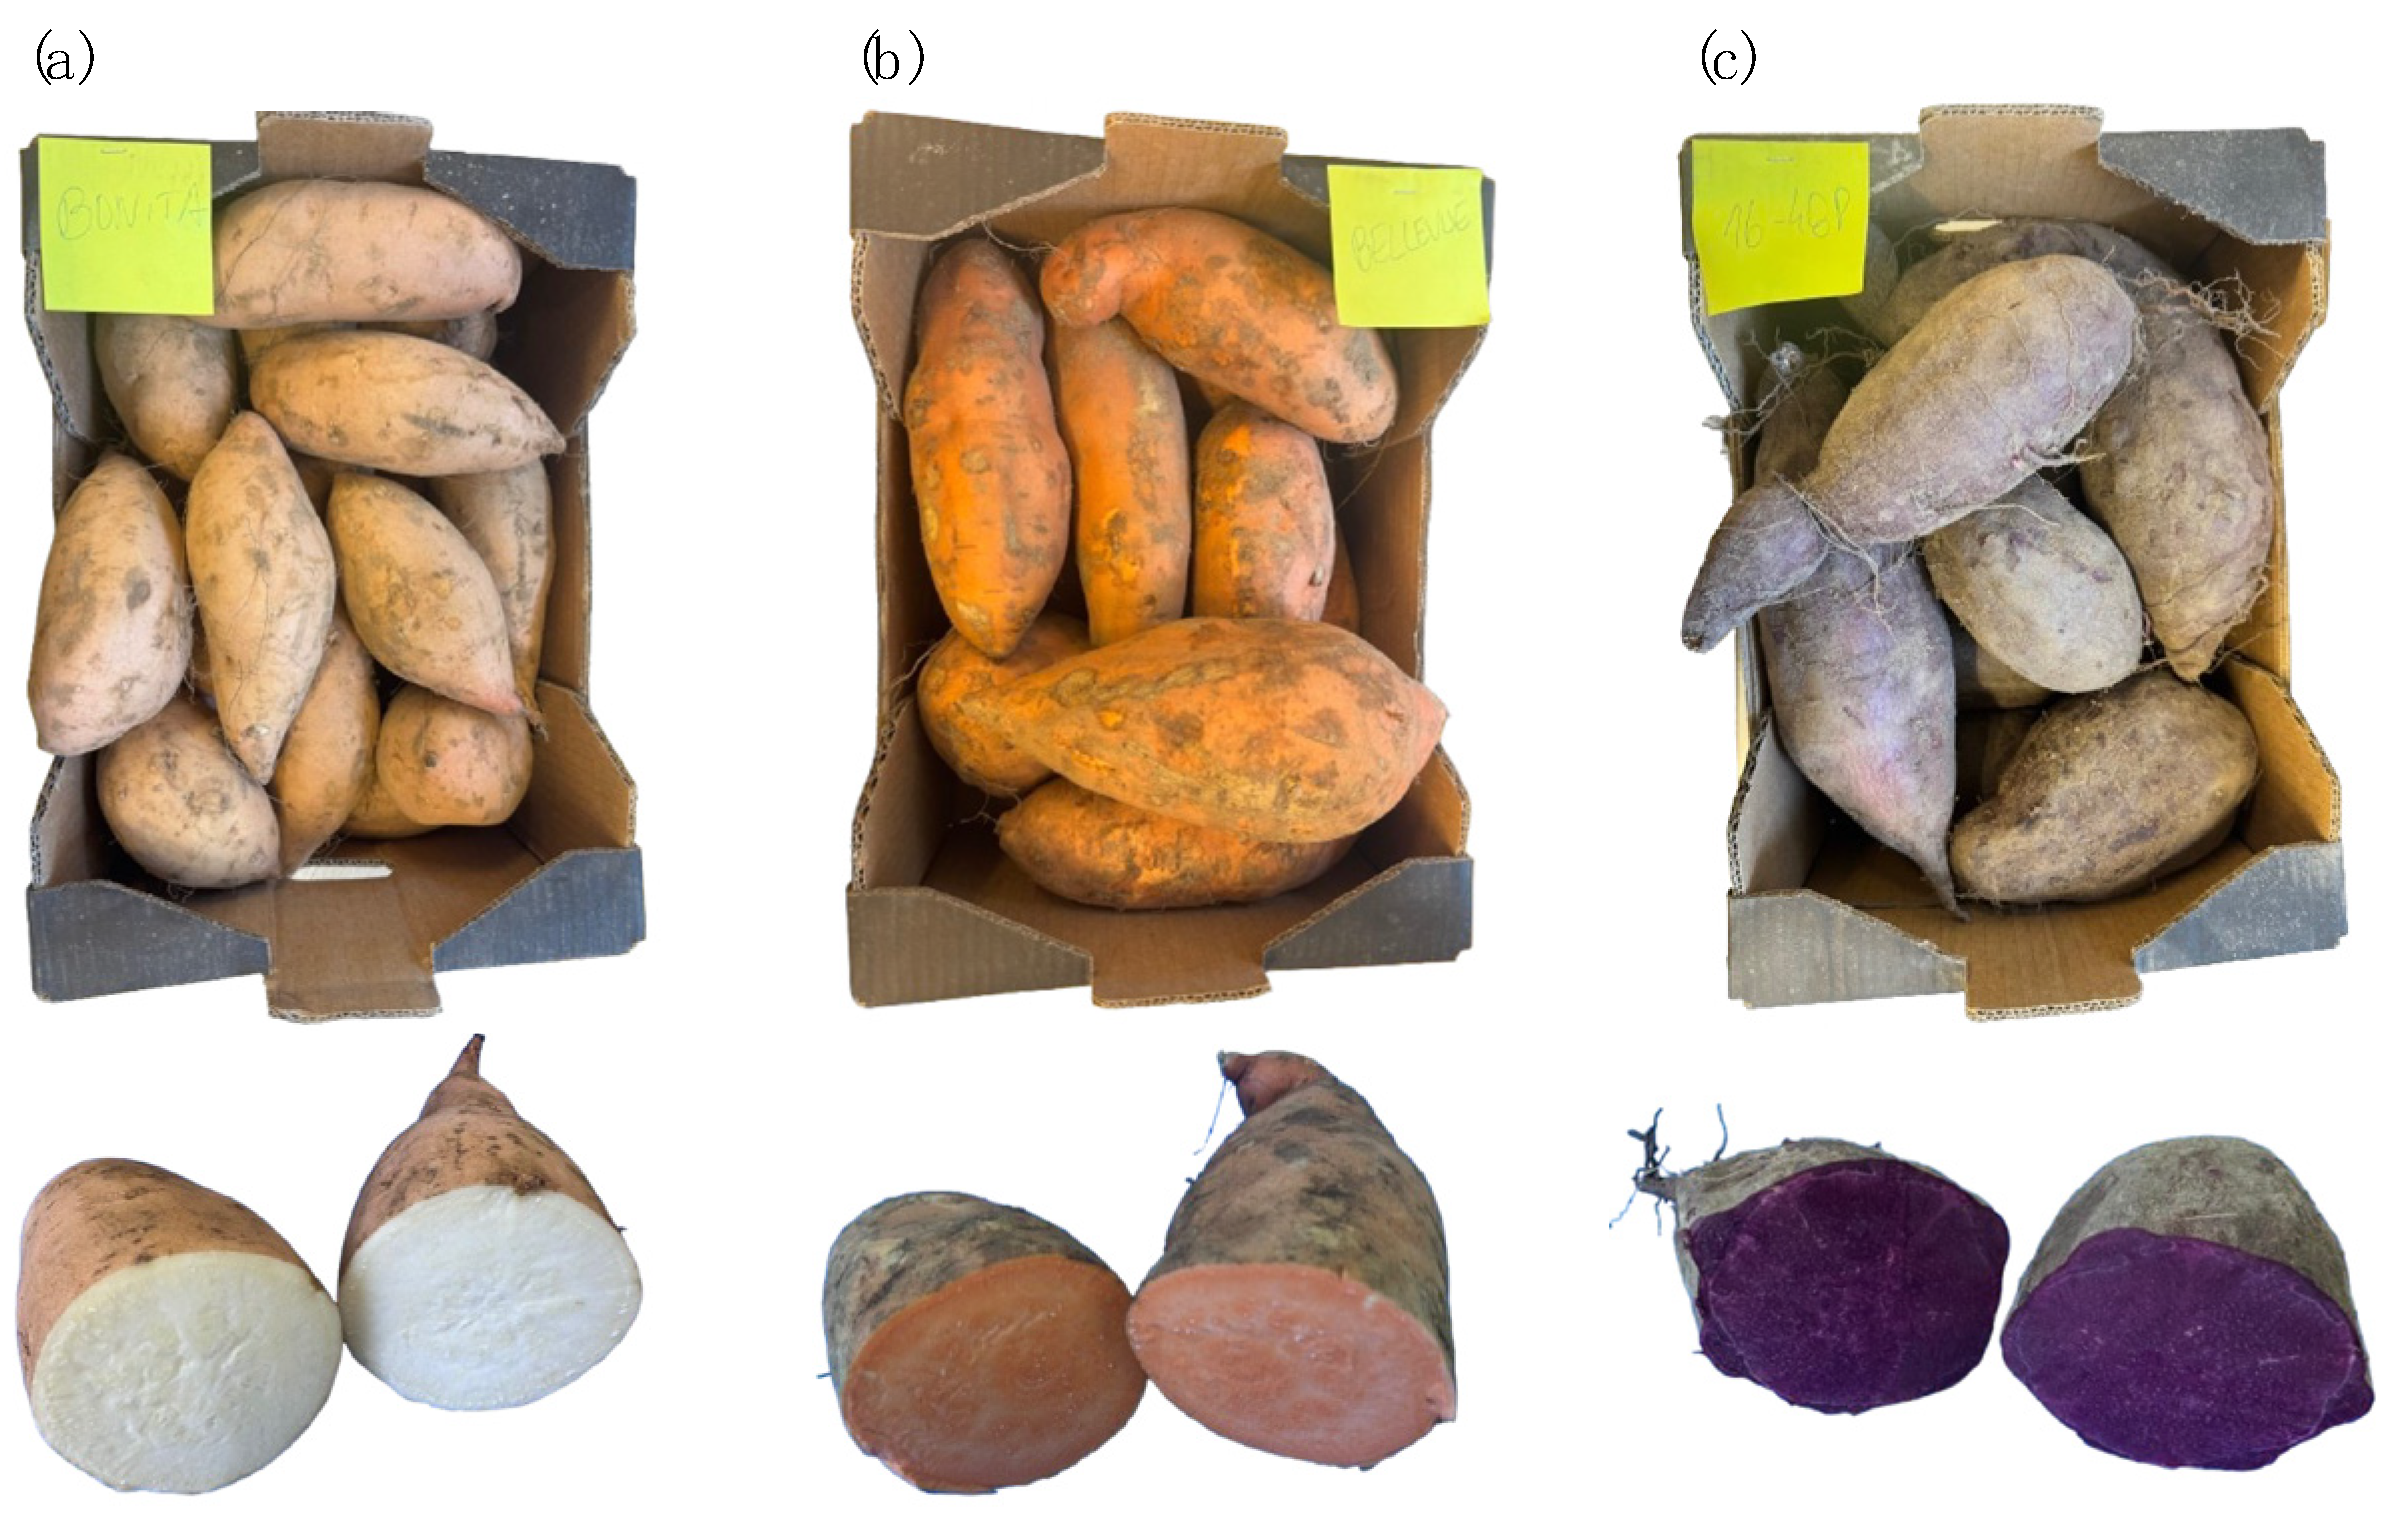
3.1. Plant Material and Sweet Potato Flour Preparation
3.2. Methods for Assessing the Physical and Functional Properties of Flours
3.2.1. Particle Size Distribution
3.2.2. Morphology of the Starch Granules
3.2.3. Bulk Density
3.2.4. Hydration and Lipophilic Properties
3.2.5. Foaming Properties
3.2.6. Emulsifying Properties
3.2.7. Gelatinisation Properties
3.3. Statistical Analysis
4. Conclusions
Supplementary Materials
Author Contributions
Funding
Institutional Review Board Statement
Informed Consent Statement
Data Availability Statement
Acknowledgments
Conflicts of Interest
References
- Alam, M.K. A Comprehensive Review of Sweet Potato (Ipomoea batatas [L.] Lam): Revisiting the Associated Health Benefits. Trends Food Sci. Technol. 2021, 115, 512–529. [Google Scholar] [CrossRef]
- Bas-Bellver, C.; Barrera, C.; Betoret, N.; Seguí, L. Turning Agri-Food Cooperative Vegetable Residues into Functional Powdered Ingredients for the Food Industry. Sustainability 2020, 12, 1284. [Google Scholar] [CrossRef]
- Amagloh, F.C.; Kaaya, A.N.; Yada, B.; Chelangat, D.M.; Katungisa, A.; Amagloh, F.K.; Tumuhimbise, G.A. Bioactive Compounds and Antioxidant Activities in Peeled and Unpeeled Sweet Potato Roots of Different Varieties and Clones in Uganda. Future Foods 2022, 6, 100183. [Google Scholar] [CrossRef]
- Bach, D.; Bedin, A.C.; Lacerda, L.G.; Nogueira, A.; Demiate, I.M. Sweet Potato (Ipomoea batatas L.): A Versatile Raw Material for the Food Industry. Braz. Arch. Biol. Technol. 2021, 64, e21200568. [Google Scholar] [CrossRef]
- Fang, B.; Rao, J. Gelation. In Plant-Based Proteins. Methods and Protocols in Food Science; Li, Y., Ed.; Springer: New York, NY, USA, 2025; pp. 345–356. ISBN 978-1-0716-4272-6. [Google Scholar]
- Nishinari, K. Rheological and Thickening Properties. In Food Hydrocolloids; Fang, Y., Zhang, H., Nishinari, K., Eds.; Springer: Singapore, 2021; pp. 75–117. ISBN 978-981-16-0320-4. [Google Scholar]
- Ahmed, J.; Ramaswamy, H.S. Viscoelastic Properties of Sweet Potato Puree Infant Food. J. Food Eng. 2006, 74, 376–382. [Google Scholar] [CrossRef]
- Dereje, B.; Girma, A.; Mamo, D.; Chalchisa, T. Functional Properties of Sweet Potato Flour and Its Role in Product Development: A Review. Int. J. Food Prop. 2020, 23, 1639–1662. [Google Scholar] [CrossRef]
- Vargas-Aguilar, P. Flours and Starches Made from Cassava (Yuca), Yam, Sweet Potatoes and Ñampi: Functional Properties and Possible Applications in the Food Industry. Rev. Tecnol. Marcha 2016, 29, 86–94. [Google Scholar] [CrossRef]
- Olatunde, G.O.; Henshaw, F.O.; Idowu, M.A.; Tomlins, K. Quality Attributes of Sweet Potato Flour as Influenced by Variety, Pretreatment and Drying Method. Food Sci. Nutr. 2016, 4, 623–635. [Google Scholar] [CrossRef]
- Pereira, N.; Ramos, A.C.; Alves, M.; Alves, V.D.; Roseiro, C.; Vida, M.; Moldão, M.; Abreu, M. Gluten-Free Sweet Potato Flour: Effect of Drying Method and Variety on the Quality and Bioactivity. Molecules 2024, 29, 5771. [Google Scholar] [CrossRef]
- Buzera, A.; Gikundi, E.; Orina, I.; Sila, D. Effect of Pretreatments and Drying Methods on Physical and Microstructural Properties of Potato Flour. Foods 2022, 11, 507. [Google Scholar] [CrossRef]
- Oyinloye, T.M.; Yoon, W.B. Effect of Freeze-Drying on Quality and Grinding Process of Food Produce: A Review. Processes 2020, 8, 354. [Google Scholar] [CrossRef]
- Yadav, A.R.; Guha, M.; Tharanathan, R.N.; Ramteke, R.S. Influence of Drying Conditions on Functional Properties of Potato Flour. Eur. Food Res. Technol. 2006, 223, 553–560. [Google Scholar] [CrossRef]
- Zhang, L.; Zhao, L.; Bian, X.; Guo, K.; Zhou, L.; Wei, C. Characterization and Comparative Study of Starches from Seven Purple Sweet Potatoes. Food Hydrocoll. 2018, 80, 168–176. [Google Scholar] [CrossRef]
- van Rooyen, J.; Simsek, S.; Oyeyinka, S.A.; Manley, M. Holistic View of Starch Chemistry, Structure and Functionality in Dry Heat-Treated Whole Wheat Kernels and Flour. Foods 2022, 11, 207. [Google Scholar] [CrossRef]
- da Silva Timm, N.; Ramos, A.H.; Ferreira, C.D.; Biduski, B.; Eicholz, E.D.; de Oliveira, M. Effects of Drying Temperature and Genotype on Morphology and Technological, Thermal, and Pasting Properties of Corn Starch. Int. J. Biol. Macromol. 2020, 165, 354–364. [Google Scholar] [CrossRef] [PubMed]
- Baudron, V.; Gurikov, P.; Smirnova, I.; Whitehouse, S. Porous Starch Materials via Supercritical-and Freeze-Drying. Gels 2019, 5, 12. [Google Scholar] [CrossRef]
- Lu, X.; Ma, X.; Lei, Y. Deep Freezing and Thawing Modification and Its Impact on Starch Properties. In Starch: Advances in Modifications, Technologies and Applications; Sharanagat, V.S., Saxena, D.C., Kumar, K., Kumar, Y., Eds.; Springer: Berlin/Heidelberg, Germany, 2023; pp. 279–307. ISBN 9783031358432. [Google Scholar]
- Ahmed, M.; Sorifa, A.M.; Eun, J.B. Effect of Pretreatments and Drying Temperatures on Sweet Potato Flour. Int. J. Food Sci. Technol. 2010, 45, 726–732. [Google Scholar] [CrossRef]
- Ngoma, K.; Mashau, M.E.; Silungwe, H. Physicochemical and Functional Properties of Chemically Pretreated Ndou Sweet Potato Flour. Int. J. Food Sci. 2019, 2019, 4158213. [Google Scholar] [CrossRef]
- Zhang, S. Relationship Between Particle Size Distribution and Porosity in Dump Leaching. Ph.D. Thesis, University of British Columbia, Vancouver, BC, Canada, 2017. [Google Scholar]
- Awuchi, C.G.; Igwe, V.S.; Echeta, C.K. The Functional Properties of Foods and Flours. Int. J. Adv. Acad. Res. 2019, 5, 2488–9849. [Google Scholar]
- Chandra, S.; Samsher, L. Assessment of Functional Properties of Different Flours. Afr. J. Agric. Res. 2013, 8, 4849–4852. [Google Scholar]
- Chandra, S.; Singh, S.; Kumari, D. Evaluation of Functional Properties of Composite Flours and Sensorial Attributes of Composite Flour Biscuits. J. Food Sci. Technol. 2014, 52, 3681–3688. [Google Scholar] [CrossRef]
- Kumar, R.; Singh, B.R.; Chandra, S.; Chauhan, N.; Verma, R. Physico-Chemical and Functional Properties of Different Flours Used for Preparation of Cookies. Pharma Innov. J. 2021, 10, 716–722. [Google Scholar]
- Olubunmi, A.A.; Abraham, I.O.; Mojirade, L.A.; Afolake, O.B.; Kehinde, O.E. Development, Evaluation and Sensory Quality of Orange Fleshed Sweet Potato (Ipomoea batatas Lam) Extruded Pasta Products. Croat. J. Food Technol. Biotechnol. 2017, 12, 83–89. [Google Scholar]
- Fetuga, G.; Tomlins, K.; Henshaw, F.; Idowu, M. Effect of Variety and Processing Method on Functional Properties of Traditional Sweet Potato Flour (“Elubo”) and Sensory Acceptability of Cooked Paste (“Amala”). Food Sci. Nutr. 2014, 2, 682–691. [Google Scholar] [CrossRef]
- Shen, Y.; Tang, X.; Li, Y. Drying Methods Affect Physicochemical and Functional Properties of Quinoa Protein Isolate. Food Chem. 2021, 339, 127823. [Google Scholar] [CrossRef] [PubMed]
- Hartel, R.W.; von Elbe, J.H.; Hofberger, R. Starches, Proteins, Pectin, and Gums. In Confectionery Science and Technology; Hartel, R.W., von Elbe, J.H., Hofberger, R., Eds.; Springer International Publishing: Cham, Switzerland, 2018; pp. 125–150. ISBN 978-3-319-61742-8. [Google Scholar]
- Álvarez-Castillo, E.; Bengoechea, C.; Felix, M.; Guerrero, A. Freeze-Drying versus Heat-Drying: Effect on Protein-Based Superabsorbent Material. Processes 2021, 9, 1076. [Google Scholar] [CrossRef]
- Hoover, R. Composition, Molecular Structure, and Physicochemical Properties of Tuber and Root Starches: A Review. Carbohydr. Polym. 2001, 45, 253–267. [Google Scholar] [CrossRef]
- Ritika, B.Y.; Khatkar, B.S.; Yadav, B.S. Physicochemical, Morphological, Thermal and Pasting Properties of Starches Isolated from Rice Cultivars Grown in India. Int. J. Food Prop. 2010, 13, 1339–1354. [Google Scholar] [CrossRef]
- Kusumayanti, H.; Handayani, N.A.; Santosa, H. Swelling Power and Water Solubility of Cassava and Sweet Potatoes Flour. Procedia Environ. Sci. 2015, 23, 164–167. [Google Scholar] [CrossRef]
- Tortoe, C.; Akonor, P.T.; Koch, K.; Menzel, C.; Adofo, K. Physicochemical and Functional Properties of Flour from Twelve Varieties of Ghanaian Sweet Potatoes. Int. Food Res. J. 2017, 24, 2549–2556. [Google Scholar]
- Yadav, A.R.; Guha, M.; Tharanathan, R.N.; Ramteke, R.S. Changes in Characteristics of Sweet Potato Flour Prepared by Different Drying Techniques. LWT 2006, 39, 20–26. [Google Scholar] [CrossRef]
- Aina, A.J.; Falade, K.O.; Akingbala, J.O.; Titus, P. Physicochemical Properties of Twenty-One Caribbean Sweet Potato Cultivars. Int. J. Food Sci. Technol. 2009, 44, 1696–1704. [Google Scholar] [CrossRef]
- Dehnad, D.; Jafari, S.M.; Afrasiabi, M. Influence of Drying on Functional Properties of Food Biopolymers: From Traditional to Novel Dehydration Techniques. Trends Food Sci. Technol. 2016, 57, 116–131. [Google Scholar] [CrossRef]
- Khan, N.M.; Mu, T.H.; Ali, F.; Arogundade, L.A.; Khan, Z.U.; Zhang, M.; Ahmad, S.; Sun, H.N. Effects of High Hydrostatic Pressure on Emulsifying Properties of Sweet Potato Protein in Model Protein-Hydrocolloids System. Food Chem. 2014, 169, 448–454. [Google Scholar] [CrossRef]
- Schmiele, M.; Sampaio, U.M.; Pedrosa Silva Clerici, M.T. Basic Principles: Composition and Properties of Starch. In Starches for Food Application: Chemical, Technological and Health Properties; Elsevier Inc.: Amsterdam, The Netherlands, 2019; pp. 1–22. ISBN 9780128094402. [Google Scholar]
- Yang, S.; Hu, W.; Qiao, S.; Song, W.; Tan, W. Advances in Processing Techniques and Determinants of Sweet Potato Starch Gelatinization. Foods 2025, 14, 545. [Google Scholar] [CrossRef] [PubMed]
- Santi, E.N.; Murdianto, W.; Ahmadi, N.R.; Waryat; Sulistyaningrum, A. Physicochemical Characteristics of Three Local Sweet Potato Flour from East Kalimantan. In IOP Conference Series: Earth and Environmental Science, Proceedings of the 3rd International Conference on Agricultural Postharvest Handling an Processing, Bogor, Indonesia, 12–14 October 2021; IOP Publishing: Bristol, UK, 2022; Volume 1024, p. 012037. [Google Scholar] [CrossRef]
- Garcia, A.M.; Walter, W.M., Jr. Physicochemical Characterization of Starch from Peruvian Sweetpotato Selections. Starch/Staerke 1998, 50, 331–337. [Google Scholar] [CrossRef]
- Desale, F.H.; Sasanatayart, R. Effect of Drying Temperature on Functional and Digestive Properties of Sweet Potato Flour. In Proceedings of the 63rd the IRES International Conference, Bangkok, Thailand, 5–6 March 2017; pp. 25–30. [Google Scholar]
- Li, S.; Chen, W.; Zongo, A.W.-S.; Chen, Y.; Liang, H.; Li, J.; Li, B. Effects of Non-Starch Polysaccharide on Starch Gelatinization and Digestibility: A Review. Food Innov. Adv. 2023, 2, 302–312. [Google Scholar] [CrossRef]
- Kaur, M.; Singh, N. Studies on Functional, Thermal and Pasting Properties of Flours from Different Chickpea (Cicer arietinum L.) Cultivars. Food Chem. 2005, 91, 403–411. [Google Scholar] [CrossRef]
- Chikpah, S.K.; Korese, J.K.; Hensel, O.; Sturm, B. Effect of Sieve Particle Size and Blend Proportion on the Quality Properties of Peeled and Unpeeled Orange Fleshed Sweet Potato Composite Flours. Foods 2020, 9, 740. [Google Scholar] [CrossRef]
- Mironeasa, S.; Mironeasa, C. Dough Bread from Refined Wheat Flour Partially Replaced by Grape Peels: Optimizing the Rheological Properties. J. Food Process Eng. 2019, 42, e13207. [Google Scholar] [CrossRef]
- STATISTICA. (Data Analysis Software System), Version 8.0; StatSoft Inc.: Tulsa, OK, USA, 2007.
- Jackson, J.E. A User’s Guide to Principal Components; John Wiley & Sons, Ltd.: New York, NY, USA, 1991; ISBN 0-471-62267-2. [Google Scholar]
- Larrigaudière, C.; Lentheric, I.; Puy, J.; Pintó, E. Biochemical Characterisation of Core Browning and Brown Heart Disorders in Pear by Multivariate Analysis. Postharvest Biol. Technol. 2004, 31, 29–39. [Google Scholar] [CrossRef]


| Variety | Drying Method | Bulk Density (g/mL) |
|---|---|---|
| Bonita | HAD | 0.9 d ± 0.1 |
| FD | 0.8 c ± 0.1 | |
| Bellevue | HAD | 0.8 c ± 0.1 |
| FD | 0.6 b ± 0.1 | |
| NP1648 | HAD | 0.5 a ± 0.1 |
| FD | 0.5 a ± 0.1 |
| Variety | Drying Method | WAC (g/g) | OAC (g/g) | SwP (g/g) | WS (%) |
|---|---|---|---|---|---|
| Bonita | HAD | 3.2 b ± 0.1 | 2.2 a ± 0.1 | 3.2 d ± 0.1 | 27.8 b ± 0.9 |
| FD | 2.6 a ± 0.0 | 2.5 b ± 0.1 | 2.7 a ± 0.1 | 26.4 ab ± 0.5 | |
| Bellevue | HAD | 3.2 b ± 0.1 | 2.2 a ± 0.1 | 3.6 e ± 0.1 | 37.0 c ± 0.5 |
| FD | 2.6 a ± 0.0 | 3.4 d ± 0.1 | 3.0 bc ± 0.1 | 39.5 c ± 1.2 | |
| NP1648 | HAD | 3.0 c ± 0.0 | 2.2 a ± 0.0 | 3.1 cd ± 0.1 | 24.4 a ± 2.0 |
| FD | 2.6 a ± 0.1 | 2.9 c ± 0.1 | 2.9 ab ± 0.1 | 23.9 a ± 0.3 |
| Variety | Drying Method | Foaming Capacity (%) | Foaming Stability (%) | Emulsifying Capacity (%) | Emulsifying Stability (%) |
|---|---|---|---|---|---|
| Bonita | HAD | 6.1 a ± 0.2 | 4.0 a ± 0.2 | 44.3 a ± 0.9 | 43.3 ab ± 1.5 |
| FD | 16.6 b ± 0.2 | 12.4 b ± 0.2 | 44.3 a ± 0.4 | 42.8 ab ± 0.4 | |
| Bellevue | HAD | 8.3 a ± 0.4 | 6.3 a ± 0.4 | 44.6 a ± 0.9 | 43.6 ab ± 0.9 |
| FD | 16.1 b ± 0.8 | 11.8 b ± 1.6 | 45.1 a ± 1.1 | 44.6 a ± 0.4 | |
| NP1648 | HAD | 10.1 a ± 0.1 | 6.0 a ± 0.1 | 43.3 a ± 0.8 | 41.4 b ± 0.3 |
| FD | 20.1 b ± 0.9 | 11.8 b ± 1.4 | 43.8 a ± 0.5 | 42.4 ab ± 1.5 |
| Variety | Drying Method | GT (°C) | LGC (%) |
|---|---|---|---|
| Bonita | HAD | 82.8 f ± 0.1 | 16 a ± 2 |
| FD | 80.6 d ± 0.1 | 16 a ± 2 | |
| Bellevue | HAD | 74.3 a ± 0.1 | 14 ab ± 2 |
| FD | 75.7 b ± 0.1 | 16 a ± 2 | |
| NP1648 | HAD | 78.5 c ± 0.1 | 10 b ± 2 |
| FD | 81.6 e ± 0.1 | 10 b ± 2 | |
| Commercial potato starch | HAD | 68.7 g ± 0.1 | - |
Disclaimer/Publisher’s Note: The statements, opinions and data contained in all publications are solely those of the individual author(s) and contributor(s) and not of MDPI and/or the editor(s). MDPI and/or the editor(s) disclaim responsibility for any injury to people or property resulting from any ideas, methods, instructions or products referred to in the content. |
© 2025 by the authors. Licensee MDPI, Basel, Switzerland. This article is an open access article distributed under the terms and conditions of the Creative Commons Attribution (CC BY) license (https://creativecommons.org/licenses/by/4.0/).
Share and Cite
Pereira, N.; Ramos, A.C.; Alves, M.; Alves, V.D.; Moldão, M.; Abreu, M. Physical and Functional Properties of Sweet Potato Flour: Influence of Variety and Drying Method. Molecules 2025, 30, 1846. https://doi.org/10.3390/molecules30081846
Pereira N, Ramos AC, Alves M, Alves VD, Moldão M, Abreu M. Physical and Functional Properties of Sweet Potato Flour: Influence of Variety and Drying Method. Molecules. 2025; 30(8):1846. https://doi.org/10.3390/molecules30081846
Chicago/Turabian StylePereira, Nelson, Ana Cristina Ramos, Marco Alves, Vítor D. Alves, Margarida Moldão, and Marta Abreu. 2025. "Physical and Functional Properties of Sweet Potato Flour: Influence of Variety and Drying Method" Molecules 30, no. 8: 1846. https://doi.org/10.3390/molecules30081846
APA StylePereira, N., Ramos, A. C., Alves, M., Alves, V. D., Moldão, M., & Abreu, M. (2025). Physical and Functional Properties of Sweet Potato Flour: Influence of Variety and Drying Method. Molecules, 30(8), 1846. https://doi.org/10.3390/molecules30081846