Abstract
Deep eutectic solvents (DESs) are environmentally friendly solvents formed by combining hydrogen bond donors and acceptors, resulting in a eutectic mixture with a lower melting point than the individual components. While there is extensive research on the electrochemical synthesis of platinum nanoparticles in DESs, to the best of our knowledge, there are no studies on the chemical reactivity of platinum(II) complexes in these systems. This study investigates the simple model reaction between K2PtCl4 and ethylenediamine (en), exploring the behaviour in DES environment, to optimize the synthesis of simple cisplatin-like platinum compounds with the potential objective of improving the traditional methods, decreasing the number of steps required for obtaining target compounds and reducing chemical waste. The reactions were performed in two hydrophilic DESs: choline chloride:glycerol 1:2 (glyceline, GL) and choline chloride:ethylene glycol 1:2 (ethaline, EG). The experiments, conducted in a 70% (v/v) DES and 30% 1:1 H2O/D2O mixture to allow for direct NMR analysis, revealed that en quickly formed [PtCl2(en)], which further reacted to produce [Pt(en)2]Cl2. Reaction products were characterised by 1D (1H and 195Pt{1H}) and 2D ([1H,13C]-HSQC and [1H,15N]-HSQC) NMR experiments. The discolouration of solutions, due to the consumption of K2PtCl4, and the precipitation of the purple Magnus salt [Pt(en)2][PtCl4] occurred over time. The main observed difference between the two solvent mixtures was the slower reactivity in glyceline, due to the much higher viscosity of the solution. Diffusion-ordered spectroscopy (DOSY) indicated lower water mobility in DES mixtures than pure water, with the reaction products closely associated with DES molecules.
1. Introduction
Deep Eutectic Solvents (DESs) are also known in the literature as Deep Eutectic Ionic Liquids (DEILs), Low Melting Mixtures (LMMs), or Low Transition Temperature Mixtures (LTTMs) [1]. They are usually obtained by combinations of two or more safe and inexpensive components which are a hydrogen bond acceptor (HBA), like halide salts, and a hydrogen bond donor (HBD) forming an eutectic mixture, that is a liquid at room temperature or slightly above, with a melting point lower than that of each individual component. The hydrogen bonding between, for example, a halide ion and the HBD moiety, is responsible for the decrease in the melting point of the mixture [2].
DESs share many characteristics with ionic liquids (ILs), including high thermal stability, low volatility, low vapour pressure, and tuneable polarity; however, ILs are usually expensive and nonbiodegradable, while DESs are typically inexpensive, biodegradable, non-toxic, and easier to prepare than ILs [3]. Furthermore, many ILs present some degree of toxicity [4]. In particular, the toxicity for the environment of imidazolium and pyridinium-based ILs is fully confirmed [5]. On the other hand, the natural and renewable origin of some components of DESs makes them promising candidates to replace toxic volatile organic solvents. Indeed, these eutectic mixtures have found use as green and bio-renewable solvents in many metal-catalysed organic reactions, like Pd-catalysed hydrogenation of organic compounds [6], Pd-catalysed aminocarbonylation of aryl iodide [7], or Pd-catalysed alkoxycarbonylation of aril iodides under gas-free conditions [8]. DESs were also applied as solvent to synthetize various nanostructured transition-metal materials [9].
While some attempts to investigate the chemical reactivity of platinum complexes was performed in ionic liquids [10,11,12], deep eutectic solvent have been mainly used as an environment for synthesising catalysts [13,14] and for metal extraction from different matrices [15]. Other examples of applications involve the selective separation and enrichment of platinum group metals (platinum, palladium, rhodium, iridium, ruthenium) [16], but to the best of our knowledge, no research is available on applications in the study of metal complexes’ synthesis and general reactivity. The lack of research on the subject prompted us to investigate the reactive behaviour of model compounds in green DESs. In fact, the typical synthetic procedure of anti-cancer platinum compounds in water solvents involves multiple steps, commonly including substitution of chloride ion with iodide, followed by removal of halogen ions through stoichiometric reaction with silver ions to afford precipitation of silver salts [17]. The non-traditional solvation behaviour and broad customisation of the reaction environment offered by DESs allow the development of tailored synthetic procedures so to avoid some of the aforementioned reaction steps. We therefore set out to study the synthesis of simple cisplatin-like platinum compounds (dichlorodiammine platinum) to assess the viability of certain low-footprint DESs for synthesis and explore the potential of the DES environment to streamline the synthesis process by reducing the number of steps required to obtain the target compounds, concurrently increasing the atom economy and reducing the need for disposal of chemical waste and/or recycling processes of metals with high energy costs. The hydrophilic DESs selected for the study were choline chloride:glycerol 1:2 (glyceline, GL) and choline chloride:ethylene glycol 1:2 (ethaline, EG).
2. Results
2.1. Behaviour and 1H NMR Spectroscopy of DES and Water Mixtures
NMR behaviour of choline chloride-glycerol (GL) and choline chloride-ethylene glycol (EG) DES mixtures added with various water percentages was previously studied. Water content affects the eutectic characteristics of DESs. Delso et al. [18] studied neat eutectic choline chloride (ChCl) based DESs and a mixture of DESs and different percentages of D2O (10% wt and 90% wt), detecting interactions among all species and finding that these ternary solvents still retain the eutectic character even when diluted at 10% wt. Ferreira et al. [19] studied ChCl/GLY 1:2 systems with added water (water contents ranging from 1 wt% to 70 wt%, using H2O and deuterated benzene as external standard), identifying three distinct water behaviour domains. Up to a water content of 11 wt%, water did not disrupt the DES structure; between water contents of 11 wt% and 35 wt%, the solvation of the DES components started to occur, but the DES nanostructure was still present. Hydrogen bond weakening was observed already at 5 wt% of water, while starting from 35 wt% of water, the DES structure itself is disrupted, with the system transitioning to a DES-in-water solution. Similar results on hydrogen bonding were reported for the choline chloride/ethylene glycol system by Gabriele et al. [20]. In our experimental conditions, the wt% of water was always lower than 28%; therefore it can be safely assumed that the solutions were in the intermediate case reported by Ferreira. 1H NMR spectra of GL and EG acquired with said D2O/H2O/DES mixture (1:1 H2O:D2O ratio) and the labelling of the corresponding DES components are reported in Figure 1. As previously reported by Ferreira, increasing the water content in mixtures causes a higher chemical exchange rate between water protons and hydroxyl of DESs [19]. Consequently, GL (Ha, He, and Hi) and EG (Ha′ and He′) signals were not detectable in our mixtures, while a single signal belonging to water resonated at 4.88 and 4.79 ppm, respectively, in the spectra of GL:water and EG:water mixture (Figure 1A,B). The chemical shifts obtained for the two ternary DES solutions were very similar to those previously reported [18,19]. Signals were broad, not allowing us to appreciate multiplicities. Except for the overlapping signals belonging to Hc (methylene group bounded to the choline nitrogen) and Hf (methylenes of the glycerol), other signals were well separated, with the following assigned chemical shifts: 4.03 ppm (Hb), 3.53 ppm (Hc), and 3.24 ppm (Hd) relative to choline, and 3.62–3.50 ppm (Hf) and 3.74 ppm (Hg) belonging to glycerol portion. A single water residual signal was found at δ = 4.88 ppm. Figure 1B shows the 1H NMR spectrum of EG, with the signals of choline assigned as follows: 4.04–4.03 ppm (Hb′), 3.58–3.56 ppm (Hc′), 3.25 ppm (Hd′). The ethylene glycol shows a single signal at 3.62–3.66 ppm (Hh′). The water protons resonate at 4.79 ppm.

Figure 1.
1H NMR spectra and chemical structures with atom labelling. (A) choline chloride-glycerol DES (GL); (B) choline chloride-ethylene glycol DES (EG). Lowercase blue (A) and green (B) letters near the structures were used to label the corresponding hydrogen signals in the spectra. Hydroxyl protons for both DESs are not detectable due to the chemical exchange with deuterated water.
2.2. Reactivity of K2PtCl4 with Ethylenediamine
Due to the lack of information about the reactivity of platinum(II) salts in DESs, we set out to investigate a simple model reaction between K2PtCl4 and ethylenediamine (en). The ethylenediamine bidentate ligand was preferred to perform the investigation, in place of two NH3 molecules (as those found in the clinically used antitumor drug cisplatin), to have readily available non-exchanging hydrogen atoms that could be tracked by 1H NMR spectroscopy.
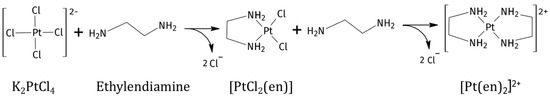
The reaction between K2PtCl4 and en in traditional solvents can afford the products [PtCl2(en)] and [Pt(en)2]Cl2, depending on relative reaction speeds and stoichiometry of the ligand (Scheme 1) [21,22]. In this case, the reaction was performed in the two DES:water mixtures both at 1:1 and 1:2 Pt/en ratios. The reaction products were characterised by 1H, [1H,13C]-HSQC, [1H,15N]-HSQC, and 195Pt{1H} NMR spectroscopy.
Scheme 1.
Reaction products of ethylenediamine to K2PtCl4 (K+ is omitted in the scheme for clarity).
2.3. Reactivity in Glyceline (Reaction 1)
The reaction between K2PtCl4 and en is normally performed under controlled conditions in water (low temperature and slow addition of reagents) [21] in order to obtain specifically the mono-addition product [PtCl2(en)] with a minimal amount of the double addition product [Pt(en)2]2+ as a side product; however in all DES:water solvents and under both stochiometric and en excess conditions, the reaction led to quick formation of [PtCl2(en)], followed by further reaction of an additional en moiety with the previously formed [PtCl2(en)] complex, affording [Pt(en)2]Cl2. Dissolved K2PtCl4 in both selected DESs made the solutions red-orange. As the reaction with en went on, K2PtCl4 was consumed, and we could observe discolouration of the solution, which turned transparent, the disappearance of [PtCl2(en)] peak in the spectra, and the unexpected precipitation of the previously described purple Magnus-type salt [Pt(en)2][PtCl4] [23].
2.3.1. 1H and 195Pt NMR Experiments (Reaction 1)
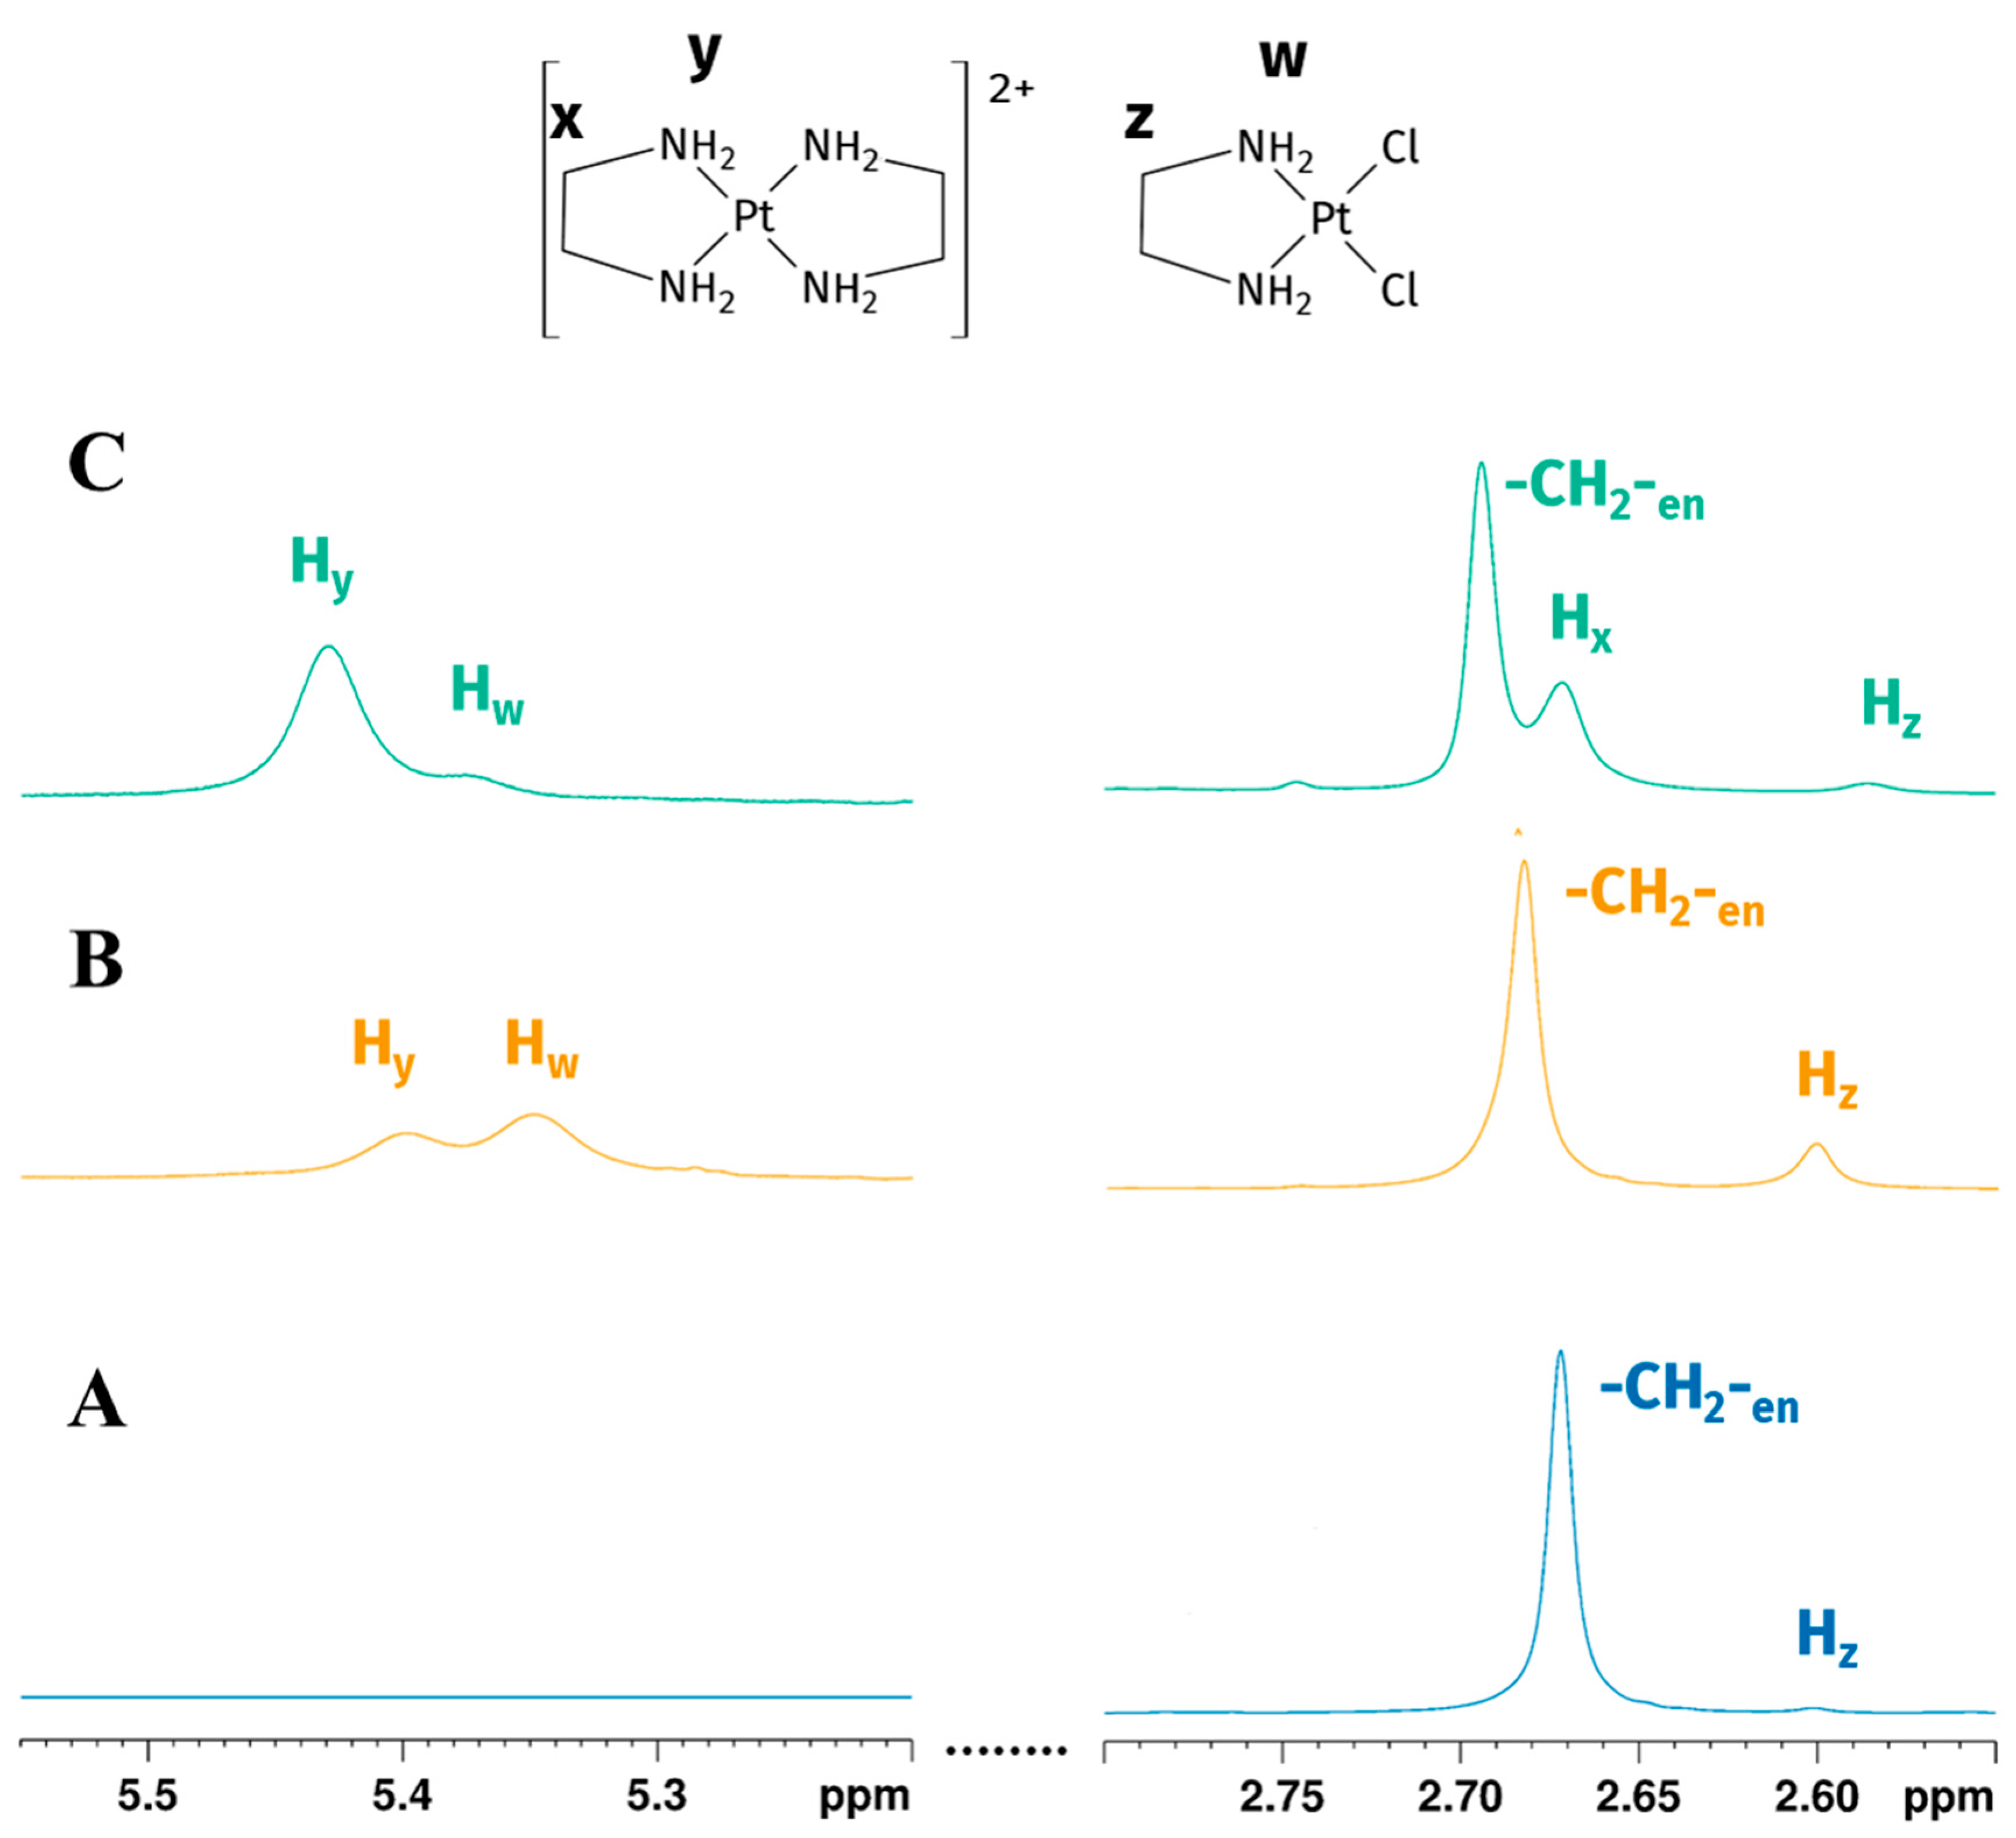
A 1:1 Pt-to-en reaction in GL:water 70:30% (v/v) mixture was performed under vigorous stirring conditions, obtaining a red-orange solution. 1H-NMR assignment of GL chemical shifts was performed according to the previously reported literature data [18,19]. Firstly, two peaks at 2.70 ppm and 2.58 ppm were observed (Figure 2A). Methylene signal of en in the reaction environment had the same chemical shift in 1H NMR spectrum of en in an EG:water 70:30% v/v solution, similar to the reported signal in water (at 2.65 ppm) [24]; methylene signals belonging to en following coordination to the metal centre resonated upfield, giving a shielded signal at 2.58 ppm [21]. Exchangeable -NH2 protons of en were not detected, possibly due to fast chemical exchange with deuterated water.
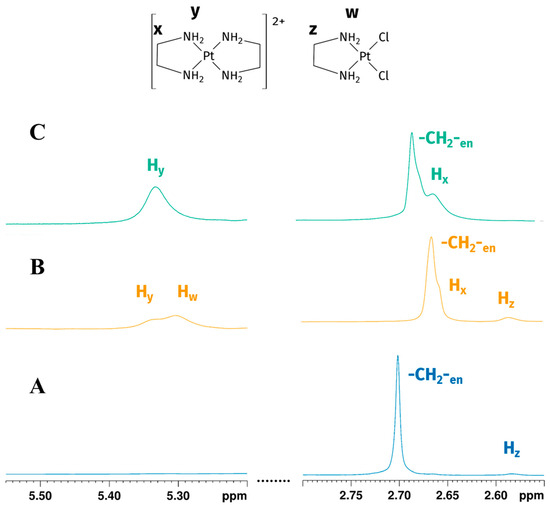
Figure 2.
Expansions of the 1H NMR spectrum of Reaction 1 in the GL:water mixture 70:30% v/v: (A) -CH2-en and Hz (-CH2- of [PtCl2(en)]) peaks at the beginning of the reaction show the early formation of mono-addiction product; (B) -CH2-en, Hz, Hw (-CH2- and -NH2 of [PtCl2(en)]) and Hx, Hy (-CH2- and -NH2 of [Pt(en)2]2+) peaks after four hours indicate the reaction goes on, reaching the formation of biscationic product; (C) -CH2-en and Hx, Hy (-CH2- and -NH2 of [Pt(en)2]2+) peaks 24 h later showing the consumption of [PtCl2(en)] (peaks are not to scale).
Four hours later we observed a partial consumption of en and the presence of new peaks, respectively, at 2.66, 5.31, and 5.34 ppm (Figure 2B). The two deshielded peaks on the left of the water signal (5.31 and 5.34 ppm) are characteristic of -NH2 coordinated with platinum(II) [25]. To further confirm the coordination of en, 195Pt-NMR experiments were performed.
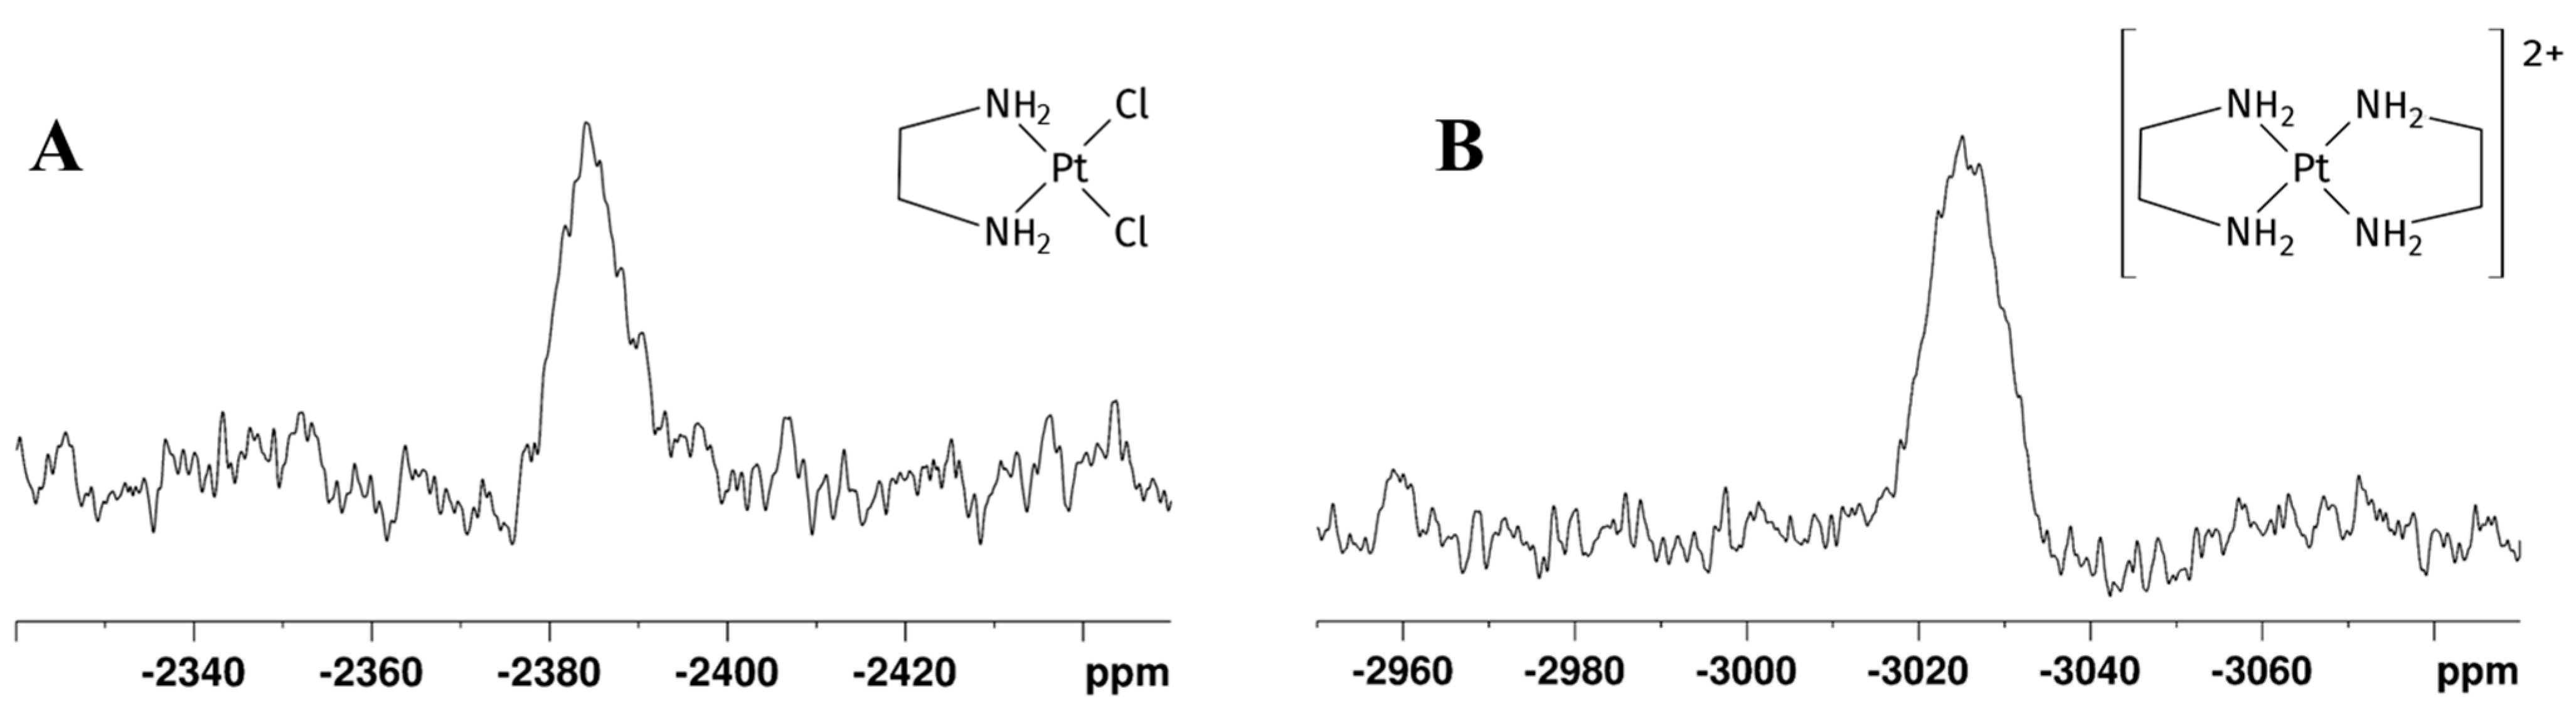
195Pt chemical shielding has a wide range of values, depending on the oxidation state of the metal, on the nature of all coordinated ligands (element and oxidation state) and, to a minor extent, on the solvation. In particular, for a given oxidation state, the 195Pt chemical shift is highly diagnostic of the molecular structure of the complex, with each ligand giving a predictable contribution to the value of the complex chemical shift [26,27]. δPt for Pt(II) complexes change according with spectroscopical ordering of 195Pt shielding Cl > NO2 > NH3 > Br > en > SCN > CN > I [26]. In GL:water 70:30% (v/v) K2PtCl4 showed a peak at −1560 ppm, which appeared slightly deshielded compared to that observed in D2O (−1617 ppm) [28]. This deshielding effect is smaller compared to the differences in chemical shifts reported for various other organic solvents [27]. The substitution of two chloride ligands by one en molecule gave rise to [PtCl2(en)], whose signal appears more shielded than the signal belonging to K2PtCl4 and was observed at −2384 ppm (Figure 3A), in agreement with a PtN2Cl2 coordination sphere. Due to the low solubility of [PtCl2(en)] in water, the chemical shifts could not be directly compared; nevertheless, this species was reported at −2345 ppm in DMSO-d6 [29]. This allowed us to assign the protons belonging to -CH2-(Hz) and -NH2 (Hw) of the mono-addition product at 2.58 and 5.31 ppm, respectively. After 24 h, the 1H spectrum showed the disappearance of the [PtCl2(en)] peak, a residual free -CH2- en peak at 2.67 ppm, and two unassigned peaks at 2.66 and 5.34 ppm (Figure 2C). Full 1H NMR stacked spectra for the reaction are reported in Figure S1 in Supplementary Materials.
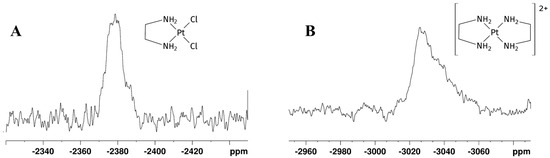
Figure 3.
195Pt NMR spectra recorded after 24 h on the mother solution of the reaction reported in Scheme 1 performed in GL:water 70:30% v/v mixture showing (A) [PtCl2(en)] and (B) [Pt(en)2]2+ peaks. The detected δ(195Pt) [PtCl2(en)] = −2384 ppm, δ(195Pt) [Pt(en)2]2+ = −3030 ppm.
A further 195Pt experiment showed a new shielded signal at −3030 ppm (Figure 3B), typical of a PtN4 coordination sphere, confirming coordination of another en moiety to [PtCl2(en)], affording [Pt(en)2]Cl2. The chemical shift of [Pt(en)2]Cl2 was previously reported at −3015 ppm in D2O [26].
This allowed us to confirm the assignment of the two peaks at 2.66 and 5.34 in the 1H-NMR spectrum, respectively, to -CH2- (Hx) and -NH2 (Hy) of bis-cationic product.
Concurrently, the discolouration of the solution was observed, along with the precipitation of a purple Magnus-type salt ([Pt(en)2][PtCl4]), in agreement with the consumption of the coloured K2PtCl4 species, as further confirmed by the disappearance of the corresponding peak in the 195Pt spectrum [23,30].
2.3.2. [1H,13C]-HSQC and [1H,15N]-HSQC NMR Experiments (Reaction 1)
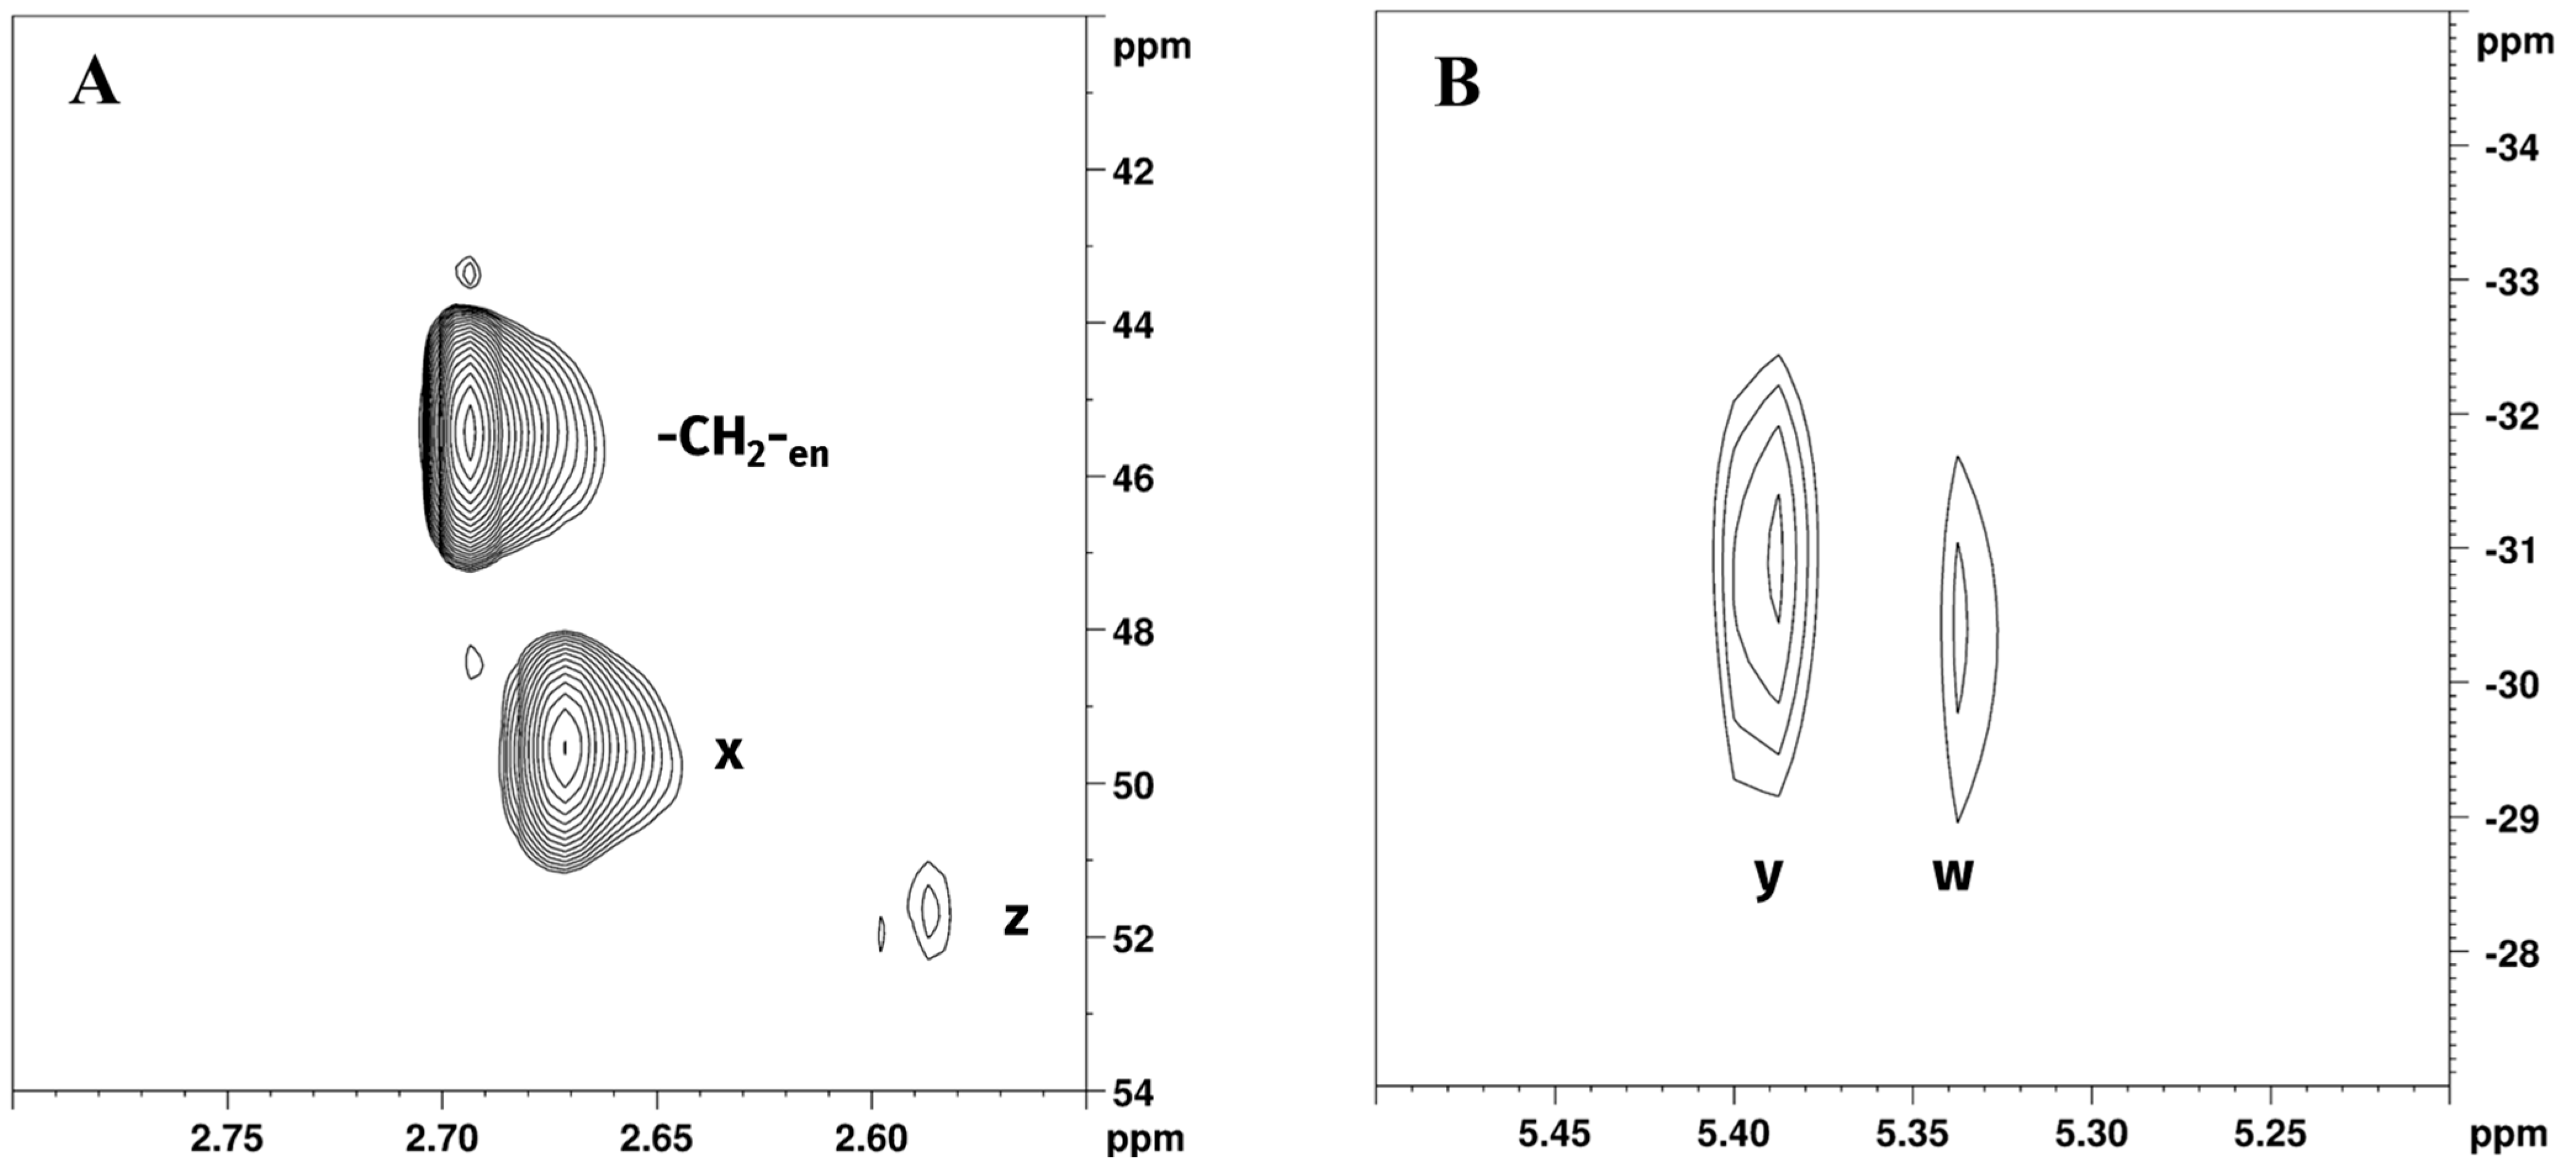
[1H,13C]-HSQC and [1H,15N]-HSQC NMR spectra (Figure 4), acquired in the following 4 h, were used to further characterise reaction products, and data are reported in Table 1.

Figure 4.
Expansions of (A) [1H,13C]-HSQC and (B) [1H,15N]-HSQC NMR spectra of Reaction 1 in GL:water 70:30% v/v mixture showing -CH2-en; z, w (-CH2- and -NH2 of [PtCl2(en)]) and x, y (-CH2- and -NH2 of [Pt(en)2]2+) peaks.

Table 1.
Chemical shift (δ, ppm) values for free ethylenediamine and reaction products in GL:water 70:30% v/v mixture, obtained from [1H,13C]-HSQC and [1H,15N]-HSQC NMR experiments.
Chemical shift assignments were made on the basis of previously obtained results from the 1H and 195Pt spectra. Expansion of [1H,13C]-HSQC NMR spectrum of Reaction 1 in GL:water solution 70:30% v/v (Figure 4A) showed cross peaks at 2.68/45.90 ppm, belonging to -CH2- of free en, 2.65/49.14, and 2.57/51.21 ppm corresponding to [Pt(en)2]2+ and [PtCl2(en)], respectively. This allowed us to resolve the partially overlapping 1H NMR signals of -CH2-en and Hx (-CH2- of [Pt(en)2]2+), reported in Figure 2B. Figure 4B shows the expansion of the [1H,15N]-HSQC NMR spectrum for Reaction 1 in GL:water solution 70:30% v/v. As previously noted, the coordination of amine to Pt(II) results in a characteristic upfield shift of 15N signals compared to free amines; moreover, the degree of shielding shows a characteristic dependence on ligand trans to the nitrogen atom [31]. Peaks at 5.39/−31.37 and 5.41/−31.42, were assigned to [PtCl2(en)] and [Pt(en)2]2+, respectively. These data are consistent with previously reported 15N chemical shift of ethylenediamine coordinated to Pt, in which -NH2 signals trans to N are found at −33.0 and −30.5 ppm [32]. Exchangeable -NH2 protons belonging to free en were not detected in [1H,15N]-HSQC NMR, possibly due to fast chemical exchange with deuterated water.
Following the consumption of K2PtCl4 through the formation of the Magnus-type salt, free ethylenediamine and [Pt(en)2]Cl2 could be detected in the solution for 30 days at 7 °C through 1H and [1H,13C]-HSQC NMR (Figure S3A).
The reaction between K2PtCl4 and en was repeated using a 1:2 ratio between the reagents: no significant differences were observed in the appearance of the products or the consumption of K2PtCl4. Discolouration of the solution was observed after 24 h also under these experimental conditions.
2.3.3. DOSY and T1 Experiments (Reaction 1)
Diffusion ordered spectroscopy (DOSY) experiments, measuring the diffusion coefficient D, and inversion recovery experiments, measuring spin–lattice relaxation time T1, were performed to obtain information about, respectively, molecular mobility and interactions with the solvation environment of choline chloride, glycerol, water, free en, and reaction products (Figure 5A,B). Corresponding fitted diffusion coefficients and T1 values are reported in Table 2.
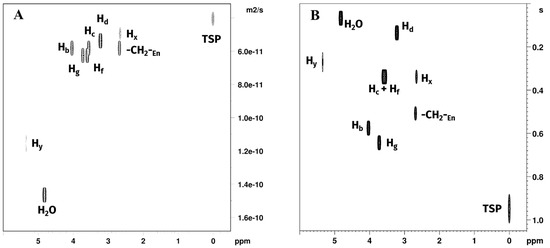
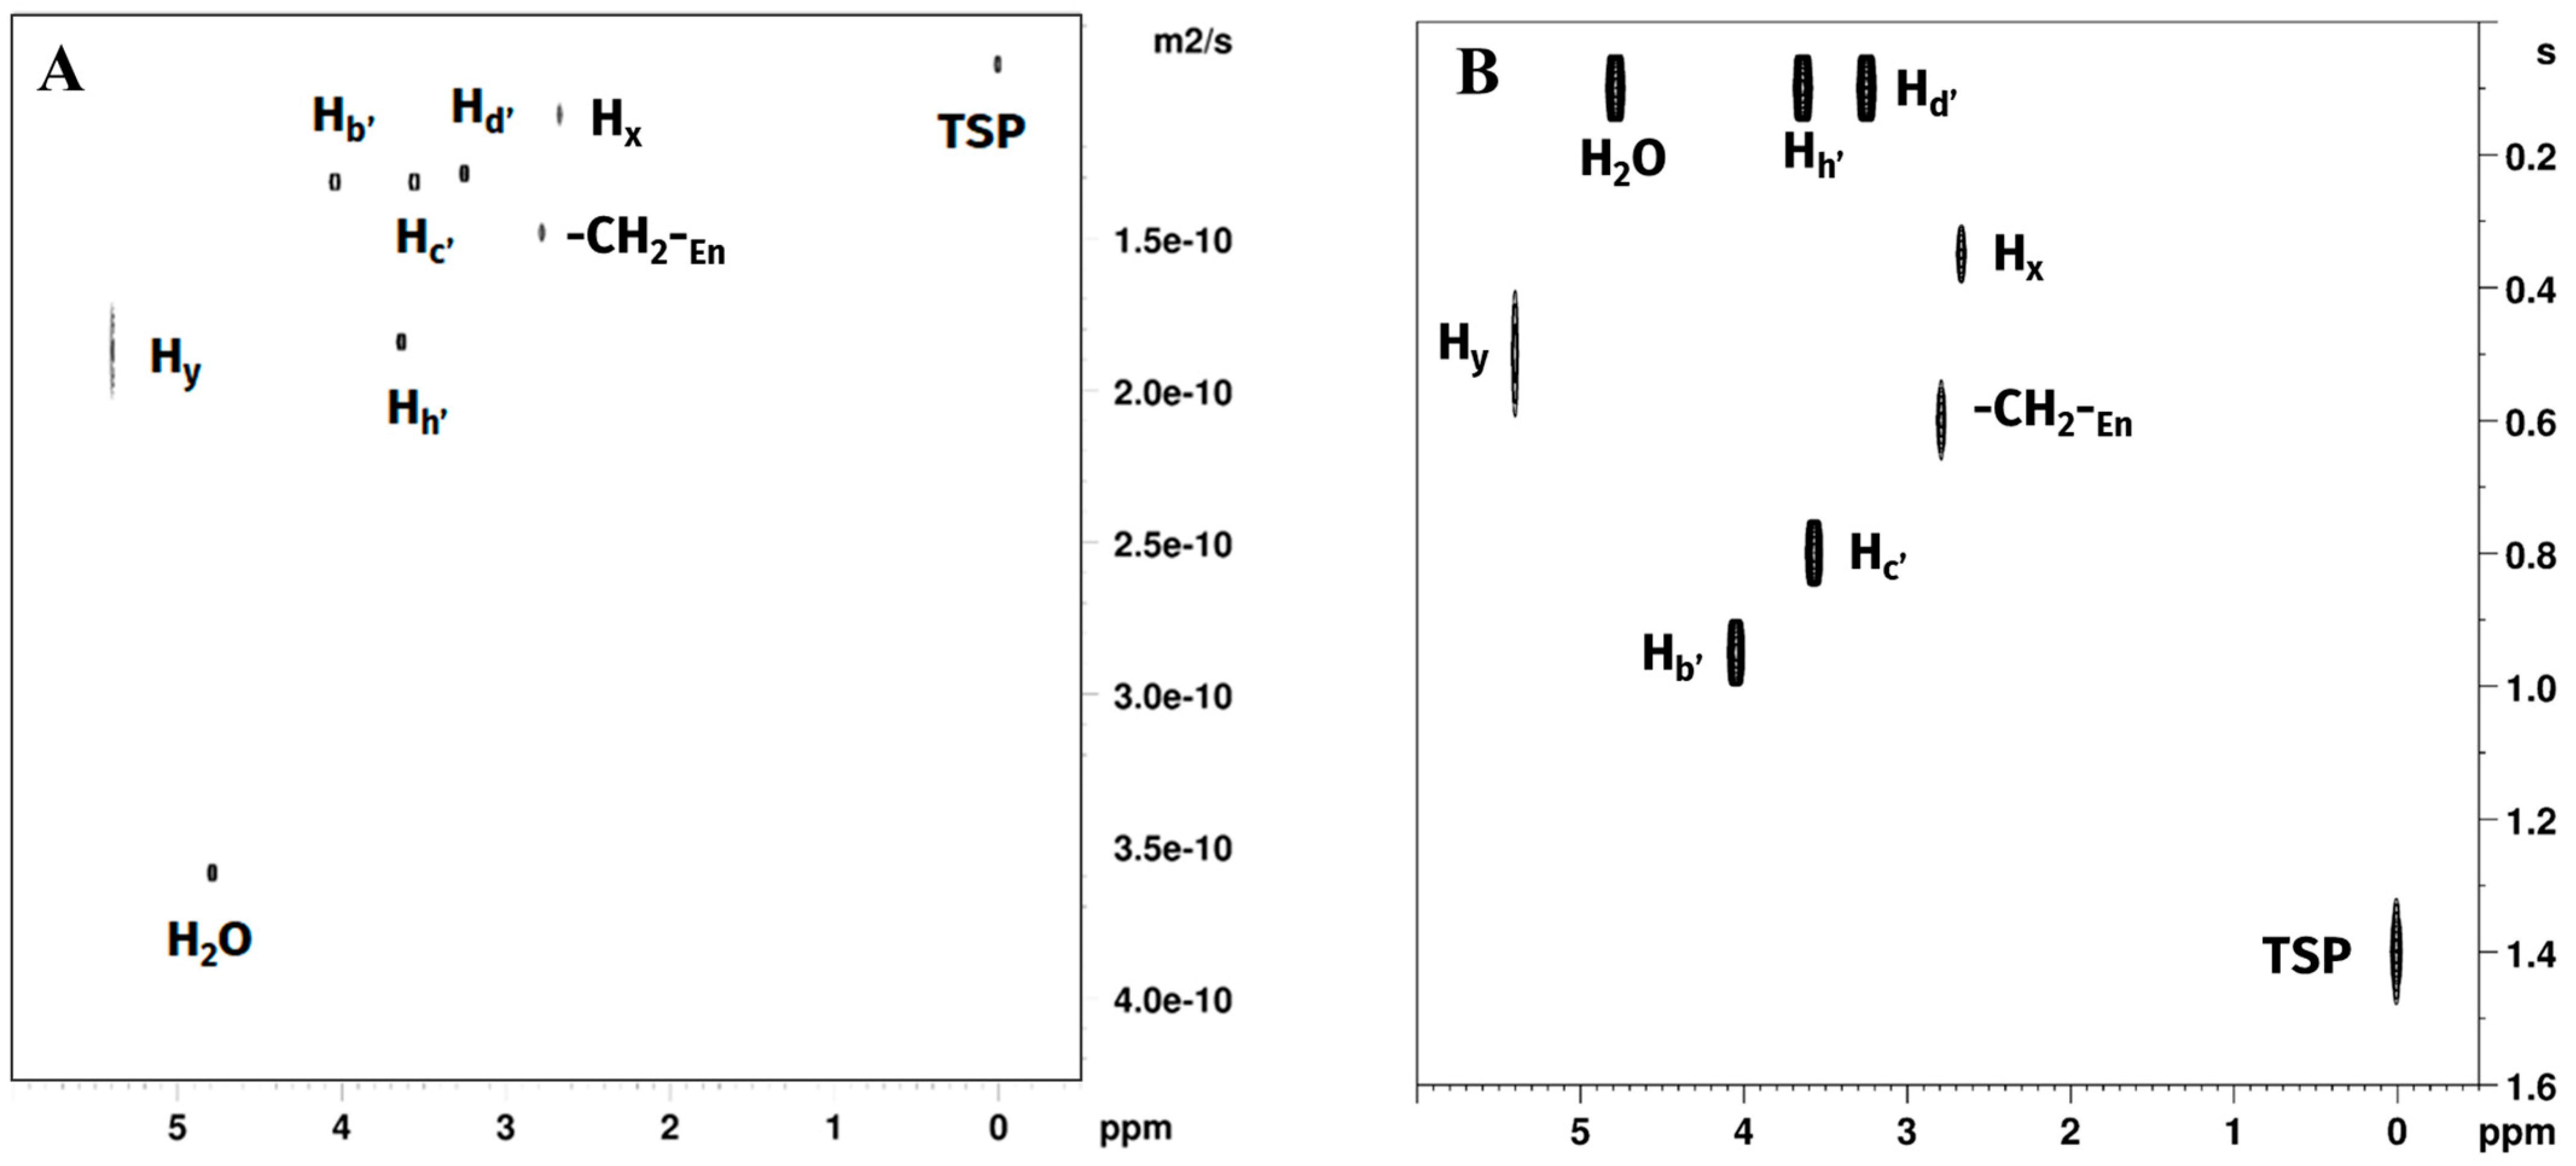
Figure 5.
Plots of (A) DOSY and (B) T1 relaxation time experiments of Reaction 1 in GL:water 70:30% (v/v) mixture showing signals belonging to water, GL, TSP, free en and [Pt(en)2]2+. [PtCl2(en)] was not observed due to rapid consumption in the reaction environment.
Table 2.
Diffusion coefficient and T1 relaxation time values obtained in GL:water 70:30% (v/v) mixture. n.d. signal to noise ratio too low for the fitting.
Since [PtCl2(en)] was rapidly consumed in the reaction environment, a separately synthesized [PtCl2(en)] standard was added to the GL:water mixture 70:30% v/v to measure its diffusion coefficient and relaxation time in the mixture, following reaction completion.
Diffusion coefficients measured for choline chloride and glycerol hydrogen atoms were all close to each other (~0.5 × 10⁻¹⁰ m2/s), with slightly higher values for glycerol Hf and Hg (~0.55 × 10⁻¹⁰ m2/s), indicating a marginally higher mobility of glycerol in the solution. Water molecules diffusion coefficient was more than twice greater than those measured for the DES components, indicating comparatively higher mobility of the water in the mixture, while still being more than one order of magnitude smaller than the one observed in pure water (DH2O = 2.19 × 10⁻⁹ m2·s−1) [33]. The non-labile CH2 protons of en showed diffusion coefficients closer to those measured for the DES components, with the non-coordinated en being the fastest moving (D = 0.52 × 10⁻¹⁰ m2/s), with a diffusion coefficient greater than choline chloride but smaller than glycerol, followed in order by [PtCl2(en)] (Hz) and [Pt(en)2]2+ (Hx). Both the complexes showed a lower D than any component of the DES. The -NH2 protons of [PtCl2(en)] (Hw) and [Pt(en)2]2+ (Hy) both showed a D higher than 1.0 × 10⁻¹⁰ m2/s, due to significant exchange with water.
T1 values are the time constants measuring the speed of the process by which nuclear spins return to thermal equilibrium with their surrounding environment following excitation by an external radiofrequency pulse [34]. T1 values are in general correlated with the temperature of the sample, the external applied magnetic field, and the speed of molecular motion (molecular tumbling) in a non-linear fashion. Moreover, in a specific sample, T1 values for different nuclei in different molecules depend on their specific dipolar interactions, due to the solvation environment and the molecular environment. In the case of choline, the observed order of T1 was Hd < Hc < Hb, with the fastest relaxation observed for the methyl and methylene groups bound to the quadrupolar nitrogen atom and in order of the amount of steric interaction. The slowest relaxation was observed for the CH2OH non-labile protons, which are expected to be the less mobile part of the molecule, being involved in the hydrogen bonding of the DES. In the case of glycerol, the terminal CH2OH Hf showed a faster relaxation than the Hg. Ethylenediamine CH2 T1 were in the following order: Hz of [PtCl2(en)] < Hx of [Pt(en)2]2+ < free en. This appears consistent with the coordination to platinum, and with a molecular environment of [Pt(en)Cl2] more exposed to dipolar interactions. T1 value for Hy (-NH2 of [Pt(en)2]2+) was slightly faster than the value obtained for Hx. Hw (-NH2 of [PtCl2(en)]) fitting was not possible due to a very low signal-to-noise ratio.
2.4. Reactivity in Ethaline (Reaction 2)
2.4.1. 1H and 195Pt NMR Experiments (Reaction 2)
As in the previous case, 1:1 and 1:2 Pt-to-en reactions in EG:water 70:30% (v/v) mixture were performed under vigorous stirring condition, obtaining a red-orange solution. 1H-NMR assignment of EG chemical shifts, were in good agreement with previous reports in the literature [15].
For both Pt-to-en ratios, initially signals belonging to -CH2- of free en at 2.67 ppm were observed, followed by the appearance Hz (-CH2-) of [PtCl2(en)] at 2.60 ppm (Figure 6A). Exchangeable -NH2 protons belonging to en were not detected by 1H NMR. Methylene signal of en in the reaction environment showed the same chemical shift in 1H NMR spectrum of en in an EG:water 70:30% v/v solution. 1H NMR spectrum acquired 1 h later still showed -CH2- of free en at 2.68 ppm and Hz (-CH2-) of [PtCl2(en)] at 2.60 ppm. Moreover Hw (-NH2) of [PtCl2(en)] and Hy (-NH2) of [Pt(en)2]Cl2 started to be detectable at 5.35 ppm and 5.42 ppm, respectively (Figure 6B). The signal of Hx (-CH2-) of [Pt(en)2]Cl2 could not be singled out, due to overlapping with the free en signal. Twenty-four hours later, as the consumption of en continued, Hx and Hy signals of [Pt(en)2]Cl2 were observed, respectively, at 2.68 and 5.42 ppm, while -CH2- of free en, Hz and Hw could still be detected in the solution at 2.69, 2.60, and 5.35 ppm, respectively (Figure 6C). Full 1H NMR stacked spectra for the reaction are reported in Figure S2 in Supplementary Materials.
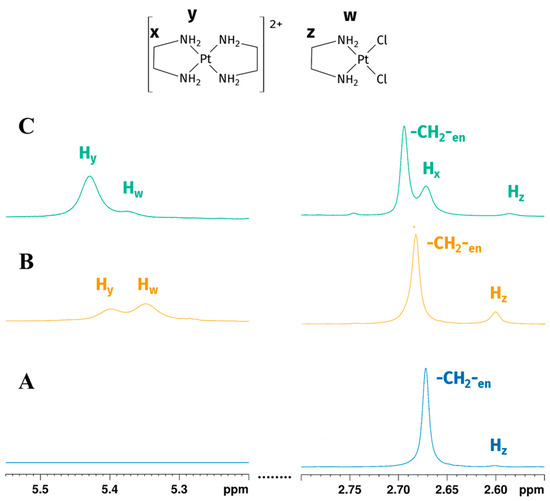
Figure 6.
Expansions of the 1H NMR spectrum of Reaction 2 in the EG:water mixture 70:30% v/v: (A) -CH2-en and Hz (-CH2- of [PtCl2(en)]) peaks at the beginning of the reaction show the early formation of mono-addiction product; (B) -CH2-en, Hz, Hw (-CH2- and -NH2 of [PtCl2(en)]) and Hy (-NH2 of [Pt(en)2]2+) peaks after one hour (Hx signals overlaps with -CH2-en) indicate the reaction goes on, reaching the formation of biscationic product; (C) -CH2-en, Hz, Hw (-CH2- and -NH2 of [PtCl2(en)]) and Hx, Hy (-CH2- and -NH2 of [Pt(en)2]2+) peaks, acquired 24 h later, show the partial consumption of [PtCl2(en)] (peaks are not to scale).
Also in this case, for both reagent ratios, we observed the precipitation of Magnus-type salt and the nearly total discolouration of the solution within 24 h. These changes resulted faster than those observed in the GL:water solution.
In the 195Pt NMR spectra, the K2PtCl4 signal was observed at −1561 ppm, and the [PtCl2(en)] signal at −2380 ppm. As previously mentioned for Reaction 1, also in Reaction 2 we observed the shielding of [PtCl2(en)] signal at −2380 ppm, following the substitution of two chlorido ligands with one en molecule. The negligible difference with the chemical shifts observed in glyceline suggests a roughly comparable solvation environment for the complexes in the two ternary mixtures. Although [Pt(en)2]Cl2 signals were detected in 1H spectrum acquired after 1 h, they were not detected early in the 195Pt-NMR spectrum. 195Pt-NMR spectrum acquired 48 h later confirmed the complete K2PtCl4 and [PtCl2(en)] consumption and the coordination of another en moiety to metal centre in order to obtain [Pt(en)2]Cl2, whose signal appeared furtherly shielded at −3028 ppm. Peaks for the two products are reported in Figure 7.
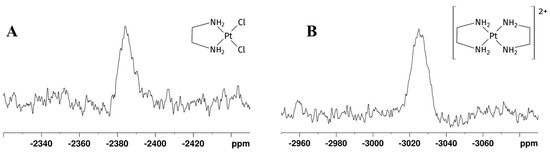
Figure 7.
195Pt NMR spectra of Reaction 1 in EG:water 70:30% v/v mixture showing (A) [Pt(en)2]2+ and (B) [PtCl2(en)] peaks. δ(195Pt) for [PtCl2(en)] = −2386 ppm, [Pt(en)2]Cl2 = −3028 ppm.
2.4.2. [1H,13C]-HSQC and [1H,15N]-HSQC NMR Experiments (Reaction 2)
[1H,13C]-HSQC and [1H,15N]-HSQC NMR (Figure 8) spectra were used to further characterize reaction products. All chemical shift assignments are summarised in Table 3. Chemical shifts assignments were made on the basis of previously obtained results from the 1H and 195Pt spectra and resulted similar to those obtained from Reaction 1 in GL:water 70:30% v/v mixture.
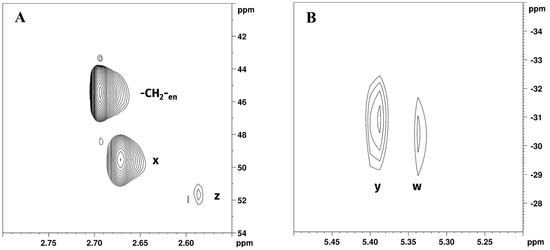
Figure 8.
Expansions of (A) [1H,13C]-HSQC and (B) [1H,15N]-HSQC NMR spectra of Reaction 2 in EG:water 70:30% v/v mixture showing -CH2-en; z, w (-CH2- and -NH2 of [PtCl2(en)]) and x, y (-CH2- and -NH2 of [Pt(en)2]2+) peaks.
Table 3.
Chemical shift values (ppm) for free en and reaction products in EG:water 70:30% v/v mixture obtained from [1H,13C]-HSQC and [1H,15N]-HSQC NMR experiments.
Expansion of [1H,13C]-HSQC NMR spectrum of Reaction 2 in EG:water solution 70:30% v/v (Figure 8A) showed cross peaks at 2.69/45.44 ppm, belonging to -CH2- of free en (further confirmed by [1H,13C]-HSQC NMR of en in EG:water mixture 70:30% v/v, found at 2.67/45.36 ppm), 2.67/49.53, and 2.58/51.76 corresponding to [Pt(en)2]2+ and [PtCl2(en)], respectively. Expansion of the [1H,15N]-HSQC NMR spectrum of Reaction 2 in EG:water solution 70:30% v/v is reported in Figure 8B. Peaks at 5.34/−30.44 and 5.40/−30.93 corresponded to [PtCl2(en)] and [Pt(en)2]2+, respectively. Exchangeable -NH2 protons belonging to en were not detected in [1H,15N]-HSQC NMR.
Free ethylenediamine and [Pt(en)2]Cl2 could be detected in the solution 30 days later at 7 °C through 1H and [1H,13C]-HSQC NMR, while [PtCl2(en)] resulted completely consumed (Figure S3B).
2.4.3. DOSY and T1 Experiments (Reaction 2)
DOSY experiments measuring mobilities and inversion recovery experiments measuring T1 relaxation times of the solution environment after reaction completion are reported in Figure 9A,B. Fitted diffusion coefficients and T1 values are reported in Table 4.
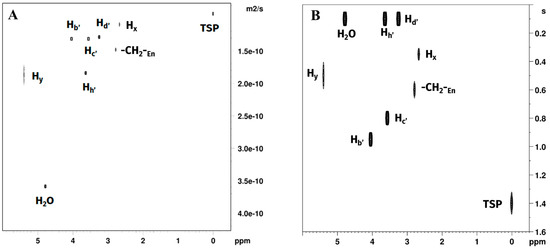
Figure 9.
Plots of (A) DOSY and (B) T1 relaxation time experiments on the reaction products in EG:water 70:30 % v/v mixtures showing signals belonging to water, EG, TSP, free en and [Pt(en)2]2+. [PtCl2(en)] was not observed due to rapid consumption in the reaction environment.
Table 4.
Diffusion coefficient and T1 relaxation time values obtained in EG:water 70:30% v/v mixture. n.d. signal to noise ratio too low for the fitting.
Diffusion coefficients for the choline chloride non-labile hydrogens were (~1.25 × 10⁻¹⁰ m2/s) significantly smaller than those observed ethylene glycol Hh′ (1.78 × 10⁻¹⁰ m2/s), indicating a relatively higher mobility of the polyol in the solution. Water molecules diffusion coefficient was approximately twice as high as the one of DES components, indicating a relatively high motion of the water in the mixture (D = 3.57 × 10⁻¹⁰ m2·s−1), although still not comparable to the values observed in pure water (DH2O = 2.19 × 10⁻⁹ m2·s−1) [33]. The non-labile CH2 protons of en coordinated to platinum showed diffusion coefficients smaller than those measured for any of the DES components (~1.0 × 10⁻¹⁰ m2/s, with [PtCl2(en)] (Hx) > [Pt(en)2]2+ (Hz)), while the non-coordinated en appeared to be faster (D = 1.41 × 10⁻¹⁰ m2/s) than choline chloride but slower than ethylene glycol. Diffusion coefficient values for the exchangeable -NH2 protons were both higher than those observed for the non-labile protons of the same species but concurrently lower than the one measured for water, indicating a slower exchange rate and possibly a higher interaction of the complex with the components of the DES. This seems to be the case particularly for [Pt(en)2]2+ (Hy), having DHy = 1.78 × 10⁻¹⁰ m2/s, a value compatible with the measured mobility of ethylene glycol.
T1 values for choline were observed in the order Hd′ < Hc′ < Hb′, with the fastest relaxation observed for the methyl and methylene groups bound to the quadrupolar nitrogen atom and in order of amount of steric interaction. The slowest relaxation time was observed for the -CH2OH non-labile protons, expected to be the less mobile part of the molecule, being involved in the hydrogen bonding of the DES. Moreover, the methyl groups have a significantly shorter T1 than the rest of the atoms of choline, suggesting an environment more susceptible to dipolar interaction. Even the terminal -CH2OH Hh′ showed a very short T1, comparable to the one observed for water in this system. This seems to indicate a solution divided in two environments, one shared by ethylene glycol, water, and the methyl groups of choline, and another one allowing less dipolar interactions, containing the hydroxyethyl group of choline. Moreover, in the EG:water system ethylenediamine CH2 T1 observed values were in the order Hx < Hz < free en. This appears consistent with the coordination to platinum, and with the more crowded molecular environment of [Pt(en)2]Cl2. Interestingly, the T1 values of the complexes did not show changes of one order of magnitude as those shown by choline, suggesting minor adjustments in the solvation environments. The effect observed, however, appears to be more significant on [PtCl2(en)]. Considering that all molecules are of small size and can be expected to be affected similarly by changes in viscosity of the solution, this effect could be attributed to specific solvation changes for the neutral species. T1 values for Hy (-NH2 of [Pt(en)2]2+) were smaller than those obtained for Hx. We were not able to detect Hw (-NH2 of [PtCl2(en)]) due to low signal-to-noise ratio.
2.5. Comparison of the Hydrogen Bond Donors Glycerol and Ehtylene Glycol
In both DES:water mixtures, and for both stochiometric and en excess conditions, the reaction led to the rapid formation of [PtCl2(en)], followed a few hours later by further reaction of an additional en moiety with the previously formed [PtCl2(en)] complex, affording [Pt(en)2]Cl2. In the GL:water mixture the complete consumption of [PtCl2(en)] was observed after 24 h, while in the EG:water mixture, the unreacted complex was still detected by 1H-NMR at the same time. The K2PtCl4 dissolved in water afforded a red-orange solution when mixed in both selected DESs. As the reaction with en goes on, K2PtCl4 is consumed, and discolouration of the solution is more rapid (within 24 h) in the EG:water mixture. Concurrently, the solutions became transparent, with the disappearance of the [PtCl2(en)] peaks in the spectra and the unexpected precipitation of the purple Magnus-type salt [Pt(en)2][PtCl4] [23].
For both DES:water solutions in 1H NMR spectra Hw and Hy peaks were found deshielded with respect to the water signal, indicating the coordination of en to platinum [25] while -CH2-en, Hx, and Hz peaks are shielded with respect to DESs signals. [1H,13C]-HSQC allowed us to resolve the overlapping signals belonging to Hx and -CH2-en. In 195Pt experiments, one signal for each of the reaction products was observed. Even though the 195Pt resonance window is very large (~15,000 ppm), NMR signals are very sensitive to the chemical environment; therefore, substituting even very similar ligands can change chemical shifts in the order of hundreds of ppm, allowing us to easily monitor reactions [28]. Among the factors that affect 195Pt chemical shifts, the solvent used in 195Pt-NMR spectroscopy can also significantly influence the δPt value [35]. In this set of experiments, the δ values obtained from 195Pt experiments resulted very similar in both DES:water mixtures (Table 5). Given the significant dependence of 195Pt chemical shifts on the solvation environment [27,36], this suggests similarity in the solvation environment of K2PtCl4 and the products in the two DES:water solutions. These can be compared to the 195Pt δ obtained for the same species in traditional solvents, also reported in Table 5.
Table 5.
195Pt NMR chemical shifts for the complexes in DES and traditional solvents. [PtCl2(en)] NMR data are reported for DMSO solution since the complex is insoluble in water.
In both cases water content changed the viscosity of DESs, affecting the Pt(II) salt reactivity. In GL–water mixture we observed the quick formation of [PtCl2(en)] followed a few hours later by the formation of [Pt(en)2]Cl2. Twenty-four hours later we were not able to observe the [PtCl2(en)] peak in 1H and 195Pt spectra, due to the complete consumption of mono-addition product.
In EG–water mixture, after the rapid formation of [PtCl2(en)], we observed formation of [Pt(en)2]Cl2 in the following few hours. However, the consumption of [PtCl2(en)] resulted slower than in GL:water and peaks still resulted present in 1H and 195Pt spectra 24 h later.
In both DES:water solutions kept for 30 days at 7 °C, free ethylenediamine and [Pt(en)2]Cl2 could still be observed, while the mono-addition product signal was absent, due to its complete consumption. In the reactions carried out in both DES:water mixtures, [Pt(en)2]Cl2 further reacted with K2PtCl4 leading to the formation and precipitation of a purple Magnus-type salt, while en remained associated with DES. In the 1:1 Pt-to-en ratio reactions, the residual free en could be explained by its strong association with DESs, shown by DOSY experiments, making it unavailable for further reaction. The observed discolouration of the solution due to consumption of PtCl42− could also be dependent on the partial inclusion of the anions within the precipitate.
Some differences also occurred in the formation of the Magnus-type salt. Due to the intrinsic higher viscosity of glyceline than ethaline DESs (ηGL = 199.00 mPa·s; ηEG = 30.90 mPa·s at 308.15 K for pure DES solution [37,38]), the bis-cationic product and residue K2PtCl4 had lower mobility, resulting in a slower formation of the purple Magnus-type salt, while in EG:water mixture the higher mobility of [Pt(en)2]Cl2 promoted slightly faster formation of Magnus salt. In en excess conditions for both DESs, we observed both the precipitation of Magnus salt and the precipitation of [Pt(en)2]Cl2 in the form of white needles, after following a long storage of the NMR tubes in the fridge at 7 °C.
Differences in diffusion coefficient (D) values obtained from NMR experiments depend on molecular sizes and shapes, temperature, and solvent viscosity, according to the Stokes–Einstein equation [39]. DOSY experiments gave comparable results. Diffusion coefficients obtained for water molecules in both DES:water solutions (Dwt-GL = 1.21 × 10⁻¹⁰ m2·s−1, Dwt-EG = 3.57 × 10⁻¹⁰ m2·s−1) were much lower than those measured in pure water (DH2O = 2.19 × 10⁻⁹ m2·s−1) [33]. In both solutions, as expected based on molecular weight and size, the mobility of DES components resulted in much lower than water mobility. The free ethylenediamine and the platinum complexes had similar diffusion coefficient values, closer to those measured for the DES components than those of water. TSP resulted in both mixtures being the less mobile species. The two peaks of exchangeable Hw (-NH2 of [Pt(en)2]Cl2) and Hy (-NH2 of [Pt(en)2]Cl2) nuclei showed intermediate diffusion coefficients. Consistently with the lower viscosity of EG:water solution, all molecules had higher mobility in this mixture than in GL:water solution (Table 2 and Table 4). The water diffusion coefficient obtained in EG:water solution was approximately three times greater than those obtained in GL:water solution. Choline chloride mobility in EG:water mixture was nearly 2.5 times greater than the one observed in GL:water. In both solvents, choline chloride signals resulted closely associated with their respective hydrogen bond donors. Diffusion coefficients measured for free en and reaction products were nearly two times higher in the EG:water mixture.
For small rapidly tumbling molecules, faster motions correspond to slower T1 relaxation times [40]. The experiments performed showed comparable behaviour for both DES:water solutions. While water content reduces the viscosity of both DESs [19,41], the ternary mixtures maintain higher viscosity compared to pure water. Thus water molecules in both mixtures are more affected by the lattice and have a higher tumbling rate, consistently with T1 relaxation times (T1wt-GL = 0.05 s, T1wt-EG = 0.07 s) shorter than those measured in pure water (T1wt = 4.96 s) [42].
Choline chloride methyl protons (Hd and Hd′) in both DESs relaxed at a rate close to the one displayed by water molecules. As reported in Table 3 and Table 4, T1 values obtained for other DES signals, TSP, reaction products, and free en were generally shorter in the GL:water mixture than in the EG:water mixture. In both solutions, TSP showed a long relaxation time, due to more limited interactions with the environment, consistently with the low mobility observed in both GL:water and EG:water solutions.
3. Materials and Methods
3.1. Starting Materials
Ethylenediamine (en) was purchased from Alfa Aesar (Fisher Scientific Italia, Segrate (MI), Italy); Deuterated solvent D2O was purchased by Sigma-Aldrich (Merck Life Science S.r.l., Milano, Italy). Trimethylsilylpropanoic acid (TSP), used as nuclear magnetic resonance (NMR) internal standard, was purchased from Isotec (Merck Life Science S.r.l., Milano, Italy). Choline chloride, glycerol, and ethylene glycol were purchased from Sigma-Aldrich (Merck Life Science S.r.l., Milano, Italy). All reagents were used as purchased, without further purifications.
3.2. DESs Preparation
Deep Eutectic Solvents (DESs) used in the reactions were prepared according to previously reported procedures. The solvents used were glyceline (GL) formed by choline chloride and glycerol (ChCl:GLY, 1:2 ratio) and ethaline (EG) formed by choline chloride and ethylene glycol (ChCl:GC, 1:2 ratio) [43].
3.3. NMR Spectroscopy
NMR spectra were acquired on a Bruker Avance III 600 MHz equipped with a broadband observe probe and on a Bruker Avance III 400 MHz equipped with an inverse broadband probe (Bruker Italia S.r.l., Milano, Italy). Spectra were acquired for 1H, 13C, 15N, and 195Pt in natural abundance. 1H NMR spectra were acquired on a Bruker Avance III 600 MHz with a standard Bruker zg pulse sequence. A total of 16 scans were collected into 65 K data points with a relaxation delay of 2.0 s. A spectral width of 14 ppm and acquisition time of 5.8 s were selected.
195Pt NMR spectra were acquired on a Bruker Avance III 400 MHz, with a standard Bruker zgpg pulse sequence. A total of 49,152 scans were collected into 130 K data points with relaxation delay of 0.5 s. A spectral width of 2530 ppm and acquisition time of 0.3 s were selected.
[1H,13C]-HSQC spectra were acquired on a Bruker Avance III 600 MHz, with a standard Bruker pulse sequence (hsqcetgpsisp2.3) with 15 and 230 ppm spectral widths in the proton and carbon dimensions, respectively, 4 K data points in f2, and 128 increments in f1.
[1H,15N]-HSQC spectra were acquired on a Bruker Avance III 600 MHz, with a standard Bruker pulse sequence (hsqcetgpsisp2.3) with 13 and 250 ppm spectral widths in the proton and carbon dimensions, respectively, 2 K data points in f2, and 64 increments in f1.
1H and 13C chemical shifts (δ) were referenced to internal sodium trimethylsilylpropanoic acid (TSP). 15N spectra were referenced to external standard 1.5 M NH4Cl in 1 M HCl set at 23.6 ppm. 195Pt spectra were referenced to external H2PtCl4 in D2O at 0 ppm. NMR spectra were acquired in a 70:30% v/v mixture of the selected DES and water (1:1 H2O and D2O), added of a minimal amount of TSP for chemical shift reference. Diffusion experiments were performed on a Bruker Avance III 400 MHz, by using a stimulated echo sequence with bipolar gradient pulses (Bruker pulse program ledbpgp2s [44]) with a spectral width of 12 ppm centred at 5 ppm, and 16 K data points. Δ was set to 200 ms and δ to 2.5 µs. Gradient pulses strength was varied over 16 steps to obtain a 95% decrease in the resonance intensity at the largest gradient amplitudes. The self-diffusion coefficients D, were calculated by fitting the intensity of each signal to the exponential function:
where I(g) is the resonance intensity measured for a given gradient strength, g; I0 is the NMR signal in the absence of the gradient pulse; γH is the gyromagnetic ratio of the hydrogen nucleus; δ (little delta) is the duration of the bipolar gradient pulse; and Δ (big delta) is the observation time.
Spin–Lattice (T1) NMR relaxation time experiments were performed on a Bruker Avance III 400 MHz. T1 were measured using inversion recovery experiments (Bruker pulse program T1ir [40]), the relaxation delay D1 was 12 s for the 1H experiments, and the VD list contained sixteen delays (0.00001–6 S); T1 were calculated by fitting the intensity of each signal to the exponential function:
where Mz(t) is magnetization along the z-axis at time t; M0 is Equilibrium magnetization; and T1 is time constant for longitudinal relaxation.
NMR spectra were processed with Topspin 3.6.5, and DOSY and T1 experiments fitting were performed with Dynamics centre 2.8.5 (Bruker Italia S.r.l., Milano, Italy).
4. Reactions
4.1. Synthesis of K2PtCl4
The synthesis of K2PtCl4 was carried out according to the methods previously reported in the literature with slight modifications [45]. Briefly, 56.38 mmol of Pt wire (0.25 mm diameter), cut into pieces of ~1 cm length, are placed in 120 mL of aqua regia (HCl:HNO3 75:25%, v/v) and heated until dissolution. During the reaction, the formation of red-orange NO2 gas is observed. Once the volume is halved, increasingly diluted HCl solutions (12 to 4 M) are added to obtain H2PtCl6, until the NO2 is no longer observed. The solution is then allowed to cool. A total of 112.77 mmol of KCl are dissolved in the minimum amount of hot water and added to the previous solution containing 56.38 mmol of H2PtCl6. K2PtCl6 immediately forms as a yellow precipitate, which is recovered by filtration, washed with cold H2O, 99.9% EtOH, and Et2O, and then dried with dry air (55.79 mmol, yield 98.85%). This operation is repeated multiple times to precipitate all the K2PtCl6, which is then suspended in 300 mL of distilled water. To the K2PtCl6 suspension, 27.89 mmol of N2H4·2HCl are added: the first half is added at room temperatures, and the mixture is stirred for 2 h. The second half is added after dissolution in 15 mL of distilled water and slowly dripped into the suspension containing K2PtCl6 and the first portion of N2H4·2HCl, with the system thermostated at 50 °C. The reaction mixture is stirred for 4 h at 50 °C and then for 2 h at 60 °C, during which a colour change of the solution from yellow to burgundy red is observed, indicating the formation of soluble K2PtCl4. The aqueous K2PtCl4 solution is evaporated to dryness under reduced pressure at 50 °C, yielding a burgundy-red solid that is re-dissolved in ice cold water and filtered. The filtrate is evaporated to dryness, and the solid K2PtCl4 obtained is washed with acetone, MeOH, and Et2O and dried under vacuum, yielding 54 mmol (94% yield) [46].
4.2. Synthesis of [Pt(en)Cl2] (En = Ethylenediamine)
[Pt(en)Cl2] was synthesised in cold water, following the method of Rochon et al. [21].
4.3. Reaction of K2PtCl4 and Ethylenediamine in DES
Reactions of K2PtCl4 and en were performed in the 70:30% v/v DES:water mixtures. In order to dissolve K2PtCl4 and obtain deuterium lock for NMR analysis, the platinum salt was previously dissolved in a measured amount of D2O.
For the 1:1 reaction stoichiometry, 150 µL of a 0.05 mmol D2O solution of K2PtCl4 were added to 700 µL of GL or EG DESs and successively mixed with 150 µL of a 0.05 mmol ethylenediamine (en) in H2O solution. The resulting solution was stirred in the dark at room temperature.
Analogously, for the 1:2 stoichiometry, 150 µL of a 0.05 mmol D2O solution of K2PtCl4 were added to 700 µL of GL or EG DESs and successively mixed with 150 µL of a 0.10 mmol en in H2O solution. The resulting solution was stirred in the dark at room temperature. All the solutions were transferred into an NMR tube for performing NMR analyses.
4.4. Preparation of Standard Ethylenediamine in DES:Water Solutions
150 µL of an H2O solution 0.05 mmol of en, 150 µL of D2O and 700 µL of GL, and EG DESs were stirred together in the dark at room temperature.
5. Conclusions
In this work, the model reaction between K2PtCl4 and ethylenediamine (en) was studied in mixtures composed of hydrophilic deep eutectic solvents choline chloride-glycerol 1:2 (GL) or choline chloride-ethylene glycol (EG), and water (1:1 H2O:D2O) 70:30% v/v.
In both solvent mixtures, the reaction with en led to the quick formation of [PtCl2(en)], followed by further reaction of an additional en moiety with the previously formed [PtCl2(en)] complex, affording [Pt(en)2]Cl2. Synthesized compounds were characterised in DES–water mixtures by 1H, 195Pt NMR spectra and by 2D [1H,13C]-HSQC and [1H,15N]-HSQC NMR experiments. In all solvents and at different Pt-to-en ratios (1:1 and 1:2) we observed a progressive discolouration of the solution due to the consumption of K2PtCl4. Additionally, for longer times, the consumption of the mono-addiction product, confirmed by NMR spectra, led to the unexpected precipitation of the purple Magnus-type salt [Pt(en)2][PtCl4]2. While the consumption of [PtCl2(en)] resulted slower in the EG:Water mixture, the formation of Magnus-type salts and discolouration of the solution resulted slightly slower in the GL:water mixture, indicating that different composition of DESs was able to affect differently the metallic centre reactivity and the environment leading to the precipitation.
To explore this unexpected behaviour, we analysed the solution using diffusion-ordered spectroscopy (DOSY) and T1 relaxation experiments on 1H nuclei. The results were comparable for both solvents: water mobility was lower than in pure water, the mobility of DES components was significantly lower than that of water in the mixture, while the diffusion coefficients of the non-labile [PtCl2(en)], [Pt(en)2]Cl2, and residual en protons were comparable to each other and to those of the DES, indicating that the reaction products are associated with DES molecules. However, the labile -NH2 protons diffusion coefficients showed a different pattern, having higher values, similar to those observed for the water molecules, suggesting that water is able to travel rather efficiently among DES molecules and provide fast hydrogen exchange.
Further investigations are warranted to improve the understanding of the reactivity of platinum(II) complexes in DESs with the perspective of developing more effective and sustainable one-step synthetic pathways for therapeutically improved cisplatin analogues in order to avoid silver halides typically derived from traditional Pt(II) complexes synthesis. While the results presented here show that the choline chloride-polyol type DESs employed afford unwanted side reactions in the model reaction studied, further investigations in other DES types, including lipophilic ones, could allow us to attain previously unavailable reaction pathways.
Supplementary Materials
The following supporting information can be downloaded at: https://www.mdpi.com/article/10.3390/molecules30091890/s1, Figure S1: stacked 1H NMR spectra of Reaction 1 in the GL:water mixture 70:30% v/v; Figure S2: stacked 1H NMR spectra of Reaction 2 in the EG:water mixture 70:30% v/v; Figure S3: Expansions of [1H,13C]-HSQC NMR spectra acquired 30 days later.
Author Contributions
Conceptualisation, P.P.; synthesis, N.G. and F.M.; data curation, N.G.; instrumental analysis and method optimization, N.G. and P.P.; data analysis, N.G.; visualization, N.G.; writing—original draft, N.G. and P.P.; writing—review and editing, N.G., F.M., A.B., F.P.F., A.S., N.M. and P.P.; resources, F.P.F. Supervision, P.P. All authors have read and agreed to the published version of the manuscript.
Funding
N.G.’s PhD scholarship financed with resources from the PNRR (italian National Recovery and Resilience Plan), assigned by the MUR with the Ministerial Decree n. 118/2023.
Institutional Review Board Statement
Not applicable.
Informed Consent Statement
Not applicable.
Data Availability Statement
Data available upon request.
Acknowledgments
The University of Salento, University of Bari, and the Italian Ministero dell’Università e della Ricerca (MUR), are gratefully acknowledged.
Conflicts of Interest
The authors declare no conflicts of interest.
References
- Atharifar, H.; Keivanloo, A.; Maleki, B. Greener Synthesis of 3,4-Disubstituted Isoxazole-5(4H)-Ones in a Deep Eutectic Solvent. Org. Prep. Proced. Int. 2020, 52, 517–523. [Google Scholar] [CrossRef]
- Smith, E.L.; Abbott, A.P.; Ryder, K.S. Deep Eutectic Solvents (DESs) and Their Applications. Chem. Rev. 2014, 114, 11060–11082. [Google Scholar] [CrossRef] [PubMed]
- Hansen, B.B.; Spittle, S.; Chen, B.; Poe, D.; Zhang, Y.; Klein, J.M.; Horton, A.; Adhikari, L.; Zelovich, T.; Doherty, B.W.; et al. Deep Eutectic Solvents: A Review of Fundamentals and Applications. Chem. Rev. 2021, 121, 1232–1285. [Google Scholar] [CrossRef]
- Płotka-Wasylka, J.; de la Guardia, M.; Andruch, V.; Vilková, M. Deep Eutectic Solvents vs. Ionic Liquids: Similarities and Differences. Microchem. J. 2020, 159, 105539. [Google Scholar] [CrossRef]
- Thuy Pham, T.P.; Cho, C.-W.; Yun, Y.-S. Environmental Fate and Toxicity of Ionic Liquids: A Review. Water Res. 2010, 44, 352–372. [Google Scholar] [CrossRef] [PubMed]
- Messa, F.; Dilauro, G.; Paparella, A.N.; Silvestri, L.; Furlotti, G.; Iacoangeli, T.; Perrone, S.; Salomone, A. Deep Eutectic Solvents Meet Safe, Scalable and Sustainable Hydrogenations Enabled by Aluminum Powder and Pd/C. Green Chem. 2022, 24, 4388–4394. [Google Scholar] [CrossRef]
- Messa, F.; Perrone, S.; Capua, M.; Tolomeo, F.; Troisi, L.; Capriati, V.; Salomone, A. Towards a Sustainable Synthesis of Amides: Chemoselective Palladium-Catalysed Aminocarbonylation of Aryl Iodides in Deep Eutectic Solvents. Chem. Commun. 2018, 54, 8100–8103. [Google Scholar] [CrossRef]
- Messa, F.; Paparella, A.N.; Veselý, D.; Krajčovič, J.; Papadia, P.; Perrone, S.; Salomone, A. Gas-Free Amino- and Alkoxycarbonylation of Aryl Iodides in a Bioinspired Deep Eutectic Solvent with Mo(CO)6 as a Safe CO Source. Eur. J. Org. Chem. 2023, 26, e202300309. [Google Scholar] [CrossRef]
- Zhang, T.; Doert, T.; Wang, H.; Zhang, S.; Ruck, M. Inorganic Synthesis Based on Reactions of Ionic Liquids and Deep Eutectic Solvents. Angew. Chem. Int. Ed. 2021, 60, 22148–22165. [Google Scholar] [CrossRef]
- Correia, I.; Welton, T. An Old Reaction in New Media: Kinetic Study of a Platinum(II) Substitution Reaction in Ionic Liquids. Dalton Trans. 2009, 4115–4121. [Google Scholar] [CrossRef]
- Hasan, M.; Kozhevnikov, I.V.; Siddiqui, M.R.H.; Femoni, C.; Steiner, A.; Winterton, N. N,N′-Dialkylimidazolium Chloroplatinate(II), Chloroplatinate(IV), and Chloroiridate(IV) Salts and an N-Heterocyclic Carbene Complex of Platinum(II): Synthesis in Ionic Liquids and Crystal Structures. Inorg. Chem. 2001, 40, 795–800. [Google Scholar] [CrossRef]
- Illner, P.; Begel, S.; Kern, S.; Puchta, R.; van Eldik, R. Fast Substitution Reactions of Pt(II) in Different Ionic Liquids. Reactivity Control by Anionic Components. Inorg. Chem. 2009, 48, 588–597. [Google Scholar] [CrossRef]
- Zielinski, W.; Kukawka, R.; Maciejewski, H.; Smiglak, M. Ionic Liquids as Solvents for Rhodium and Platinum Catalysts Used in Hydrosilylation Reaction. Molecules 2016, 21, 1115. [Google Scholar] [CrossRef] [PubMed]
- Woitassek, D.; Strothmann, T.; Biller, H.; Lerch, S.; Schmitz, H.; Song, Y.; Roitsch, S.; Strassner, T.; Janiak, C. Tunable Aryl Alkyl Ionic Liquid Supported Synthesis of Platinum Nanoparticles and Their Catalytic Activity in the Hydrogen Evolution Reaction and in Hydrosilylation. Molecules 2023, 28, 405. [Google Scholar] [CrossRef] [PubMed]
- Wazeer, I.; Hizaddin, H.F.; Hashim, M.A.; Hadj-Kali, M.K. An Overview about the Extraction of Heavy Metals and Other Critical Pollutants from Contaminated Water via Hydrophobic Deep Eutectic Solvents. J. Environ. Chem. Eng. 2022, 10, 108574. [Google Scholar] [CrossRef]
- Mokhodoeva, O.; Maksimova, V.; Shishov, A.; Shkinev, V. Separation of Platinum Group Metals Using Deep Eutectic Solvents Based on Quaternary Ammonium Salts. Sep. Purif. Technol. 2023, 305, 122427. [Google Scholar] [CrossRef]
- Papadia, P.; Gandin, V.; Barbanente, A.; Ruello, A.G.; Marzano, C.; Micoli, K.; Hoeschele, J.D.; Natile, G.; Margiotta, N. A Minimal Structural Variation Can Overcome Tumour Resistance of Oxaliplatin: The Case of 4,5-Dehydrogenation of the Cyclohexane Ring. RSC Adv. 2019, 9, 32448–32452. [Google Scholar] [CrossRef]
- Delso, I.; Lafuente, C.; Muñoz-Embid, J.; Artal, M. NMR Study of Choline Chloride-Based Deep Eutectic Solvents. J. Mol. Liq. 2019, 290, 111236. [Google Scholar] [CrossRef]
- Ferreira, A.S.D.; Craveiro, R.; Duarte, A.R.; Barreiros, S.; Cabrita, E.J.; Paiva, A. Effect of Water on the Structure and Dynamics of Choline Chloride/Glycerol Eutectic Systems. J. Mol. Liq. 2021, 342, 117463. [Google Scholar] [CrossRef]
- Gabriele, F.; Chiarini, M.; Germani, R.; Tiecco, M.; Spreti, N. Effect of Water Addition on Choline Chloride/Glycol Deep Eutectic Solvents: Characterization of Their Structural and Physicochemical Properties. J. Mol. Liq. 2019, 291, 111301. [Google Scholar] [CrossRef]
- Rochon, F.D.; Morneau, A. 195Pt and 1H NMR Studies of Platinum(II) Complexes with Ethylenediamine Derivatives. Magn. Reson. Chem. 1991, 29, 120–126. [Google Scholar] [CrossRef]
- Watt, G.W.; Klett, D.S. The Infrared Spectra and Structure of Bis(Ethylenediamine)Palladium(II) and -Platinum(II) Halides. Inorg. Chem. 1966, 5, 1278–1280. [Google Scholar] [CrossRef]
- Appleton, T.G.; Hall, J.R. Complexes with Six-Membered Chelate Rings. I. Preparation of Platinum(II) and Palladium(II) Complexes of Trimethylenediamine and Some Methyl-Substituted Derivatives. Inorg. Chem. 1970, 9, 1800–1806. [Google Scholar] [CrossRef]
- Ethylenediamine(107-15-3) 1H NMR Spectrum. Available online: https://www.chemicalbook.com/SpectrumEN_107-15-3_1HNMR.htm (accessed on 5 February 2025).
- Josephsen, J. Diaminehalogenoplatinum(II) Complex Reactions with DMSO. Inorganica Chim. Acta 2018, 478, 54–58. [Google Scholar] [CrossRef]
- Pesek, J.J.; Mason, W.R. Platinum-195 Magnetic Resonance Spectra of Some Platinum(II) and Platinum(IV) Complexes. J. Magn. Reson. (1969) 1977, 25, 519–529. [Google Scholar] [CrossRef]
- Pregosin, P.S. Platinum-195 Nuclear Magnetic Resonance. Coord. Chem. Rev. 1982, 44, 247–291. [Google Scholar] [CrossRef]
- Still, B.M.; Kumar, P.G.A.; Aldrich-Wright, J.R.; Price, W.S. 195Pt NMR—Theory and Application. Chem. Soc. Rev. 2007, 36, 665–686. [Google Scholar] [CrossRef]
- Kerrison, S.J.S.; Sadler, P.J. 195Pt NMR Studies of Platinum(II) Dimethylsuphoxide Complexes. Inorganica Chim. Acta 1985, 104, 197–201. [Google Scholar] [CrossRef]
- Burdge, J.R.; Stanko, J.A.; Palmer, J.W. Oxidation of Platinum(Ii) Bis(Ethylenediamine) Complexes with the Oxides of Nitrogen, No and No 2: A Model for Synthesis of Platinum(Iv) Nitro Compounds as Potential Antitumor Agents. Fla. Sci. 1995, 58, 274–285. [Google Scholar]
- Appleton, T.G.; Hall, J.R.; Ralph, S.F. 15N and 195Pt NMR Spectra of Platinum Ammine Complexes: Trans- and Cis-Influence Series Based on 195Pt-15N Coupling Constants and 15N Chemical Shifts. Inorg. Chem. 1985, 24, 4685–4693. [Google Scholar] [CrossRef]
- del Socorro Murdoch, P.; Kratochwil, N.A.; Parkinson, J.A.; Patriarca, M.; Sadler, P.J. A Novel Dinuclear Diaminoplatinum(II) Glutathione Macrochelate. Angew. Chem. Int. Ed. 1999, 38, 2949–2951. [Google Scholar] [CrossRef]
- Tanaka, K. Measurements of Self-Diffusion Coefficients of Water in Pure Water and in Aqueous Electrolyte Solutions. J. Chem. Soc. Faraday Trans. 1 1975, 71, 1127. [Google Scholar] [CrossRef]
- Levitt, M.H. Spin Dynamics: Basics of Nuclear Magnetic Resonance, 2nd ed.; John Wiley & Sons: Nashville, TN, USA, 2013; ISBN 978-1-118-68184-8. [Google Scholar]
- Priqueler, J.R.L.; Butler, I.S.; Rochon, F.D. An Overview of 195Pt Nuclear Magnetic Resonance Spectroscopy. Appl. Spectrosc. Rev. 2006, 41, 185–226. [Google Scholar] [CrossRef]
- Sterzel, M.; Autschbach, J. Toward an Accurate Determination of 195Pt Chemical Shifts by Density Functional Computations: The Importance of Unspecific Solvent Effects and the Dependence of Pt Magnetic Shielding Constants on Structural Parameters. Inorg. Chem. 2006, 45, 3316–3324. [Google Scholar] [CrossRef]
- Agieienko, V.; Buchner, R. A Comprehensive Study of Density, Viscosity, and Electrical Conductivity of (Choline Chloride + Glycerol) Deep Eutectic Solvent and Its Mixtures with Dimethyl Sulfoxide. J. Chem. Eng. Data 2021, 66, 780–792. [Google Scholar] [CrossRef]
- Harifi-Mood, A.R.; Buchner, R. Density, Viscosity, and Conductivity of Choline Chloride + Ethylene Glycol as a Deep Eutectic Solvent and Its Binary Mixtures with Dimethyl Sulfoxide. J. Mol. Liq. 2017, 225, 689–695. [Google Scholar] [CrossRef]
- Neufeld, R.; Stalke, D. Accurate Molecular Weight Determination of Small Molecules via DOSY-NMR by Using External Calibration Curves with Normalized Diffusion Coefficients. Chem. Sci. 2015, 6, 3354–3364. [Google Scholar] [CrossRef]
- Claridge, T.D.W. High-Resolution NMR Techniques in Organic Chemistry; Elsevier: Amsterdam, The Netherlands, 2016; ISBN 978-0-08-099993-7. [Google Scholar]
- AlZahrani, Y.M.; Britton, M.M. Probing the Influence of Zn and Water on Solvation and Dynamics in Ethaline and Reline Deep Eutectic Solvents by 1 H Nuclear Magnetic Resonance. Phys. Chem. Chem. Phys. 2021, 23, 21913–21922. [Google Scholar] [CrossRef] [PubMed]
- Chandra, A.; Kumar Sahu, P.; Chakraborty, S.; Ghosh, A.; Sarkar, M. Spin–Lattice Relaxation Studies on Deep Eutectic Solvent/Choliniumtetrachloroferrate Mixtures: Suitability of DES-Based Systems towards Magnetic Resonance Imaging Studies. Magn. Reson. Chem. 2018, 56, 120–126. [Google Scholar] [CrossRef]
- Abbott, A.P.; Capper, G.; Davies, D.L.; Rasheed, R.K.; Tambyrajah, V. Novel Solvent Properties of Choline Chloride/Urea Mixtures. Chem. Commun. 2003, 39, 70–71. [Google Scholar] [CrossRef]
- Wu, D.H.; Chen, A.D.; Johnson, C.S. An Improved Diffusion-Ordered Spectroscopy Experiment Incorporating Bipolar-Gradient Pulses. J. Magn. Reson. Ser. A 1995, 115, 260–264. [Google Scholar] [CrossRef]
- Kauffman, G.B.; Thurner, J.J.; Zatko, D.A. Ammonium Hexachloroplatinate(IV). In Inorganic Syntheses; Tyree, S.Y., Ed.; Wiley: Hoboken, NJ, USA, 1967; Volume 9, pp. 182–185. ISBN 978-0-470-13168-8. [Google Scholar]
- Keller, R.N.; Moeller, T.; Quagliano, J.V. Potassium Tetrachloroplatinate(II): (Potassium Chloroplatinite). In Inorganic Syntheses; John Wiley & Sons, Ltd.: Hoboken, NJ, USA, 1946; pp. 247–250. ISBN 978-0-470-13233-3. [Google Scholar]


Disclaimer/Publisher’s Note: The statements, opinions and data contained in all publications are solely those of the individual author(s) and contributor(s) and not of MDPI and/or the editor(s). MDPI and/or the editor(s) disclaim responsibility for any injury to people or property resulting from any ideas, methods, instructions or products referred to in the content. |
© 2025 by the authors. Licensee MDPI, Basel, Switzerland. This article is an open access article distributed under the terms and conditions of the Creative Commons Attribution (CC BY) license (https://creativecommons.org/licenses/by/4.0/).