Transcriptome Changes in Pseudomonas putida KT2440 during Medium-Chain-Length Polyhydroxyalkanoate Synthesis Induced by Nitrogen Limitation


Abstract
:1. Introduction
2. Results
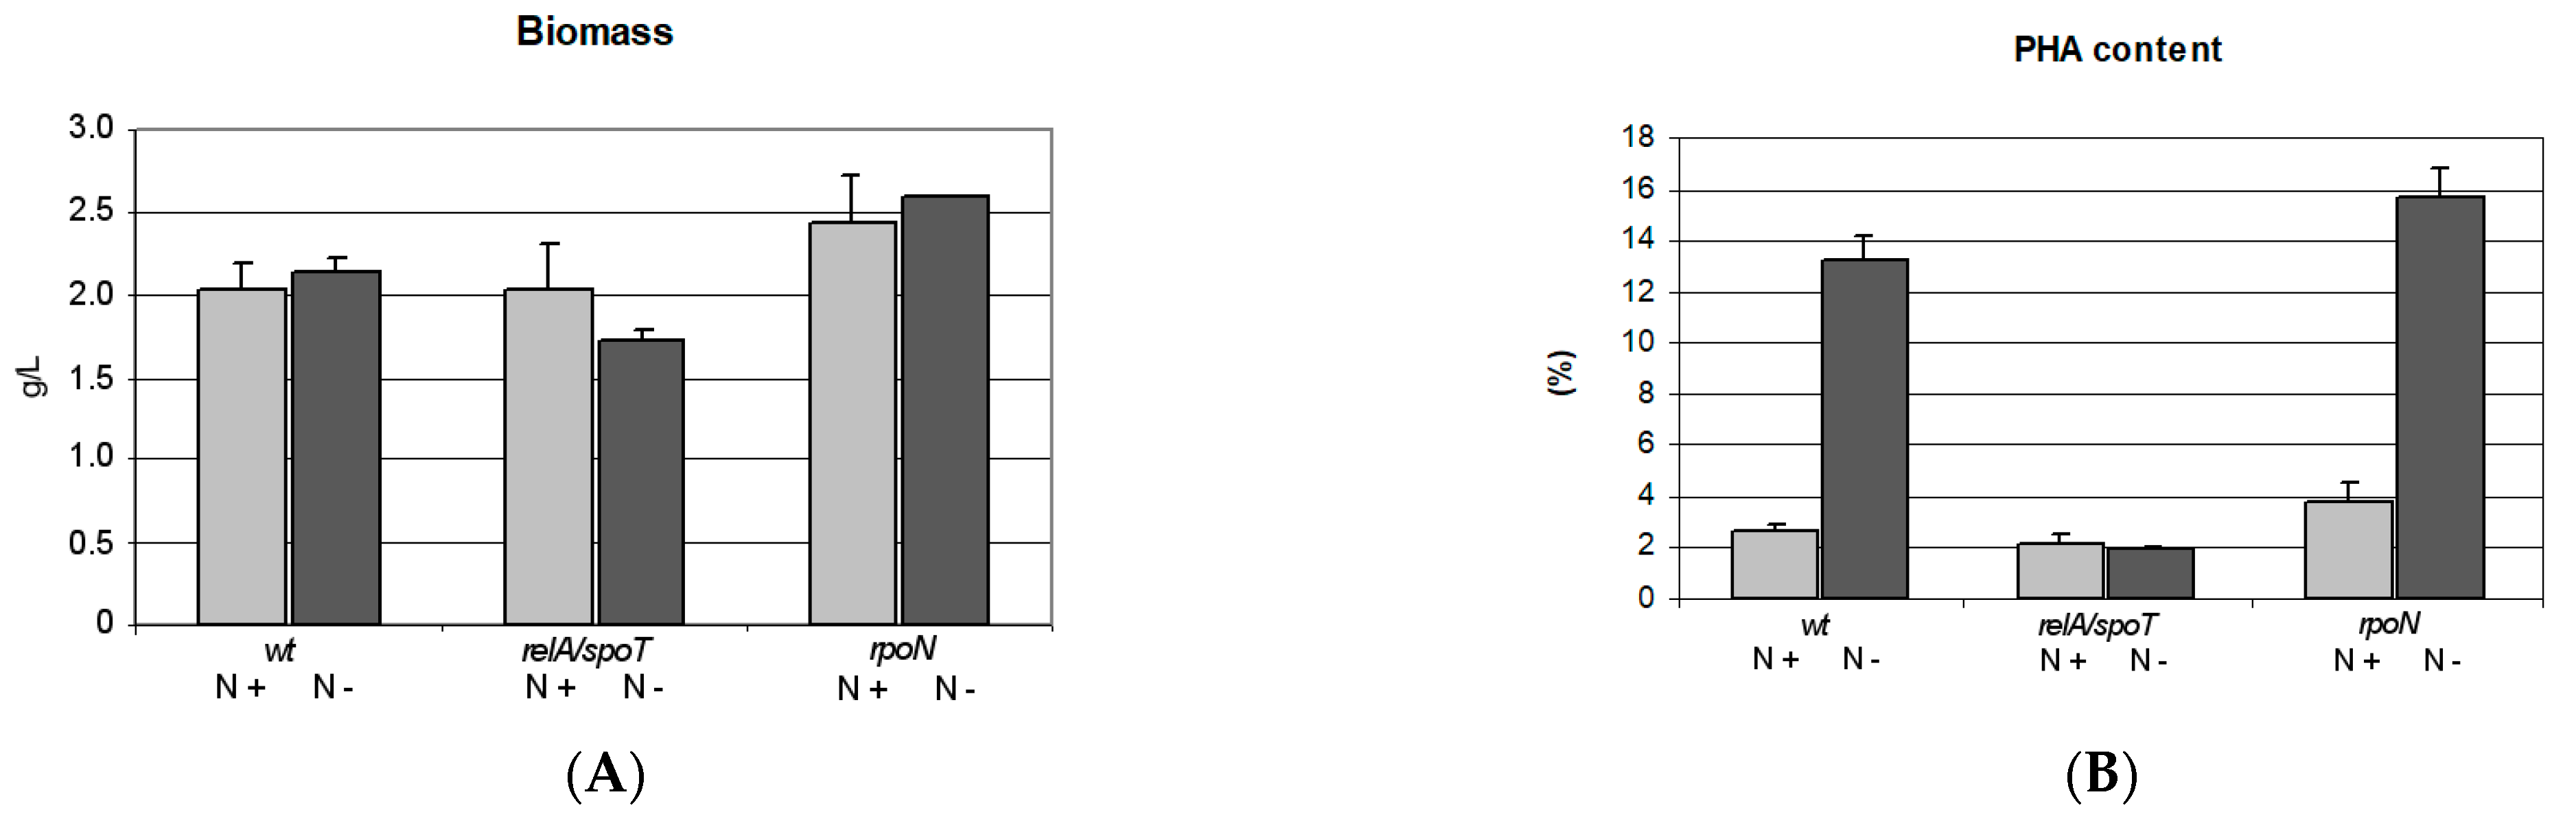
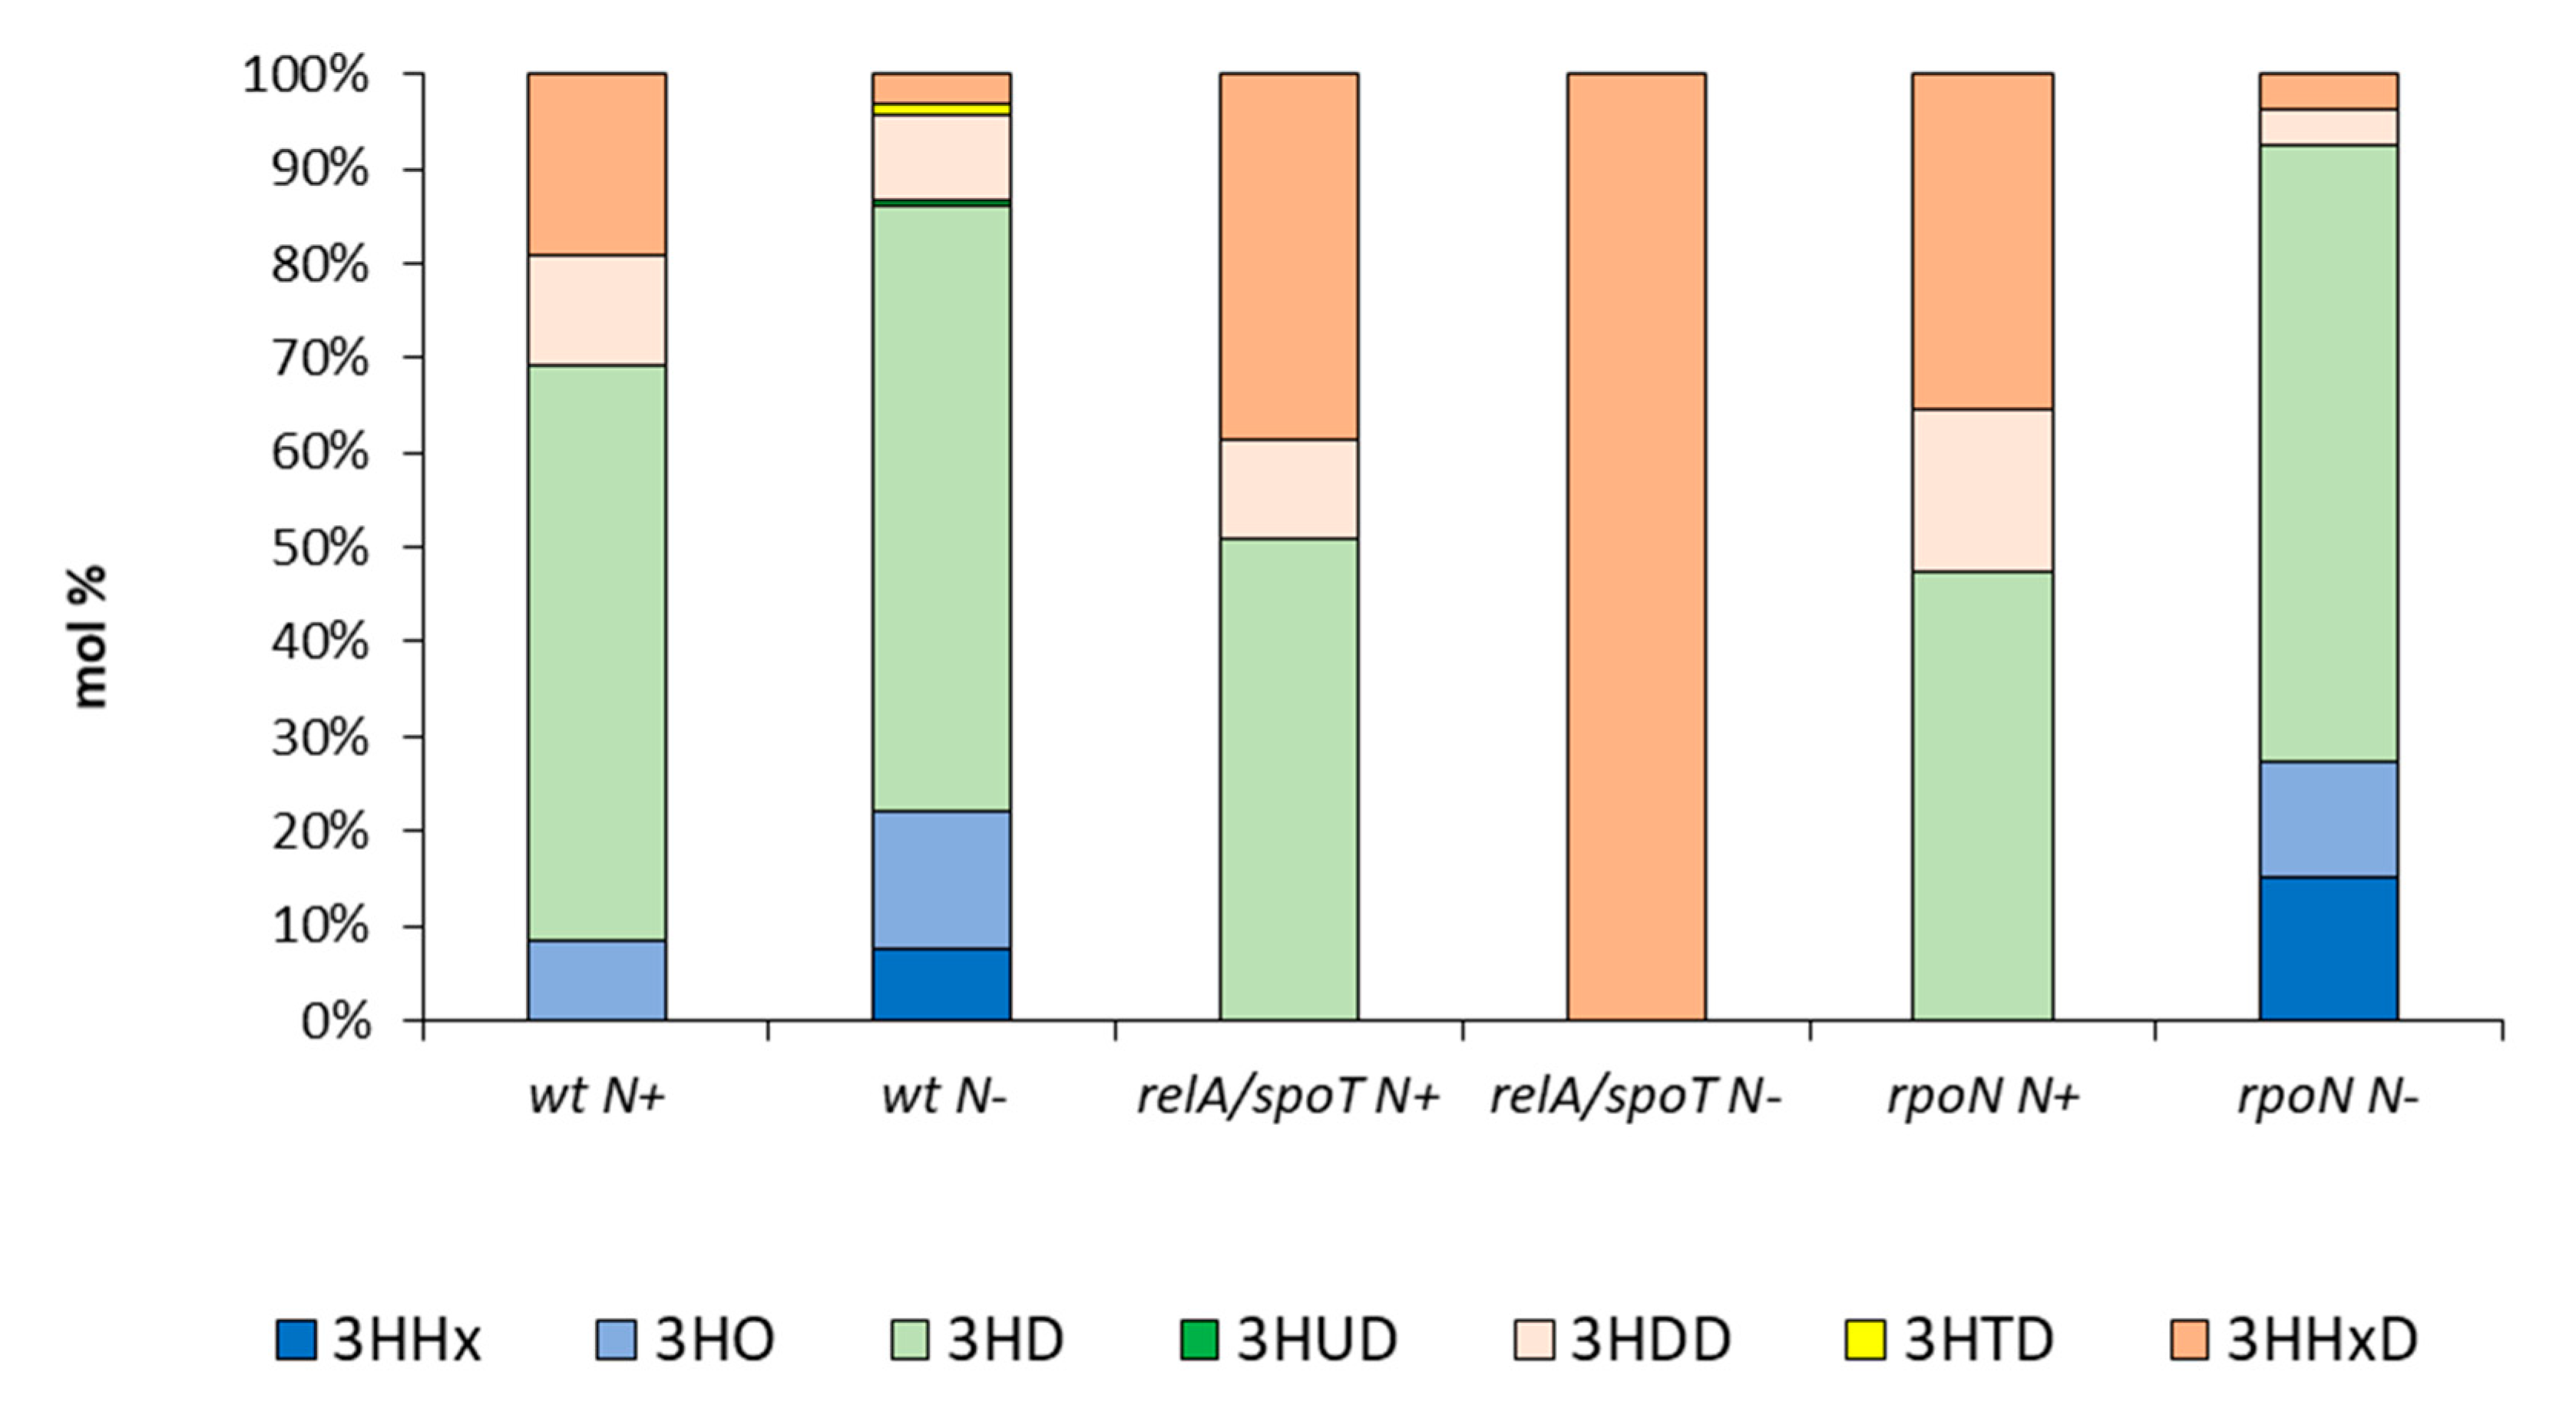
2.1. PHA Synthesis
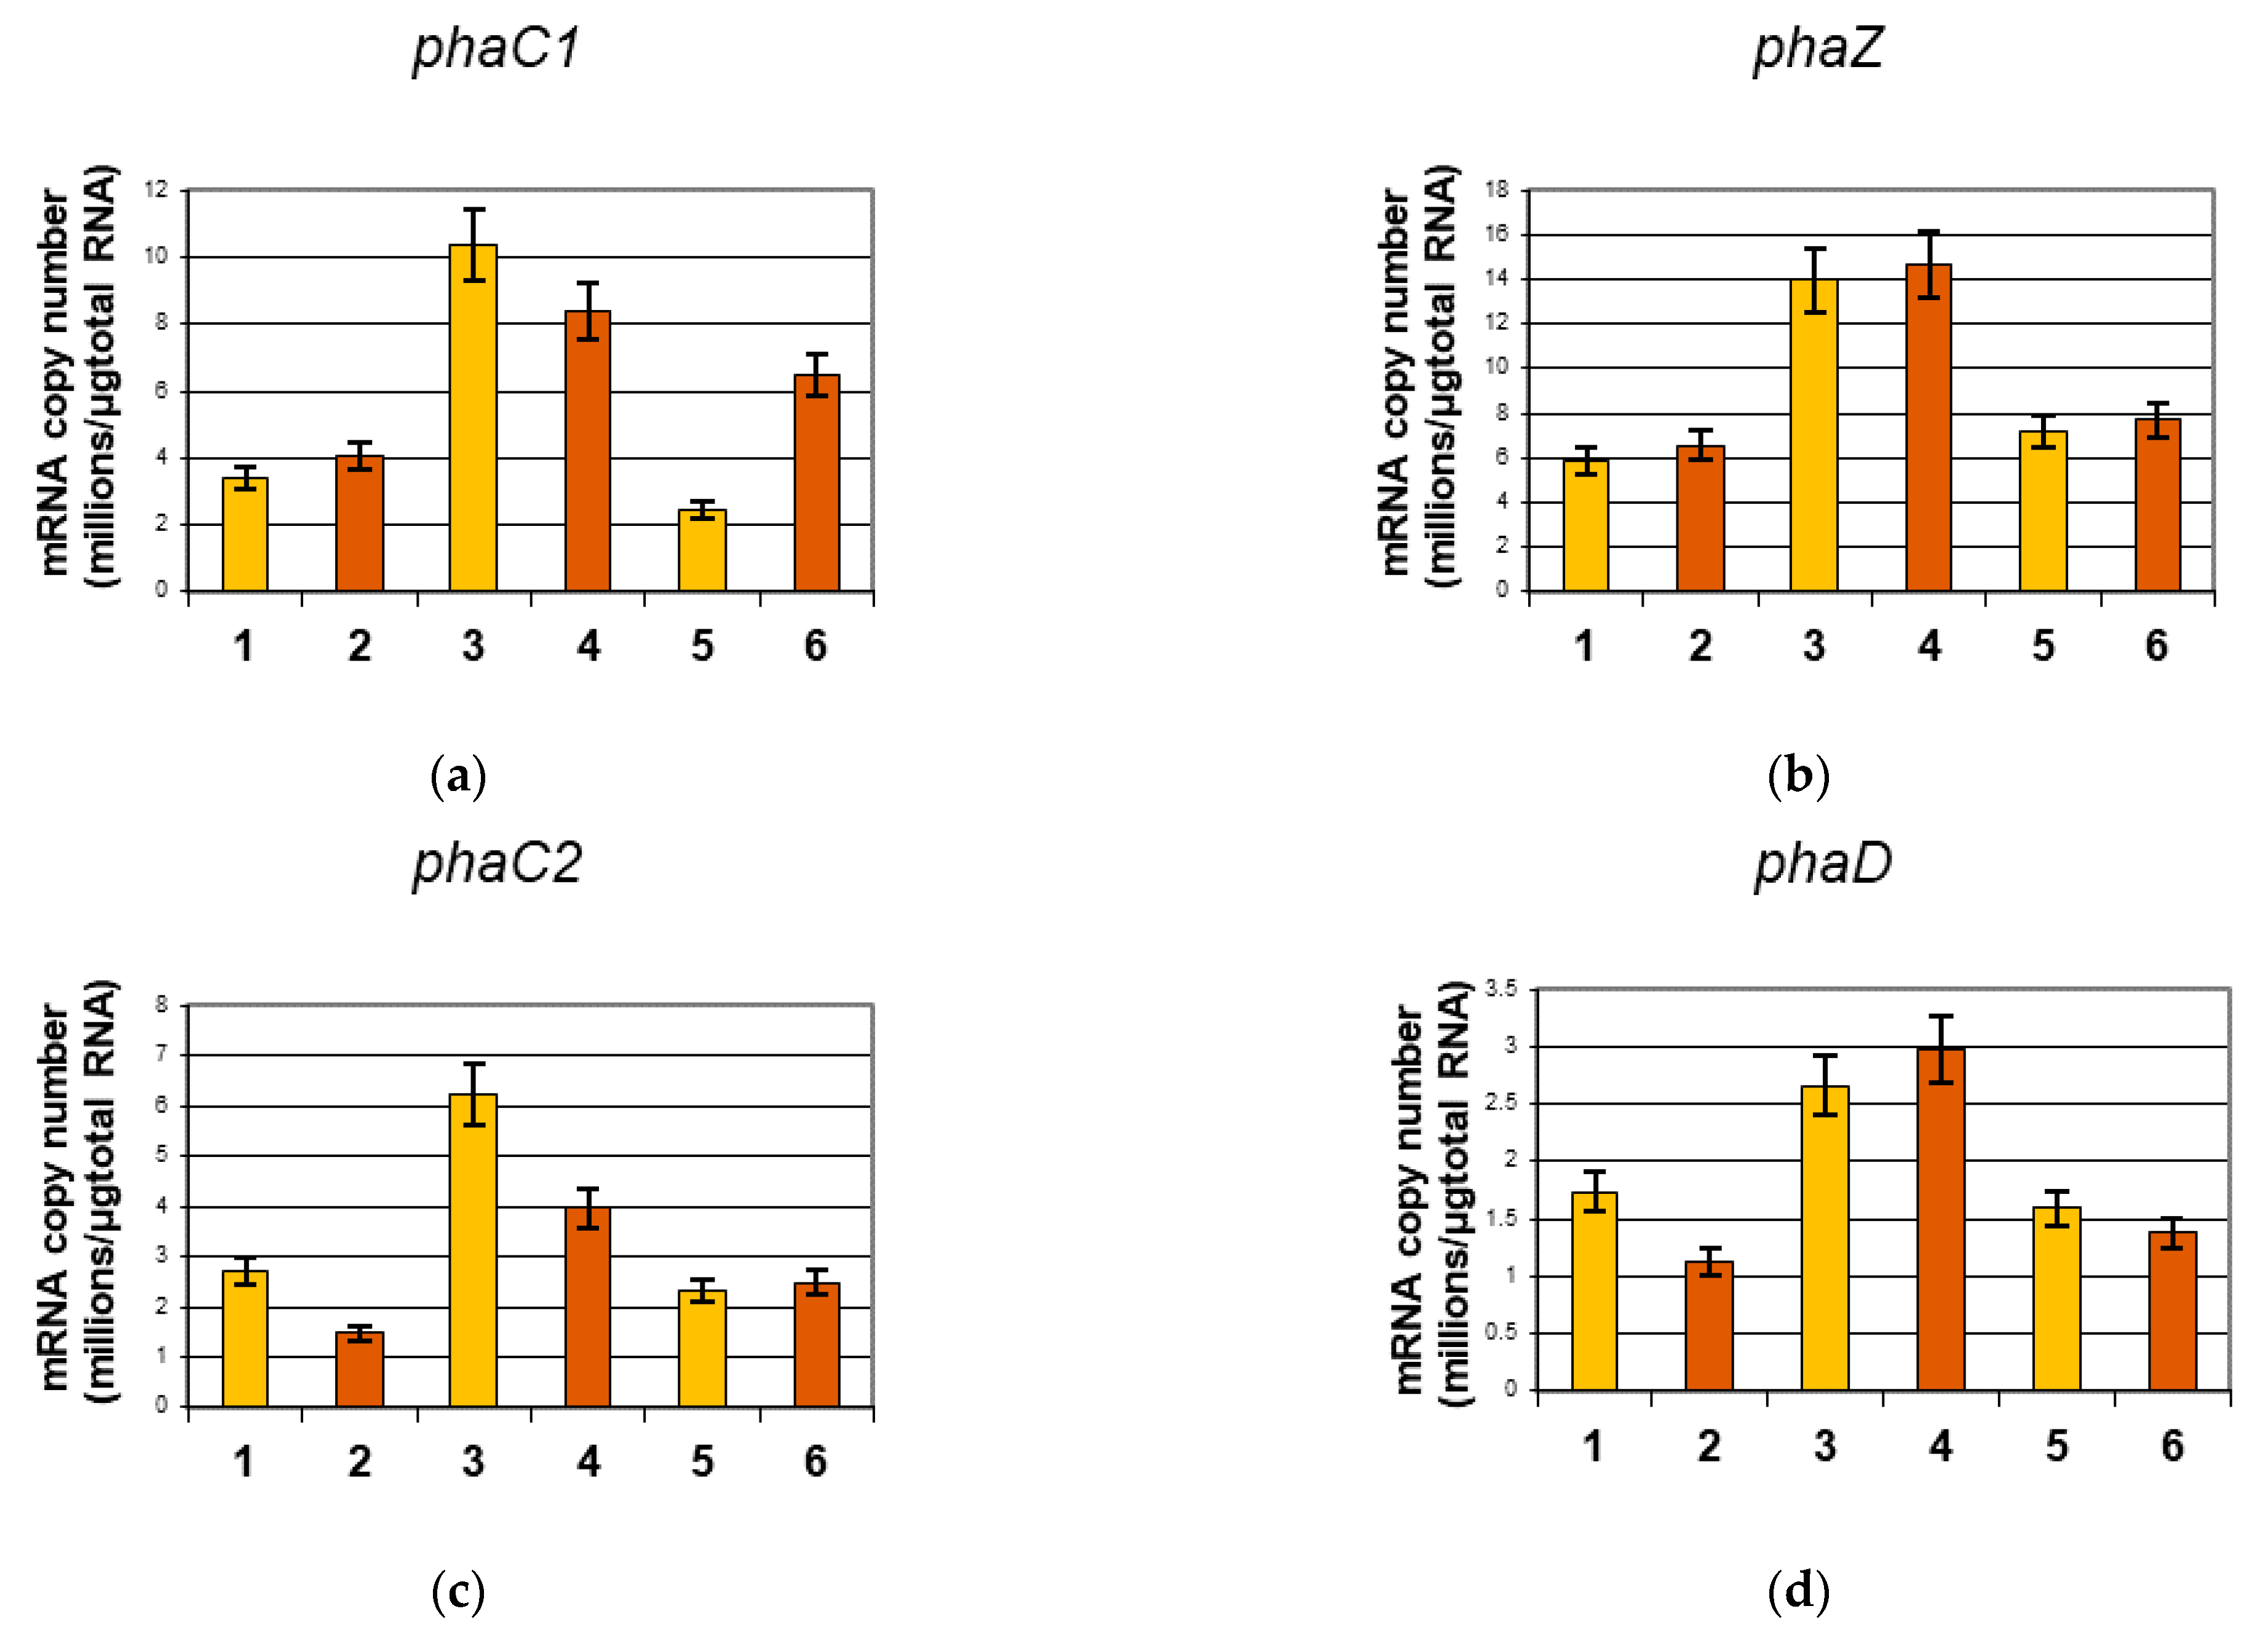
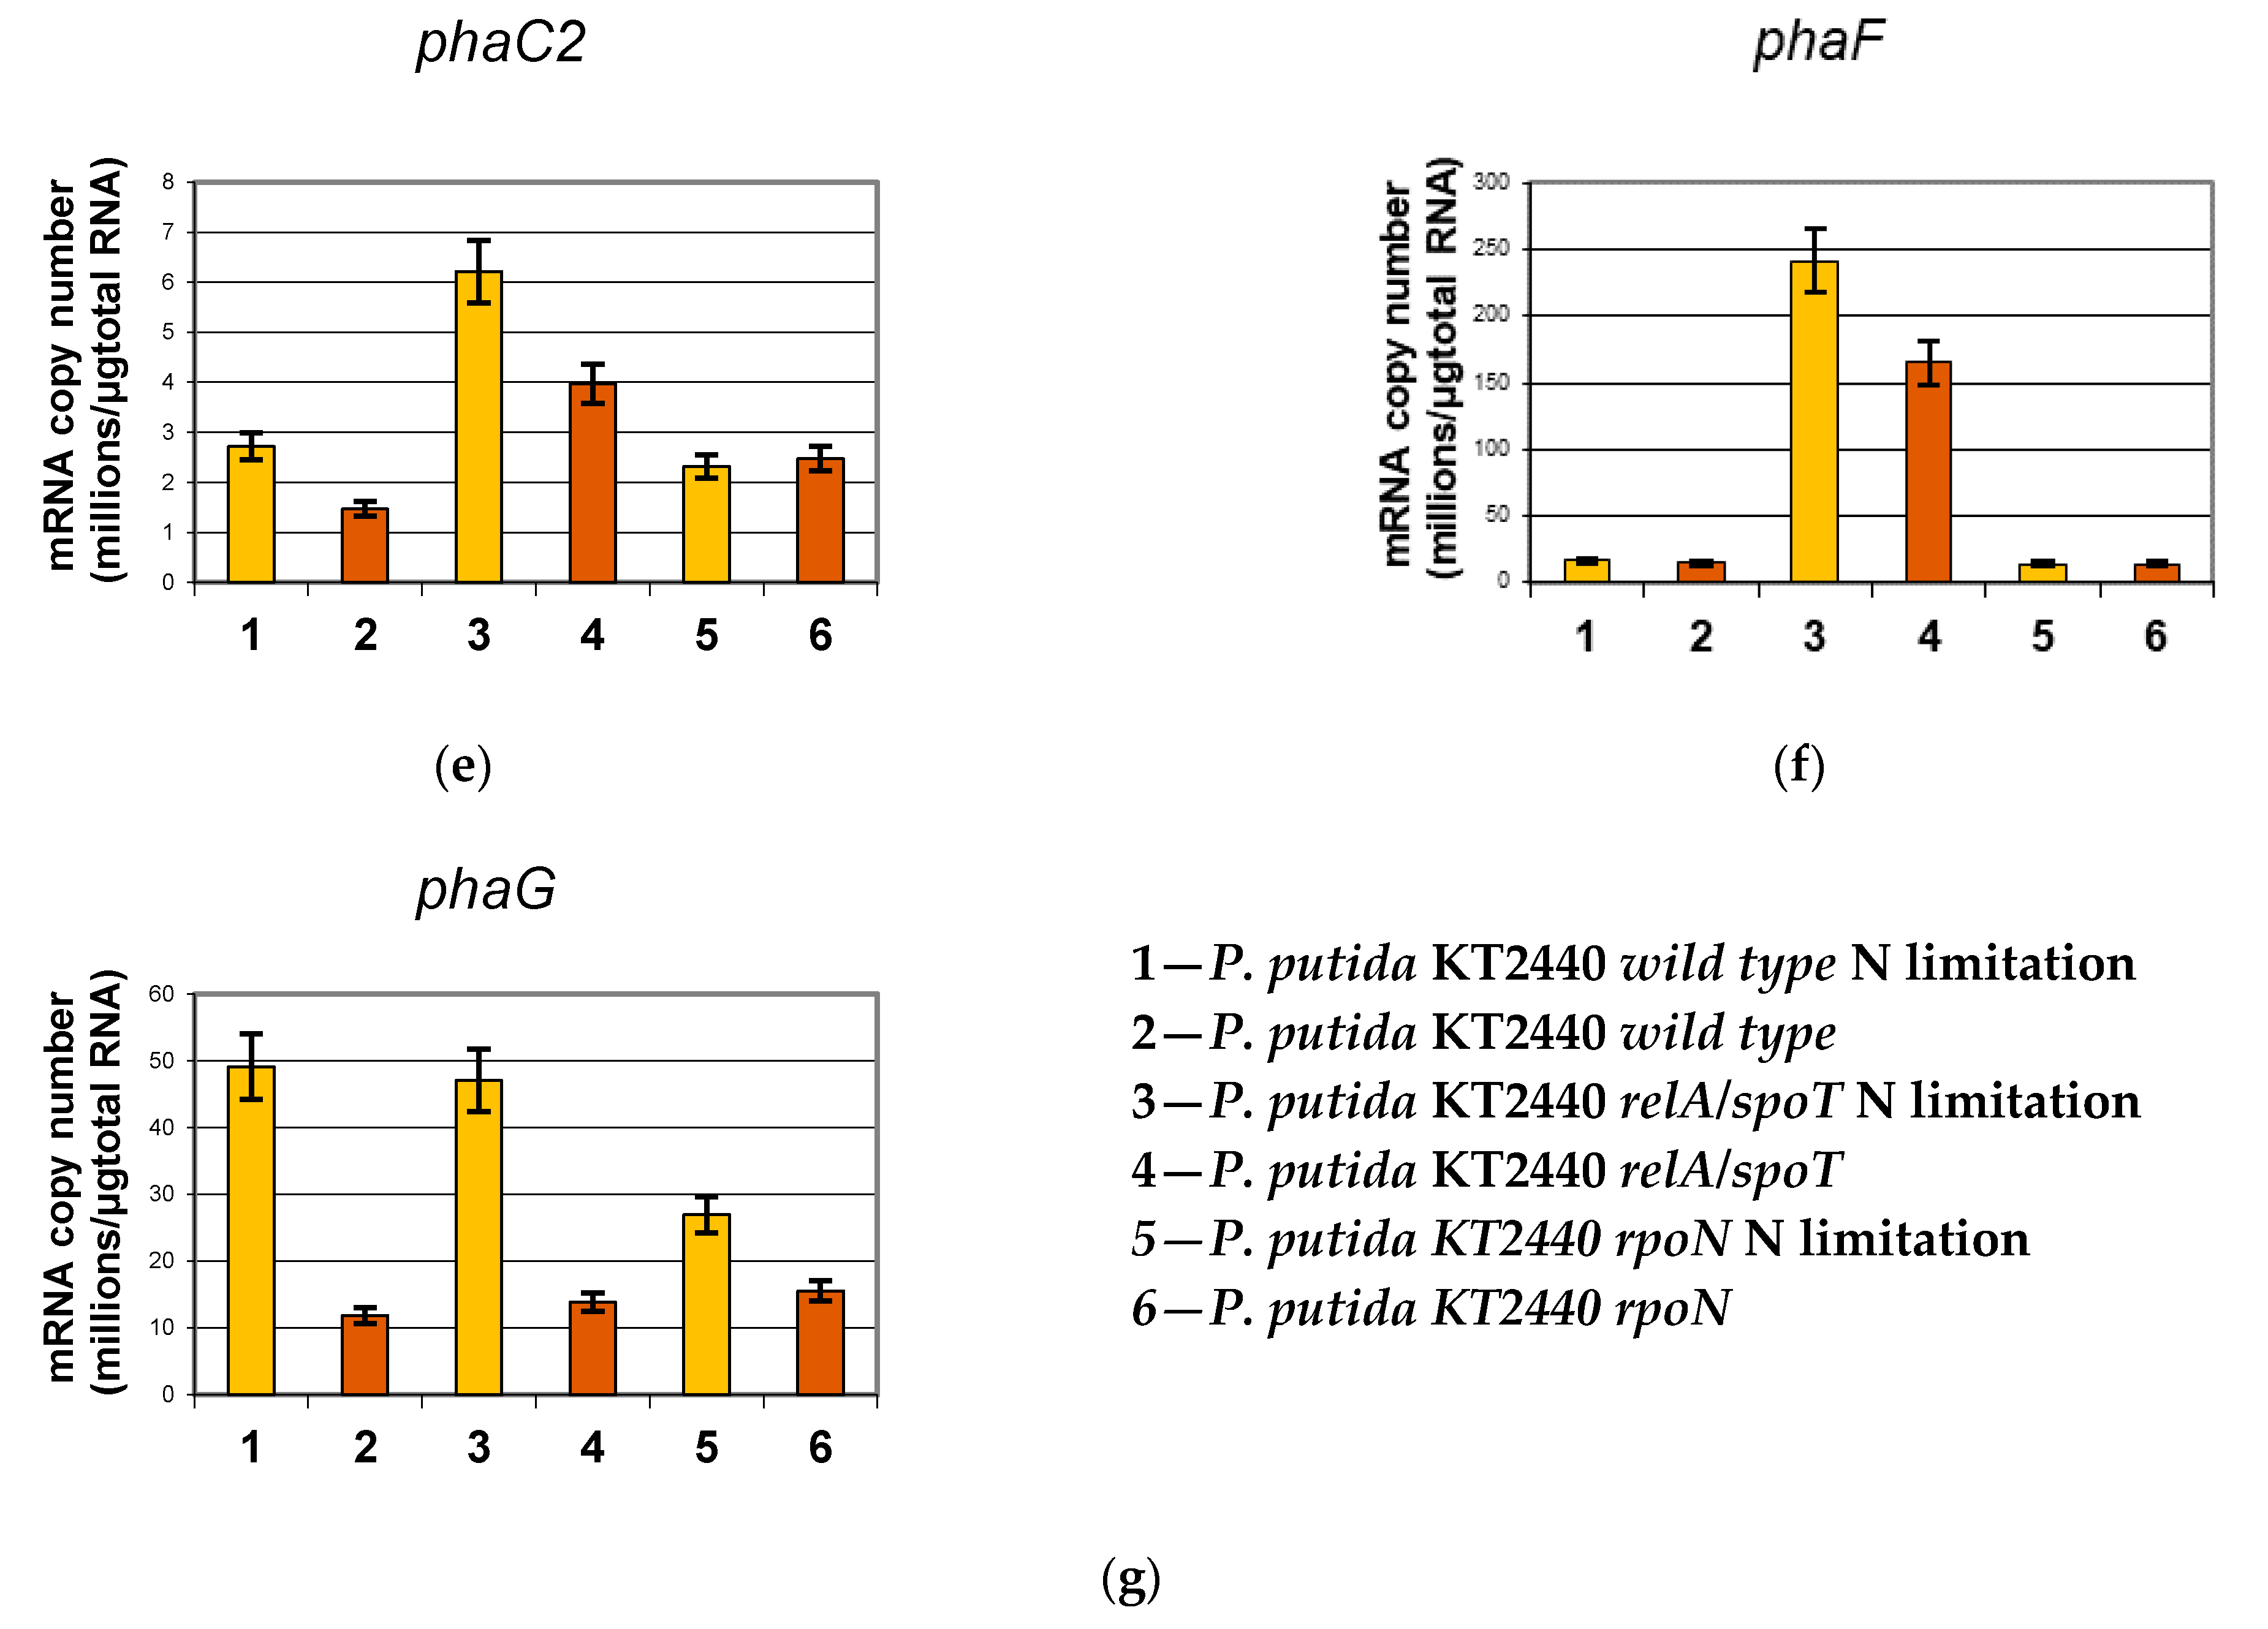
2.2. Analysis of mcl-PHA Related Genes Using Reverse Transcription Real-Time PCR
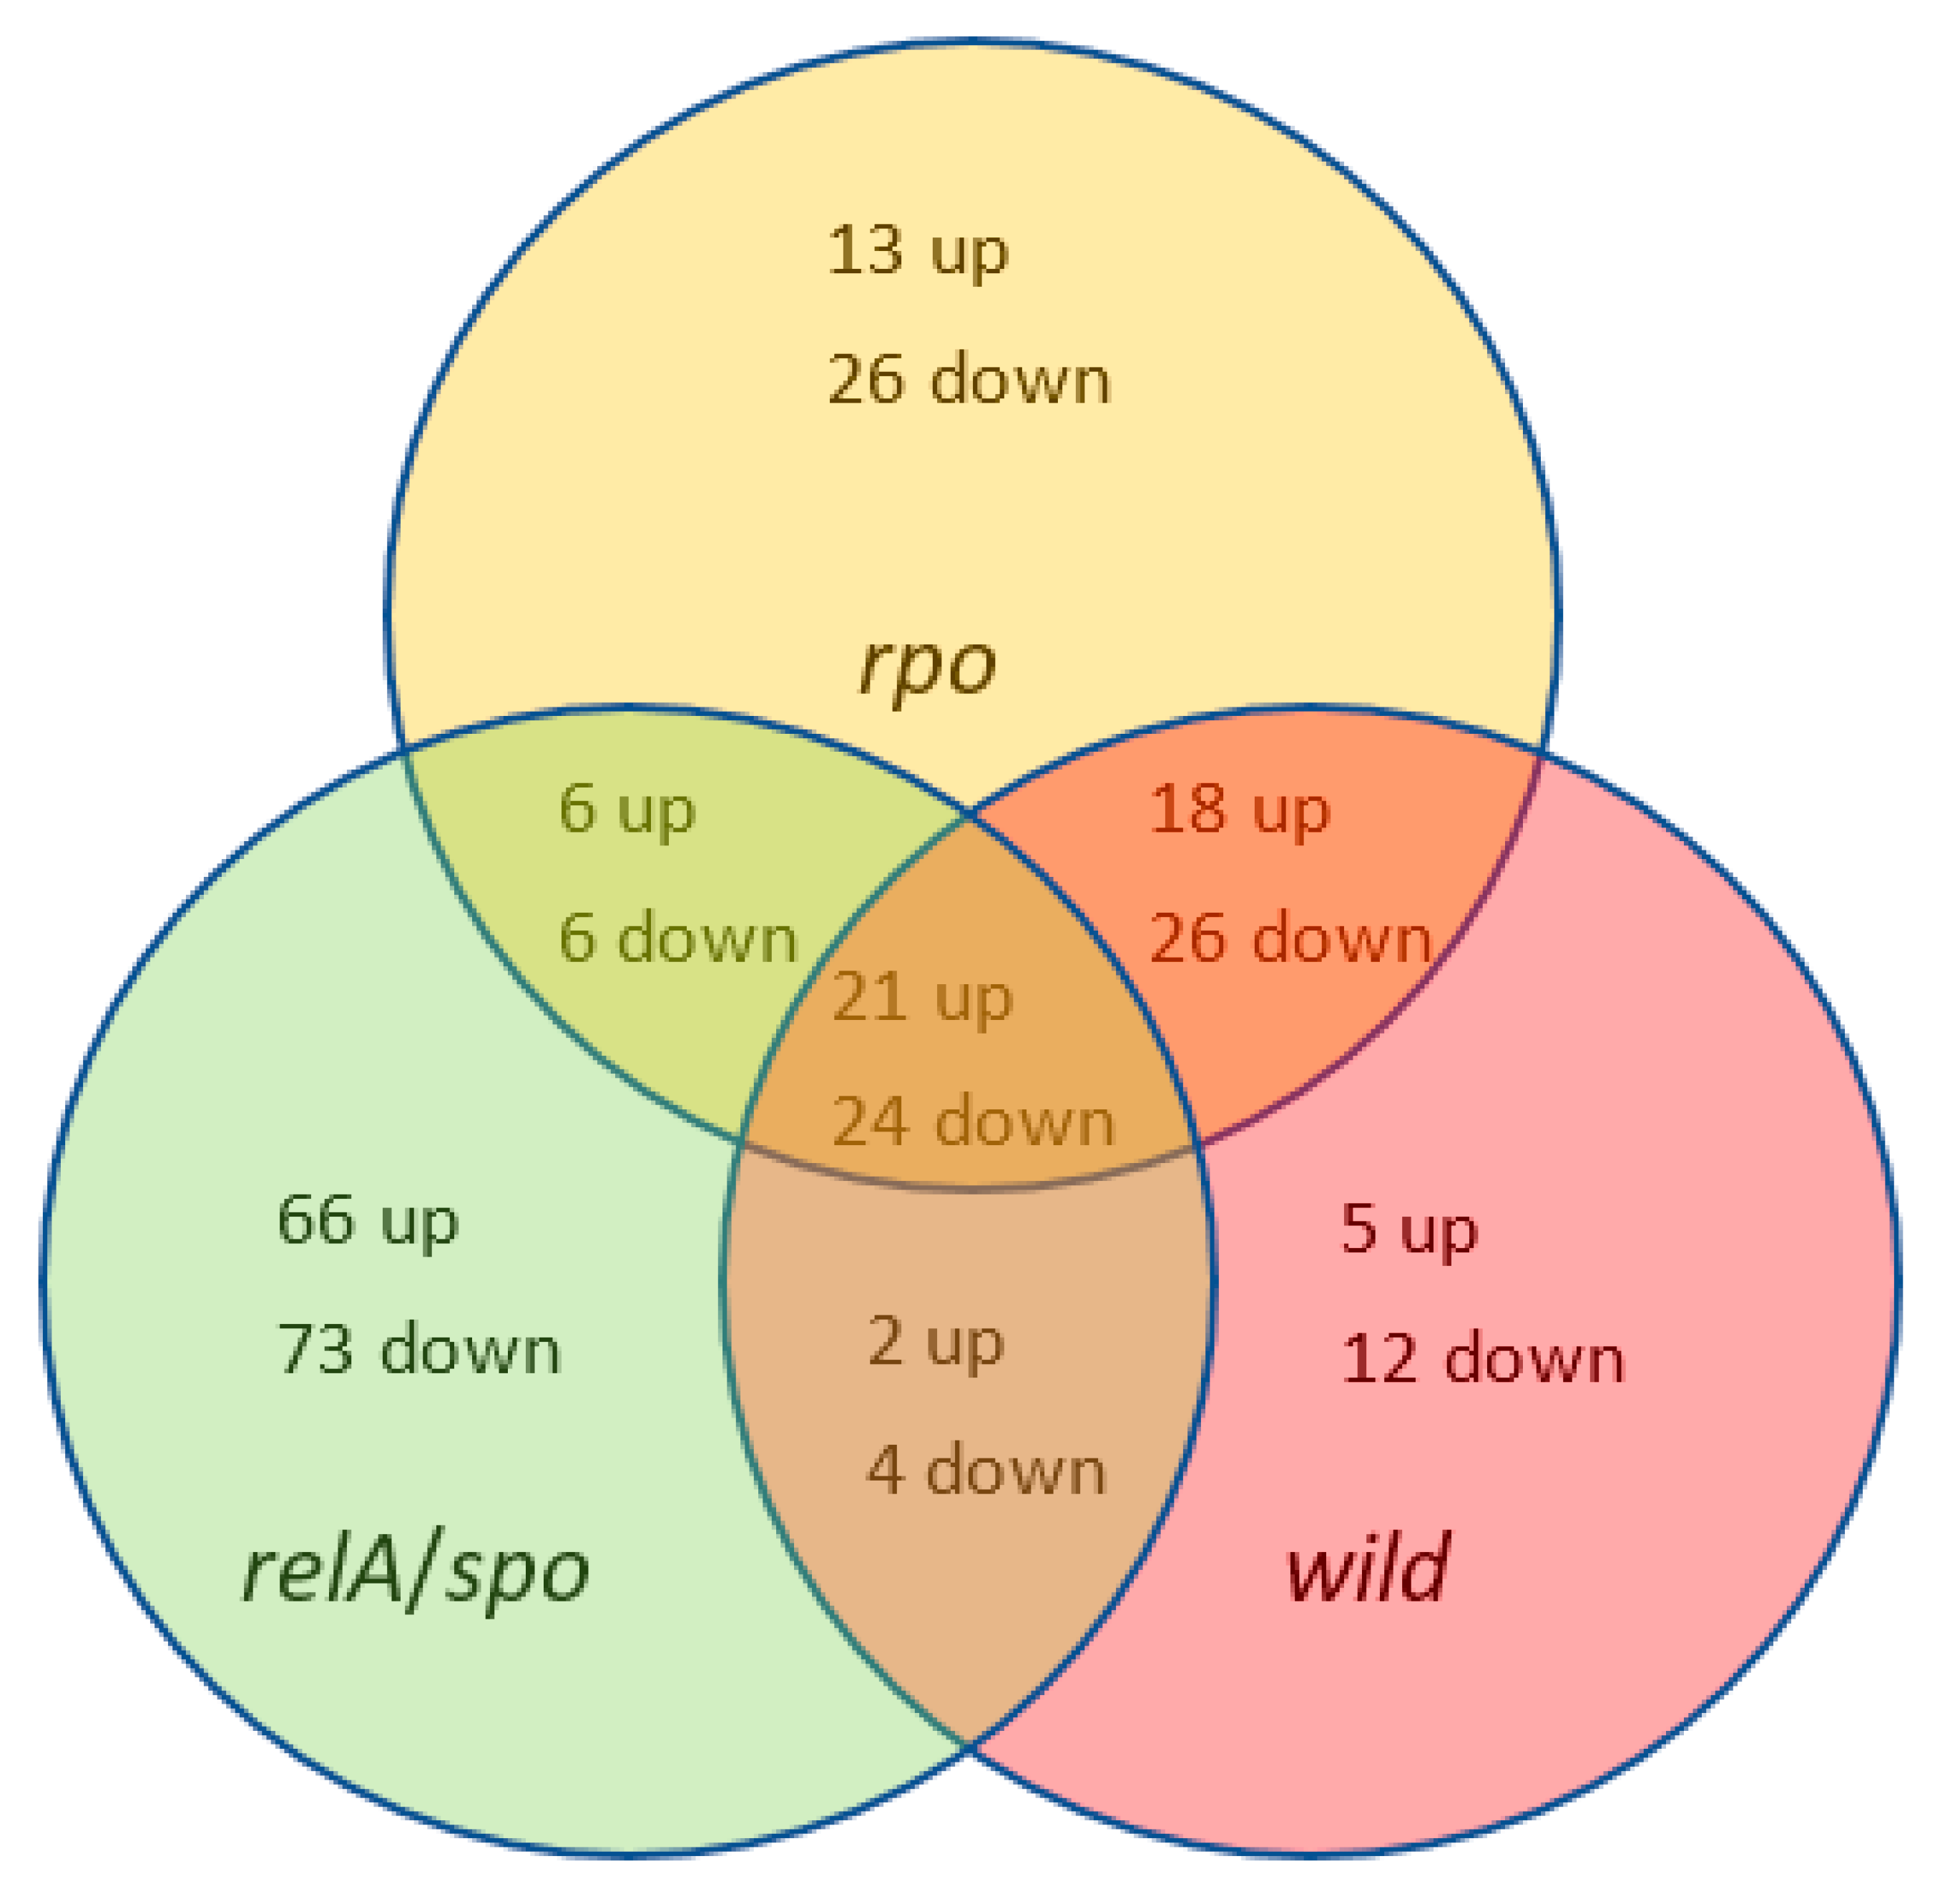
2.3. RNA-Seq
2.4. Validation of Illumina Sequence Data Using qRT-PCR
3. Discussion
4. Materials and Methods
4.1. Bacterial Strain and Growth Conditions
4.2. Analytical Methods
4.3. RNA Isolation
4.4. Reverse Transcription PCR Analysis
4.5. Library Construction, Illumina Sequencing and Data Analysis
5. Conclusions
Supplementary Materials
Author Contributions
Funding
Institutional Review Board Statement
Informed Consent Statement
Data Availability Statement
Conflicts of Interest
References
- Volova, T.G.; Zhila, N.O.; Shishatskaya, E.; Mironov, P.V.; Vasil’Ev, A.D.; Sukovatyi, A.G.; Sinskey, A.J. The physicochemical properties of polyhydroxyalkanoates with different chemical structures. Polym. Sci. Ser. A 2013, 55, 427–437. [Google Scholar] [CrossRef]
- Kai, D.; Loh, X. Polyhydroxyalkanoates: Chemical Modifications Toward Biomedical Applications. ACS Sustain. Chem. Eng. 2014, 2, 106–119. [Google Scholar] [CrossRef]
- Anderson, A.J.; Dawes, E.A. Occurrence, metabolism, metabolic role, and industrial uses of bacterial polyhydroxyalkanoates. Microbiol. Rev. 1990, 54, 450. [Google Scholar] [CrossRef]
- Prieto, A.; Escapa, I.F.; Martínez, V.; Dinjaski, N.; Herencias, C.; De La Peña, F.; Tarazona, N.; Revelles, O. A holistic view of polyhydroxyalkanoate metabolism in Pseudomonas putida. Environ. Microbiol. 2016, 18, 341–357. [Google Scholar] [CrossRef] [Green Version]
- Madison, L.L.; Huisman, G.W. Metabolic Engineering of Poly(3-Hydroxyalkanoates): From DNA to Plastic. Microbiol. Mol. Biol. Rev. 1999, 63, 21–53. [Google Scholar] [CrossRef] [Green Version]
- Mozejko-Ciesielska, J.; Szacherska, K.; Marciniak, P. Pseudomonas Species as Producers of Eco-friendly Polyhydroxyalkanoates. J. Polym. Environ. 2019, 27, 1151–1166. [Google Scholar] [CrossRef] [Green Version]
- Luef, K.P.; Stelzer, F.; Wiesbrock, F. Poly(hydroxy alkanoate)s in Medical Applications. Chem. Biochem. Eng. Q. 2015, 29, 287–297. [Google Scholar] [CrossRef]
- Ankenbauer, A.; Schäfer, R.A.; Viegas, S.C.; Pobre, V.; Voß, B.; Arraiano, C.M.; Takors, R. Pseudomonas putida KT2440 is naturally endowed to withstand industrial-scale stress conditions. Microb. Biotechnol. 2020, 13, 1145–1161. [Google Scholar] [CrossRef] [Green Version]
- Follonier, S.; Escapa, I.F.; Fonseca, P.M.; Henes, B.; Panke, S.; Zinn, M.; Prieto, M.C. New insights on the reorganization of gene transcription in Pseudomonas putida KT2440 at elevated pressure. Microb. Cell Factories 2013, 12, 30. [Google Scholar] [CrossRef] [Green Version]
- Poblete-Castro, I.; Escapa, I.F.; Jäger, C.; Puchalka, J.; Chi Lam, C.M.C.; Schomburg, D.; Prieto, M.A.; Martins Dos Santos, V.A.P.M. The metabolic response of P. putida KT2442 producing high levels of polyhydroxyalkanoate under single- and multiple-nutrient-limited growth: Highlights from a multi-level omics approach. Microb. Cell Factories 2012, 11, 34. [Google Scholar] [CrossRef] [Green Version]
- Jimenez, J.I.; Minambres, B.; Garcia, J.L.; Díaz, E. Genomic analysis of the aromatic catabolic pathways from Pseudomonas putida KT2440. Environ. Microbiol. 2002, 4, 824–841. [Google Scholar] [CrossRef] [PubMed]
- Kim, J.; Oliveros, J.C.; Nikel, P.I.; De Lorenzo, V.; Silva-Rocha, R. Transcriptomic fingerprinting of Pseudomonas putida under alternative physiological regimes. Environ. Microbiol. Rep. 2013, 5, 883–891. [Google Scholar] [CrossRef] [PubMed] [Green Version]
- Beckers, V.; Poblete-Castro, I.; Tomasch, J.; Wittmann, C. Integrated analysis of gene expression and metabolic fluxes in PHA-producing Pseudomonas putida grown on glycerol. Microb. Cell Factories 2016, 15, 1–18. [Google Scholar] [CrossRef] [PubMed] [Green Version]
- Prieto, M.A.; De Eugenio, L.I.; Galán, B.; Luengo, J.M.; Witholt, B. Synthesis and Degradation of Polyhydroxyalkanoates. In Pseudomonas; Springer: Dodrecht, The Netherlands, 2007; Volume 5, pp. 397–428. ISBN 9781402060977. [Google Scholar]
- De Eugenio, L.I.; Escapa, I.F.; Morales, V.; Dinjaski, N.; Galán, B.; García, J.L.; Prieto, M.A. The turnover of medium-chain-length polyhydroxyalkanoates inPseudomonas putidaKT2442 and the fundamental role of PhaZ depolymerase for the metabolic balance. Environ. Microbiol. 2010, 12, 207–221. [Google Scholar] [CrossRef]
- Hoffmann, N.; Amara, A.A.; Beermann, B.B.; Qi, Q.; Hinz, H.-J.; Rehm, B.H.A. Biochemical Characterization of the Pseudomonas putida3-Hydroxyacyl ACP:CoA Transacylase, Which Diverts Intermediates of Fatty Acid de Novo Biosynthesis. J. Biol. Chem. 2002, 277, 42926–42936. [Google Scholar] [CrossRef] [Green Version]
- Hoffmann, N.; Rehm, B.H.A. Nitrogen-dependent regulation of medium-chain length polyhydroxyalkanoate biosynthesis genes in pseudomonads. Biotechnol. Lett. 2005, 27, 279–282. [Google Scholar] [CrossRef]
- Ciesielski, S.; Mozejko, J.; Przybyłek, G. The influence of nitrogen limitation on mcl-PHA synthesis by two newly isolated strains of Pseudomonas sp. J. Ind. Microbiol. Biotechnol. 2010, 37, 511–520. [Google Scholar] [CrossRef]
- Mozejko-Ciesielska, J.; Pokoj, T.; Ciesielski, S. Transcriptome remodeling of Pseudomonas putida KT2440 during mcl-PHAs synthesis: Effect of different carbon sources and response to nitrogen stress. J. Ind. Microbiol. Biotechnol. 2018, 45, 433–446. [Google Scholar] [CrossRef] [Green Version]
- Brigham, C.J.; Speth, D.R.; Rha, C.; Sinskey, A.J. Whole-Genome Microarray and Gene Deletion Studies Reveal Regulation of the Polyhydroxyalkanoate Production Cycle by the Stringent Response in Ralstonia eutropha H16. Appl. Environ. Microbiol. 2012, 78, 8033–8044. [Google Scholar] [CrossRef] [Green Version]
- Mozejko-Ciesielska, J.; Dabrowska, D.; Szalewska-Palasz, A.; Ciesielski, S. Medium-chain-length polyhydroxyalkanoates synthesis by Pseudomonas putida KT2440 relA/spoT mutant: Bioprocess characterization and transcriptome analysis. AMB Express 2017, 7, 1–13. [Google Scholar] [CrossRef]
- Potrykus, K.; Cashel, M. (p)ppGpp: Still Magical? Annu. Rev. Microbiol. 2008, 62, 35–51. [Google Scholar] [CrossRef] [PubMed] [Green Version]
- Belda, E.; Van Heck, R.G.A.; Lopez-Sanchez, M.J.; Cruveiller, S.; Barbe, V.; Fraser, C.; Klenk, H.-P.; Petersen, J.; Morgat, A.; Nikel, P.I.; et al. The revisited genome ofPseudomonas putidaKT2440 enlightens its value as a robust metabolicchassis. Environ. Microbiol. 2016, 18, 3403–3424. [Google Scholar] [CrossRef] [PubMed]
- Mortazavi, A.; Williams, B.A.; McCue, K.; Schaeffer, L.; Wold, B. Mapping and quantifying mammalian transcriptomes by RNA-Seq. Nat. Methods 2008, 5, 621–628. [Google Scholar] [CrossRef] [PubMed]
- Klinke, S.; De Roo, G.; Witholt, B.; Kessler, B. Role of phaD in Accumulation of Medium-Chain-Length Poly(3-Hydroxyalkanoates) in Pseudomonas oleovorans. Appl. Environ. Microbiol. 2000, 66, 3705–3710. [Google Scholar] [CrossRef] [PubMed] [Green Version]
- Dinamarca, M.A.; Ruiz-Manzano, A.; Rojo, F. Inactivation of Cytochrome o Ubiquinol Oxidase Relieves Catabolic Repression of the Pseudomonas putida GPo1 Alkane Degradation Pathway. J. Bacteriol. 2002, 184, 3785–3793. [Google Scholar] [CrossRef] [Green Version]
- Dinamarca, M.A.; Aranda-Olmedo, I.; Puyet, A.; Rojo, F. Expression of the Pseudomonas putida OCT Plasmid Alkane Degradation Pathway Is Modulated by Two Different Global Control Signals: Evidence from Continuous Cultures. J. Bacteriol. 2003, 185, 4772–4778. [Google Scholar] [CrossRef] [Green Version]
- Ugidos, A.; Morales, G.; Rial, E.; Williams, H.D.; Rojo, F. The coordinate regulation of multiple terminal oxidases by the Pseudomonas putida ANR global regulator. Environ. Microbiol. 2008, 10, 1690–1702. [Google Scholar] [CrossRef] [Green Version]
- Tucker, N.P.; Ghosh, T.; Bush, M.; Zhang, X.; Dixon, R. Essential roles of three enhancer sites in σ54-dependent transcription by the nitric oxide sensing regulatory protein NorR. Nucleic Acids Res. 2009, 38, 1182–1194. [Google Scholar] [CrossRef] [Green Version]
- Ibrahim, S.A.; Crack, J.C.; Rolfe, M.D.; Borrero-De Acuña, J.M.B.-D.; Thomson, A.J.; Le Brun, N.E.; Schobert, M.; Stapleton, M.R.; Green, J. ThreePseudomonas putidaFNR Family Proteins with Different Sensitivities to O2. J. Biol. Chem. 2015, 290, 16812–16823. [Google Scholar] [CrossRef] [Green Version]
- Tribelli, P.M.; Luján, A.M.; Pardo, A.; Ibarra, J.G.; Fernández Do Porto, D.F.D.; Smania, A.; López, N.I. Core regulon of the global anaerobic regulator Anr targets central metabolism functions in Pseudomonas species. Sci. Rep. 2019, 9, 9065. [Google Scholar] [CrossRef]
- Mohanan, N.; Gislason, A.; Sharma, P.K.; Ghergab, A.; Plouffe, J.; Levin, D.B.; De Kievit, T. Quorum sensing and the anaerobic regulator (ANR) control polyhydroxyalkanoate (PHA) production in Pseudomonas chlororaphis PA23. FEMS Microbiol. Lett. 2019, 366. [Google Scholar] [CrossRef] [PubMed]
- Arai, H. Regulation and Function of Versatile Aerobic and Anaerobic Respiratory Metabolism in Pseudomonas aeruginosa. Front. Microbiol. 2011, 2, 103. [Google Scholar] [CrossRef] [PubMed] [Green Version]
- O’Gara, J.P.; Eraso, J.M.; Kaplan, S. A Redox-Responsive Pathway for Aerobic Regulation of Photosynthesis Gene Expression in Rhodobacter sphaeroides 2.4.1. J. Bacteriol. 1998, 180, 4044–4050. [Google Scholar] [CrossRef] [Green Version]
- Oh, J.-I.; Kaplan, S. The cbb3 Terminal Oxidase of Rhodobacter sphaeroides 2.4.1: Structural and Functional Implications for the Regulation of Spectral Complex Formation. Biochemistry 1999, 38, 2688–2696. [Google Scholar] [CrossRef] [PubMed]
- Romeo, A.; Sonnleitner, E.; Sorger-Domenigg, T.; Nakano, M.; Eisenhaber, B.; Bläsi, U. Transcriptional regulation of nitrate assimilation in Pseudomonas aeruginosa occurs via transcriptional antitermination within the nirBD–PA1779–cobA operon. Microbiology 2012, 158, 1543–1552. [Google Scholar] [CrossRef] [PubMed]
- Szalewska-Palasz, A.; Johansson, L.U.M.; Bernardo, L.M.D.; Skärfstad, E.; Stec, E.; Brännström, K.; Shingler, V. Properties of RNA Polymerase Bypass Mutants: Implications for the role of ppGpp and its co-factor DksA in controlling transcription dependent on σ54. J. Biol. Chem. 2007, 282, 18046–18056. [Google Scholar] [CrossRef] [Green Version]
- Brown, D.R.; Barton, G.J.; Pan, Z.; Buck, M.; Wigneshweraraj, S. Nitrogen stress response and stringent response are coupled in Escherichia coli. Nat. Commun. 2014, 5, 4115. [Google Scholar] [CrossRef] [Green Version]
- Hervás, A.B.; Canosa, I.; Little, R.; Dixon, R.; Santero, E. NtrC-Dependent Regulatory Network for Nitrogen Assimilation in Pseudomonas putida. J. Bacteriol. 2009, 191, 6123–6135. [Google Scholar] [CrossRef] [Green Version]
- Gille, A.; Goede, A.; Schlöetelburg, C.; Preissner, R.; Kloetzel, P.-M.; Göbel, U.B.; Frömmel, C. A Comprehensive View on Proteasomal Sequences: Implications for the Evolution of the Proteasome. J. Mol. Biol. 2003, 326, 1437–1448. [Google Scholar] [CrossRef]
- Hervás, A.B.; Canosa, I.; Santero, E. Transcriptome Analysis of Pseudomonas putida in Response to Nitrogen Availability. J. Bacteriol. 2007, 190, 416–420. [Google Scholar] [CrossRef] [Green Version]
- Köhler, T.; Harayama, S.; Ramos, J.L.; Timmis, K.N. Involvement of Pseudomonas putida RpoN sigma factor in regulation of various metabolic functions. J. Bacteriol. 1989, 171, 4326–4333. [Google Scholar] [CrossRef] [PubMed] [Green Version]
- Sze, C.C.; Bernardo, L.M.D.; Shingler, V. Integration of global regulation of two aromatic-responsive sigma(54)-dependent systems: A common phenotype by different mechanisms. J. Bacteriol. 2002, 184, 760–770. [Google Scholar] [CrossRef] [Green Version]
- Mozejko, J.; Przybyłek, G.; Ciesielski, S. Waste rapeseed oil as a substrate for medium-chain-length polyhydroxyalkanoates production. Eur. J. Lipid Sci. Technol. 2011, 113, 1550–1557. [Google Scholar] [CrossRef]
- Ciesielski, S.; Pokój, T.; Klimiuk, E. Molecular insight into activated sludge producing polyhydroxyalkanoates under aerobic–anaerobic conditions. J. Ind. Microbiol. Biotechnol. 2008, 35, 805–814. [Google Scholar] [CrossRef] [PubMed]
- Cottyn, B.; Baeyen, S.; Pauwelyn, E.; Verbaendert, I.; De Vos, P.; Bleyaert, P.; Höfte, M.; Maes, M. Development of a real-time PCR assay for Pseudomonas cichorii, the causal agent of midrib rot in greenhouse-grown lettuce, and its detection in irrigating water. Plant Pathol. 2010, 60, 453–461. [Google Scholar] [CrossRef]
- Anders, S.; Huber, W.; Nagalakshmi, U.; Wang, Z.; Waern, K.; Shou, C.; Raha, D.; Gerstein, M.; Snyder, M.; Mortazavi, A.; et al. Differential expression analysis for sequence count data. Genome Biol. 2010, 11, R106–R112. [Google Scholar] [CrossRef] [Green Version]


| Gene ID | Gene Symbol | Protein | wt | relA/spoT | rpoN | Putative Regulator |
|---|---|---|---|---|---|---|
| PP_4265 | fnrA (Anr) | transcriptional regulator Anr | 2.63 | 1.00 | 2.72 | |
| PP_4251 | ccoO-I | cbb3-type cytochrome c oxidase subunit | 123.89 | 16.95 | 252.3 | fnrA (Anr) |
| PP_4252 | ccoQ-I | cbb3-type cytochrome c oxidase subunit | 91.18 | 18.42 | 209.35 | fnrA (Anr) |
| PP_4253 | ccoP-I | cbb3-type cytochrome c oxidase subunit | 73.31 | 36.09 | 118.18 | fnrA (Anr) |
| PP_3233 | fnrB | Crp/Fnr family transcriptional regulator | 0.70 | 1.45 | 0.50 | |
| PP_3230 | nd | phosphoribosyl transferase domain-containing protein | 6.09 | 5.84 | 4.73 | fnrB |
| PP_3232 | nd | acetyltransferase | 129.77 | 84.94 | 64.07 | fnrB |
| PP_3234 | nd | HSP20 family heat shock protein | 112.06 | 19.24 | 70.71 | fnrB |
| PP_3235 | nd | hypothetical protein | 18.07 | 6.67 | 10.98 | fnrB |
| PP_3236 | nd | lipoprotein OprI | 23.43 | 16.39 | 16.47 | fnrB |
| PP_3237 | nd | universal stress protein family | 20.45 | 17.67 | 16.73 | fnrB |
| PP_3238 | nd | transcriptional regulator PyrR | 8.89 | 21.53 | 5.78 | fnrB |
| PP_3287 | fnrC | Crp/Fnr family transcriptional regulator | 42.46 | 1.21 | 36.46 | |
| PP_3289 | nd | acetyltransferase | 33.95 | 29.93 | 24.14 | fnrC |
| PP_3290 | nd | universal stress protein A family | 23.31 | 11.31 | 14.06 | fnrC |
| PP_3291 | nd | metallo-beta-lactamase protein family | 18.49 | 10.63 | 10.38 | fnrC |
| PP_3292 | nd | membrane protein | 12.82 | 12.61 | 6.95 | fnrC |
| PP_3294 | catA-I | universal stress protein family | 13.43 | 14.68 | 10.88 | fnrC |
| PP_3713 | catB | catechol 1,2-dioxygenase | 19.44 | 4.22 | 5.62 | nd |
| PP_3715 | syrB | muconate cycloisomerase 1 | 32.00 | 19.07 | 4.44 | nd |
| PP_3783 | nd | syringomycin biosynthesis protein 2 | 8.42 | 5.00 | 5.81 | nd |
| PP_0807 | norR | DNA-binding transcriptional regulator | 0.49 | 0.87 | 0.65 | |
| PP_0814 | cyoC | cyt. bo terminal oxidase subun III | 26.22 | 7.43 | 15.99 | norR |
| PP_0815 | cyoD | cyt. bo terminal oxidase subunit IV | 47.17 | 9.02 | 37.9 | norR |
| PP_0989 | gcvH-1 | glycine cleavage system protein H | 21.89 | 26.41 | 17.42 | nd |
| PP_2745 | nd | universal stress protein family | 78.71 | 28.68 | 26.75 | nd |
| PP_4837 | nd | hypothetical protein | 6.24 | 6.21 | 7.98 | nd |
| PP_5735 | nd | hypothetical protein | 63.74 | 12.6 | 55.31 | nd |
| Gene ID | Gene Symbol | Protein | wt | relA/spoT | rpoN | Putative Regulator |
|---|---|---|---|---|---|---|
| PP_2093 | nasT | transcriptional regulator | 7.25↑ | 27.66↑ | 4.00↑* | |
| PP_2090 | cobA | uroporphyrinogen-III C-methyltransferase | 7.37 | 12.55 | 7.69 | nasT |
| PP_2092 | nasA | nitrate transporter | 14.64 | 12.04 | 12.43 | nasT |
| PP_2259 | nd | Sigma 54 dependent transcriptional regulator | 2.00↓* | 1.75↑* | 1.54↑* | |
| PP_2260 | nd | glycerol-phosphate ABC transporter ATP-binding protein | 17.36 | 4.18 | 6.74 | PP_2259 |
| PP_2261 | nd | sugar ABC transporter ATP-binding protein | 39.87 | 7.93 | 8.01 | PP_2259 |
| PP_2262 | nd | sugar ABC transporter permease | 11.31 | 6.05 | 6.29 | PP_2259 |
| PP_2263 | nd | sugar ABC transporter permease | 9.75 | 4.34 | 7.6 | PP_2259 |
| PP_5047 | glnL | ntrB | 1.00⃰ | 5.82↑* | 1.16↓* | |
| PP_5048 | glnG | ntrC | 1.00⃰ | 4.84↑* | 1.23↓* | |
| PP_2685 | nd | hypothetical protein | 1.12 | 4.81 | 1.45 | ntrB/ntrC |
| PP_2686 | nd | transglutaminase domain-containing protein | 12.61 | 37.31 | 14.16 | ntrB/ntrC |
| PP_2687 | nd | hypothetical protein | 11.04 | 16.57 | 16.02 | ntrB/ntrC |
| PP_2688 | nd | hypothetical protein | 14.66 | 32.8 | 19.61 | ntrB/ntrC |
| PP_4841 | urtA | urea ABC transporter substrate-binding protein | 12.7 | 75.03 | 11.12 | ntrB/ntrC |
| PP_4842 | urtB | urea ABC transporter permease | 9.88 | 32.92 | 6.89 | ntrB/ntrC |
| PP_4843 | urtC | urea ABC transporter permease | 14.23 | 26.17 | 9.35 | ntrB/ntrC |
| PP_4844 | urtD | ABC transporter ATP-binding protein | 20.00 | 37.63 | 16.71 | ntrB/ntrC |
| PP_0779 | nd | methyl-accepting chemotaxis transducer/sensory box protein | 12.6 | 5.46 | 11.26 | nd |
| PP_1705 | nirB | nitrite reductase large subunit | 13.37 | 7.48 | 5.21 | nd |
| PP_1706 | nirD | nitrite reductase | 17.03 | 10.49 | 6.57 | nd |
| PP_3007 | nd | hypothetical protein | 7.68 | 5.13 | 7.95 | nd |
| PP_4331 | nd | hypothetical protein | 6.33 | 3.84 | 6.71 | nd |
| PP_4387 | nd | hypothetical protein | 13.22 | 3.53 | 11.64 | nd |
| PP_4631 | nd | hypothetical protein | 7.97 | 8.95 | 7.12 | nd |
| PP_4888 | nd | methyl-accepting chemotaxis transducer | 6.99 | 27.06 | 11.06 | nd |
Publisher’s Note: MDPI stays neutral with regard to jurisdictional claims in published maps and institutional affiliations. |
© 2020 by the authors. Licensee MDPI, Basel, Switzerland. This article is an open access article distributed under the terms and conditions of the Creative Commons Attribution (CC BY) license (http://creativecommons.org/licenses/by/4.0/).
Share and Cite
Dabrowska, D.; Mozejko-Ciesielska, J.; Pokój, T.; Ciesielski, S. Transcriptome Changes in Pseudomonas putida KT2440 during Medium-Chain-Length Polyhydroxyalkanoate Synthesis Induced by Nitrogen Limitation. Int. J. Mol. Sci. 2021, 22, 152. https://doi.org/10.3390/ijms22010152
Dabrowska D, Mozejko-Ciesielska J, Pokój T, Ciesielski S. Transcriptome Changes in Pseudomonas putida KT2440 during Medium-Chain-Length Polyhydroxyalkanoate Synthesis Induced by Nitrogen Limitation. International Journal of Molecular Sciences. 2021; 22(1):152. https://doi.org/10.3390/ijms22010152
Chicago/Turabian StyleDabrowska, Dorota, Justyna Mozejko-Ciesielska, Tomasz Pokój, and Slawomir Ciesielski. 2021. "Transcriptome Changes in Pseudomonas putida KT2440 during Medium-Chain-Length Polyhydroxyalkanoate Synthesis Induced by Nitrogen Limitation" International Journal of Molecular Sciences 22, no. 1: 152. https://doi.org/10.3390/ijms22010152