Article

In Vitro Investigation of Binding Interactions between Albumin–Gliclazide Model and Typical Hypotensive Drugs

by
Ewa Zurawska-Plaksej
1,*,
Rafal Wiglusz
2,
Agnieszka Piwowar
1 and
Katarzyna Wiglusz
3
1
Department of Toxicology, Wroclaw Medical University, 50-556 Wroclaw, Poland
2
Institute of Low Temperature and Structure Research, Polish Academy of Sciences, 50-422 Wroclaw, Poland
3
Department of Analytical Chemistry, Wroclaw Medical University, 50-556 Wroclaw, Poland
*
Author to whom correspondence should be addressed.
Int. J. Mol. Sci. 2022, 23(1), 286; https://doi.org/10.3390/ijms23010286
Submission received: 3 December 2021 / Revised: 20 December 2021 / Accepted: 26 December 2021 / Published: 28 December 2021

Abstract

:
Type 2 diabetes management usually requires polytherapy, which increases the risk of drug-to-drug interactions. Among the multiple diabetes comorbidities, hypertension is the most prevalent. This study aimed to investigate the binding interactions between the model protein, bovine albumin, and the hypoglycemic agent gliclazide (GLICL) in the presence of typical hypotensive drugs: quinapril hydrochloride (QUI), valsartan (VAL), furosemide (FUR), amlodipine besylate (AML), and atenolol (ATN). Spectroscopic techniques (fluorescence quenching, circular dichroism) and thermodynamic experiments were employed. The binding of the gliclazide to the albumin molecule was affected by the presence of an additional drug ligand, which was reflected by the reduced binding constant of the BSA–DRUG–GLICL system. This may indicate a possible GLICL displacement and its enhanced pharmacological effect, as manifested in clinical practice. The analysis of the thermodynamic parameters indicated the spontaneity of the reaction and emphasized the role of hydrogen bonding and van der Waals forces in these interactions. The secondary structure of the BSA remained almost unaffected.

1. Introduction

Type 2 diabetes (T2DM) is the most common metabolic disease in the world. It is characterized by elevated blood glucose levels caused by insulin resistance and/or relative insulin deficiency due to deterioration in the pancreatic β-cell function. Over time, chronic hyperglycemia leads to complex metabolic disturbances and damage to various organs, especially the eyes, kidneys, nerves, heart, and blood vessels. Diabetic patients have a considerably higher cardiovascular risk compared to the general population—cardiovascular disease (CVD) affects more than one third of them, being a major cause of mortality and reduced life expectancy [1,2]. Among the different comorbidities of diabetes, hypertension is the most prevalent. There is a close link between diabetes and hypertension, reflecting a substantial overlap in their etiology and pathomechanism—obesity, inflammation, oxidative stress, and insulin resistance are the common pathways, which may interact with each other, creating a vicious cycle and thus contributing to the progression of microvascular and macrovascular complications [3]. The co-occurrence of T2DM and hypertension requires appropriate joint management to reduce the clinical burden in these patients. At least five different groups of drugs are used in the treatment of hypertension in diabetes patients, both in monotherapy and in combination with other antihypertensives: angiotensin-converting enzyme (ACE) inhibitors, angiotensin II receptor blockers, diuretics, calcium channel blockers, and beta-adrenolytics [4].
Gliclazide (GLICL), a second-generation sulphonylurea, still remains a common therapeutic option for hypoglycemic treatment when metformin is not effective or is contraindicated [5,6]. An additional benefit is its proven cardioprotective effect, especially in decreasing the risk of microvascular complications [7]. GLICL binds tightly to plasma protein (up to 94%), which results in a low volume of distribution [8]. This means that the effective drug concentration in the plasma is much lower than that which was delivered, and the displacement of GLICL from its protein complex may cause significant changes in the free drug fraction and increase the risk of hypoglycemic episodes. It is therefore essential to know all the potential factors which can influence its binding to serum albumin [9].
This study aimed to investigate how the binding of gliclazide may be affected by the presence of other drugs in the system, especially those commonly used in the treatment of hypertension in diabetic patients: (a) quinapril hydrochloride (QUI), an ACE inhibitor; (b) valsartan (VAL), a selective antagonist of angiotensin receptor 1; (c) furosemide (FUR), a loop diuretic; (d) amlodipine besylate (AML), a calcium channel blocker; and (e) atenolol (ATN), a cardioselective beta-adrenolytic agent. These are further referred to as DRUG (Figure 1). Bovine serum albumin (BSA) was used as a representative protein for the evaluation of the binding interactions in the ternary models (BSA–DRUG–GLICL) by spectroscopic techniques [10,11]. Fluorescence quenching studies and the analysis of circular dichroism spectra allowed the calculation of the binding and the standard thermodynamic parameters (free energy of binding, enthalpy and entropy) and the mean residual ellipticity, which could improve the understanding of the nature of the investigated interactions [12,13].

2. Results and Discussion

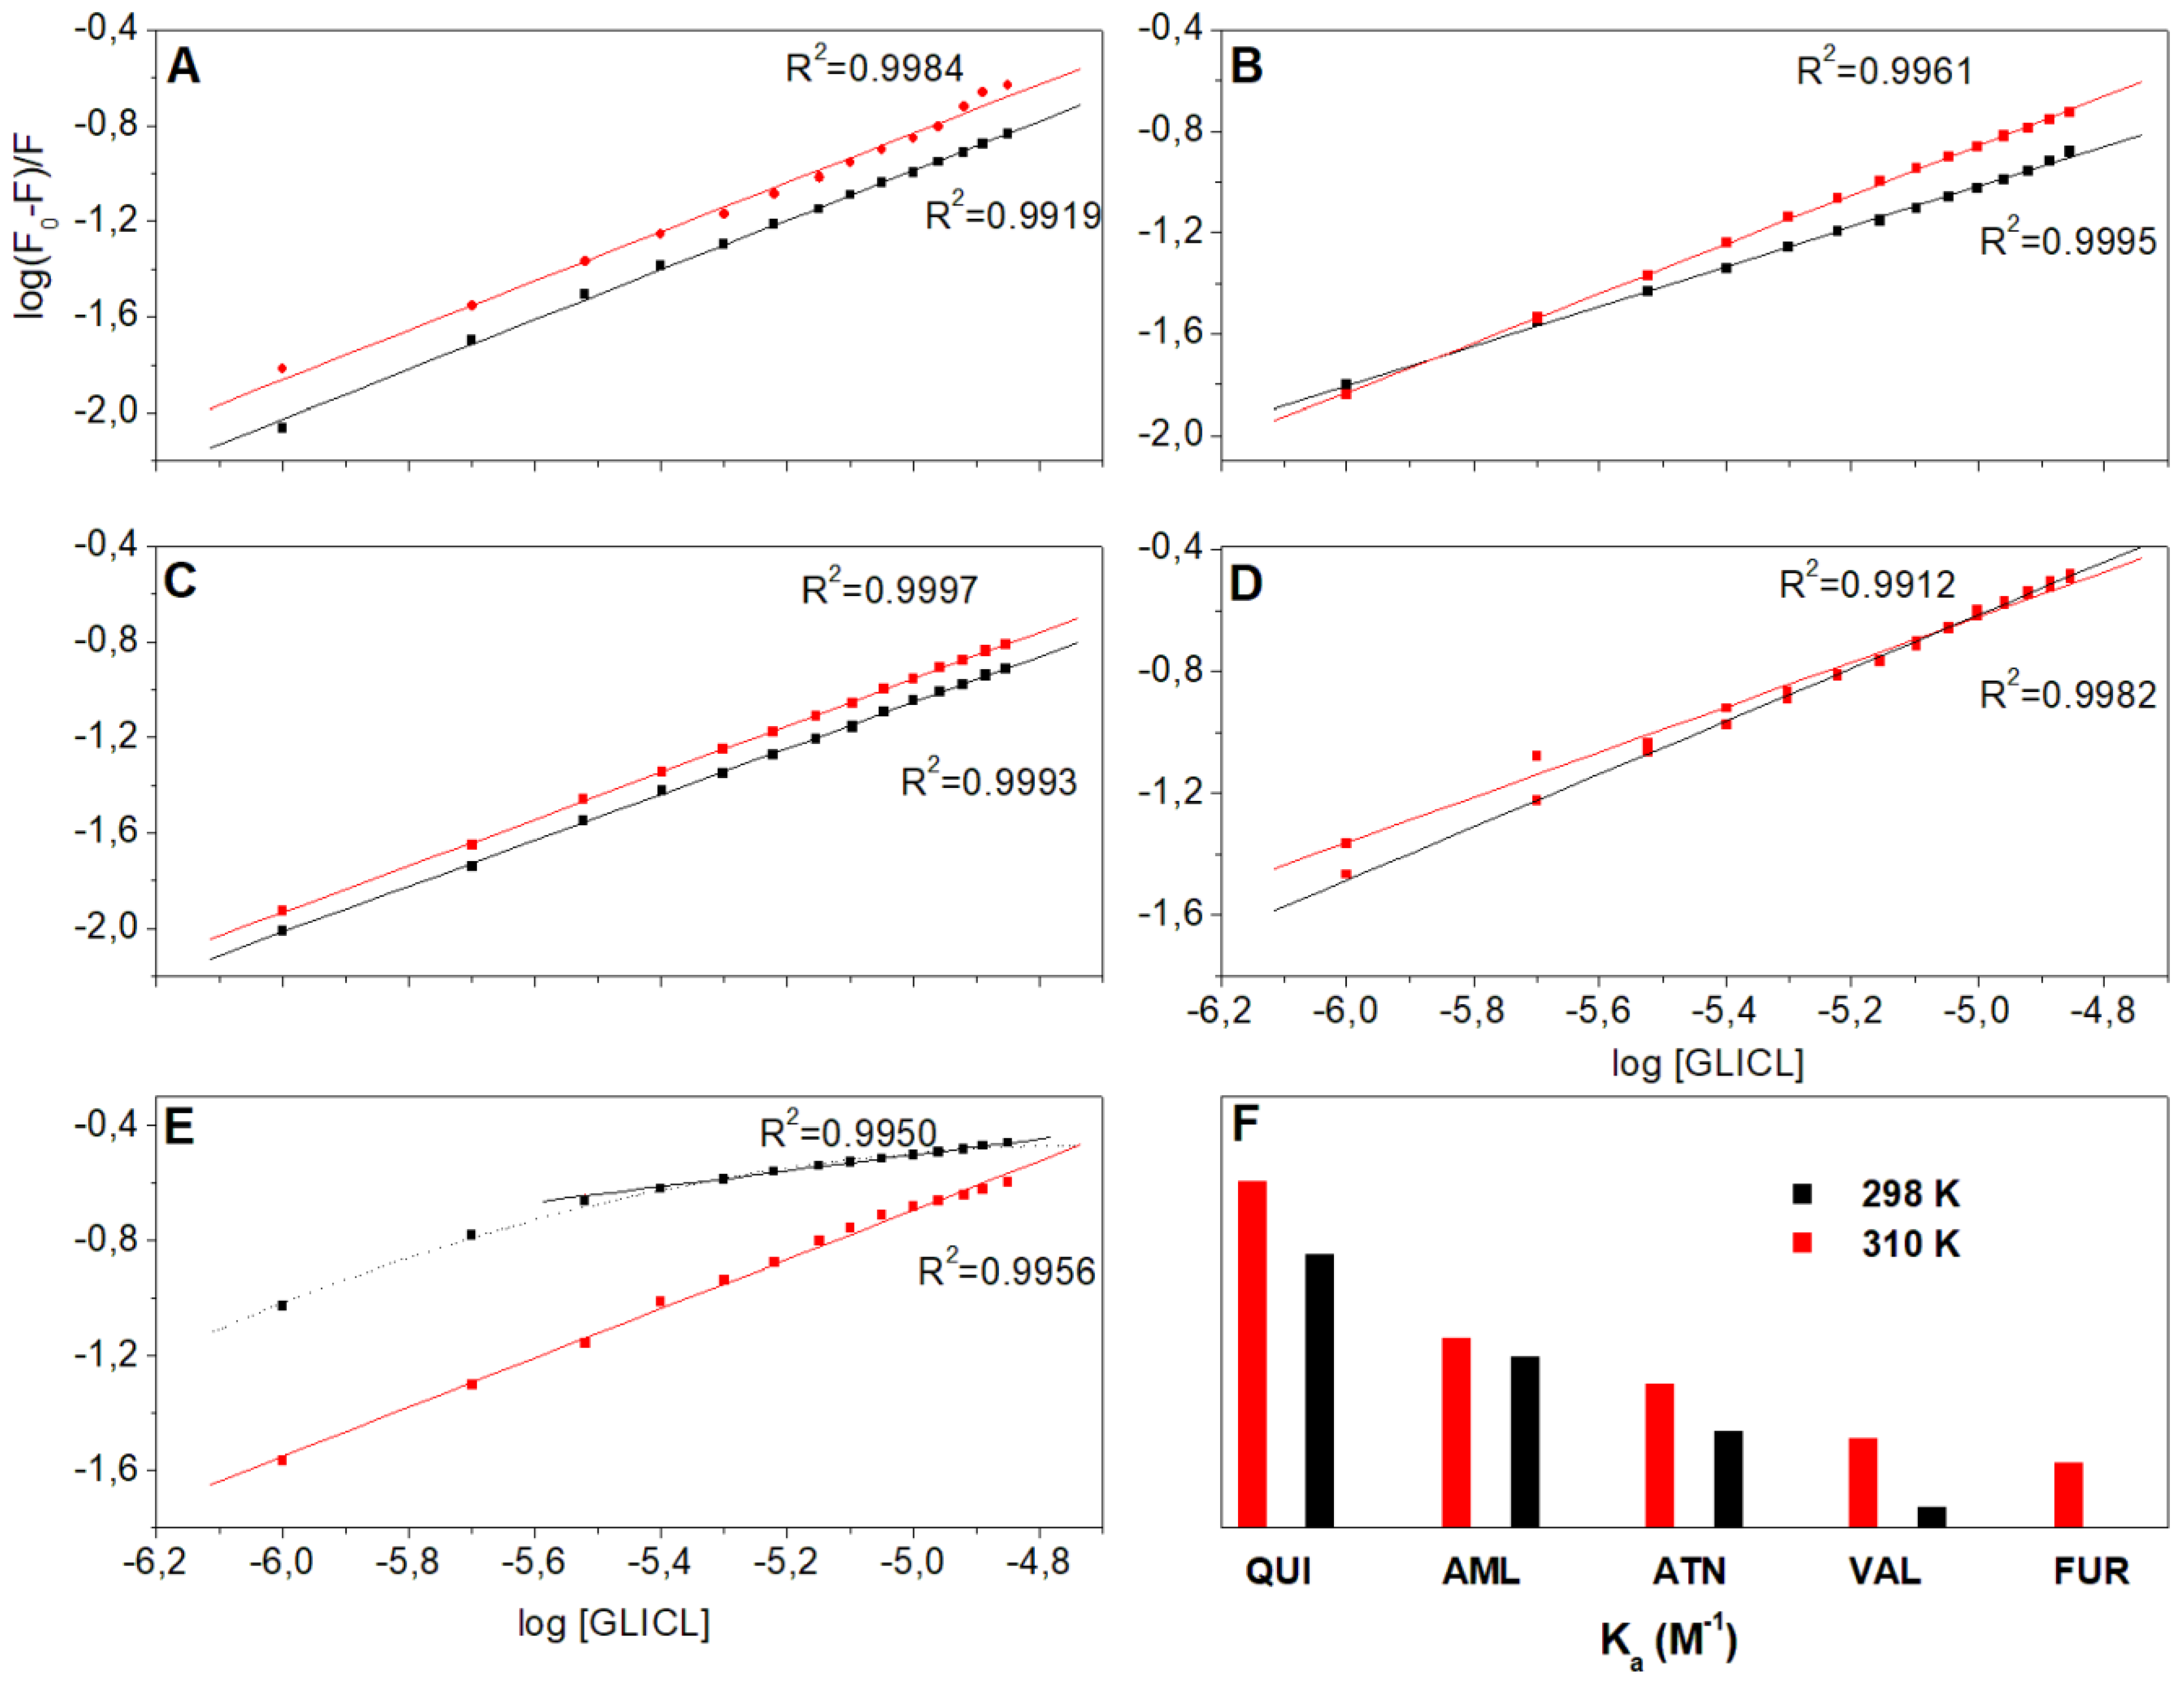
2.1. Fluorescence Quenching

BSA contains three aromatic amino acid fluorophores: tryptophan, tyrosine, and phenylalanine. Considering that phenylalanine has a very low quantum yield, the intrinsic fluorescence of BSA originates mainly from tryptophan and tyrosine residues, which can be measured by excitation at 280 nm [14,15]. Fluorescence quenching is an indispensable tool in protein research, since it reflects the response to the polarity of the local surroundings and allows the observation of the conformational changes observed upon ligand binding [16]. In the performed experiment, an appreciable decrease in the BSA fluorescence after the addition of the studied drug ligands was observed, which evidenced the formation of protein–drug complexes (Figure 2A). In ternary models (BSA–DRUG–GLICL), the fluorescence intensity was gradually reduced as the concentration of the quencher increased (Figure 2B).
The drug ligands influenced the quenching of the BSA fluorescence by GLICL to a varying extent, and the presence of ATN appeared to cause the most pronounced changes. The quenching process may occur by a different mechanism, which is usually classified as dynamic or static quenching. Dynamic quenching occurs when excited-state fluorophores are deactivated upon contact with the quencher molecule in a solution, while static quenching occurs by the formation of a nonfluorescent ground-state complex between the fluorophores and the quencher. The fluorescence intensity by itself cannot discriminate the type of quenching process; hence, additional measurements regarding the dependence on temperature are necessary. For dynamic quenching, the constant increases with the rising temperature, and in the case of the static mechanism this trend is reversed [17]. Table 1 summarizes the quenching data obtained from the ternary models, while the recorded spectra and plots of F0/(F0 − F) vs. 1/Q are included in the supplementary files (Figures S1–S3). The curves show a good linearity within the concentrations investigated at different temperatures, which enables the calculation of the Ksv constants. Regarding the BSA (AML, ATN, QUI, VAL)–GLICL, their values decreased with an increase in the temperature, indicating the static mechanism of quenching. An opposite temperature dependence was observed for the BSA–GLICL interaction in the presence of FUR. This was characteristic of the dynamic mechanism.
In the next step, the effect of drug ligands binding on the association constants and the number of binding sites of BSA–GLICL were estimated. Figure 3 shows the double-logarithm plot (log([F0 − F]/F) vs. log(Q)) at different temperatures, in which the slope equals n and the length of the intercept on the y-axis equals log Ka; the data are presented in Table 2. Most of the binding studies available in the literature concern simple binary protein–ligand models [18,19]. However, a more complex approach is desired, since diabetic patients usually receive more than one medicine and the risk of drug–drug interactions should be considered [20,21]. Particularly, the coadministration of drugs with high protein–binding affinity may induce competitive displacement at specific binding sites and thus result in an increased free drug concentration and its enhanced pharmacological effect [22]. Amongst the different hypoglycemic drugs, gliclazide shows the most significant decrease in binding to albumin when bundled with competing drugs [8,23].
Previously, the Ka of BSA–GLICL was reported as 3.80 and 3.76 × 10⁴ M−1 at 298 and 310 K, respectively [24]. This paper shows that in all the ternary models, Ka decreased in comparison to the binary model. Importantly, the binding of BSA with GLICL was differentially affected by the presence of the studied DRUG ligands and the reduction degree increased in the following order: QUI < AML < ATN < VAL < FUR (Figure 3). Moreover, there was an evident effect of temperature—the binding constants at 310 K were higher than at 298 K, which indicated that an unstable complex was formed between GLICL and BSA in the presence of other ligands due to the static fluorescence quenching mechanism. A similar relationship was found in the interaction between bovine albumin and the hypoglycemic agents—repaglinide and glipizide [25,26]. It is worth noting that the presence of FUR strikingly affected the linearity of the observed fluorescence quenching, especially at 298 K (Ka about 50 M−1); thus, it was concluded that GLICL has extremely low affinity to BSA in such conditions. The diffusion of molecules to the binding sites in albumin depends, among other things, on their diffusion coefficient, which, according to the Stokes–Einstein equation, indicates the facilitation of the diffusion of molecules with an increase in temperature, which additionally reduces the solvent viscosity [17]. In fact, the interaction of gliclazide with albumin in the presence of FUR occurred only at physiological temperature (Ka is in the order of 104 M−1 at 310 K). This observation was also confirmed in the thermodynamic studies, which are explained below.
As indicated in Figure 3F, furosemide had the strongest influence on the Ka of the BSA–GLICL complex. This ligand is known to tightly bind to serum albumin (over 95%) and in vitro studies suggest that at least three binding sites exist for FUR in the BSA molecule; however, it binds primarily to subdomain IIA (site 1) [27]. Based on the previously performed experiment, it was concluded that the primary binding site for GLICL was also located in subdomain IIA [24]. The observed decrease in the Ka value of the BSA–GLICL complex in the presence of FUR may derive from a possible competition of GLICL and FUR for the same binding place. However, there has been no confirmation of such an interaction in clinical practice. On the contrary, episodes of uncontrolled hyperglycemia are reported [28].
Valsartan also showed a great ability to diminish the Ka of the BSA–GLICL complex. Given its high protein binding (95%) and preferential affinity to subdomain IIIA (site 2), it can be suggested that the presence of VAL induced structural changes in the BSA molecule, consequently affecting the availability of GLICL to the binding pocket [29,30,31]. These observations, derived from the in vitro model, have been confirmed under in vivo conditions—pharmacodynamic interaction studies in diabetic rats showed that valsartan treatment exerted an influence on the pharmacokinetics of gliclazide, resulting in a stronger hypoglycemic effect [32,33]. It is therefore necessary to readjust the dose of gliclazide when used concomitantly with valsartan to avoid adverse hypoglycemic episodes in diabetic individuals.
Atenolol was another drug that markedly changed the binding of BSA with GLICL, which is difficult to explain, since the plasma protein binding of ATN is reported as very low (3–15%) and interactions at this level are expected to be minimal [34,35]. Although there is evidence in clinical practice that ATN may increase the therapeutic efficacy of GLICL, the use of beta-blockers was associated with an increased risk of cardiovascular events in patients with diabetes. The mechanism of this interaction is explained by the blunting of the early adrenergic symptoms of impending hypoglycaemia [36,37]. On the other hand, the data in the literature show that atenolol substantially binds to site 1 of albumin with an association constant of approx. 103 M−1; it can also bind to site 2, but to a lower extent [38,39]. Therefore, it is possible that ATN blocked the IIA and IIIA subdomains and thus reduced the GLICL binding, or that both drugs bound to different subdomains, i.e., GLICL in the IIA subdomain, and ATN in IIIA. Further research is needed to elicit the exact mechanism of ATN–GLICL drug interaction in the aspect of binding with BSA.
Quinapril and amlodipine, both tightly binding to plasma protein (over 95%) showed the weakest, but still prominent, influence on the Ka of the BSA–GLICL complex (more than a twofold decrease in comparison to the binary model). Concomitantly, the number of bound gliclazide molecules was almost unchanged, which may suggest that the GLICL was displaced from the high-affinity binding site but remained bound to albumin [40]. Most in vitro studies indicate site 1 as the primarily binding site of QUI and AML in an albumin molecule, and in vivo studies indicate the possible interactions of GLICL both with ACE inhibitors and with calcium channel blockers [41,42].

2.2. Thermodynamic Analysis

Thermodynamic analysis is useful in characterizing protein–ligand interactions. The thermodynamic parameters indicate the forces that then play an important role, e.g., hydrogen bonds, van der Waals forces, electrostatic forces, and hydrophobic interactions [43]. Therefore, the assessment of the effect of additional ligands (in polydrug therapy, e.g., with ATN, AML, QUI, VAL, and FUR) on the binding of BSA to GLIC may indicate the nature or changes in the character of protein–drug binding [44]. The process of the BSA–GLICL complex formation in the presence of various ligands is a spontaneous process, as evidenced by the negative values of the free energy change (ΔG) (Table 2). Positive values of entropy (ΔS) accompany hydrophobic interactions; similarly, a positive enthalpy value (ΔH) testifies to these bonds, while, according to a previous study of the BSA–GLICL complex, this interaction was mainly based on hydrogen bonding and van der Waals forces [24].
The positive values of ΔH and ΔS at the experimental temperatures were also observed in the study of the thermodynamic properties for repaglinide with BSA [25]. Currently, the obtained results indicated that in each case, the presence of additional ligands changed the forces acting between the BSA and GLICL. This means that the coadministration of other drugs with GLICL may alter the interaction with the protein. While the values of ΔH and ΔS were found to be at similar levels for AML, QUI, ATN, and VAL, a significantly higher value of entropy was observed for FUR, which proved that a portion of energy is required for the reaction of BSA with GLICL in the presence of FUR. A strong temperature effect was shown for this interaction, as the Ka value rose to 0.39 × 10⁴ M−1 after heating to 310 K.

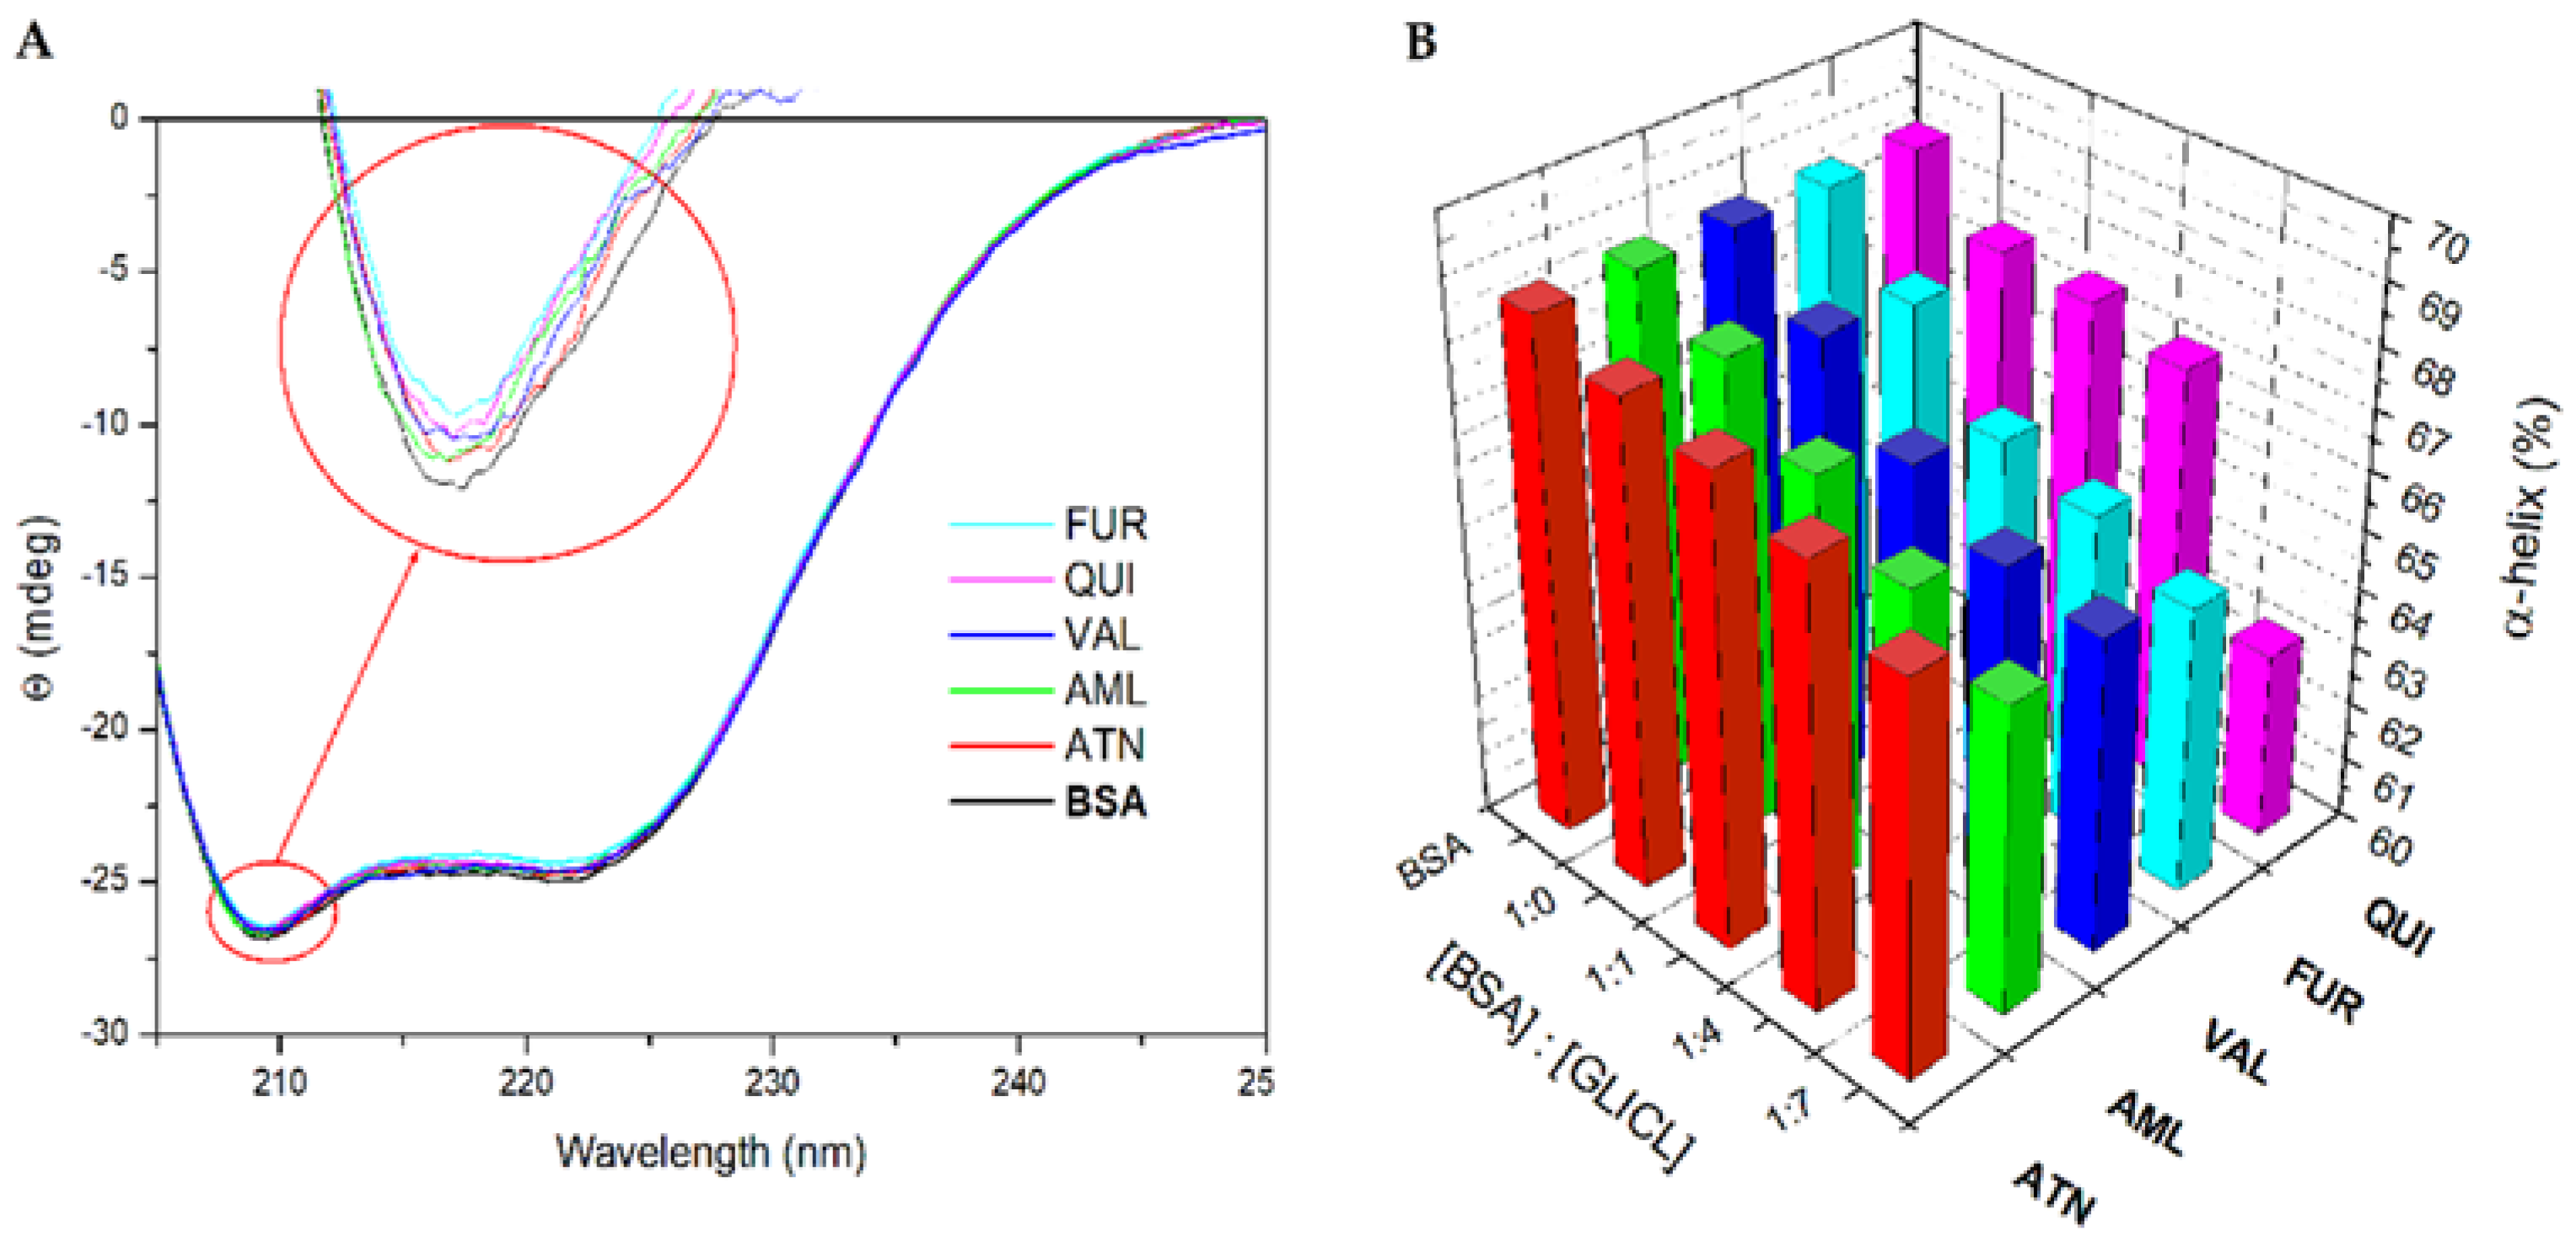
2.3. α-Helical Content of BSA Molecule

BSA contains three homologous α-helical domains. A useful technique for tracking the changes in the secondary structure of a protein is circular dichroism spectroscopy. Figure 4A shows the CD bands of BSA at 208 and 222 nm, which are characteristic of the α-helix structure of the protein. Both of these values contributed to the n → π* transition in the peptide bond of the α-helix [45,46]. The UV–CD spectra of the binary systems (BSA–DRUG) shown in Figure 4A indicate that the binding of the drugs induced a negligible perturbation in the BSA secondary structure. Upon the binding of the drugs, the changes in the alpha-helix were in the range of 0.5–1.3 (Table S1). The presence of ligands had an influence on the slight reduction of the alpha-helical structure in the BSA–DRUG–GLICL systems (Figure 4B and Table S1).

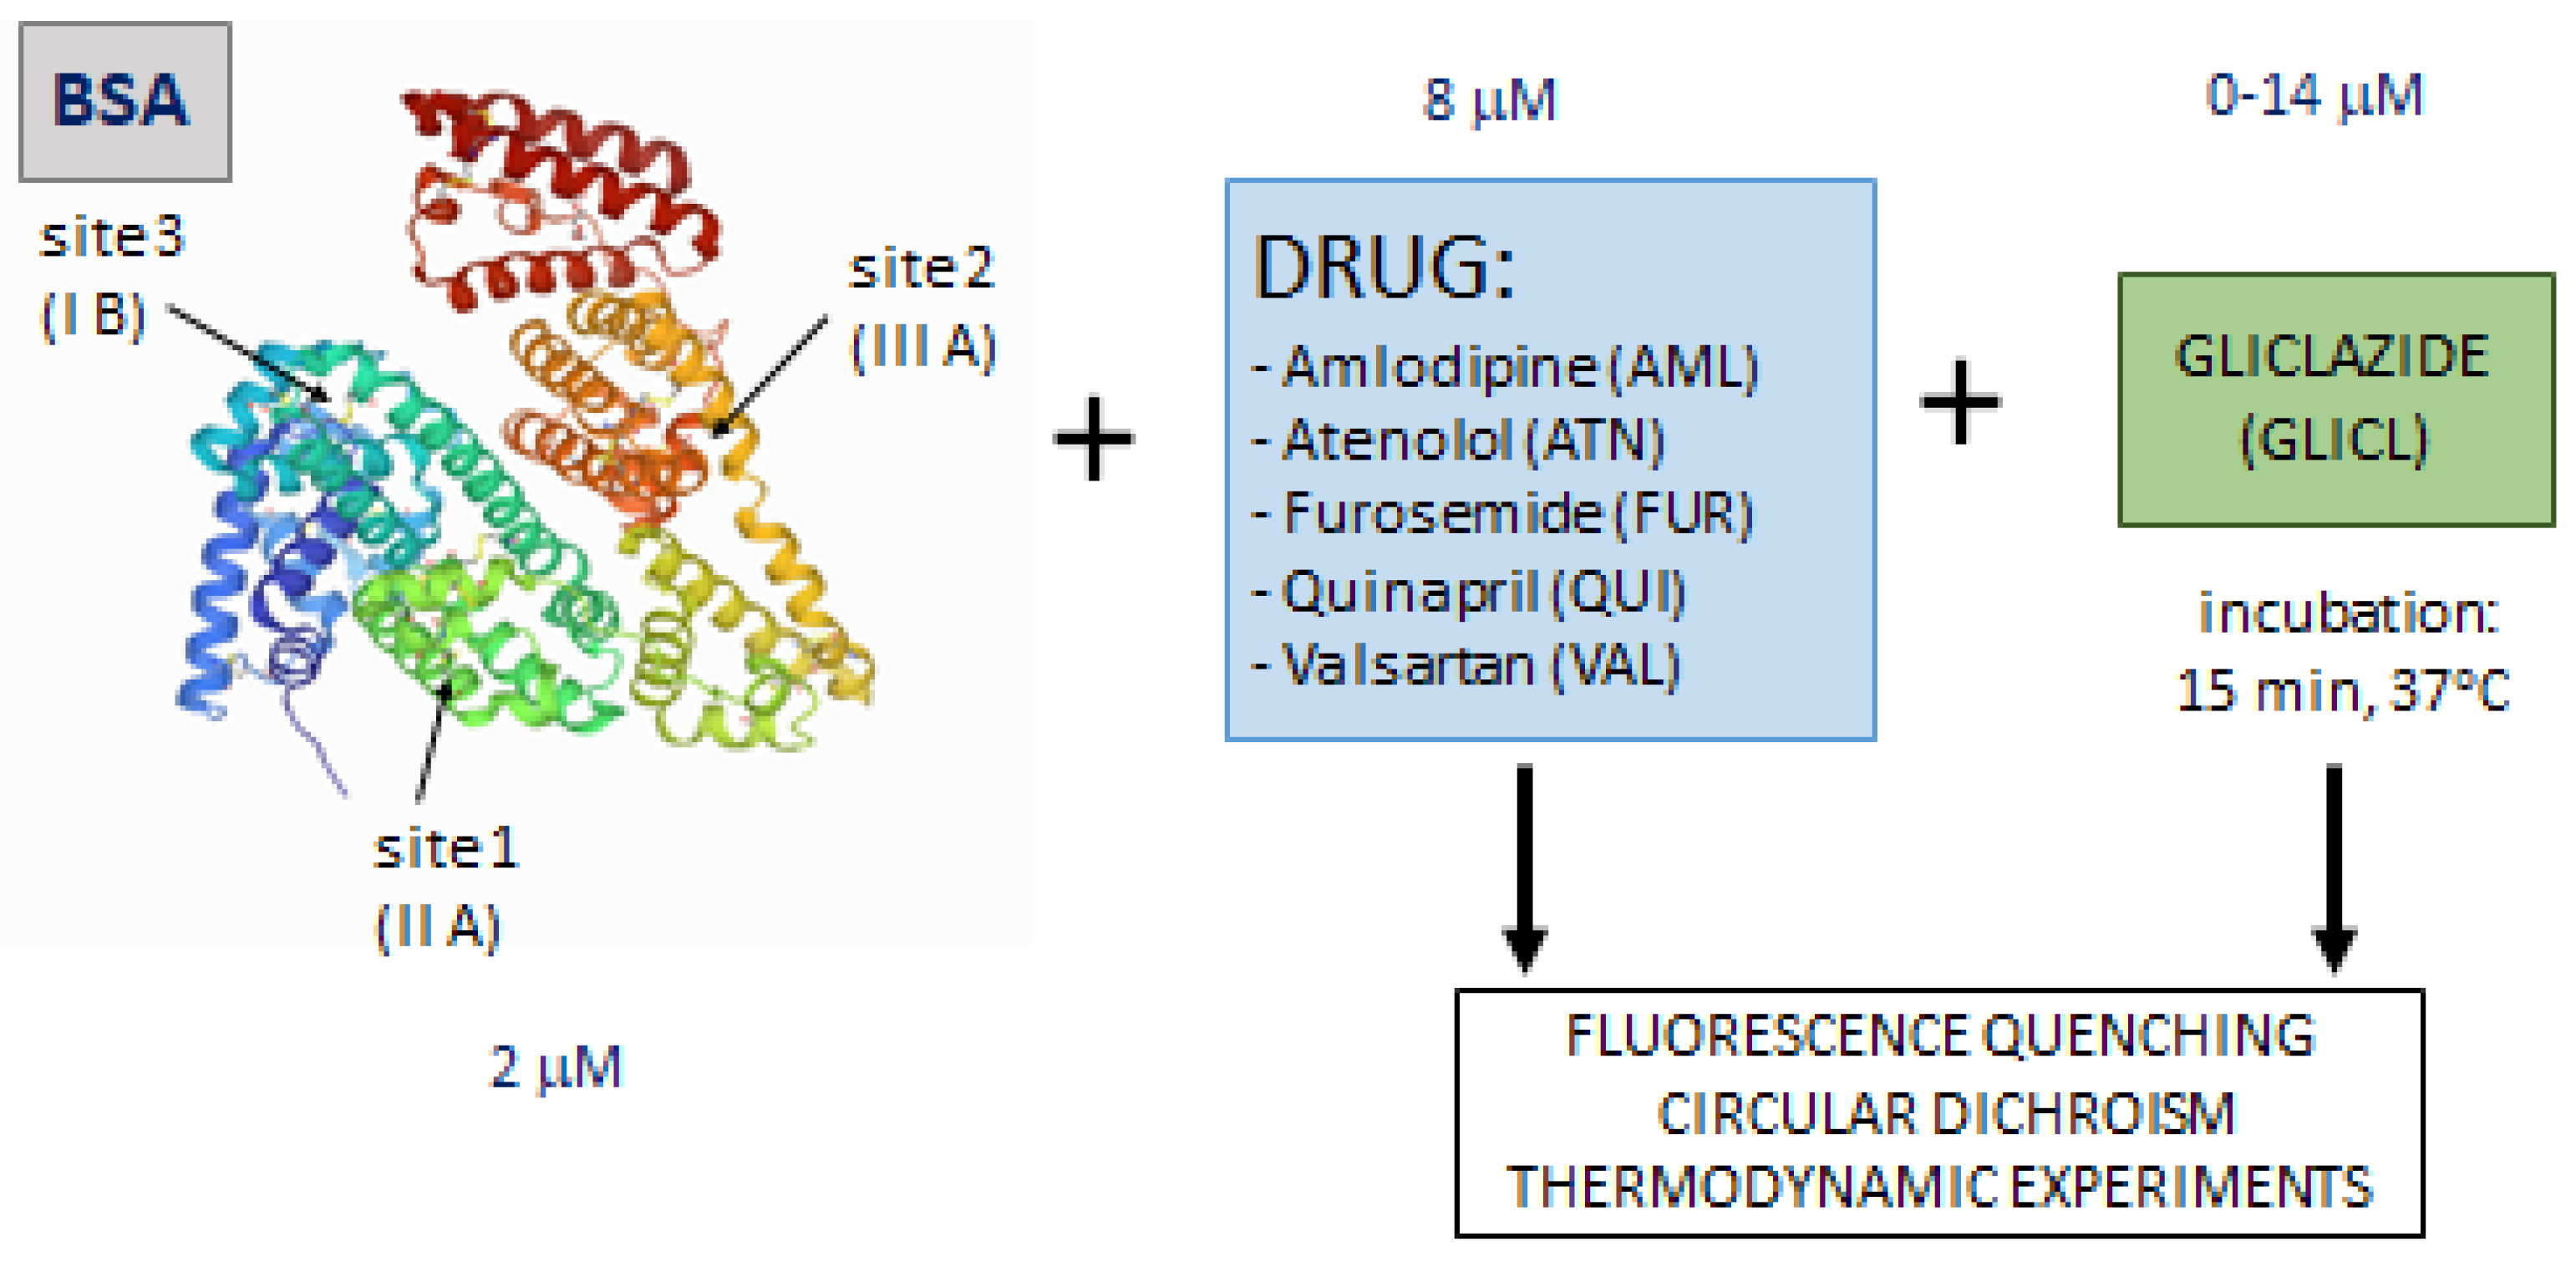
3. Materials and Methods

3.1. Binding Experiment

Bovine serum albumin (≥96%) was used to prepare 1.2 mM stock solution in PBS (pH 7.4). A 1 mM stock solution of gliclazide and 0.4 mM stock solutions of quinapril, valsartan, furosemide, amlodipine, and atenolol were prepared in 5% methanol/PBS. The concentration of BSA was controlled by the spectrophotometric method at 280 nm (with a molar coefficient of 43,824 cm−1 M−1). For spectroscopic experiments, 5 albumin solutions were preincubated with different drug solutions (concentrations fixed at 8 µM, final molar ratio DRUG to albumin 4:1), then GLICL was added to the mixtures in increasing concentrations (from 0 to 14 µM, final molar ratio GLICL to albumin from 0:1 to 7:1) and incubated for 15 min at 37 °C (Figure 5). Simultaneously, a control sample containing BSA solution without any ligands was prepared. Measurements were performed in triplicate. All reagents were received from Sigma-Aldrich (St. Luis, MO, USA).

3.2. Fluorescence Quenching

Fluorescence intensities of ternary models (BSA–DRUG–GLICL) were recorded using a Jasco FP-8200 spectrofluorometer with Peltier-thermo Cell Holder ETC-814 (Tokyo, Japan) at excitation wavelength of 280 nm, equipped with 1.0 cm quartz cells. The slit widths were set at 5 nm. The measurements were conducted at two different temperatures, 298 and 310 K. The fluorescence spectra of the drugs alone were also recorded. Each spectrum background was corrected by subtracting the spectrum of the phosphate buffer as a blank sample. The fluorescence intensity was corrected for the absorption of the exciting energy and reabsorption of the emitted light (internal filter effect) using Equation (1) [48]:
F c o r = F o b s ·   e ( A e x + A e m ) / 2  
where Fcor is the corrected fluorescence, Fobs is the observed fluorescence, and Aex and Aem are the absorbances of the drug at the excitation and emission wavelength.
The UV-visible spectra were measured by a Perkin Elmer Lambda 20 spectrophotometer (Waltham, MA, USA) with 1.0 cm quartz cells. Both the absorbance and intensity of fluorescence were recorded with a scanning speed of 200 nm/min and with 0.5 step resolution.
According to the assumption that fluorophores in a protein molecule may differ in accessibility, modified Stern–Volmer Equation (2) was used for the construction of plots and to calculate quenching constants:
F 0 F 0 F = 1 f a · K S V · Q + 1 f a  
where F0 and F are the fluorescence intensities in the absence and presence of gliclazide (GLICL), respectively; fa is the fraction of the initial fluorescence accessible to the quencher; Ksv is the Stern–Volmer quenching constant; and Q is the concentration of the quencher (GLICL) [17].
The binding parameters (binding constant and number of binding sites) were obtained from double-log modified Stern–Volmer Equation (3):
log F 0 F F = log K a + n · log Q  
where F0 and F are the fluorescence intensities in the absence and presence of the quencher (gliclazide), respectively; Ka is the binding constant of the complex BSA–DRUG–GLICL, expressed as M−1; n is the number of bound gliclazide molecules; and Q is the concentration of the quencher (GLICL).

3.3. Calculation of Standard Thermodynamic Parameters

The thermodynamic analysis of the interaction between albumin and GLICL was performed on measurements at three temperatures (298, 303, 310 K) based on the van’t Hoff Equations (4)–(6):
Δ G = R · T · l n K a
Δ G = Δ H T · Δ S
l n K a = Δ H R · T + Δ S R
where ΔG is the free energy change, ΔH is the enthalpy change, ΔS is the entropy change, R is the universal gas constant, and T is the temperature [43].

3.4. α-Helical Content of BSA Molecule

The circular dichroism spectra data were recorded using JASCO J-1500 spectropolarimeter (Tokyo, Japan) in the range of 205–250 nm, with a scanning speed of 200 nm/min and with 0.1 step resolution using a quartz cuvette with a length path of 0.1 cm. The measurements were conducted for binary (BSA–DRUG) and ternary (BSA–DRUG–GLICL) models to provide information about the influence of ligand binding on the protein structure. The baseline was corrected using a phosphate buffer, pH = 7.4.
Mean residue ellipticity (MRE) was calculated according to the following Equation (7) and expressed in deg cm2 dmol−1:
MRE = Θ o b s c p · n · l · 10
where Θobs is the observed CD (in mdegree), Cp is the molar concentration of BSA, n is the number of amino acid residues (583 for BSA), and l is the path length of the cuvette (0.1 cm).
The α-helical contents of free and modified BSA were calculated from MRE values at 208 nm with Equation (8):
α - helix   ( % ) = MRE 208 4000 33,000 4000   · 100
where MRE208 is the observed MRE value at 208 nm, 4000 is the MRE of the β-form and random coil conformation cross at 208 nm, and 33,000 is the MRE value of the pure α-helix of BSA at 208 nm.
Due to strong energy absorption by the PBS buffer, measurements below 195 nm were impossible and only α-helical content could be calculated.

3.5. Statistical Analysis

All experiments were performed in triplicate. The statistical data were processed using the OriginPro Software (OriginLab Corporation, Northampton, MA, USA).

4. Conclusions

The mechanism of the interactions between gliclazide (hypoglycemic agent) and BSA was analysed in the context of simulated multidrug therapy. The effect of several hypotensive drugs (atenolol, amlodipine besylate, quinapril hydrochloride, valsartan, and furosemide) on the binding and thermodynamic parameters of the BSA–GLICL system was assessed. The structural changes of BSA were observed upon the interactions. The fluorescence spectroscopic measurements indicated the static quenching mechanism of the interaction with BSA in the presence of the drugs tested. The major forces stabilizing the ternary complexes were mainly based on hydrogen bonding and van der Waals interactions. The secondary structure was almost unaffected by the addition of ligands to the experimental system, as determined by CD spectroscopy. All drug ligands caused a reduction in the binding affinity of GLICL to BSA, as evidenced by the lower Ka of the ternary complexes BSA–DRUG–GLICL compared to the model binary complex. This may indicate a possible GLICL displacement and its enhanced pharmacological effect, which is reflected in clinical practice. Binding studies may serve as the first step for the prediction of protein–drug–drug interactions.

Supplementary Materials

The following are available online at: https://www.mdpi.com/article/10.3390/ijms23010286/s1.

Author Contributions

Conceptualization, E.Z.-P., A.P., K.W.; methodology, E.Z.-P., K.W.; software, K.W., R.W.; validation, K.W., R.W.; formal analysis, E.Z.-P., K.W.; investigation, E.Z.-P., K.W., R.W.; resources, A.P., K.W.; data curation, E.Z.-P., K.W.; writing—original draft preparation, E.Z.-P., K.W.; writing—review and editing, E.Z.-P., A.P., R.W., K.W.; visualization, E.Z.-P., K.W.; supervision, R.W., A.P.; project administration, E.Z.-P., K.W.; funding acquisition, A.P., K.W. All authors have read and agreed to the published version of the manuscript.

Funding

This research was funded by Wroclaw Medical University, grant numbers SUB.DO50.21.034 and ST.D150.18.004.

Institutional Review Board Statement

Not applicable.

Informed Consent Statement

Not applicable.

Data Availability Statement

Data supporting reported results are available from the corresponding author upon reasonable request.

Acknowledgments

The authors would like to acknowledge financial support from the National Science Centre (NCN) within the project “Elaboration and characteristics of biocomposites with anti-virulent and anti-bacterial properties against Pseudomonas aeruginosa” (no. UMO-2016/21/B/NZ6/01157).

Conflicts of Interest

The authors declare no conflict of interest. The funders had no role in the design of the study; in the collection, analyses, or interpretation of data; in the writing of the manuscript; or in the decision to publish the results.

References

  1. Cavallari, I.; Bhatt, D.L.; Steg, P.G.; Leiter, L.A.; McGuire, D.K.; Mosenzon, O.; Im, K.; Raz, I.; Braunwald, E.; Scirica, B.M. Causes and Risk Factors for Death in Diabetes: A Competing-Risk Analysis from the SAVOR-TIMI 53 Trial. J. Am. Coll. Cardiol. 2021, 77, 1837–1840. [Google Scholar] [CrossRef] [PubMed]
  2. Einarson, T.R.; Acs, A.; Ludwig, C.; Panton, U.H. Prevalence of cardiovascular disease in type 2 diabetes: A systematic literature review of scientific evidence from across the world in 2007–2017. Cardiovasc. Diabetol. 2018, 17, 83. [Google Scholar] [CrossRef] [PubMed] [Green Version]
  3. Petrie, J.R.; Guzik, T.J.; Touyz, R.M. Diabetes, Hypertension, and Cardiovascular Disease: Clinical Insights and Vascular Mechanisms. Can. J. Cardiol. 2018, 34, 575–584. [Google Scholar] [CrossRef] [Green Version]
  4. De Boer, I.H.; Bangalore, S.; Benetos, A.; Davis, A.M.; Michos, E.D.; Muntner, P.; Rossing, P.; Zoungas, S.; Bakris, G. Diabetes and Hypertension: A Position Statement by the American Diabetes Association. Diabetes Care 2017, 40, 1273–1284. [Google Scholar] [CrossRef] [Green Version]
  5. Landman, G.W.; De Bock, G.H.; van Hateren, K.J.; van Dijk, P.R.; Groenier, K.H.; Gans, R.O.; Houweling, S.T.; Bilo, H.J.; Kleefstra, N. Safety and efficacy of gliclazide as treatment for type 2 diabetes: A systematic review and meta-analysis of randomized trials. PLoS ONE 2014, 9, e82880. [Google Scholar] [CrossRef] [PubMed]
  6. Khunti, K.; Hassanein, M.; Lee, M.K.; Mohan, V.; Amod, A. Role of Gliclazide MR in the Management of Type 2 Diabetes: Report of a Symposium on Real-World Evidence and New Perspectives. Diabetes Ther. 2020, 11, 33–48. [Google Scholar] [CrossRef]
  7. Colagiuri, S.; Matthews, D.; Leiter, L.A.; Chan, S.P.; Sesti, G.; Marre, M. The place of gliclazide MR in the evolving type 2 diabetes landscape: A comparison with other sulfonylureas and newer oral antihyperglycemic agents. Diabetes Res. Clin. Pract. 2018, 143, 1–14. [Google Scholar] [CrossRef]
  8. Sarkar, A.; Tiwari, A.; Bhasin, P.S.; Mitra, M. Pharmacological and Pharmaceutical Profile of Gliclazide: A Review. J. Appl. Pharm. Sci. 2011, 1, 11–19. [Google Scholar]
  9. Seedher, N.; Kanojia, M. Mechanism of interaction of hypoglycemic agents glimepiride and glipizide with human serum albumin. Cent. Eur. J. Chem. 2009, 7, 96–104. [Google Scholar] [CrossRef]
  10. Peters, T., Jr. All about Albumin: Biochemistry, Genetics, and Medical Applications; Academic press: San Diego, CA, USA, 1995. [Google Scholar]
  11. Ràfols, C.; Amézqueta, S.; Fuguet, E.; Bosch, E. Molecular interactions between warfarin and human (HSA) or bovine (BSA) serum albumin evaluated by isothermal titration calorimetry (ITC), fluorescence spectrometry (FS) and frontal analysis capillary electrophoresis (FA/CE). J. Pharm. Biomed. Anal. 2018, 150, 452–459. [Google Scholar] [CrossRef] [PubMed] [Green Version]
  12. Keserü, G.M.; Swinney, D.C. Thermodynamics and Kinetics of Drug Binding; Wiley-VCH Verlag GmbH & Co. KGaA: Weinheim, Germany, 2015; Chapters 1–2; pp. 1–35. [Google Scholar]
  13. Perera, R.P.; Liyanage, V. Spectroscopic Methods in Ligand Protein Interactions: New Insight into Drug-Protein Binding Mechanisms; Lap Lambert Academic Publishing: Sunnyvale, CA, USA, 2010. [Google Scholar]
  14. Quilan, G.J.; Martin, G.S.; Evans, T.W. Albumin: Biochemical properties and therapeutic potential. Hepatology 2005, 41, 1211–1219. [Google Scholar] [CrossRef] [PubMed]
  15. Carter, D.C.; Ho, J.X. Structure of serum albumin. Adv. Protein Chem. 1994, 45, 153–203. [Google Scholar]
  16. Qin, X.; Yang, X.; Du, L.; Minyong, L. Polarity-based fluorescence probes: Properties and applications. RSC Med. Chem. 2021, 12, 1826–1838. [Google Scholar] [CrossRef]
  17. Lakowicz, J.R. Quenching of Fluorescence. In Principles of Fluorescence Spectroscopy, 3rd ed.; Springer: New York, NY, USA, 2006; Chapter 8; pp. 277–330. [Google Scholar]
  18. Ahmed, A.; Mam, B.; Sowdhamini, R. DEELIG: A Deep Learning Approach to Predict Protein-Ligand Binding Affinity. Bioinform. Biol. Insights 2021, 15, 11779322211030364. [Google Scholar] [CrossRef] [PubMed]
  19. Liu, S. Bioprocess Engineering: Kinetics, Sustainability, and Reactor Design, 3rd ed.; Elsevier: New York, NY, USA, 2020; Chapter 9; pp. 351–399. [Google Scholar]
  20. Triplitt, C. Drug Interactions of Medications Commonly Used in Diabetes. Diabetes Spectr. 2006, 19, 202–211. [Google Scholar] [CrossRef] [Green Version]
  21. Miccoli, R.; Penno, G.; Del Prato, S. Multidrug Treatment of Type 2 Diabetes A challenge for compliance. Diabetes Care 2011, 34, S231–S235. [Google Scholar] [CrossRef] [Green Version]
  22. Palleria, C.; Di Paolo, A.; Giofrè, C.; Caglioti, C.; Leuzzi, G.; Siniscalchi, A.; De Sarro, G.; Gallelli, L. Pharmacokinetic drug-drug interaction and their implication in clinical management. J. Res. Med. Sci. 2013, 18, 601–610. [Google Scholar]
  23. Seedher, N.; Kanojia, M. Effect of competitive binding of hypoglycemic agents to human serum albumin on drug pharmacology. Int. J. Pharm. 2015, 5, 1261–1271. [Google Scholar]
  24. Żurawska-Płaksej, E.; Rorbach-Dolata, A.; Wiglusz, K.; Piwowar, A. The effect of glycation on bovine serum albumin conformation and ligand binding properties with regard to gliclazide. Spectrochim. Acta Part A Mol. Biomol. Spectrosc. 2018, 189, 625–633. [Google Scholar] [CrossRef]
  25. Pawar, S.K.; Jaldappagari, S. Interaction of repaglinide with bovine serum albumin: Spectroscopic and molecular docking approaches. J. Pharm. Anal. 2019, 9, 274–283. [Google Scholar] [CrossRef] [PubMed]
  26. Cao, S.; Liu, B.; Li, Z.; Chong, B. A fluorescence spectroscopic study of the interaction between Glipizide and bovine serum albumin and its analytical application. J. Lumin. 2014, 145, 94–99. [Google Scholar] [CrossRef]
  27. Bojko, B.; Sułkowska, A.; Maciazek-Jurczyk, M.; Równicka, J.; Sułkowski, W.W. Influence of myristic acid on furosemide binding to bovine serum albumin. Comparison with furosemide-human serum albumin complex. Spectrochim. Acta Mol. Biomol. Spectrosc. 2010, 76, 6–11. [Google Scholar] [CrossRef] [PubMed]
  28. Hammad, M.A.; Tangiisuran, B.; Kharshid, A.M.; Abdul-Aziz, N.; Hassan, Y.; Aziz, N.A.; Elsayed, T.M. Drug-drug Interaction-related Uncontrolled Glycemia. J. Pharm. Bioallied. Sci. 2017, 9, 221–228. [Google Scholar] [PubMed]
  29. Siddiqui, N.; Husain, A.; Chaudhry, L.; Alam, M.S.; Mitra, M.; Bhasin, P.S. Pharmacological and Pharmaceutical Profile of Valsartan: A Review. J. Appl. Pharm. Sci. 2011, 1, 12–19. [Google Scholar]
  30. Shareful Islam, S.M.; Hossain, M.K.; Kabir, S. Binding of Valsartan to Bovine Serum Albumin: An in vitro Study. Bangladesh Pharm. J. 2012, 15, 39–41. [Google Scholar]
  31. Zsila, F. Subdomain IB Is the Third Major Drug Binding Region of Human Serum Albumin: Toward the Three-Sites Model. Mol. Pharm. 2013, 10, 1668–1682. [Google Scholar] [CrossRef] [PubMed]
  32. Rama Narsimha Reddy, A.; Vijay Kumar, B. Effect of Valsartan on Pharmacokinetics and Pharmacodynamics of Gliclazide in Diabetic Rats. Curr. Res. Cardiovas. Pharmacol. 2017, 6, 22–28. [Google Scholar] [CrossRef] [Green Version]
  33. Khan, M.S.; Gupta, A.K. Hypoglycaemic effect and interactions of angiotensin II type I receptor blocker (Telmisartan) with oral hypoglycaemic agents instreptozocin-induced diabetic rats. World J. Pharm. Pharmaceut. Sci. 2015, 4, 1505–1515. [Google Scholar]
  34. Borchard, U. Pharmacological properties of β-adrenoceptor blocking drugs. J. Clin. Bas. Cardiol. 1998, 1, 5–9. [Google Scholar]
  35. Fitzgerald, J.D.; Ruffin, R.; Smedstad, K.G.; Roberts, R.; McAinsh, J. Studies on the pharmacokinetics and pharmacodynamics of atenolol in man. Eur. J. Clin. Pharmacol. 1978, 13, 81–89. [Google Scholar] [CrossRef]
  36. Tsujimoto, T.; Sugiyama, T.; Shapiro, M.F.; Noda, M.; Kajio, H. Risk of Cardiovascular Events in Patients with Diabetes Mellitus on β-Blockers. Hypertension 2017, 70, 103–110. [Google Scholar] [CrossRef]
  37. May, M.; Schindler, C. Clinically and pharmacologically relevant interactions of antidiabetic drugs. Ther. Adv. Endocrinol. Metab. 2016, 7, 69–83. [Google Scholar] [CrossRef] [PubMed] [Green Version]
  38. Alam, M.A.; Awal, M.A.; Subhan, N.; Mostofa, M. In-vitro relationship between protein-binding and free drug concentrations of a water-soluble selective beta-adrenoreceptor antagonist (atenolol) and its interaction with arsenic. J. Health Popul. Nutr. 2009, 27, 20–30. [Google Scholar] [CrossRef]
  39. Jiang, T.Y.; Zhou, K.L.; Lou, Y.Y.; Pan, D.Q.; Shi, J.H. Probing the behavior of bovine serum albumin upon binding to atenolol: Insights from spectroscopic and molecular docking approaches. J. Biomol. Struct. Dyn. 2018, 36, 1095–1107. [Google Scholar] [CrossRef]
  40. Wang, Q.; Huang, C.R.; Jiang, M.; Zhu, Y.Y.; Wang, J.; Chen, J.; Shi, J.H. Binding interaction of atorvastatin with bovine serum albumin: Spectroscopic methods and molecular docking. Spectrochim. Acta Mol. Biomol. Spectrosc. 2016, 156, 155–163. [Google Scholar] [CrossRef]
  41. Shi, J.; Pan, D.; Jiang, M.; Liu, T.T.; Wang, Q. In vitro study on binding interaction of quinapril with bovine serum albumin (BSA) using multispectroscopic and molecular docking methods. J. Biomol. Struc Dyn. 2017, 35, 2211–2223. [Google Scholar] [CrossRef] [PubMed]
  42. Amlodipine Combined with Gliclazide. Available online: http://drug-data.com/combinations/A/P/amlodipine-gliclazide.html (accessed on 25 November 2021).
  43. Ross, P.D.; Subramanian, S. Thermodynamics of protein association reactions: Forces contributing to stability. Biochemistry 1981, 20, 3096–3102. [Google Scholar] [CrossRef]
  44. Du, X.; Li, Y.; Xia, Y.-L.; Ai, S.-M.; Liang, J.; Sang, P.; Ji, X.-L.; Liu, S.-Q. Insights into Protein–Ligand Interactions: Mechanisms, Models, and Methods. Int. J. Mol. Sci. 2016, 17, 144. [Google Scholar] [CrossRef]
  45. He, Y.; Wang, Y.; Tang, L.; Liu, H.; Chen, W.; Zheng, Z.; Zou, G. Binding of puerarin to human serum albumin: A spectroscopic analysis and molecular docking. J. Fluoresc. 2008, 18, 433–442. [Google Scholar] [CrossRef]
  46. Wiglusz, K.; Żurawska-Płaksej, E.; Rorbach-Dolata, A.; Piwowar, A. How Does Glycation Affect Binding Parameters of the Albumin-Gliclazide System in the Presence of Drugs Commonly Used in Diabetes? In Vitro Spectroscopic Study. Molecules 2021, 26, 3869. [Google Scholar] [CrossRef] [PubMed]
  47. Protein Data Bank. Crystal Structure of Bovine Serum Albumin. Available online: https://www.rcsb.org/structure/4F5S (accessed on 25 November 2021).
  48. Lakowicz, J.R. Instrumentation for Fluorescence Spectroscopy. In Principles of Fluorescence Spectroscopy, 3rd ed.; Springer: New York, NY, USA, 2006; Chapter 2; pp. 55–57. [Google Scholar]
Figure 1. Chemical structures of: (a) quinapril hydrochloride (QUI), (b) valsartan (VAL), (c) furosemide (FUR), (d) amlodipine besylate (AML), (e) atenolol (ATN), and (f) gliclazide (GLICL).
Ijms 23 00286 g001
Figure 2. (A) Intrinsic fluorescence intensity of BSA with and without drug ligands: atenolol (ATN), amlodipine besylate (AML), quinapril hydrochloride (QUI), valsartan (VAL), furosemide (FUR). (B) Percentage changes in fluorescence intensity of BSA solutions upon addition of 0 → 14 μM gliclazide (BSA–GLCIL molar ratio from 1:0 to 1:7) in the presence of another drug ligand observed at 280 nm excitation wavelength.
Ijms 23 00286 g002
Figure 3. (AE) The double-logarithm plots of the gliclazide quenching effect on BSA fluorescence in the presence of different DRUG ligands: QUI (A), AML (B), ATN (C), VAL (D), and FUR (E) at 298 and 310 K, λex = 280 nm. (F) Graphical representation of calculated Ka values of BSA–GLICL complex in the presence of different DRUG ligands at different temperatures.
Ijms 23 00286 g003
Figure 4. (A) Far UV–CD spectra of BSA and BSA–DRUG system (DRUG: atenolol (ATN), amlodipine besylate (AML), quinapril hydrochloride (QUI), valsartan (VAL), furosemide (FUR)). (B) Percentage changes of alpha-helical content of BSA upon binding with gliclazide in presence of drug ligands.
Ijms 23 00286 g004
Figure 5. Schematic workflow of the study of binding interactions of the albumin–drug–gliclazide system [47].
Ijms 23 00286 g005
Table 1. The Stern–Volmer quenching constants (KSV) and binding parameters (Ka, the association constants; and n, the number of binding sites) of BSA–GLICL complex in presence of DRUG ligands (AML, ATN, FUR, QUI, VAL) at 298 and 310 K.
ParametersT [K]AMLATNFURQUIVAL
KSV
[104 M−1]
298 8.51 ± 0.151.32 ± 0.132.80 ± 0.012.23 ± 0.0111.10 ± 0.02
310 0.30 ± 0.010.90 ± 0.103.93 ± 0.090.96 ± 0.161.19 ± 0.06
R2298 0.99990.99930.99400.99670.9973
310 0.99340.99890.99680.99470.9931
Ka
[104 M−1]
2981.03 ± 0.020.58 ± 0.06-1.65 ± 0.020.12 ± 0.04
3101.15 ± 0.010.87 ± 0.050.39 ± 0.102.09 ± 0.070.54 ± 0.08
n2980.97 ± 0.010.96 ± 0.01-1.04 ± 0.010.74 ± 0.02
3100.93 ± 0.010.98 ± 0.010.86 ± 0.011.03 ± 0.030.87 ± 0.01
R22980.99950.9993-0.99840.9912
3100.99610.99970.99560.99190.9982
Table 2. Thermodynamic parameters of BSA–GLICL complex in presence of DRUG ligands (AML, ATN, FUR, QUI, VAL) at different temperatures: 298, 303, and 310 K.
ParametersT [K]AMLATNFURQUIVAL
ΔH (kJ/mol)298
303
310
6.9925.94380.0115.08100.10
ΔS (J/mol K)298
303
310
100.32159.061310.00131.36393.25
ΔG (kJ/mol)298−22.90−21.46−10.38−24.07−17.08
303−23.40−22.25−16.93−24.72−19.05
310−24.10−23.37−26.10−25.64−21.80
Publisher’s Note: MDPI stays neutral with regard to jurisdictional claims in published maps and institutional affiliations.

