Abstract
Pleurotus eryngii, a highly valued edible fungus, is one of the major commercially cultivated mushrooms in China. The development of P. eryngii, especially during the stage of primordium differentiation, is easily affected by light. However, the molecular mechanism underlying the response of primordium differentiation to light remains unknown. In the present study, primordium expression profiles under blue-light stimulation, red-light stimulation, and exposure to darkness were compared using high-throughput sequencing. A total of 16,321 differentially expressed genes (DEGs) were identified from three comparisons. GO enrichment analysis showed that a large number of DEGs were related to light stimulation and amino acid biosynthesis. KEGG analyses demonstrated that the MAPK signaling pathway, oxidative phosphorylation pathway, and RNA transport were most active during primordium differentiation. Furthermore, it was predicted that the blue-light photoreceptor WC-1 and Deoxyribodipyrimidine photolyase PHR play important roles in the primordium differentiation of P. eryngii. Taken together, the results of this study provide a speculative mechanism that light induces primordium differentiation and a foundation for further research on fruiting body development in P. eryngii.
1. Introduction
P. eryngii, also known as the king oyster mushroom, is one of the major commercially cultivated mushrooms in China [1]. P. eryngii is rich in proteins and essential amino acids, and highly appreciated by consumers for its unique almond aroma and abalone flavor [2].
Previous studies have demonstrated that primordium formation and differentiation in P. eryngii can be markedly affected by environmental factors, especially light. Specifically, P. eryngii primordium could not differentiate from a completely dark environment [3]. Blue light stimulates the differentiation of the primordium, while red light exerts an inhibitory effect [4,5]. Nevertheless, the mechanism underlying the response of P. eryngii to light during primordium differentiation has not been elucidated. In recent years, a breakthrough was made in research on the light reaction mechanism of Cordyceps militaris. Wang et al. found that in C. militaris, photoreceptor knockout mutants failed to form primordia under light exposure, showing that the photo-response mechanism of C. militaris primordium formation directly involves photoreceptors [6]. A comparative transcriptomics analysis of Pleurotus ostreatus revealed that blue light induces primordium differentiation by enhancing the activation of glycolysis and the pentose phosphate pathway, whereas red light weakens glycolysis and pentose phosphate pathway activation to impede this stage of development [7]. Blue light plays a dominant role in Lentinula edodes and required for the transformation of nutritional mycelia into a brown film [8]. The depth and thickness of this brown film directly affect the development of the primordium [9].
In recent years, genome-wide sequencing provides an opportunity to explore organism development mechanism, which has been widely used in Capsicum annuum [10], Triticum aestivum L. [10,11], soybean [12], and Salvia miltiorrhiza [13]. Unlike genome-wide sequencing, RNA-sequencing (RNA-seq) is a superior technology to explore functional genomic data for organisms due to transcript can present specific gene expression, so transcriptome sequencing can be performed as a straightforward method for mining differential transcript properties of organisms under different conditions [14]. RNA-seq was used to investigate the tolerance properties of P. eryngii to CdCl2 and NO, and concluded that genes related to oxidoreductase, dehydrogenase, reductase, transferase, and transcription factors can contribute to enhancing the tolerance of P. eryngii to heavy metals [15]. A comparative transcriptome analysis of mature and immature Pleurotus tuoliensis mycelia showed that nucleotide synthesis and energy metabolism were highly active during mycelial maturation and the gene nucleoside diphosphate kinase (NDPK) performed as a key role in this physiological process [16]. In Ganoderma lucidum, a comparative transcriptome analysis of normal mycelia and mycelia subjected to heat stress for 2 h revealed that genes associated with stress resistance, protein assembly, transport and degradation, signal transduction, carbohydrate metabolism and the energy supply were all upregulated in mycelia after heat stress, and this research laid the foundation for the mining of heat stress response genes in G. lucidum [17]. In a study of dikaryotic mycelia and mature fruiting bodies in L. edodes, RNA-seq analysis showed that fruiting body-specific transcripts were significantly enriched in replication, repair, and transcription pathways, which are important for premeiotic replication, nuclear division and meiosis during maturation [18]. To reveal the regulatory mechanism of fruiting body development in P. tuoliensis, high-throughput sequencing was performed on mycelia, primordia, and fruiting bodies, and the most pronounced change in gene expression occurred during the vegetative-to-reproductive transition (from primordia to fruiting bodies), suggesting that primordium differentiation is the most active stage of development [19].
In this study, Illumina sequencing technology were used to explore the differential properties of P. eryngii primordia under three different conditions involving exposure to red light, blue light, and darkness, with the aim of establishing an important basis for elucidating the mechanism of primordium differentiation in P. eryngii.
2. Results
2.1. Morphological Features of Primordia under Different Light Conditions
Cultivation bags fully covered by mature mycelium were cultured in the CNC cultivation house. As shown in Figure 1, the mycelia started to twist and form primordia after approximately 9 days under red light, blue light, and dark conditions. However, significant differences among the different light conditions were observed in the subsequent differentiation stage. Under dark conditions, the primordia exhibited a rough surface and had difficulty forming normal buds, producing malformed young buds without obvious pilei and stalks. In contrast, the primordia under red light and blue light conditions differentiated normally, and young buds were produced in greater abundance and faster under blue light than under red light.
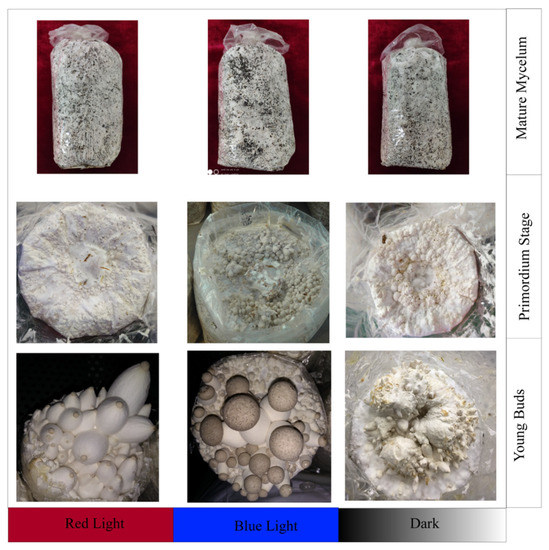
Figure 1.
Morphological features of P. eryngii at each stage under different light treatments. The different light treatments used in the experiment, red light, blue light, and darkness, are presented along the abscissa. The different development periods are presented along the ordinate.
2.2. Sequencing
The raw Illumina sequencing data were deposited in GenBank under BioProject accession PRJNA759008. Table 1 provides an overview of the transcript-level data. After excluding low-quality reads, a total of 21.96 GB of clean data were obtained. High-quality reads showed a mapping rate of 91%, which was above the standard mapping rate of 70%. Moreover, the Q30 values of all sequences of the nine cDNA libraries exceeded 90%, and more than 90% of the bases were valid. Boxplots (Figure 2) showed that the three samples in each group yielded a concentrated range of values and that the sample similarity was high. The above results indicated that the transcripts of the nine primordium samples were all with high quality and could be used for subsequent analysis.

Table 1.
Summary of the transcript expression levels.
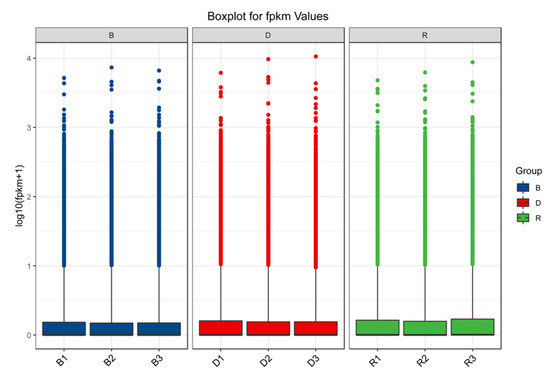
Figure 2.
Transcriptional relationships among 9 samples.
2.3. DEG Identification and Functional Annotation
To investigate transcript differences during primordium differentiation among the different light conditions, DEGs among the groups were identified and annotated. A total of 16,321 DEGs were identified among the three conditions (Figure 3). Specifically, 2797 upregulated and 3608 downregulated in R vs. B, 2810 upregulated and 2545 downregulated in D vs. R, 2044 upregulated and 2517 downregulated in D vs. B. To determine the functions of these DEGs, GO enrichment analysis and KEGG functional annotation were performed, and the results are shown in Figure 4.
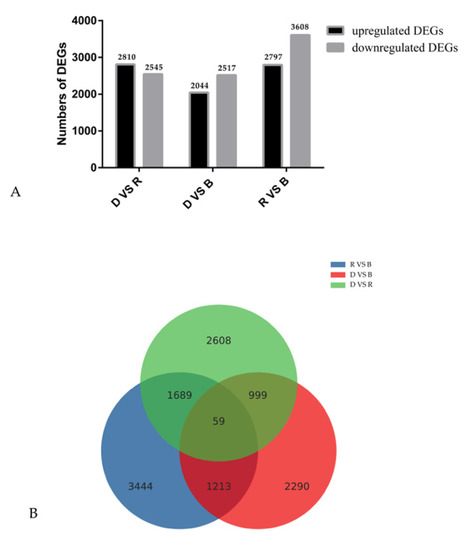
Figure 3.
Gene expression comparisons. (A). The gene expression profile of DEGs. (B). Venn diagram of the number of differentially expressed genes (DEGs). The numbers of upregulated and downregulated genes between D vs. B, D vs. R, and R vs. B are shown.
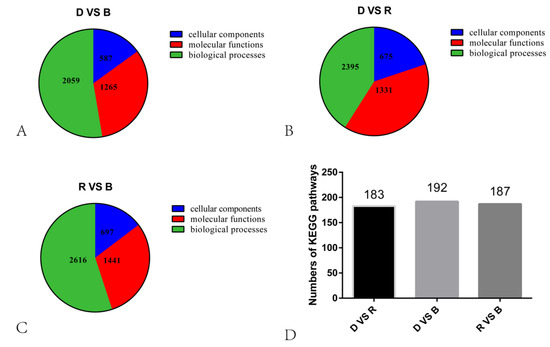
Figure 4.
Statistical results of KEGG and GO analyses. (A–C). Pie chart showing the numbers of GO terms across the three categories. (D). The bars indicate the numbers of KEGG pathways.
In the D vs. B comparison, the 4561 DEGs were enriched in 3911 terms, including 587 terms in the cellular component category, 1265 terms in the molecular function category and 2059 terms in the biological process category. In the D vs. R comparison, 5355 DEGs were enriched in 4401 terms, including 675 terms in the cellular component category, 1331 terms in the molecular function category and 2395 terms in the biological process category. These results are displayed in Supplementary Tables S1 and S2. There were 16 GO terms related to light, which are presented in Figure 5 and Supplementary Tables S1 and S2. Among these GO terms, deoxyribodipyrimidine photolyase activity (GO: 0003904), response to light stimulus (GO: 0009416), and photoreceptor connecting cilium (GO: 0032391) were significantly enriched in both the D vs. B and D vs. R comparisons, implying that light has a great influence on primordium differentiation and that this influence may be exerted through deoxyribodipyrimidine photolyase. The KEGG pathway enrichment results for the D vs. B comparison and the D vs. R comparison are provided in Supplementary Tables S3 and S4, respectively. We focused on the top 20 pathways (Figure 6) and found that the DEGs in these two comparisons were highly concentrated in the KEGG pathways MAPK signaling pathway (MSPY; ko04011), oxidative phosphorylation (OP; ko00190), and RNA transport (RT; ko03013), implying that signal transduction, material and energy metabolism remained significantly active during primordium differentiation in P. eryngii; this finding deserves special attention.
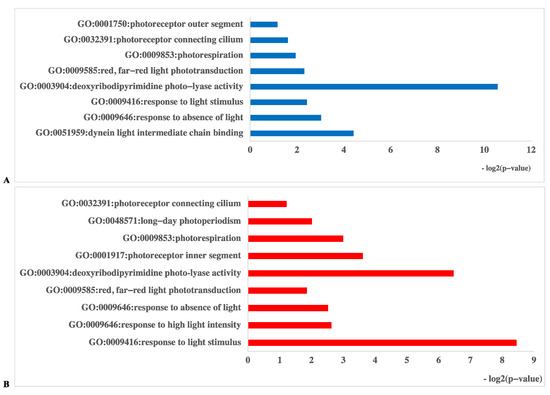
Figure 5.
Gene Ontology (GO) database enrichment analysis of DEGs in primordium between blue or red-light conditions and darkness. (A). DEGs between D and B. (B). DEGs between D and R.
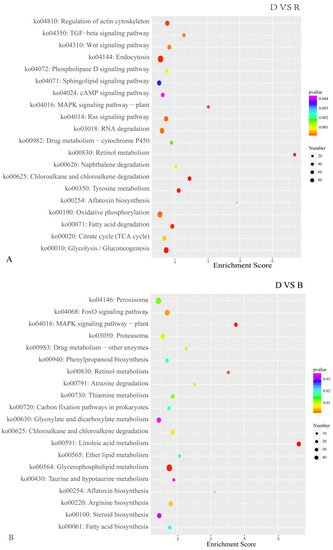
Figure 6.
The top 20 enriched KEGG pathways of DEGs in primordium between blue or red light and darkness. (A). DEGs between D and R. (B). DEGs between D and B. The color intensity is proportional to the enrichment significance, and the circle size indicates the number of enriched genes.
In the R vs. B comparison, 6406 DEGs were enriched in 4754 terms, including 697 terms in the cellular component category, 1441 terms in the molecular function category, and 2616 terms in the biological process category; the results are shown in Supplementary Tables S5 and S6. Figure 7A shows the top 30 GO enrichment terms of upregulated genes, which include 11 terms in the biological process category, 2 in the cellular component category, and 17 in the molecular function category (p < 0.05). Figure 7B shows the top 30 GO terms of downregulated genes, including 17 terms in the biological process category, 4 terms in the cellular component category, and 9 terms in the molecular function category. The terms serine family amino acid biosynthetic processes (GO: 0009070), L-serine biosynthetic processes (GO: 0006564), the positive regulation of phosphatidylcholine biosynthetic processes (GO: 2001247), acetyl-CoA biosynthetic processes (GO: 0006085), and ADP biosynthetic processes (GO: 0006172) showed significant enrichment during blue light induced primordium formation. Given the strong promotion of primordium differentiation under blue light, we conjecture that the positive effect of blue light illumination may be exerted through these biosynthetic pathways.
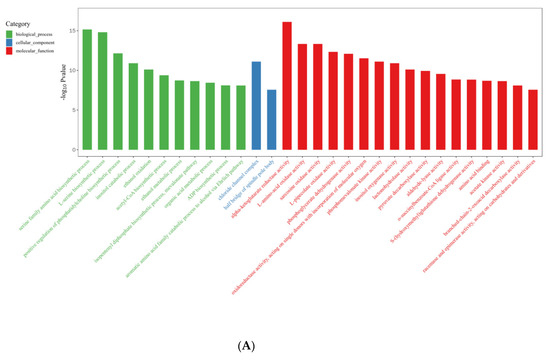
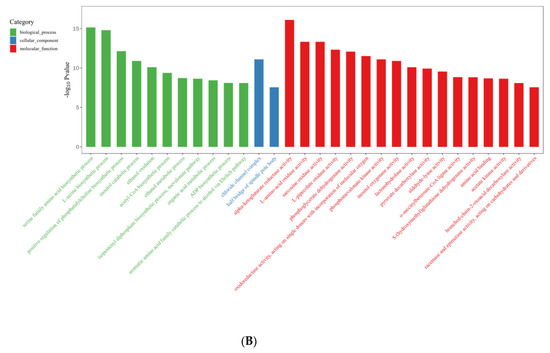
Figure 7.
Gene Ontology (GO) database enrichment analysis of DEGs in primordium between blue light and red light. (A). DEGs upregulated under blue light. (B) DEGs upregulated under red light.
The results of the KEGG pathway enrichment analysis are displayed in Supplementary Tables S7 and S8. The DEGs upregulated under blue light were enriched in 177 KEGG pathways, and the DEGs downregulated under blue light were enriched in 187 KEGG pathways. Figure 8 illustrates the top 20 enriched KEGG pathways. The DEGs were again found to be significantly enriched in the KEGG pathways RT, MSPY, and OP. In the blue-light primordium, the numbers of upregulated DEGs enriched in the RT, MSPY, and OP pathways were 63, 49 and 33, respectively. In the red-light primordium, 43 DEGs in the RT pathway were upregulated, 51 DEGs in the pathway MSPY were upregulated, and 38 DEGs in the OP pathway were upregulated. In some cases, both upregulated genes and downregulated genes were enriched in the same pathway, and cultivation under blue light was shown to promote primordium differentiation, while red light had the opposite effect. Thus, we speculate that these pathways are related to the physiological process of primordium differentiation in P. eryngii.
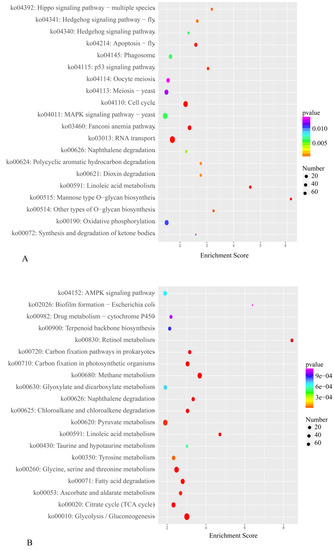
Figure 8.
The top 20 enriched KEGG pathways from R vs. B. (A). Enriched KEGG pathways of downregulated DEGs. (B). Enriched KEGG pathways of upregulated DEGs. The color intensity is proportional to the enrichment significance, and the circle size indicates the number of enriched genes.
2.4. Analysis of DEGs Involved in Light-Induced Primordium Differentiation
To explore the mechanism of primordium differentiation under scattered-light stimulation, the red-light primordium transcripts and blue-light primordium transcripts were separately compared with the dark primordium transcripts. Through comparative analysis, two groups of DEGs were obtained, which are presented in Figure 9.
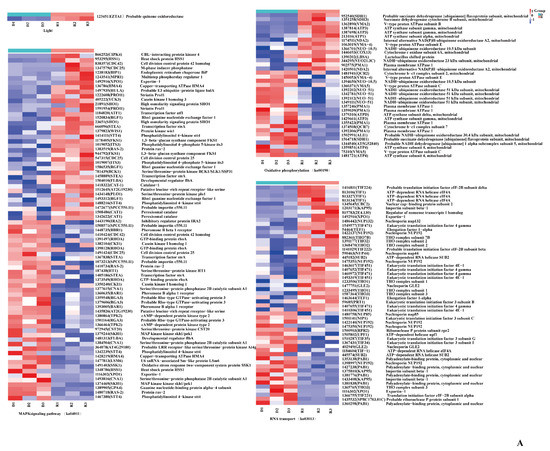
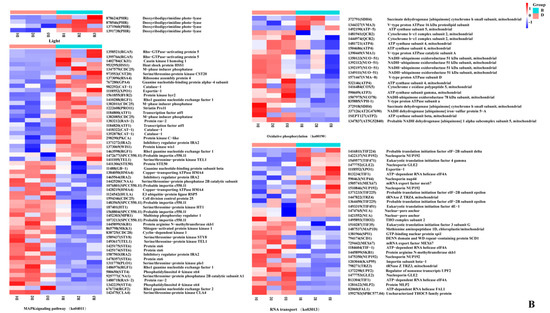
Figure 9.
Genes involved in primordium formation in P. eryngii. (A). The DEGs between darkness and red light. (B). The DEGs between darkness and blue light. The gene ID number and the name of the homolog are indicated on the right side of each subplot. The gene expression values (FPKMs) were transformed to Z-score values.
First, the DEGs associated with light were analyzed. In the D vs. R comparison, we noted that the gene encoding quinone oxidoreductase ZTA1, which related to high light intensity (GO: 0009644), was significantly upregulated in the primordium exposed to red light. Another interesting result was that in the D vs. B comparison, the PHR (878624) gene, encoding deoxyribodipyrimidine photolyase, was significantly upregulated 33-fold in the blue-light primordium.
Immediately thereafter, we analyzed MAPK signaling pathway-related genes. We found that the expression of the gene STEA was upregulated under the light conditions in both comparisons, suggesting that this transcription factor is active only under light. Catalase-1 (CAT-1) detoxifies H2O2 by transforming it into water and oxygen, which can promote the oxidative stress response of fungi to light stimulation [18,20]. As expected, the gene expression of CAT-1 was upregulated under light in both comparisons. Then, the genes enriched in the oxidative phosphorylation pathway were analyzed. A class of genes encoding V-type proton ATPases showed upregulation in all groups, indicating that these enzymes have little relationship to light stimulation and are primarily involved in cell construction. Succinate dehydrogenase is an important enzyme positioned between oxidative phosphorylation and electron transfer and was upregulated under light in both the D vs. B comparison and the D vs. R comparison. We speculate that the high expression level of succinate dehydrogenase was caused by an increase in the oxidative stress response due to light stimulation.
Finally, numerous genes enriched in RNA transport pathways were found, such as encoding an ATP-dependent RNA helicase TIF1, encoding a translation initiation factor TIF224, and encoding eukaryotic translation initiation factor 4E-1 TIF451. Gene expression involves two main steps: transcription and translation. The results imply that primordium differentiation involves the expression of many proteins.
2.5. Analysis of DEGs during Primordium Differentiation Related to Red and Blue Light
As the primordium differentiation rate and quantity were significantly higher under blue-light illumination than under red-light illumination, a comparative analysis of red-light primordium transcripts and blue-light primordium transcripts was performed to investigate the key genes involved. We focused on 13 genes related to light stimulation: 9 genes (WC-1: 1164413, PHR: 1391851, PHR: 1391738, PHR: 1447773, ZTA1: 1350178, PHR: 15069953, TFCC: 1432018, TFCC: 1483280, TFCC: 1507938) upregulated in blue-light primordium samples and 4 genes (AGO1: 1445782, OGG1: 1486735, SR45A: 1557381, ZTA1: 1234511) upregulated in red-light primordium samples (Table 2). GO enrichment analysis showed that WC-1 was related to photoreceptor activity (GO: 0009881), transcription factor activity (GO: 0003700) and protein-chromophore linkage (GO: 0018298) and TFCC was associated with the cellular component term photoreceptor connecting cilium (GO: 0032391). PHR was upregulated by nearly 136-fold in blue-light primordium and was enriched in both the biological process terms deoxyribodipyrimidine photolyase activity (GO: 0003904) and protein-chromophore linkage (GO: 0018298).
Table 2.
DEGs enrich to GO terms related to light.
Considering the specificity of the three KEGG pathways (RT, MSPY, OP), candidate genes in these pathways were investigated and presented in Supplementary Table S9. In the RT pathway, the expression of UPF1 (1377433), and TIF221 (1366755), and some genes encoding nuclear proteins NUP192 (1398997), NUP45 (1423814), NUP192 (1475344), NUP85 (1480758), NUP132 (1501787), and NUP189 (1385072) were upregulated in blue-light primordium, while these genes encoding nuclear proteins were expressed at lower levels in the red-light treatment than in the blue-light treatment, suggesting that the relative inhibition of primordium differentiation by red light may result from the blockade of nuclear protein synthesis. In the pathway MSPY, the expression levels of the transcription factor STEA, developmental regulator FLBA, and several kinases, including SKH1 (1374469), CDC25 (1382011), WIS1 (1378155), MKK1 (1416976), CKI1 (1367085), and STT4 (580687), were upregulated in the blue-light primordium. In the OP pathway, the gene encoding V-type proton ATPase VMA5 (75310) was significantly upregulated in blue-light primordia, while the expression levels of other V-type proton ATPase genes (VMA1 1390441, VMA3 1456048, VMA13 1433531) were upregulated in red-light primordia.
2.6. Protein-Protein Interaction (PPI) Network Prediction
The STRING database of known and predicted protein interactions were used to find potential relationships between proteins in primordium differentiation analysis. Proteins (WC-1, PHR, ZTA1, TFCC, AGO1, OGG1, SR45A) that may respond to light analyzed in this research were used as input to STRING. Selected proteins were linked by known and predicted interactions, and a small network was established (Figure 10). In this network, those known proteins and other unknown interaction proteins were showed. Blue light photoreceptors WC-1 and PHR which we focused were predicted as neighborhood gene. At the same times, we found that proteins RNF41, NTH1, A0A369K0D4 interacted with PHR, and the protein CGPB interacted with WC-1.
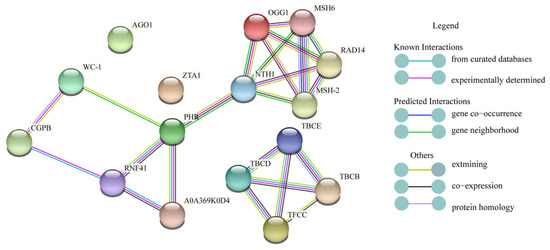
Figure 10.
Protein-protein interaction network.
2.7. Real-Time PCR Validation of Transcription Data
To validate the RNA-seq data, we performed quantitative RT-qPCR with the same primordium tissue. We randomly selected a dozen genes to verify the relative expression levels, including some genes that were upregulated under light and some that were downregulated. Figure 11 shows that the qPCR data were very consistent with the transcriptome sequencing data in the three comparisons, suggesting that the transcriptome data were reliable.
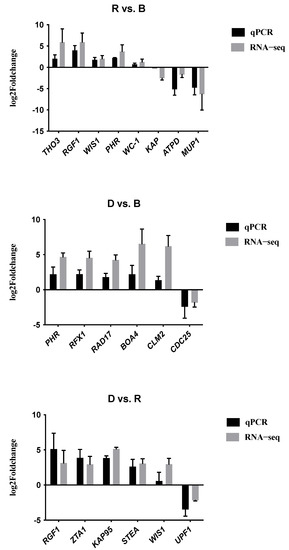
Figure 11.
RT-qPCR validation. The X-axis shows the names of the DEGs. The left Y-axis shows the logarithm of the relative expression level. Error bars indicate the standard deviations of three biological replicates of RT-qPCR analysis.
3. Discussion and Conclusions
P. eryngii is a typical wood rot fungus that mainly relies on mycelia to secrete extracellular enzymes (laccase, etc.) to degrade lignocellulose in the substrate to maintain growth, to some degree, the degradation are related to the morphogenesis of the fruiting-body [21,22]. In the present study, we concentrated on primordium differentiation induce by light, P. eryngii were cultivated with identical substrates to avoid degradation interference.
Primordium formation and differentiation are the critical stages before the growth and development of the fruiting body and are extremely sensitive to light. As early as 1968, the scientist Newman reported that dark conditions inhibited the mycelial growth of Melanotus sp. and the mycelia could only twist to form the primordium and fruiting body under light incubation [23]. The rare edible fungus Isaria cicadae was shown to have differential responses to different light conditions under cultivation: neither primordia nor synnemata formed under red-light irradiation, and primordia formed only under blue light [24]. Our studies demonstrated that the P. eryngii primordium could form under dark conditions but was largely unable to subsequently differentiate into young buds with a stalk and cap structure. The differentiation of P. eryngii primordium depended on light stimulation and occurred earlier under blue-light induction than under red-light induction; this finding is contrast to the research on Cordyceps militaris which illustrated red-light exposure could shorten the time of primordium formation [25]. and we speculate that this difference is due to species differences in the response to light wavelengths. Primordium formation and differentiation in Coprinus stercorarius required blue-light, but continuous light exposure inhibited these processes; only alternating periods of light and darkness could exert a development-promoting effect [26]. Periodic light exposure was also applied in this study, as we took into account the periodic and extremely regular light conditions observed in nature. The yield of mushrooms and the development of the stalk and cap are directly influenced by light conditions. The yield of P. ostreatus is higher under blue light than under red light due to the superior development of stalks and caps under blue light [7].
Complex systems perceive and transform red- or blue-light signals in fungi; nevertheless, the molecular mechanisms by which light activates or inhibits primordium differentiation remain poorly understood. In this study, several important biosynthetic pathways, including the amino acid biosynthetic pathway, the positive regulation of the phosphatidylcholine biosynthesis pathway, and the acetyl Co-A biosynthetic pathway, were found to be active in the blue-light primordium samples, as expected, relatively inactive in the red-light primordium samples. Amino acids are used for the synthesis of tissue proteins and hormones and serve as energy-producing substances in organisms [27]. Phosphatidylcholine is an significant component of cell membranes and plays an important role in cell signaling pathways [28,29]. Acetyl-CoA plays an essential role in glycolysis and fatty acid oxidation [30]. The significant enrichment of these biological pathways suggests that they probably play active roles in blue-light-induced mycelial twisting and primordium formation. However, the mechanisms by which light is sensed and regulates biosynthesis need to be revealed by in-depth research.
Previous studies have shown that many KEGG pathways are related to the growth and development of fungi, such as the MAPK [31,32], oxidative phosphorylation [33], RNA transport and cAMP-PKA pathways [34]. In P. eryngii subsp. tuoliensis (Bailinggu), cold stimulation is the main factor for triggering primordia initiation, and MAPK pathways play a vital role in response to cold stimulation [35]. According to the KEGG enrichment analysis of the DEGs induced by red light and blue light, multiple nucleoprotein-encoding genes were upregulated in the blue-light primordium samples, confirming that nucleoproteins are required for the formation of the nucleus during the unique developmental process of primordium formation. Various kinases involved in the MAPK signaling pathway were also upregulated in the blue-light primordium samples. In most fungi, including P. ostreatus [7] and Cordyceps militaris [36], blue light can induce and accelerate primordium formation, and the related kinases in the MAPK signaling pathway were significantly upregulated in this stage. Another gene enriched in the MAPK signaling pathway, FLBA, which is a developmental regulator to activate the FadA GTPase [37], also showed high expression in the blue-light primordium samples, showing that the activation of the MAPK signaling pathway plays an important role in the rapid formation of primordium. The expression of STEA was upregulated in red- and blue-light primordium samples compared with dark primordium samples. Perhaps the most thorough account of STEA is from research on Arthroderma benhamiae. Krober employed an RNA interference technique to knock down STEA expression, and A. benhamia with loss of STEA did not produce hair perforation organs, but mycelial formation during growth on hair and nails was unaffected [38]. Previous studies suggest that the STEA gene might be involved in the unique development of sex organs in Aspergillus niger and Aspergillus nidulans, but its association with mycelium growth has not been reported [39,40]. In the present research, we speculated that the primordium was only able to differentiate under illumination due to the high expression of STEA under light. In contrast, although primordium formed easily in the absence of light, differentiation was inhibited, possibly due to the low expression of STEA. The expression of one category of VMA genes encoding V-type proton ATPases in primordia was upregulated under both light conditions relative to the dark condition. V-type proton ATPases act specifically as ATP-driven proton pumps, which are essential for the normal development of organisms [41].
ZTA1 plays a key role in the regulation of oxidative stress in fungi. In yeast, disruption of the ZTA1 gene has been found to have no effect on cell growth under standard conditions but to make yeast more sensitive to oxidative stress agents [42]. In this study, ZTA1 was highly expressed in red-light primordium, indicating that the primordium cells were exposed to hyperoxidative stress upon red-light irradiation. Transcription factors that regulate the blue-light response have been identified and studied deeply in fungi and plants, such as WC-1 and PHR. The literature has highlighted that WC-1 is a blue-light photoreceptor with transcription factor activity, while PHR is a blue-light photoreceptor with photolytic enzyme activity that may be involved in sensing blue wavelengths to repair DNA damage [43]. The mechanism by which WC-1 and PHR in edible fungi senses light stimulation has been a hot research topic in recent years. The blue-light receptor gene CmWC-1 in C. militaris has been suggested to promote the switch from a nutritional growth state to primordium formation by inhibiting steroid biosynthesis [44]. External blue-light stimulation can increase the expression of Glwc-1 and Glwc-2 during G. lucidum primordium differentiation, which suggests that the blue-light photoreceptors WC-1 and WC-2 exert essential functions in primordium differentiation [45]. PoWC-1 and PoWC-2 in P. ostreatus have been confirmed to regulate the expression of P. ostreatus target genes and control its development; to exert their biological functions, the two photoreceptors must bind flavin adenine dinucleotide (FAD) to form a complex [46]. In Trichoderma atroviride, blue-light photoreceptors BLR-2 and BLR-1 localize to the PHR-1 promoter and can function as transcriptional complexes in response to light [47]. Neurospora crassa has been widely used as a model organism for light response study, which contain two blue light photoreceptor genes WC-1 and WC-2 [48,49]. The formation of N. crassa conidia requires the genes CON-10 and CON-6, and the activation of this gene requires the transcription complex (WCC) formed by photoreceptors WC-1 and WC-2, only under light, the WCC complex binds to the gene promoter to activate transcription [50]. Another typical ascomycetes Tuber borchii, whose apical growth was inhibited under blue-light irradiation, contains one blue light photoreceptor WC-1 with high similarity to NcWC-1 [51] In our research, As show in Figure 12, WC-1 and PHR showed high expression levels in blue-light primordia when compared to red-light primordium and darkness primordium, speculating that the blue-light receptor WC-1 may be an important transcription factor involved in the differentiation of blue-light-induced primordia and that PHR may be an important enzyme involved in the primordium differentiation induced by blue light.
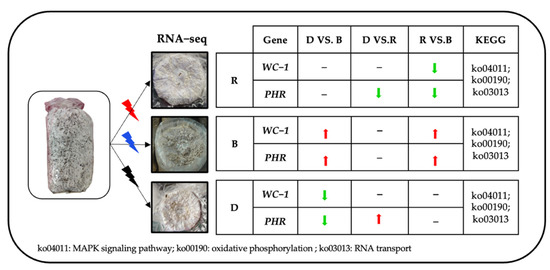
Figure 12.
Brief summary.
Our previous research on pileus morphogenesis analysis of P. eryngii under different lights also showed that PHR exhibited high expression level in pileus exposed to blue light, while the expression level of WC-1 had no significant difference under different lights. Primordium differentiation and pileus morphogenesis are two different developmental stages of P. eryngii, but both require light stimulation, so genes involved in sensing and transducing light were significantly upregulated in these two stages, along with developmental properties-related genes, such as pileus-specific protein hydrophobin-encoding gene, tyrosinase-encoding genes in pileus, quinone oxidoreductase encoding genes and developmental regulator encoding genes in primordium, all showing high expression levels. Accordingly, pathways involved in light response and signal transduction in these two stages were all active, like MAPK signal pathway [52]. The growth and development of all living organisms are complex and dynamic. Therefore, whether there was an interaction between WC-1 and PHR in P. eryngii needs to be further investigated.
In summary, we obtained 16,321 DEGs through a transcriptome sequencing analysis of three categories of primordia. GO and KEGG enrichment analyses showed that the DEGs identified in response to light treatment were mainly enriched in pathways associated with amino acid biosynthesis. Additionally, genes encoding nucleoproteins were significantly upregulated in blue-light primordium samples compared with red-light primordium samples. We speculate that these DEGs may be related to the rate of cell construction. Furthermore, we observed that genes associated with photoresponse characteristics and that encode white-collar protein and deoxyribodipyrimidine photolytic enzyme, were all significantly upregulated in blue-light primordium samples. The results of this study lay a solid foundation for photophysiological research on the P. eryngii primordium and suggest directions for the further study of fruiting body development in P. eryngii.
4. Materials and Methods
4.1. Culture Conditions and Primordium Collection
The commercial P. eryngii strain ACCC_52611 was provided by the Agricultural Culture Collection of China. The preserved strain was activated on potato dextrose agar (PDA) medium before the cultivation experiments. P. eryngii mycelia were grown at 25 °C in polypropylene cultivation bags (size: 42 × 22 cm) containing 1350 g of cultivation substrate (26.8% cotton seed hull, 26.8% sawdust, 11.1% corn flour, 11.1% soybean meal, 22.2% wheat bran, 1% calcium carbonate, 1% lime, 65% water content, pH 8.0–9.0) in the dark for 28 days, during which the substrates were fully covered by mycelia. Then, the cultivation bags were distributed evenly and randomly in three mushroom cultivation houses with computer numerical control (CNC) for subsequent fruiting management. The light conditions of the three cultivation houses were set to 12 h red-light/dark periodic illumination, 12 h blue-light/dark periodic illumination, and 24 h dark conditions. Temperature and humidity were controlled at 12–14 °C and 90%, respectively, until primordia formed. Three cultivation bags were randomly selected from each cultivation house, and primordium samples were collected with a sterilized knife, placed in sterile Eppendorf (EP) tubes, immediately frozen in liquid nitrogen and then preserved frozen at −80 °C for RNA extraction. For the convenience of reporting, the primordia from the red-light house, blue-light house, and dark house were referred to as R, B, and D, respectively.
4.2. RNA Extraction, cDNA Library Construction and Illumina Sequencing
Frozen samples were fully ground in liquid nitrogen, and total RNA was extracted according to the protocol of the mirVanaTM miRNA Isolation Kit (Ambion, Elk Grove, CA, USA). After the remaining gDNA in the RNA was digested with DNase, mRNA was enriched with oligo (dT) magnetic beads, and fragmentation buffer was then added to fragment the mRNA into short pieces. First-strand cDNA synthesis was conducted with random hexamer primers using the short mRNA fragments as templates, and second-strand cDNA synthesis was performed using the first-strand cDNA as a template. The purified double-stranded cDNA ends were repaired, a-tailed and ligated with sequencing adapters. Then, fragment size selection was performed to construct a library through PCR amplification. The nine cDNA libraries were assessed for quality on an Agilent 2100 Bioanalyzer (Agilent Technologies, Santa Clara, CA, USA) and sequenced using an Illumina HiSeqTM 2500 system (HiSeqTM 2500, San Diego, CA, USA)).
4.3. Differentially Expressed Gene (DEG) Analysis and Functional Annotation
The raw reads generated via high-throughput sequencing were provided as fastq format sequences. The raw reads were filtered by adapter removal, and low-quality bases and N bases were removed by using NGS QC Toolkit software [53] to obtain high-quality clean reads. Subsequently, the clean reads were mapped to the reference genome of P. eryngii (https://genome.jgi.doe.gov/portal/Pleery1/download/Pleery1_AssemblyScaffolds.fasta.gz (accessed on 6 September 2018) using HISAT2 (http://ccb.jhu.edu/software/hisat2 (accessed on 6 September 2018)) with the default software parameters, and the samples were evaluated according to the total mapping ratio.
The present study was carried out at the transcriptome level. Sequence similarity searches were performed, and clean reads were mapped to the P. eryngii transcripts derived from the JGI transcriptome reference database (https://genome.jgi.doe.gov/Pleery1/download/Pleery1_all_transcripts_20150629.nt.fasta.gz (accessed on 6 September 2018) and annotated with the GFF2 annotation file (https://genome.jgi.doe.gov/Pleery1/download/Pleery1_all_genes_20150629.gff.gz (accessed on 6 September 2018). Transcript expression levels were calculated as fragments per kb per million reads (FPKM) values using eXpress, and the counts of protein-coding reads were analysed using Bowtie2. Differentially expressed transcripts were identified using the estimate size factors function of the DESeq package of R. P-values and fold changes between samples were computed using the nbinom test function. Differences were considered significant according to a p-value < 0.05 and a |log2−fold change| > 1.
Enrichment analyses were performed based on Gene Ontology (GO) [54] and Kyoto Encyclopedia of Genes and Genomes (KEGG) annotation [55]. The number of differentially expressed transcripts allocated to each GO term was counted, and the significance of the enrichment of differentially expressed transcripts under each GO term was calculated using the hypergeometric distribution test. The test result returned a p-value, with a small p-value indicating significant enrichment of differentially expressed transcripts under that GO term. At the same time, multiple hypothesis testing correction with p-values was performed using the false discovery rate (FDR). KEGG (https://www.genome.jp/kegg/, accessed on 6 September 2018) is a major public pathway-related database. The significance of KEGG pathways was analysed using the hypergeometric distribution test, and the p-values were corrected using the FDR.
4.4. Real-Time Quantitative (RT-qPCR) Analysis
The accuracy of the RNA-seq data was confirmed by RT-qPCR. Total RNA from primordium samples was extracted using an RNA reagent kit (Omega, GA, USA). Each RNA sample was subjected to RNase-free DNase I (Omega, GA, USA) digestion to remove gDNA, and cDNA was synthesized according to the protocol of the PrimeScript RT Reagent Kit (Vazyme, Nanjing, China). RT-qPCR primers were designed with Primer 5 and are shown in Table 3. The GAPDH gene was used as the internal control. Each experiment conducted in this research was repeated three times to verify the reproducibility of the results.
Table 3.
Primers for RT-qPCR.
4.5. PPI Network
The PPI network of DEGs related to light were constructed using STRING database (http://string-db.org (accessed on 25 November 2021). Gene symbols were used as input and fungi were selected as species. At the same time, the interaction score set as 0.400.
4.6. Statistical Analysis
Relative gene expression levels were calculated by the 2−ΔΔCt method. Data were analysed using Excel 2010. Figures were produced using GraphPad Prism software and Adobe Illustrator software. Differences with a p-value less than 0.05 were considered statistically significant.
Supplementary Materials
The following supporting information can be downloaded at: https://www.mdpi.com/article/10.3390/ijms23010435/s1.
Author Contributions
Methodology, D.Y. F.D. Q.H. and Y.Z.; software, D.Y. and F.D.; validation, D.Y., F.D. and X.B.; data curation, D.Y. and X.B.; writing—original draft preparation, D.Y.; writing—review and editing, F.D. and Y.Z.; project administration, Q.H. and D.Y. All authors have read and agreed to the published version of the manuscript.
Funding
This research was supported by funding from the China Agriculture Research System (CARS20) and the National Natural Science Foundation of China (Grant No. 32000015).
Institutional Review Board Statement
Not applicable.
Informed Consent Statement
Not applicable.
Data Availability Statement
Not applicable.
Acknowledgments
The authors thank Shanghai OE Biotech Co., Ltd. for cDNA libraries sequencing.
Conflicts of Interest
The authors declare no conflict of interest.
References
- Nie, Y.; Zhang, P.; Deng, C.; Xu, L.; Yu, M.; Yang, W.; Zhao, R.; Li, B. Effects of Pleurotus eryngii (mushroom) powder and soluble polysaccharide addition on the rheological and microstructural properties of dough. Food Sci. Nutr. 2019, 7, 2113–2122. [Google Scholar] [CrossRef] [Green Version]
- Estrada, A.E.R.; Royse, D.J. Yield, size and bacterial blotch resistance of Pleurotus eryngii grown on cottonseed hulls/oak sawdust supplemented with manganese, copper and whole ground soybean. Bioresour. Technol. 2007, 98, 1898–1906. [Google Scholar] [CrossRef]
- Xie, C.; Gong, W.; Zhu, Z.; Yan, L.; Hu, Z.; Peng, Y. Comparative transcriptomics of Pleurotus eryngii reveals blue-light regulation of carbohydrate-active enzymes (CAZymes) expression at primordium differentiated into fruiting body stage. Genomics 2018, 110, 201–209. [Google Scholar] [CrossRef]
- Jang, M.J.; Lee, Y.H.; Kim, J.H.; Ju, Y.C. Effect of LED light on primordium formation, morphological properties, ergosterol content and antioxidant activity of fruit body in Pleurotus eryngii. Korean J. Mycol. 2011, 39, 175–179. [Google Scholar] [CrossRef]
- Ye, D.; Du, F.; Zou, Y.J.; Zhang, H.J.; Hou, Z.S.; Hu, Q.X. Effects of light conditions on the differentiation and physiological effects of Pleurotus eryngii primordium. China J. Appl. Environ. Biol. 2019, 25, 1107–1112. [Google Scholar]
- Wang, F.; Song, X.; Dong, X.; Zhang, J.; Dong, C. DASH-type cryptochromes regulate fruiting body development and secondary metabolism differently than CmWC-1 in the fungus Cordyceps militaris. Appl. Microbiol. Biotechnol. 2017, 101, 4645–4657. [Google Scholar] [CrossRef] [PubMed]
- Wang, H.; Tong, X.; Tian, F.; Jia, C.; Li, C.; Li, Y. Transcriptomic profiling sheds light on the blue-light and red-light response of oyster mushroom (Pleurotus ostreatus). AMB Express 2020, 10, 10. [Google Scholar] [CrossRef] [Green Version]
- Song, T.; Shen, Y.; Jin, Q.; Feng, W.; Fan, L.; Cai, W. Comparative phosphoproteome analysis to identify candidate phosphoproteins involved in blue light-induced brown film formation in Lentinula edodes. PeerJ 2020, 8, e9859. [Google Scholar] [CrossRef] [PubMed]
- Huang, X.; Zhang, R.; Qiu, Y.; Wu, H.; Xiang, Q.; Yu, X.; Zhao, K.; Zhang, X.; Chen, Q.; Penttinen, P.; et al. RNA-seq profiling showed divergent carbohydrate-active enzymes (CAZymes) expression patterns in Lentinula edodes at brown film formation stage under blue light induction. Front. Microbiol. 2020, 11, 1044. [Google Scholar] [CrossRef]
- Kumar, M.; Kherawat, B.S.; Dey, P.; Saha, D.; Singh, A.; Bhatia, S.K.; Ghodake, G.S.; Kadam, A.A.; Kim, H.U.; Chung, S.M.; et al. Genome-wide identification and characterization of PIN-FORMED (PIN) gene family reveals role in developmental and various stress conditions in Triticum aestivum L. Int. J. Mol. Sci. 2021, 22, 7396. [Google Scholar] [CrossRef] [PubMed]
- Kesawat, M.S.; Kherawat, B.S.; Singh, A.; Dey, P.; Kabi, M.; Debnath, D.; Saha, D.; Khandual, A.; Rout, S.; Ali, A.; et al. Genome-Wide Identification and Characterization of the Brassinazole-resistant (BZR) Gene Family and Its Expression in the Various Developmental Stage and Stress Conditions in Wheat (Triticum aestivum L.). Int. J. Mol. Sci. 2021, 22, 8743. [Google Scholar] [CrossRef]
- Wang, M.; Chen, B.; Zhou, W.; Xie, L.; Wang, L.; Zhang, Y.; Zhang, Q. Genome-wide identification and expression analysis of the AT-hook Motif Nuclear Localized gene family in soybean. BMC Genom. 2021, 22, 361. [Google Scholar] [CrossRef]
- Jiang, M.; Chen, H.; Liu, J.; Du, Q.; Lu, S.; Liu, C. Genome-wide identification and functional characterization of natural antisense transcripts in Salvia miltiorrhiza. Sci. Rep. 2021, 11, 4769. [Google Scholar] [CrossRef]
- Shell Cox, J.; Van Dyke, M.W. General and genomic DNA-Binding specificity for the Thermus thermophilus HB8 transcription factor TTHB023. Biomolecules 2020, 10, 94. [Google Scholar]
- Li, Q.; Huang, W.; Xiong, C.; Zhao, J. Transcriptome analysis reveals the role of nitric oxide in Pleurotus eryngii responses to Cd(2+) stress. Chemosphere 2018, 201, 294–302. [Google Scholar] [CrossRef]
- Du, F.; Ti, N.; Hu, Q.; Zou, Y.; Ye, D.; Zhang, A.H. A comparative transcriptome analysis reveals physiological maturation properties of mycelia in Pleurotus tuoliensis. Genes 2019, 10, 703. [Google Scholar] [CrossRef] [PubMed] [Green Version]
- Tan, X.; Sun, J.; Ning, H.; Qin, Z.; Miao, Y.; Sun, T.; Zhang, X. De novo transcriptome sequencing and comprehensive analysis of the heat stress response genes in the basidiomycetes fungus Ganoderma lucidum. Gene 2018, 661, 139–151. [Google Scholar] [CrossRef]
- Song, H.Y.; Kim, D.H.; Kim, J.M. Comparative transcriptome analysis of dikaryotic mycelia and mature fruiting bodies in the edible mushroom Lentinula Edodes. Sci. Rep. 2018, 8, 8983. [Google Scholar] [CrossRef] [PubMed]
- Fu, Y.; Dai, Y.; Yang, C.; Wei, P.; Song, B.; Yang, Y.; Sun, L.; Zhang, Z.W.; Li, Y. Comparative transcriptome analysis identified candidate genes related to Bailinggu mushroom formation and genetic markers for genetic analyses and breeding. Sci. Rep. 2017, 7, 9266. [Google Scholar] [CrossRef] [PubMed] [Green Version]
- Wang, N.; Yoshida, Y.; Hasunuma, K. Loss of Catalase-1 (Cat-1) results in decreased conidial viability enhanced by exposure to light in Neurospora crassa. Mol. Genet. Genom. 2007, 277, 13–22. [Google Scholar] [CrossRef]
- Pena, A.; Babiker, R.; Chaduli, D.; Lipzen, A.; Wang, M.; Chovatia, M.; Rencoret, J.; Marques, G.; Sanchez-Ruiz, M.I.; Kijpornyongpan, T.; et al. A multiomic approach to understand how Pleurotus eryngii transforms non-woody lignocellulosic material. J. Fungi 2021, 7, 426. [Google Scholar] [CrossRef]
- Zhang, Q.; Zhao, L.; Li, Y.; Wang, F.; Li, S.; Shi, G.; Ding, Z. Comparative transcriptomics and transcriptional regulation analysis of enhanced laccase production induced by co-culture of Pleurotus eryngii var. ferulae with Rhodotorula mucilaginosa. Appl. Microbiol. Biotechnol. 2020, 104, 241–255. [Google Scholar] [CrossRef] [PubMed]
- Newman, D.A. The Influence of temperature and light on growth and sporulation of Melanotus sp. Trans. Br. Mycol. Soc. 1968, 51, 737–747. [Google Scholar] [CrossRef]
- Liu, K.B.; Wang, F.; Liu, G.J.; Dong, C.H. Effect of environmental conditions on synnema formation and nucleoside production in Cicada Flower, Isaria cicadae (Ascomycetes). Int. J. Med. Mushrooms 2019, 21, 59–69. [Google Scholar] [CrossRef]
- Chao, S.C.; Chang, S.L.; Lo, H.C.; Hsu, W.K.; Lin, Y.T.; Hsu, T.H. Enhanced production of fruiting body and bioactive ingredients of Cordyceps militaris with LED light illumination optimization. J. Agric. Sci. Technol. 2019, 21, 451–462. [Google Scholar]
- Ellis, R.J.; Bragdon, G.A.; Schlosser, B.J. Properties of the blue light requirements for primordia initiation and basidiocarp maturation in Coprinus stercorarius. Mycol. Res. 1999, 103, 779–784. [Google Scholar] [CrossRef]
- Lin, M.; Bachman, K.; Cheng, Z.; Daugherty, S.C.; Nagaraj, S.; Sengamalay, N.; Ott, S.; Godinez, A.; Tallon, L.J.; Sadzewicz, L.; et al. Analysis of complete genome sequence and major surface antigens of Neorickettsia helminthoeca, causative agent of salmon poisoning disease. Microb. Biotechnol. 2017, 10, 933–957. [Google Scholar] [CrossRef] [Green Version]
- Liu, Z.Y.; Yishake, D.; Fang, A.P.; Zhang, D.M.; Liao, G.C.; Tan, X.Y.; Zhang, Y.J.; Zhu, H.L. Serum choline is associated with hepatocellular carcinoma survival: A prospective cohort study. Nutr. Metab. 2020, 17, 25. [Google Scholar] [CrossRef] [PubMed]
- Luo, Z.; Loja, M.; Farwell, D.G.; Luu, Q.C.; Donald, P.J.; Amott, D.; Gandour-Edwards, R.; Nitin, N. High-resolution optical molecular imaging of changes in choline metabolism in oral neoplasia. Transl. Oncol. 2013, 6, 33–41. [Google Scholar] [CrossRef] [Green Version]
- Lee, S.Y.; Park, S.B.; Kim, Y.E.; Yoo, H.M.; Hong, J.; Choi, K.J.; Kim, K.Y.; Kang, D. iTRAQ-Based Quantitative Proteomic Comparison of 2D and 3D Adipocyte Cell Models Co-cultured with Macrophages Using Online 2D-nanoLC-ESI-MS/MS. Sci. Rep. 2019, 9, 16746. [Google Scholar] [CrossRef]
- Zhang, J.; Ren, A.; Chen, H.; Zhao, M.; Shi, L.; Chen, M.; Wang, H.; Feng, Z. Transcriptome analysis and its application in identifying genes associated with fruiting body development in basidiomycete Hypsizygus marmoreus. PLoS ONE 2015, 10, e0123025. [Google Scholar] [CrossRef] [Green Version]
- Xiang, L.; Li, Y.; Zhu, Y.; Luo, H.; Li, C.; Xu, X.; Sun, C.; Song, J.; Shi, L.; He, L.; et al. Transcriptome analysis of the Ophiocordyceps sinensis fruiting body reveals putative genes involved in fruiting body development and cordycepin biosynthesis. Genomics 2014, 103, 154–159. [Google Scholar] [CrossRef]
- Lara-Rojas, F.; Sanchez, O.; Kawasaki, L.; Aguirre, J. Aspergillus nidulans transcription factor AtfA interacts with the MAPK SakA to regulate general stress responses, development and spore functions. Mol. Microbiol. 2011, 80, 436–454. [Google Scholar] [CrossRef] [PubMed] [Green Version]
- Yamada, M.; Kurano, M.; Inatomi, S.; Taguchi, G.; Okazaki, M.; Shimosaka, M. Isolation and characterization of a gene coding for chitin deacetylase specifically expressed during fruiting body development in the basidiomycete Flammulina velutipes and its expression in the yeast Pichia pastoris. FEMS Microbiol. Lett. 2008, 289, 130–137. [Google Scholar] [CrossRef] [PubMed] [Green Version]
- Fu, Y.P.; Liang, Y.; Dai, Y.T.; Yang, C.T.; Duan, M.Z.; Zhang, Z.; Hu, S.N.; Zhang, Z.W.; Li, Y. De Novo Sequencing and Transcriptome Analysis of Pleurotus eryngii subsp. tuoliensis (Bailinggu) Mycelia in Response to Cold Stimulation. Molecules 2016, 21, 560. [Google Scholar] [CrossRef] [Green Version]
- Zhang, J.; Wang, F.; Yang, Y.; Wang, Y.; Dong, C. CmVVD is involved in fruiting body development and carotenoid production and the transcriptional linkage among three blue-light receptors in edible fungus Cordyceps militaris. Environ. Microbiol. 2020, 22, 466–482. [Google Scholar] [CrossRef]
- Wieser, J.; Yu, J.H.; Adams, T.H. Dominant mutations affecting both sporulation and sterigmatocystin biosynthesis in Aspergillus nidulans. Curr. Gent. 1997, 32, 218–224. [Google Scholar] [CrossRef] [PubMed]
- Krober, A.; Etzrodt, S.; Bach, M.; Monod, M.; Kniemeyer, O.; Staib, P.; Brakhage, A.A. The transcriptional regulators SteA and StuA contribute to keratin degradation and sexual reproduction of the dermatophyte Arthroderma benhamiae. Curr Genet. 2017, 63, 103–116. [Google Scholar] [CrossRef]
- Shantappa, S.; Dhingra, S.; Hernandez-Ortiz, P.; Espeso, E.A.; Calvo, A.M. Role of the zinc finger transcription factor SltA in morphogenesis and sterigmatocystin biosynthesis in the fungus Aspergillus nidulans. PLoS ONE 2013, 8, e68492. [Google Scholar] [CrossRef] [PubMed] [Green Version]
- Park, J.; Hulsman, M.; Arentshorst, M.; Breeman, M.; Alazi, E.; Lagendijk, E.L.; Rocha, M.C.; Malavazi, I.; Nitsche, B.M.; van den Hondel, C.A.; et al. Transcriptomic and molecular genetic analysis of the cell wall salvage response of Aspergillus niger to the absence of galactofuranose synthesis. Cell Microbiol. 2016, 18, 1268–1284. [Google Scholar] [CrossRef]
- Bencina, M.; Bagar, T.; Lah, L.; Krasevec, N. A comparative genomic analysis of calcium and proton signaling/homeostasis in Aspergillus species. Fungal Genet. Biol. 2009, 46 (Suppl. S1), S93–S104. [Google Scholar] [CrossRef] [PubMed]
- Porte, S.; Crosas, E.; Yakovtseva, E.; Biosca, J.A.; Farres, J.; Fernandez, M.R.; Pares, X. MDR quinone oxidoreductases: The human and yeast zeta-crystallins. Chem. Biol. Interact. 2009, 178, 288–294. [Google Scholar] [CrossRef]
- Sancar, A. Structure and Function of DNA Photolyase and Cryptochrome Blue-Light Photoreceptors. Chem. Rev. 2003, 103, 2203–2237. [Google Scholar] [CrossRef] [PubMed]
- Yang, T.; Guo, M.; Yang, H.; Guo, S.; Dong, C. The blue-light receptor CmWC-1 mediates fruit body development and secondary metabolism in Cordyceps militaris. Appl. Microbiol. Biotechnol. 2016, 100, 743–755. [Google Scholar] [CrossRef]
- Xu, X.; Chen, X.; Yu, W.; Liu, Y.; Zhang, W.; Lan, J. Cloning and analysis of the Glwc-1 and Glwc-2 genes encoding putative blue light photoreceptor from Ganoderma lucidum. J. Basic Microbiol. 2017, 57, 705–711. [Google Scholar] [CrossRef] [PubMed]
- Qi, Y.; Sun, X.; Ma, L.; Wen, Q.; Qiu, L.; Shen, J. Identification of two Pleurotus ostreatus blue light receptor genes (PoWC-1 and PoWC-2) and in vivo confirmation of complex PoWC-12 formation through yeast two hybrid system. Fungal Biol. 2020, 124, 8–14. [Google Scholar] [CrossRef]
- Cervantes-Badillo, M.G.; Munoz-Centeno, T.; Uresti-Rivera, E.E.; Arguello-Astorga, G.R.; Casas-Flores, S. The Trichoderma atroviride photolyase-encoding gene is transcriptionally regulated by non-canonical light response elements. FEBS J. 2013, 280, 3697–3708. [Google Scholar] [CrossRef] [PubMed]
- Linden, H.; Ballario, P.; Macino, G. Blue Light Regulation in Neurospora crassa. Fungal Genet. Biol. 1997, 22, 141–150. [Google Scholar] [CrossRef]
- Lauter, F.R.; Yamashiro, C.T.; Yanofsky, C. Charles Yanofsky Light stimulation of conidiation in Neurospora crassa- studies with the wild-type strain and mutants wc-1, wc-2 and acon-2. J. Photochem. Photobiol. B Biol. 1997, 37, 9. [Google Scholar] [CrossRef]
- Olmedo, M.; Ruger-Herreros, C.; Luque, E.M.; Corrochano, L.M. A complex photoreceptor system mediates the regulation by light of the conidiation genes con-10 and con-6 in Neurospora crassa. Fungal Genet. Biol. 2010, 47, 352–363. [Google Scholar] [CrossRef]
- Ambra, R.; Grimaldi, B.; Zamboni, S.; Filetici, P.; Macino, G.; Ballario, P. Photomorphogenesis in the hypogeous fungus Tuber borchii: Isolation and characterization of TbWC-1, the homologue of the blue-light photoreceptor of Neurospora crassa. Fungal Genet. Biol. 2004, 41, 688–697. [Google Scholar] [CrossRef] [PubMed]
- Du, F.; Zou, Y.; Hu, Q.; Zhang, H.; Ye, D. Comparative transcriptomic analysis reveals molecular processes involved in pileus morphogenesis in Pleurotus eryngii under different light conditions. Genomics 2020, 112, 1707–1715. [Google Scholar] [CrossRef]
- Patel, R.K.; Jain, M. NGS QC Toolkit: A toolkit for quality control of next generation sequencing data. PLoS ONE 2012, 7, e30619. [Google Scholar]
- Harris, M.A.; Clark, J.; Ireland, A.; Lomax, J.; Ashburner, M.; Foulger, R.; Eilbeck, K.; Lewis, S.; Marshall, B.; Mungall, C.; et al. The Gene Ontology (GO) database and informatics resource. Nucleic Acids Res. 2004, 32, D258–D261. [Google Scholar] [PubMed] [Green Version]
- Ogata, H.; Goto, S.; Sato, K.; Fujibuchi, W.; Bono, H.; Kanehisa, M. KEGG: Kyoto Encyclopedia of Genes and Genomes. Nucleic Acids Res. 1998, 27, 29–34. [Google Scholar]
Publisher’s Note: MDPI stays neutral with regard to jurisdictional claims in published maps and institutional affiliations. |
© 2021 by the authors. Licensee MDPI, Basel, Switzerland. This article is an open access article distributed under the terms and conditions of the Creative Commons Attribution (CC BY) license (https://creativecommons.org/licenses/by/4.0/).