Abstract
Nickel (Ni) is an essential trace element for plant growth and a component of the plant body that has many different functions in plants. Although it has been confirmed that nickel ions (Ni2+) havea certain regulatory effect on nitrogen (N) metabolism, there are not enough data to prove whether exogenous Ni2+ can increase the carbon (C) and N metabolism in the roots of tomato seedlingsunder low-nitrogen (LN) conditions. Therefore, through the present experiment, we revealed the key mechanism of Ni2+-mediated tomato root tolerance to LN levels. Tomato plants were cultured at two different N levels (7.66 and 0.383 mmol L−1) and two different Ni2+ levels (0 and 0.1 mg L−1 NiSO4 6H2O) under hydroponic conditions. After nine days, we collected roots for physiological, biochemical, and transcriptome sequencing analyses and found that the activities of N assimilation-related enzymes decreased at LN levels. In contrast, Ni2+ significantly increased the activities of N assimilation-related enzymes and increased the contents of nitrate (NO3−), ammonium (NH4+), and total amino acids. Through root transcriptomic analysis, 3738 differentially expressed genes (DEGs) were identified. DEGs related to C and N metabolism were downregulated after LN application. However, after Ni2+ treatment, PK, PDHB, GAPDH, NR, NiR, GS, GOGAT, and other DEGs related to C and N metabolism were significantly upregulated. In conclusion, our results suggest that Ni2+ can regulate the C and N metabolism pathways in tomato roots to alleviate the impact of LN levels.
1. Introduction
Nitrogen (N) is an essential mineral nutrient element in plants; it is an important component of proteins, nucleic acids, phospholipids, and certain growth hormones. It also accounts for 40–50% of the total final crop yield [1,2,3]. Therefore, the application of N fertilizer in agricultural production often increases crop yield. In actual production, vegetable farmers often overapply N fertilizer, far exceeding the needs of the crop, to increase economic efficiency [4,5]. However, instead of improving crop yield and quality, excessive N fertilizer inputs have reduced efficiency and increased N fertilizer losses, causing serious environmental problems [6].
Nickel (Ni) is considered an important plant micronutrient due to its different biological functions [7]. Plants grown in Ni-deficient nutrient solutions may show significant Ni deficiency symptoms such as the “mouse-ear or little-leaf” (ME–LL) found in pecan [8,9]. In addition, Ni is the only known urease activator that activates urease to then hydrolyze urea to ammonia and carbon dioxide [10], thereby avoiding the toxic effects of urea accumulation. Further, urea accumulation can lead to severe limitations in the supply of ammonia for the synthesis of certain amino acids and various types of proteins, which in turn appears to cause other disruptions in N metabolism (in particular, the disruption of glutamine synthase [11,12]), which is ultimately detrimental to plant growth. On the other hand, Ni is also a component of other enzymes responsible for nitrate reduction and is therefore involved in N assimilation in plants [13]. A study on cowpea found that Ni and urease were involved in N metabolism during the reproductive growth phase of legumes [14]. Other studies have shown that the application of nickel at low concentrations can increase the level of plant N metabolism and have a beneficial effect on plant growth and development [15,16,17]. Through a previous experiment, we showed that exogenous nickel ions (Ni2+) could regulate genes involved in the EMP pathway–TCA cycle, amino acid biosynthesis, and N metabolism in tomato leaves [18]. As a major site of N uptake, the physiological characteristics of the tomato roots system directly influence the growth and development of tomatoes. However, it is not clear how the root system responds to exogenous Ni2+ regulation under low-nitrogen (LN) conditions. Thus, physiological, biochemical, and transcriptomic analyses were used in this study to analyzethe changes to the carbon (C) and N metabolism in the roots of tomato seedlings following Ni2+ applications under LN conditions.
2. Results
2.1. Carbohydrate Content
The starch content at LN levels was significantly decreased by 54% compared with normal nitrogen (NN) levels, while fructose was significantly increased by 40%, glucose by 68%, and sucrose by 76% (Figure 1A–D). These results show that starch is decomposed in large quantities under LN levels and that the three soluble sugars—fructose, glucose, and sucrose—are synthesized in large quantities to resist adversity. The starch and fructose contents increased significantly by 46 and 13%, respectively, under LN conditions after Ni2+ addition.
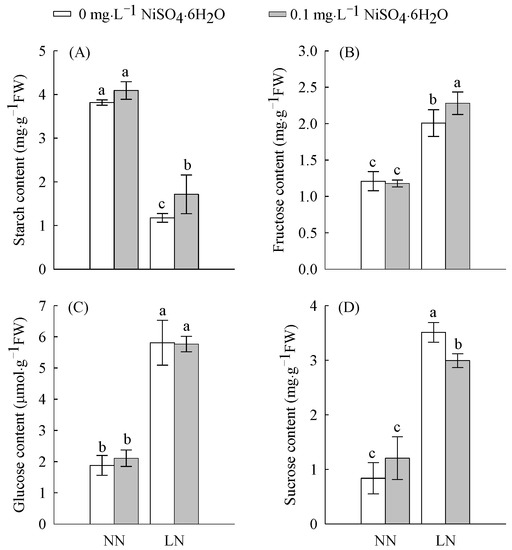
Figure 1.
The contents of starch (A), fructose (B), glucose (C), and sucrose (D) in tomato roots treated with LN and Ni2+. Data are presented as the mean ± SD of three independent biological replicates. Different lowercase letters in the same column indicate significant differences at the 0.05 level among treatments.
2.2. Enzymatic Activities and N Content
As shown in Figure 2 and Figure 3, Ni2+ treatment increased the enzymatic activities of nitrate reductase (NR), nitrite reductase (NiR), glutamine synthetase (GS), glutamate synthetase (GOGAT), glutamate dehydrogenase (GDH) and the contents of nitrate nitrogen (NO3−), ammonium nitrogen (NH4+), and the total amino acids. Under LN treatment, all enzymatic activities and contents of N compounds decreased in comparisonwith NN; however, LN significantly inhibited NR (47%), NiR (47%), GS (47%), GDH (41%), and GOGAT (60%) activities. This indicates that LN levels inhibit N assimilation, thereby inhibiting the formation of nitrogen-containing compounds. However, after Ni2+ treatment, the contents of NR, NiR, GS, GOGAT, GDH, NO3−, NH4+, and the total amino acids all increased under LN conditions. Under LN conditions, the addition of Ni2+ significantly increased the activities of NR, GDH, and GOGAT by 80, 45 and 72%, respectively. This indicates that Ni2+ can regulate N metabolism.
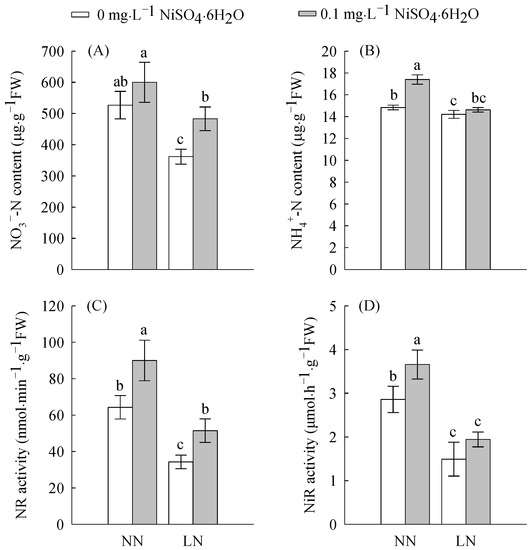
Figure 2.
The NO3− content (A), NH4+ content (B), NR (C), and NiR (D) in tomato roots treated with LN and Ni2+. Data are presented as the mean ± SD of three independent biological replicates. Different lowercase letters in the same column indicate significant differences at the 0.05 level among treatments.
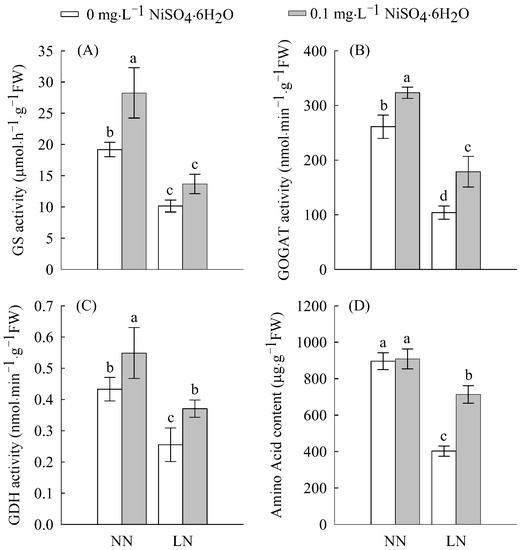
Figure 3.
The GS (A), GOGAT (B), GDH (C), and total amino acid content (D) in tomato roots treated with LN and Ni2+. Data are presented as the mean ± SD of three independent biological replicates. Different lowercase letters in the same column indicate significant differences at the 0.05 level among treatments.
2.3. Analysis of Differentially Expressed Genes (DEGs)
We found that each mRNA library contained a total of 40.68 to 54.42 million clean reads with a Q30 percentage ≥91% (Table 1). We obtained approximately 41.27 million, 50.11 million and 41.95 million clean reads from the NN group, LN group, and Ni2+ + LN group, respectively. We retained a large proportion (approximately 89.42, 89.47 and 90.45%) of clean reads (approximately 36.89 million, 44.91 million and 37.94 million for the NN group, LN group, and Ni2+ + LN group, respectively) for assembly and downstream analysis. In addition, we obtained approximately 36.08 million, 44.15 million, and 37.24 million reads from the NN group, LN group, and Ni2+ + LN group, respectively, which were aligned to the unique position of the reference genome. The percentage of reads aligned to the unique position of the reference genome in the clean reads was approximately 87.42, 87.96 and 88.78%, for the NN group, LN group, and Ni2+ + LN group, respectively. We identified 3738 DEGs using these treatments by analyzingthe full variation in DEGs across different databases. Overall, 2944 and 1837 genes were differentially expressed between the LN vs. NN groups and the Ni2+ + LN vs. LN groups, respectively. Among these DEGs, 1465 and 748 genes were upregulated, and 179 and 1089 were downregulated (Figure 4A–C and Table S1).

Table 1.
Read quality in the RNA-sequencing (RNA-seq) analysis.
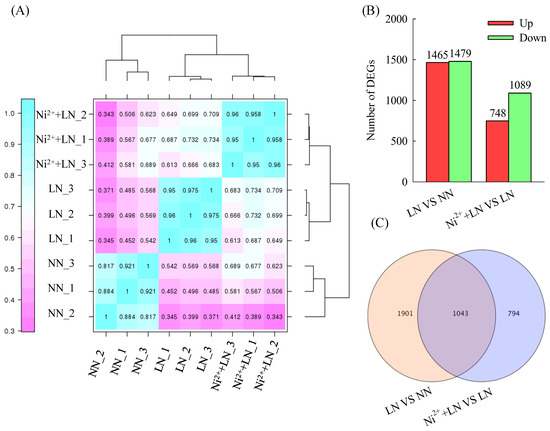
Figure 4.
Statistics of the transcriptome in the tomato roots. Pearson’s correlation analysis (A), number of DEGs (B), and Venndiagram (C).
2.4. Functional Classification of DEGs and Validation by Quantitative Real-Time PCR (RT-qPCR)
The Venn diagram showed the existence of 1043 co-DEGs between the two comparison groups (Figure 4C and Table S2), which can be regarded as the central DEGs for the exploration of the corresponding co-acting mechanism. These 1043 common DEGs were subjected to hierarchical clustering analysis, in which 706 or 346 genes were upregulated and 337 or 697 genes were downregulated in the LN vs. NN group and the Ni2+ + LN vs. LN group, respectively (Figure 5A and Table S2). We performed a KEGG classification analysis on these common DEGs, and the results showed the main and other metabolic pathways involved (Figure 5B and Table S3). We used primers related to C metabolism (Solyc08g079080.4, Solyc11g007690.2) and N metabolism (Solyc03g083440.3, Solyc04g014510.3, Solyc09g010970.3, Solyc10g050890.2, and Solyc11g013810.2). We verified the authenticity of the RNA-seq data and the relative expression levels of the eight DEGs of interest by RT-qPCR. We found that the RT-qPCR results were consistent with the RNA-seq expression profile (Table 2), thus demonstrating the authenticity of the RNA-seq data.
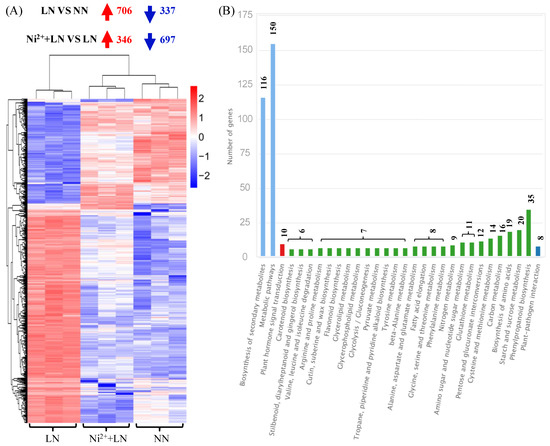
Figure 5.
Statistics for 1043 DEGs in the intersection of two comparative groups. Hierarchical clustering (A) and KEGG classification (B).
Table 2.
DEGs in the roots of tomato plants in response to Ni2+ and LN levels.
2.5. Metabolic Regulation of Enzymes Encoded by DEGs
The common DEGs were significantly enriched in C and N metabolic pathways. LN application inhibited the expression levels of pyruvate kinase (PK), pyruvate dehydrogenase E1 component beta subunit (PDHB), glyceraldehyde-3-phosphate dehydrogenase (GAPDH), nitrate reductase (NR), ferredoxin-nitrite reductase (NiR), glutamine synthetase (GS), and glutamate synthase (GOGAT) (Figure 6 and Table S1). However, in the Ni2+ treatment (Ni2+ + LN), the expression levels of these genes were all increased, and NR and NiR were significantly increased by 4.3 and 3.6 fold, respectively. The results for NR, NiR, GS, and GOGAT in the N assimilation pathway were essentiallyconsistent with the physiological detection results of the enzymes.
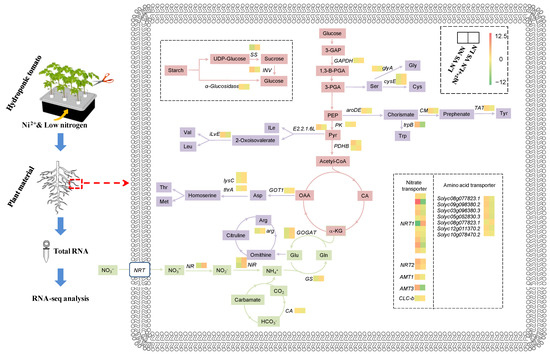
Figure 6.
A simplified transcriptional map based on associated transcriptional pathways in tomato roots in response to Ni2+ and LN levels. Each square represents DEGs, and the color indicates the log2(fold change) of the DEGs (|log2(fold change)| ≥ 1 and p-adjusted value < 0.01; red indicates upregulation, and green indicates downregulation).
3. Discussion
As an extremely common limiting factor for plant growth and development, N plays a vital role in various metabolic processes. Efficient N supply and utilization result in extensive physiological and biochemical changes in plants [19], which, in turn, reduce plant growth. Correspondingly, plants can respond to changes in N availability through changes in morphological, physiological, and biochemical pathways [20,21]. Under LN levels, the activities of key N-assimilation enzymes such as NR/NiR and GOGAT/GS (Figure 2 and Figure 3) and their related genes (Solyc04g014510.3, Solyc03g083440.3, Solyc08g044270.3, Solyc11g013810.2, Solyc01g108630.3, and Solyc10g050890.2) were significantly reduced; they alsodisrupted the transcript levels of amino acid biosynthesis-related genes (Figure 6 and Table S2), thereby reducing the accumulation of free amino acids (Figure 3), and therefore indicating that N assimilation is affected by inhibition. Similarly, a dramatic downregulation of N assimilation-related DEGs were found in apples and rice [22,23] during N starvation. The downregulation of these DEGs may be a feedback response to N starvation; however, further studies are needed to evaluate this hypothesis. Exogenous Ni2+ increased the concentration of NO3− in roots under LN conditions, thereby promoting the activities of NR and NiR, and their related gene expression levels (Figure 3 and Table S2), which in turn promoted the reduction of NO3−. GS/GOGAT is crucial for regulating the N cycle and NH4+ assimilation in response to adverse environments [24]. Exogenous Ni2+ induces GS/GOGAT activity under LN levels and mediates the transcription level of its related coding genes, which may help promote NH4+ reassimilation under low-N conditions to improve plant tolerance to N deficiency [25]. As an important form and the main transport form of N assimilation in plants, free amino acids can reflect the supply capacity of N assimilates [26]. The supply of Ni2+, under LN conditions, readjusted the transcription levels of genes encoding amino acid synthesis-related enzymes in tomato roots (Figure 6 and Table S2) in order to maintain the normal generation of amino acids and ensure an adequate supply of N assimilates. At the same time, various amino acids must be transported to specific sites by intracellular amino acid transporters to perform their respective functions [27]. In this study, LN supply upregulated amino acid transporter genes, including vacuolar amino acid transporter 1 (Solyc08g077823.1 and Solyc09g098380.2); proline transporter 2 (Solyc03g096380.3 and Solyc05g052830.3); cationic amino acid transporter 8 (Solyc12g011370. 2); the transcription of the uncharacterized protein LOC101268525 (Solyc10g078470.2), and downregulated the transcription of cationic amino acid transporter 6 (Solyc08g077823.1) (Figure 6 and Table S2). This seems to be an adaptive response of tomato seedlings to LN levels, whereas Ni2+ stimulation restored the normal expression levels of the above amino acid transporter genes, suggesting that Ni2+ played a unique role in improving N utilization. On the other hand, N assimilation is a dynamic and complex process involving multiple genes [28]; in addition to NO3− reduction, NH4+ assimilation, amino acid biosynthesis, and amino acid transport; it also includes NO3− and NH4+ absorption and transportation. Studies have shown that a total of four protein families are involved in nitrate transport [29], of which the high-affinity nitrate transporter (NRT2) plays an important role in NO3− uptake and N utilization. Normally, in the presence of a low N supply, NRT2 is activated to improve N uptake [30]. However, some reports suggest that both NRT2 and low-affinity nitrate transporters (PTR family/NRT1) contribute to meeting the plant’s nitrate demand [31,32]. In our study, NRT1, NRT2, and the chloride channel (CLC) protein family CLC-b responded positively to changes in N levels (Figure 6 and Table S2). Among them, NRT2 (Solyc00g090860.2 and Solyc11g069750.2) showed an obvious response to both low N and Ni2+ supply. Previous studies have shown that overexpression of OsNRT2.3b improves the uptake of nitrate in rice under low- and high-N supply conditions, thereby increasing yield [31]. Therefore, these candidate genes (Solyc00g090860.2 and Solyc11g069750.2) may be the focus of future research to improve the uptake, transport, and utilization efficiency of NO3− in the tomato seedling root system. Interestingly, under low-N conditions, the ammonium transporter AMT1 (Solyc09g090730.2) and AMT3 (Solyc09g065740.2) genes were upregulated in roots (Figure 6 and Table S2). Further, the AMT1 protein plays a key role in NH4+ uptake [33], suggesting that plants may employ alternative strategies (such as increased NH4+ uptake) to meet N requirements.
On the other hand, N availability affects C assimilation [34], and N assimilation depends on the C source and reducesthe power provided by C assimilation. This interaction has important implications for plant life activities. Generally, changes in environmental conditions lead to the disruption of metabolic balance in plants, as plants rely on the regulation of energy and material metabolism (e.g., C tuning and N assimilation) to adapt to stress [35]. In plants, sucrose (as the main nonstructural carbohydrate) can be hydrolyzedinto glucose and fructose, which in turn enter the EMP–TCA pathway to obtain a large amount of capacity and reduce the power required for the life activities of organisms. Under LN conditions, the contents of sucrose, glucose, and fructose in tomato roots were increased (Figure 1) and accompanied by an increase in the starch metabolism-related gene α-Glucosidase (Solyc02g069670.3) and the sucrose metabolism-related gene INV (Solyc08g079080.4). While the expression of those genes was upregulated, the expression of SS (Solyc12g009300.3) was downregulated (Figure 6 and Table S2). This means that the plant body is osmotically adjusted to maintain the osmotic pressure difference between the inside and outside of the cells. Furthermore, an LN supply inhibits energy metabolism, including the EMP–TCA pathway, in plants [36]. Our results also indicated that LN indeed suppressed the expression of the EMP-related genes GAPDH (Solyc06g071920.3), PK (Solyc11g007690.2), and PDHB (Solyc06g072580.3) (Figure 6 and Table S2). After Ni2+ application, the expression levels of related genes were restored, which may increase the availability of the C backbone for amino acid biosynthesis and other physiological and biochemical pathways and thus further promote the progression of related metabolic processes.
In summary, the application of Ni2+ as a regulatory strategy further leads to changes in metabolites and related metabolic pathways by altering the transcriptional levels and enzymatic activities of genes related to the C and N assimilation pathways (such as NRT2, NR/NiR, and GS/GOGAT). The results confirmed the effect of Ni2+ on C and N assimilation in tomato roots.
4. Materials and Methods
4.1. Plant Materials and Treatments
The experiment was carried out in the plant culture room of Fujian Agriculture and Forestry University. We used tomato (Solanum lycopersicum L. ‘Micro Tom’) seedlings grown in cavity trays withup to 5 leaves and 1 heart and then planted into hydroponic tanks and grown for 3 d. The experimental design is shown in Table 3 (for Ni2+ treatment, NiSO4 6H2O was added to the hydroponic solution), and the specific nutrient solution configuration is shown in the Appendix A. The experiment was carried out at the end of 0 d, and the nutrient solution was changed every 3 d for a total of 3 times. The experiment was carried out with a completely randomized group design, consisting of four treatments.
Table 3.
Design of experiment.
4.2. Determination of Enzyme Activity in the C and N Metabolism
We used kits (from Comin, Suzhou, China) to determine the sucrose, glucose, fructose, starch, total amino acid, NO3− and NH4+ contents; NR, NiR, GS, GOGAT, and GDH activities.
4.3. RNA-Seq and RT-qPCR Analysis
The transcriptomic data used in this experiment were provided by Beijing BioMarker and are detailed in the Appendix A. We screened for transcripts that met the criteria for |log2(fold change)| ≥ 1 and a p-adjusted value < 0.01 in regard to DEGs. For RT-qPCR analysis, total RNA was extracted from 0.3 g of root samples using the FastPure Plant Total RNA Isolation Kit (Polysaccharides & Polyphenolics-rich) (Vazyme, Nanjing, China). The kit used for reverse transcribing RNA and generating cDNA was FastKing RT SuperMix (Tiangen, Beijing, China), and the 2−ΔΔCT method was used to calculate the relative expression levels of the genes. Please refer to Table 4 for the relevant gene sequence.
Table 4.
Primers used for RT-qPCR analysis.
4.4. Statistical Analysis
We used DPS software 17.10 (Zhejiang University, Hangzhou, China) for statistical analysis. Additionally, Duncan’s multiple range test (p < 0.05) was used to analyzethe significant differences between experimental treatments.
Supplementary Materials
The following supporting information can be downloaded at: https://www.mdpi.com/article/10.3390/ijms231911398/s1.
Author Contributions
K.Z. performed the main experimentsand data analysis; K.Z. and S.L. wrote the paper; Y.X., Y.Z., S.R., H.Z., W.H. and R.X. performed some of the experiments. F.Z. designed the experiment and paper revision. All authors have read and agreed to the published version of the manuscript.
Funding
This work was supported by the Fujian Modern Agricultural Vegetable Industry System Construction Project (2019-897), Project of Science and Technology of Fujian Province (2021S0037), Cross Fusion Project “Smart Agriculture” of Fujian Agriculture and Forestry University (71202103B), and the Rural Revitalization Vegetable Industry Service Project of Fujian Agriculture and Forestry University (11899170118).
Institutional Review Board Statement
Not applicable.
Informed Consent Statement
Not applicable.
Data Availability Statement
Not applicable.
Conflicts of Interest
The authors declare no conflict of interest.
Appendix A
Appendix A.1. N Nutrient Solution Formula
Table A1.
N nutrient solution formula with different concentrations.
Table A1.
N nutrient solution formula with different concentrations.
| N Concentration (mmol L−1) | Reagent (mmol L−1) | ||||||
|---|---|---|---|---|---|---|---|
| Ca(NO3)2 4H2O | CaCl2 | KNO3 | NH4H2PO4 | KH2PO4 | KCl | MgSO4 7H2O | |
| 0.383 | 0.075 | 1.425 | 0.200 | 0.033 | 0.635 | 3.168 | 0.998 |
| 7.67 | 1.499 | 3.996 | 0.669 | 0.998 | |||
Appendix A.2. RNA Extraction and RNA-Seq Analysis
We extracted the total RNA from 0.2 g roots samples using an RNAprep Pure Plant Kit (TIANGEN, Beijing, China). We then constructed and sequenced the mRNA libraries using an Illumina platform. After processing for quality control and data filtering, we mapped the clean reads to the reference genome(s) using TopHat2 (v2.2.13). We expressed the transcript level quantification as fragments per kilobase per million reads mapped. We performed a differ-ential expression analysis of the two groups using the DESeq R package (v1.10.1). We categorized the transcripts that satisfied the criteria |log2(fold change)| ≥ 1 and p-adjusted value < 0.01 as DEGs. We assigned the DEGs to obtain the GO annotations (i.e., functional classes of DEGs, including biological process, cellular component, and molecular function) to explore their involvement in biological pathways, and used KOBAS software to test the statistical enrichment of differentially expressed genes in KEGG pathways.
References
- Karki, S.; Poudel, N.S.; Bhusal, G.; Simkhada, S.; Regmi, B.R.; Adhikari, B.; Poudel, S. Growth parameter and yield attributes of rice (Oryza sativa) as influenced by different combination of nitrogen sources. World J. Agric. Res. 2018, 6, 58–64. [Google Scholar]
- Liang, Y.; Zhao, X.; Jones, A.M.; Gao, Y. G proteins sculp root architecture in response to nitrogen in rice and arabidopsis. Plant Sci. 2018, 274, 129–136. [Google Scholar] [CrossRef]
- Stein, L.Y.; Klotz, M.G. The nitrogen cycle. Curr. Biol. 2016, 26, 94–98. [Google Scholar] [CrossRef]
- Yang, X.L.; Lu, Y.L.; Ding, Y.; Yin, X.F.; Raza, S.; Tong, Y.A. Optimising nitrogen fertilisation: A key to improving nitrogen-use efficiency and minimising nitrate leaching losses in an intensive wheat/maize rotation (2008–2014). Field Crops Res. 2017, 206, 1–10. [Google Scholar] [CrossRef]
- Saleque, M.A.; Naher, U.A.; Islam, A.; Pathan, A.B.M.B.U.; Hossain, A.T.M.S.; Meisner, C.A. Inorganic and organic phosphorus fertilizer effects on the phosphorus fractionation in wetland rice soils. Soil Sci. Soc. Am. J. 2004, 68, 1635–1644. [Google Scholar] [CrossRef]
- Jensen, L.S.; Schjoerring, J.K.; Van der Hoek, K.W.; Poulsen, H.D.; Zevenbergen, J.F.; Pallière, C.; Lammel, J.; Brentrup, F.; Jongbloed, A.W.; Willems, J.; et al. Benefits of Nitrogen for Food, Fibre and Industrial Production; Cambridge University Press: Cambridge, UK, 2011; pp. 32–61. [Google Scholar]
- Rahman, H.; Sabreen, S.; Alam, S.; Kawai, S. Effects of nickel on growth and composition of metal micronutrients in barley plants grown in nutrient solution. J. Plant Nutr. 2005, 28, 393–404. [Google Scholar] [CrossRef]
- Wood, B.W.; Reilly, C.C.; Nyczepir, A.P. Mouse-ear of pecan: I. Symptomatology and occurrence. HortScience 2004, 39, 87–94. [Google Scholar] [CrossRef]
- Wood, B.W.; Reilly, C.C.; Nyczepir, A.P. Mouse-ear of pecan: II. Influence of nutrient applications. HortScience 2004, 39, 95–100. [Google Scholar] [CrossRef]
- Sirko, A.; Brodzik, R. Plant ureases: Roles and regulation. Acta Biochim. Pol. 2000, 47, 1189–1195. [Google Scholar] [CrossRef]
- Gerendas, J.; Sattelmacher, B. Significance of Ni supply for growth, urease activity and concentrations of urea, amino acids and mineral nutrients of urea-grown plants. Plant Soil 1997, 190, 153–162. [Google Scholar] [CrossRef]
- Gerendas, J.; Zhu, Z.; Sattelmacher, B. Influence of Ni and Ni supply on nitrogen metabolism and urease activity in rice (Oryzasativa L.). J. Exp. Bot. 1998, 49, 1545–1554. [Google Scholar] [CrossRef]
- Brown, P.H.; Welch, R.M.; Madison, J.T. Effect of nickel deficiency on soluble anion, amino acid, and nitrogen levels in barley. Plant Soil 1990, 125, 19–27. [Google Scholar] [CrossRef]
- Walker, C.D.; Graham, R.D.; Madison, J.T.; Cary, E.E.; Welch, R.M. Effects of ni deficiency on some nitrogen metabolites in cowpeas (Vigna unguiculata L. Walp). Plant Physiol. 1985, 79, 474–479. [Google Scholar] [CrossRef] [PubMed]
- Khoshgoftarmanesh, A.H.; Hosseini, F.; Afyuni, M. Nickel supplementation effect on the growth, urease activity and urea and nitrate concentrations in lettuce supplied with different nitrogen sources. Sci. Hortic. 2011, 130, 381–385. [Google Scholar] [CrossRef]
- Tan, X.W.; Ikeda, H.; Oda, M. Effects of nickel concentration in the nutrient solution on the nitrogen assimilation and growth of tomato seedlings in hydroponic culture supplied with urea or nitrate as the sole nitrogen source. Sci. Hortic. 2000, 84, 265–273. [Google Scholar] [CrossRef]
- Liu, M.Y.; Yan, Y.N.; Shang, C.Y.; Chen, L.; Li, J.M.; Zhong, F.L.; Lin, Y.Z. Effect of nickel ion on growth, physiology and nitrogen absorption in Lactuca sativa L. seedling. Acta Bot. Boreal.-Occident. Sin. 2018, 38, 2060–2071. [Google Scholar]
- Li, S.H.; Yang, D.Q.; Tian, J.; Wang, S.B.; Yan, Y.N.; He, X.L.; Du, Z.J.; Zhong, F.L. Physiological and transcriptional response of carbohydrate and nitrogen metabolism in tomato plant leaves to nickel ion and nitrogen levels. Sci. Hortic. 2022, 292, 110620. [Google Scholar] [CrossRef]
- Zhang, S.C.; Li, M.J.; Guo, J.K.; Shi, Z.L.; Fu, X.Y.; Di, R.Y.; Li, Y.M. Comparative transcriptome analysis of triticumaestivumin response to nitrogen stress. Russ. J. Plant Physl. 2016, 63, 365–374. [Google Scholar] [CrossRef]
- Stitt, M.; Müller, C.; Matt, P.; Gibon, Y.; Carillo, P.; Morcuende, R.; Scheible, W.; Krapp, A. Steps towards an integrated view of nitrogen metabolism. J. Exp. Bot. 2002, 53, 959–970. [Google Scholar] [CrossRef] [PubMed]
- Vidal, E.A.; Gutiérrez, R.A. A systems view of nitrogen nutrient and metabolite responses in arabidopsis. Curr. Opin. Plant Biol. 2008, 11, 521–529. [Google Scholar] [CrossRef]
- Sun, T.T.; Zhang, J.K.; Zhang, Q.; Li, X.L.; Li, M.J.; Yang, Y.Z.; Zhou, J.; Wei, Q.P.; Zhou, B.B. Integrative physiological, transcriptome, and metabolome analysis revealsthe effects of nitrogen sufficiency and deficiency conditions in apple leavesand roots. Environ. Exp. Bot. 2021, 192, 104633. [Google Scholar] [CrossRef]
- Xin, W.; Zhang, L.N.; Zhang, W.Z.; Gao, J.P.; Yi, J.; Zhen, X.X.; Du, M.; Zhao, Y.Z.; Chen, L.Q. An Integrated Analysis of the rice transcriptome and metabolome reveals root growth regulation mechanisms in response to nitrogen availability. Int. J. Mol. Sci. 2019, 20, 5893. [Google Scholar] [CrossRef] [PubMed]
- Bernard, S.M.; Habash, D.Z. The importance of cytosolic glutamine synthetase in nitrogen assimilation and recycling. New Phytol. 2009, 182, 608–620. [Google Scholar] [CrossRef] [PubMed]
- Camargo, E.L.O.; Nascimento, L.C.; Soler, M.; Salazar, M.M.; Lepikson-Neto, J.; Marques, W.L.; Alves, A.; Teixeira, P.J.P.L.; Carazzolle, M.F.; Martinez, Y.; et al. Contrasting nitrogen fertilization treatments impact xylem gene expression and secondary cell wall lignification in eucalyptus. BMC Plant Biol. 2014, 14, 256. [Google Scholar] [CrossRef] [PubMed]
- Chen, W.; Meng, C.; Ji, J.; Li, M.H.; Zhang, X.M.; Wu, Y.Y.; Xie, T.T.; Du, C.J.; Sun, J.C.; Jiang, Z.P.; et al. Exogenous GABA promotes adaptation and growth by altering the carbon and nitrogen metabolic flux in poplar seedlings under low nitrogen conditions. Tree Physiol. 2020, 40, 1744–1761. [Google Scholar] [CrossRef]
- Cheng, L.; Yuan, H.Y.; Ren, R.; Zhao, S.Q.; Han, Y.P.; Zhou, Q.Y.; Ke, D.X.; Wang, Y.X.; Wang, L. Genome-wide identification, classification, and expression analysis of amino acid transporter gene family in glycine max. Front. Plant Sci. 2016, 7, 515. [Google Scholar] [CrossRef]
- Masdaux-Daubresse, C.; Daniel-Vedele, F.; Dechorgnat, J.; Chardon, F.; Gaufichon, L.; Suzuki, A. Nitrogen uptake, assimilation and remobilization in plants: Challenges for sustainable and productive agriculture. Ann. Bot. 2010, 105, 1141–1157. [Google Scholar] [CrossRef]
- Nawaz, M.A.; Chen, C.; Shireen, F.; Zheng, Z.H.; Sohail, H.; Afzal, M.; Ali, M.A.; Bie, Z.L.; Huang, Y. Genome-wide expression profiling of leaves and roots of watermelon in response to low nitrogen. BMC Genom. 2018, 19, 456. [Google Scholar] [CrossRef]
- Plett, D.C.; Holthama, L.R.; Okamotoa, M.; Garnett, T.P. Nitrate uptake and its regulation in relation to improving nitrogen use efficiency in cereals. Semin. Cell Dev. Biol. 2017, 74, 97–104. [Google Scholar] [CrossRef]
- Fan, X.R.; Tang, Z.; Tan, Y.W.; Zhang, Y.; Luo, B.B.; Yang, M.; Lian, X.M.; Shen, Q.R.; Miller, A.J.; Xu, G.H. Overexpression of a pH-sensitive nitrate transporter in rice increases crop yields. Proc. Natl. Acad. Sci. USA 2016, 113, 7118–7123. [Google Scholar] [CrossRef]
- Malagoli, P.Q.; Laine, P.; Deunff, E.L.; Rossato, L.; Ney, B.; Ourry, A. Modeling nitrogen uptake in oilseed rape cv capitol during a growth cycle using influx kinetics of root nitrate transport systems and field experimental data. Plant Physiol. 2004, 134, 388–400. [Google Scholar] [CrossRef] [PubMed]
- Gu, R.; Duan, F.; An, X.; Zhang, F.; Von Wirén, N.; Yuan, L. Characterization of AMT-mediated high-affinity ammonium uptake in roots of maize (Zea mays L.). Plant Cell Physiol. 2013, 54, 1515–1524. [Google Scholar] [CrossRef] [PubMed]
- Reich, P.B.; Hobbie, S.E.; Lee, T.; Ellsworth, D.S.; West, J.B.; Tilman, D.; Knops, J.M.H.; Naeem, S.; Trost, J. Nitrogen limitation constrains sustainability of ecosystem response to CO2. Nature 2006, 440, 922–925. [Google Scholar] [CrossRef] [PubMed]
- Li, M.X.; Xu, J.Y.; Wang, X.X.; Fu, H.; Zhao, M.L.; Wang, H.; Shi, L.X. Photosynthetic characteristics and metabolic analyses of two soybean genotypes revealed adaptive strategies to low-nitrogen stress. J. Plant Physiol. 2018, 229, 132–141. [Google Scholar] [CrossRef] [PubMed]
- Quan, X.Y.; Qian, Q.F.; Ye, Z.L.; Zeng, J.B.; Han, Z.G.; Zhang, G.P. Metabolic analysis of two contrasting wild barley genotypes grown hydroponically reveals adaptive strategies in response to low nitrogen stress. J. Plant Physiol. 2016, 206, 59–67. [Google Scholar] [CrossRef]


Publisher’s Note: MDPI stays neutral with regard to jurisdictional claims in published maps and institutional affiliations. |
© 2022 by the authors. Licensee MDPI, Basel, Switzerland. This article is an open access article distributed under the terms and conditions of the Creative Commons Attribution (CC BY) license (https://creativecommons.org/licenses/by/4.0/).