1. Introduction
Gynecological cancer (ovarian, endometrial and cervical) consists of a large number of tumors with variable presentation and often unpredictable malignant potential, making patient management demanding and challenging. In addition, the necessity to preserve the patient’s sexuality and fertility potential and the requirement to offer optimum treatment to combat malignancies complicate management decisions even further. Surgery plays a significant role in the management of most gynecological benign and malignant tumors. Optimized first surgery may provide a survival advantage in this context. However, even the most experienced surgeon is totally reliant on intraoperative examination and histopathological evaluation for distinguishing between malignant and benign disease [
1].
Repeated efforts in identifying high-risk gynecological cancer patients using imaging techniques (US, CT, MRI) and serum cancer markers did not improve the detection rate of early diagnosis in gynecological cancer. The naked eye can analyze color frequencies and detect shape and size differences of 100 microns in diameter. Minimally invasive surgery can facilitate and increase human sight limits up to 34 times that of the naked eye [
2]. Hence, minimally invasive gynecological surgery is currently the gold standard procedure for the diagnosis and treatment of pelvic pathologies.
Hysteroscopy is replacing the traditional cervical dilatation and curettage for the diagnosis of endometrial cavity diseases, and laparoscopy has become the preferred surgical technique for treating benign and malignant gynecological conditions. Recent technological advances in telescope technology and small-size video cameras offering higher quality and higher resolution video acquisition helped to delineate new applications in the diagnosis and treatment of female reproductive organ pathology [
3,
4]. During minimally invasive surgery, the tissues are magnified and many pathological conditions can be seen that are very difficult to be identified by the naked eye. In this context, it is possible to diagnose cancer at an early stage; when linked with early initial treatment, this can save lives and limit the health complications and the suffering of patients, as well as minimize the surgery expenses.
Computer-assisted tissue characterization refers to the quantitative characterization of image features that lead to a highly probable distinction between normal and abnormal tissue. The appearance and structure of laparoscopy imaging make the use of texture analysis techniques suitable for computer-assisted tissue characterization purposes. The objective of this study was to characterize quantitatively the texture of gynecological tissue during endoscopy. This approach may lead to a highly probable distinction between normal and abnormal tissue in support of the doctor’s intraoperative diagnosis. A similar approach was also followed for colon endoscopic tissue characterization [
5,
6] for cancer from colonoscopic images.
In this article, we present our experience using CATIA for an optical biopsy in gynecological cases. An effort has been made to identify quantitative differences between normal and abnormal tissue using computer-aided diagnosis (CAD) as well as distinct tissue image characterization differences between benign and malignant tissue during minimally invasive gynecological surgery.
3. Discussion
In practice, expert histopathologists with experience in each human body system cannot be found next to each surgeon. As a result, in most cases, therapy is based on postoperative histopathological diagnosis including second opinions, such as consultations from experts at remote sites. Ideally, however, patient benefit should be optimized at first surgery through timely and accurate histopathological diagnosis. Telepathology, CATIA and machine learning, including neural network classification, together can probably offer online dynamic intraoperative and postoperative consultations between a panel of experts via the transmission of video (laparoscopic and hysteroscopic scenes), still images (histopathologic specimen images) and clinical data. In this context, a digital library can be used by medical experts to interactively examine past similar case studies for preparatory research, follow-up research, archiving, training and standardization.
The main objective of this paper was to demonstrate the benefits of computer-assisted tissue image analysis to diagnose and distinguish normal from abnormal endometrium based on texture feature analysis and machine learning and neural network classification. The camera systems, monitors, operative techniques and skills developed with minimally invasive surgery provide tissue images and magnification with exceptional clarity. The abdomen and individual organs such as the endometrial cavity can be examined in situ with ease, without disturbing the anatomic features or the pathologic condition before treatment. Video images can be used intra- and postoperatively to re-evaluate the pathologic condition and provide the surgeon with excellent quality real-time video for assessing cavities and areas of the human body impossible to observe with the naked eye. The easy access to tissue images facilitates, encourages and accelerates the application of quantitative analysis using different algorithms, which are correlated with the histopathological findings [
1,
8].
Tissue visual signs, image texture analysis and features selected by machine learning and artificial neural network systems can serve as biomarkers for distinguishing abnormal from normal tissue. Precancerous as well as cancerous conditions are characterized as images with a complex set of attributes. Color, texture and relative geometry are predominately useful, while region shape is significantly less so. Regions are frequently amorphous or, for a few region classes, exhibit a shape that may be only approximately modeled, and even in these cases, the model may be image-dependent. The overall region of interest in the images may in general correlate with the histopathologic cancerous characteristics, such as abnormal tissue architecture, neo-angiogenesis, edema and cellular dysfunction. Images from a histopathologic section produced by microscopy may be interpreted by visual signs and tissue image features by computer-assisted diagnosis [
9]. Such translation from microscopy tissue section characteristics to tissue image textures demands an allocation of data and computer system training [
10]. CAD may have the potential to diagnose early disease, including cancer [
1].
The loading of data with digital features of normal and abnormal tissue, with both visual and histopathologic characteristics, is essential in building the primary level of a CAD system. The functionality and efficiency of CAD depend on network capacity, speed of data processing and technological support [
1]. Classical texture descriptors appear effective for texture characterization. Future work will include introducing different classification schemes [
3]; augmenting the database, which is important in generalizing the results, especially when higher order statistics’ modeling is involved; and exploring the temporal dynamics of texture information, since taking information from neighbor frames may improve classification performance [
11].
Experiments during hysteroscopy demonstrated that when three different texture feature algorithms, SF, SGDLM and GLDS, were used, CATIA results were reliable when the distance from the telescope tip to the tissue target was no more than 3 cm and the viewing angle was kept within 15 degrees deviation [
7]. Selecting the best algorithm or combination of algorithms for the diagnosis of malignant tissue and new cases was a major challenge in almost all studies. CATIA technology needs to be adapted to clinical use, with real-time image analysis supported by a physician-friendly interface. The use of this technology for the diagnosis of malignancy is expected to diminish false negative results, a fact that is usually accompanied by an increase in false positives and a reduction in specificity.
In the studies we performed, the major advantage of CATIA was in comparing an abnormal tissue region to adjacent normal healthy tissue. Image comparisons can be performed during the intra- and postoperative periods to re-evaluate the pathologic features and operative technique. Easy access to tissue images facilitates, encourages and accelerates the application of quantitative image/video in hysteroscopy analysis by using different algorithms correlated with histopathologic findings [
1,
8].
4. Materials and Methods
The methodology components used to accomplish the computer-assisted tissue image analysis during minimally invasive gynecological surgery (MIGS) are presented below.
Figure 1 presents a screenshot of a CAD system allowing the physician to crop normal and abnormal ROIs in the course of a hysteroscopy examination procedure. In addition, the corresponding ROI texture features are tabulated on the right side.
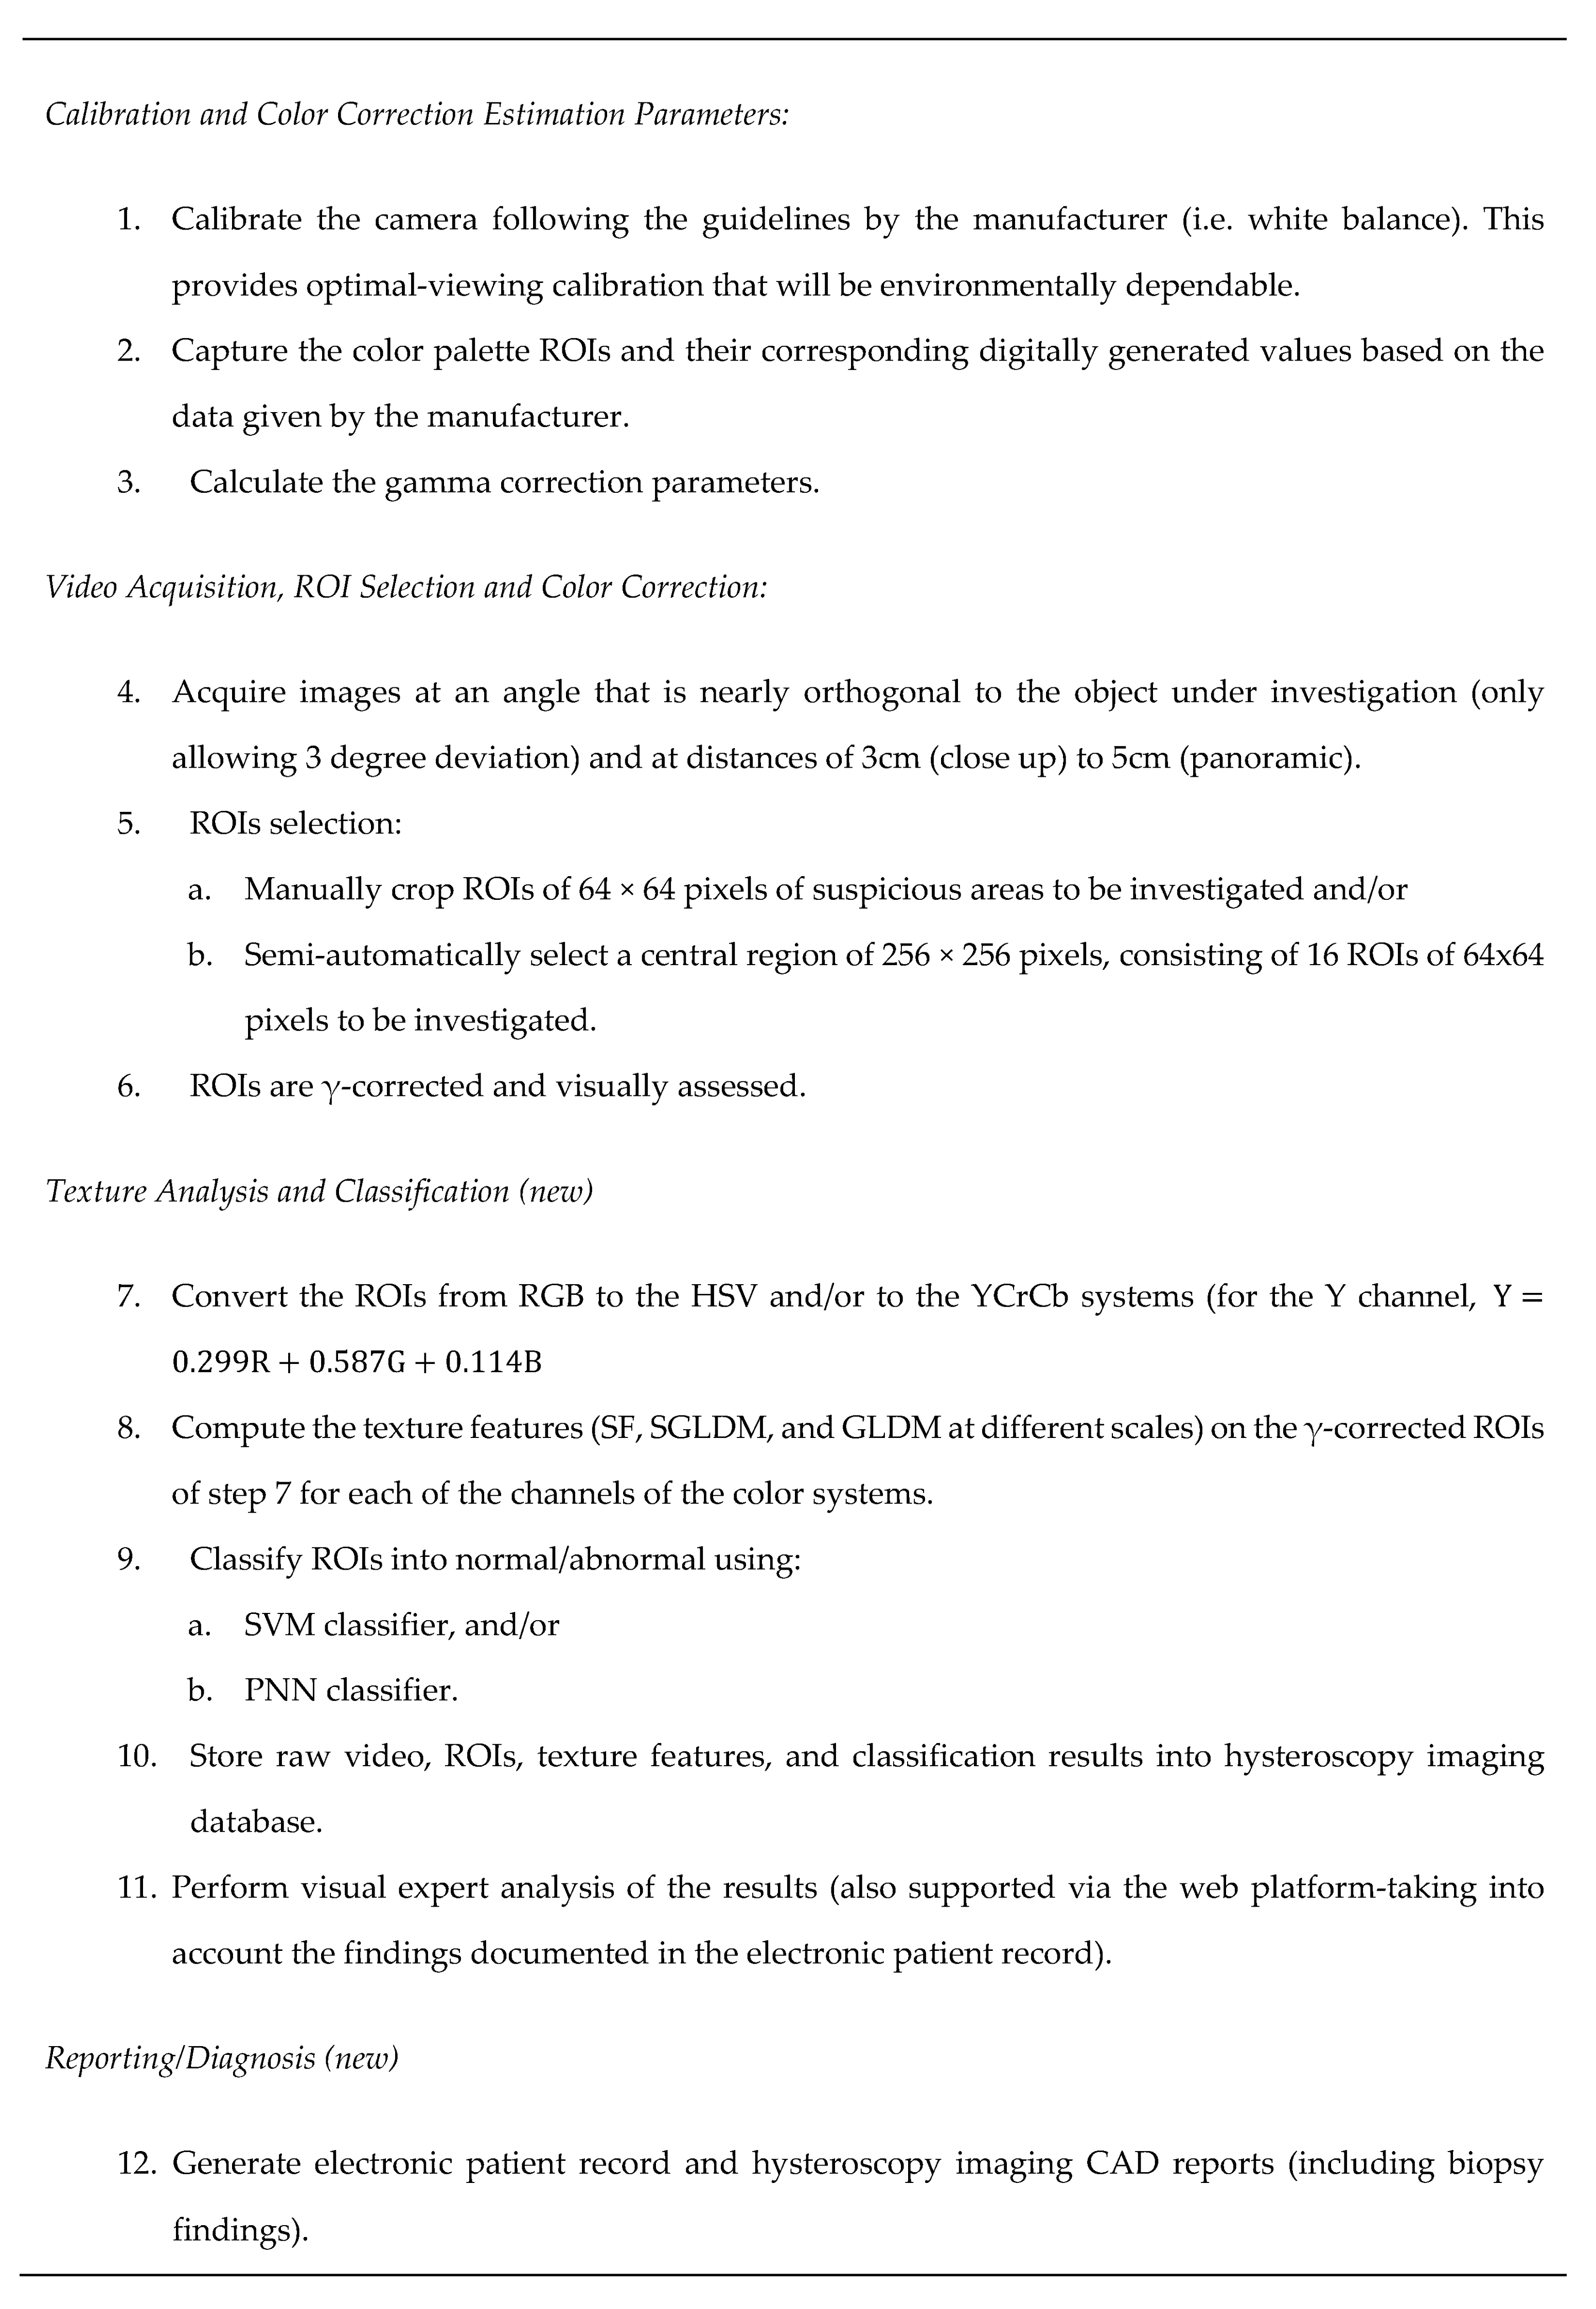
4.1. Standardized Protocol
The capturing protocol is demonstrated below in
Figure 2, based on [
8], supporting the minimum importing error for the images [
12].
4.2. Recording of Endoscopic Video
For image acquisition, the medical telescopes provided by Wolf and STORZ have been used [
2]. The telescope specifications were 2.8 mm diameter and 30° viewing angle for hysteroscopy and 10 mm diameter and 0° viewing angle for laparoscopy. Endoscopy video was captured using the Circon IP4.1 RGB video camera. All videos were captured at clinically optimum illumination and focusing. The camera was white-balanced using a white surface (white color of the palette [
13]) as suggested by the manufacturer. The light source was a 300 W Xenon Light Source from ACMI Corporation [
14]. The analog output signal from the camera (PAL 475 horizontal lines) was digitized at 720 × 576 pixels using 24-bit color and 25 frames per second at a resolution of approximately 15 pixels/mm for the panoramic view and approximately 21 pixels/mm for the close-up view. The video was saved in AVI format. Digitization was carried out using the Digital Video Creator 120 frame grabber that was connected to the PC through the IEEE 1394 port [
15]. The capturing conditions were controlled by the physician, reflecting the clinical conditions of an operation. Moreover, the team used one more medical camera. A Storz three-chip camera, CO
2 insufflator, cold light source and monitor were used for capturing more ROIs of the endometrium. In addition, illumination was adjusted for optimal viewing but not for calibrating results to include the viewing angle, distance and magnification of images. For both cases, live videos were recorded and analyzed by the CAD system.
“The Effect of Color Correction of Endoscopy Images for Quantitative Analysis in Endometrium” aimed to develop a standardized protocol for the capturing and analysis of hysteroscopic digital images for subsequent use in a computer-aided diagnosis (CAD) system in endometrial cancer. Hysteroscopic images were captured at optimum illumination and focus at 720 × 576 pixels using 24-bit color in the following cases: (i) for a variety of testing targets from a color palette with known color distribution, (ii) different viewing angles and distances from calf endometrium, and (iii) images from the human endometrium. Images were then gamma-corrected, and their classification performance was compared against that of non-gamma-corrected images. No significant difference in texture features was found between the close-up and panoramic views or between angles, either before or after gamma correction. There was a significant difference in certain texture features between normal and abnormal endometrium, both before and after gamma correction. These findings suggest that proper color correction can significantly impact CAD system performance, and its application prior to quantitative texture analysis in hysteroscopy is recommended.
4.3. Multiscale Texture Feature Variability Analysis of Images Captured under Different Viewing Positions
The variability of texture features for images of tissue captured under different viewing conditions was investigated by capturing the following sets of images: 20 images where the telescope tip was at a small distance from the tissue (close-up views, 3 cm distance for 10 images and 5 cm distance for 10 images) and 20 images for two consecutive angles (10 for each) with 5° difference [
7]. Multiscale analysis was carried out in order to examine image texture at different scales. Images were downsampled and filtered to 10 scales (1 × 1 up to 10 × 10) for the different distances and 6 scales (1 × 1 up to 5 × 5 and 10 × 10) for the different angles. ROIs were selected from each image, and the following texture features were extracted: the SF and the SGLDM. Results indicate that there is significant variability between the panoramic and close-up views for multiscale texture features [
7]. However, there is some variance (within reasonable bounds) between the multiscale texture features of consecutive angles [
7]. The results of this experiment may prove useful in computer-aided diagnosis on images captured by hysteroscopy as well as in laparoscopy. Since the angles and tissue proximity from the hysteroscope tip are very small, seems that the CATIA error margin of hysteroscopic images is less and the reproducibility of the results is more robust. However, more experiments have to be carried out and more images have to be analyzed to support this further [
16].
4.4. Texture Feature Extraction
ROIs were transformed into grayscale using the equation
and the following texture features [
17,
18] were computed:
Statistical features (SF): SF features describe the gray-level histogram distribution without considering spatial independence. The following texture features were computed: (1) man, (2) variance and (3) entropy.
Spatial gray-level dependence matrix (SGLDM): The spatial gray-level dependence matrices as proposed by Haralick et al. [
19] are based on the estimation of the second-order joint conditional probability density functions of two pixels (k, l) and (m, n) with distance d in the direction specified by the angle Θ having intensities of gray level i and gray level j. Based on the estimated probability density functions, the following 4 texture measures out of the 13 proposed by Haralick et al. [
19] were computed: (1) contrast, (2) correlation, (3) homogeneity and (4) entropy. For a chosen distance d (in this work d = 1 was used) and for angles Θ = 0°, 45°, 90° and 135° we computed four values for each of the above texture measures. The above features were calculated for displacements δ = (0,1), (1,1), (1,0) and (1,−1), where = δ (Δx,Δy), and their ranges of values were computed.
Gray-level difference statistics (GLDS): The GLDS algorithm [
20] is based on the assumption that useful texture information can be extracted using first-order statistics of an image. The algorithm is based on the estimation of the probability density p
δ of image pixel pairs at a given distance δ = (Δ
χ, Δ
y) having a certain absolute gray-level difference value. Let p
δ be the probability density of f
δ (x,y). If there are m gray levels, this has the form of an m-dimensional vector whose ith component is the probability that f
δ (x,y) will have the value i. If the picture f is discrete, it is easy to compute p
δ by counting the number of times each value of f
δ (x,y) occurs, where Δ
χ and Δ
y are integers. Coarse texture images result in low gray-level difference values, whereas fine texture images result in interpixel gray-level differences with great variances. Variable i is two pixels’ gray-level difference, m is the number of gray levels and pį is the individual probability. Features were estimated for the following distances: δ = (d,0), (d,d), (−d,d) and (0,d). A good way to analyze texture coarseness is to compute, for various magnitudes of į, some measure of the spread of values in p
δ away from the origin.
4.5. ROI Classification
The performance of the system using SVMs and probabilistic neural networks (PNNs) was also investigated. For both classifiers, training and testing for differentiating between normal ROIs and abnormal ROIs were performed. The C-SVM network was investigated using the Gaussian radial basis function (RBF) kernel and the linear kernel. Significantly better performance was obtained using the RBF kernel tuned based on the methodology proposed in [
20]. More specifically, the values of c = 8 and γ = 0.04 were selected for prescribing the shape of the RBF kernel. These settings were fine-tuned based on numerous runs for different feature sets. We also consider the use of a PNN classifier that is based on the use of RBFs. This classifier was investigated for several spread radii in order to identify the optimal value following a similar procedure to that prescribed for the SVM case. The leave-one-out method was used for validating all the classification models unless otherwise stated. The runs were completed for each of the three color systems and for the Y channel. Better performance was obtained for the SVM models compared to the PNN classification models [
8].
5. Conclusions
CAΤΙA needs to be further supported with well-designed studies enabling more extensive validation on larger datasets, in a clinical setting. When CATIA proves that it may increase the surgeon’s diagnostic ability and sampling precision, it could augment the intraoperative management decision and the surgeon’s performance. Additionally, it could minimize complications such as hemorrhage, hematoma, the spread of malignant cells, infection and scarring from multiple biopsies, as well as extensive tissue injuries. The proven efficacy of the discrimination ability of this CAD method, after validation by prospective and randomized studies, will allow the clinical implementation of CATIA systems linked with optical biopsies.

 ,
, 
