Article

Bioinformatics Analysis of RNA-seq Data Reveals Genes Related to Cancer Stem Cells in Colorectal Cancerogenesis

Institute of Pathology, Faculty of Medicine, University of Ljubljana, 1000 Ljubljana, Slovenia
*
Author to whom correspondence should be addressed.
Int. J. Mol. Sci. 2022, 23(21), 13252; https://doi.org/10.3390/ijms232113252
Submission received: 27 September 2022 / Revised: 26 October 2022 / Accepted: 28 October 2022 / Published: 31 October 2022
(This article belongs to the Special Issue Cellular and Molecular Biology of Cancer Stem Cells)

Abstract

:
Cancer stem cells (CSC) play one of the crucial roles in the pathogenesis of various cancers, including colorectal cancer (CRC). Although great efforts have been made regarding our understanding of the cancerogenesis of CRC, CSC involvement in CRC development is still poorly understood. Using bioinformatics and RNA-seq data of normal mucosa, colorectal adenoma, and carcinoma (n = 106) from GEO and TCGA, we identified candidate CSC genes and analyzed pathway enrichment analysis (PEI) and protein–protein interaction analysis (PPI). Identified CSC-related genes were validated using qPCR and tissue samples from 47 patients with adenoma, adenoma with early carcinoma, and carcinoma without and with lymph node metastasis and were compared to normal mucosa. Six CSC-related genes were identified: ANLN, CDK1, ECT2, PDGFD, TNC, and TNXB. ANLN, CDK1, ECT2, and TNC were differentially expressed between adenoma and adenoma with early carcinoma. TNC was differentially expressed in CRC without lymph node metastases whereas ANLN, CDK1, and PDGFD were differentially expressed in CRC with lymph node metastases compared to normal mucosa. ANLN and PDGFD were differentially expressed between carcinoma without and with lymph node metastasis. Our study identified and validated CSC-related genes that might be involved in early stages of CRC development (ANLN, CDK1, ECT2, TNC) and in development of metastasis (ANLN, PDGFD).

1. Introduction

A majority of any given neoplasm presumably consists of cells incapable of tumor progression and formation of metastases. It is believed that for tumor growth and metastatic spread, a minority of cancer cells is needed, referred to as cancer stem cells (CSC) or CSC-like cells, which are capable of self-renewal, differentiation, and mobility. Numerous studies suggest that CSC have a higher propensity toward invasion and that they are also responsible for disease relapse [1]. One reason might be due to fact that turnover of CSCs is slow, which in turn allows greater resistance to therapies that target rapidly replicating cells [2,3].
Our previous studies showed that genes related to CSC-like cells might be also involved in development and progression of colorectal cancer (CRC) [4,5]. CRC is one of the most common causes of morbidity due to cancer worldwide [6]. For patients with CRC, the five-year survival rate varies, approximately 90% in patients with early lesions and 8–12% in patients with advanced CRC [7]. Despite new treatments options, 40–50% of CRC patients develop metastases [6,7,8,9]. The prognosis is significantly improved with early lesion detection through population screening programs [10,11]. CRC progression from normal mucosa to invasive carcinoma mostly develop through precursor lesions, i.e., adenomas [9]. Molecular pathways involved in CRC development are widely recognized, e.g., chromosomal instability (CIN) pathway, microsatellite instability (MSI) pathway and epigenetic instability pathway (CpG island methylator phenotype, CIMP) [9,12]. However, most genetic events that are associated with tumor development occur early, before the formation of the carcinoma, consequently leading to a need to define mechanisms and biomarkers responsible for malignant transformation.
Genes associated with CSC features might thus be potentially promising biomarkers in CRC development and progression. In CRC patients, CSC-associated molecular profiles can predict tumor regeneration and disease relapse after conventional therapy [3,13,14,15,16,17]. Moreover, several potential anti-CSC targeted drugs have been identified, with some of them making their way to the clinic [18]. However, knowledge about CSC involvement in early stages of CRC development, as CRC progresses from adenoma to early carcinoma is limited. Up to date, several CSC-related markers have been described in adenomas, e.g., CD133 [19], LGR5, PROM1 [20], IL-8 [21], OLFM4, and ASCL2 [22], but more information is required to understand malignant transformation, despite current findings in the field [19,20,21,22,23].
By comparing transcriptional heterogeneity in primary CRC and corresponding metastases, fewer differences were seen between the primary tumors and their matched metastases in comparison to marked differences in protein-coding gene expression profiling between the normal mucosa and primary CRC. These results suggest that the vast majority of gene expression changes manifest in the early stages of the CRC development [24,25] and support the necessity to investigate precancerous lesions and early CRC. There are numerous genome wide and high-throughput analyses investigating expression and/or methylation status of CRC in comparison to the normal mucosa [22,26,27,28,29,30,31,32,33]. Publications investigating colorectal adenoma to adenocarcinoma and normal mucosa were in the past mainly focused on proteomic analyses and more recently mainly on the serum and plasma expression profiling from CRC patients [29,34,35]. However, analyses of gene expression investigating adenoma in comparison to adenocarcinoma are limited and have thus far not elucidated the CSC involvement in CRC development and progression [20,22,23,26,36,37,38,39,40,41,42,43,44].
The aim of our study was to identify differentially expressed genes (DEGs) related to CSC in CRC development through bioinformatics analysis of raw RNA-seq projects data containing samples of normal mucosa, adenomas, and carcinomas. Identified genes were chosen for further validation with qPCR on our own cohort of samples for their involvement in CRC development and progression.

2. Results

2.1. Identification of DEGs

2.1.1. Identification of DEGs from Gene Expression Omnibus (GEO) Database

Identification of DEGs is summarized in Table 1. All procedures for identification of DEGs were performed at specified cut-off conditions. The full results, including the pathway enrichment analysis (PEI) and protein–protein interaction analysis (PPI), are available in Supplementary File S1.

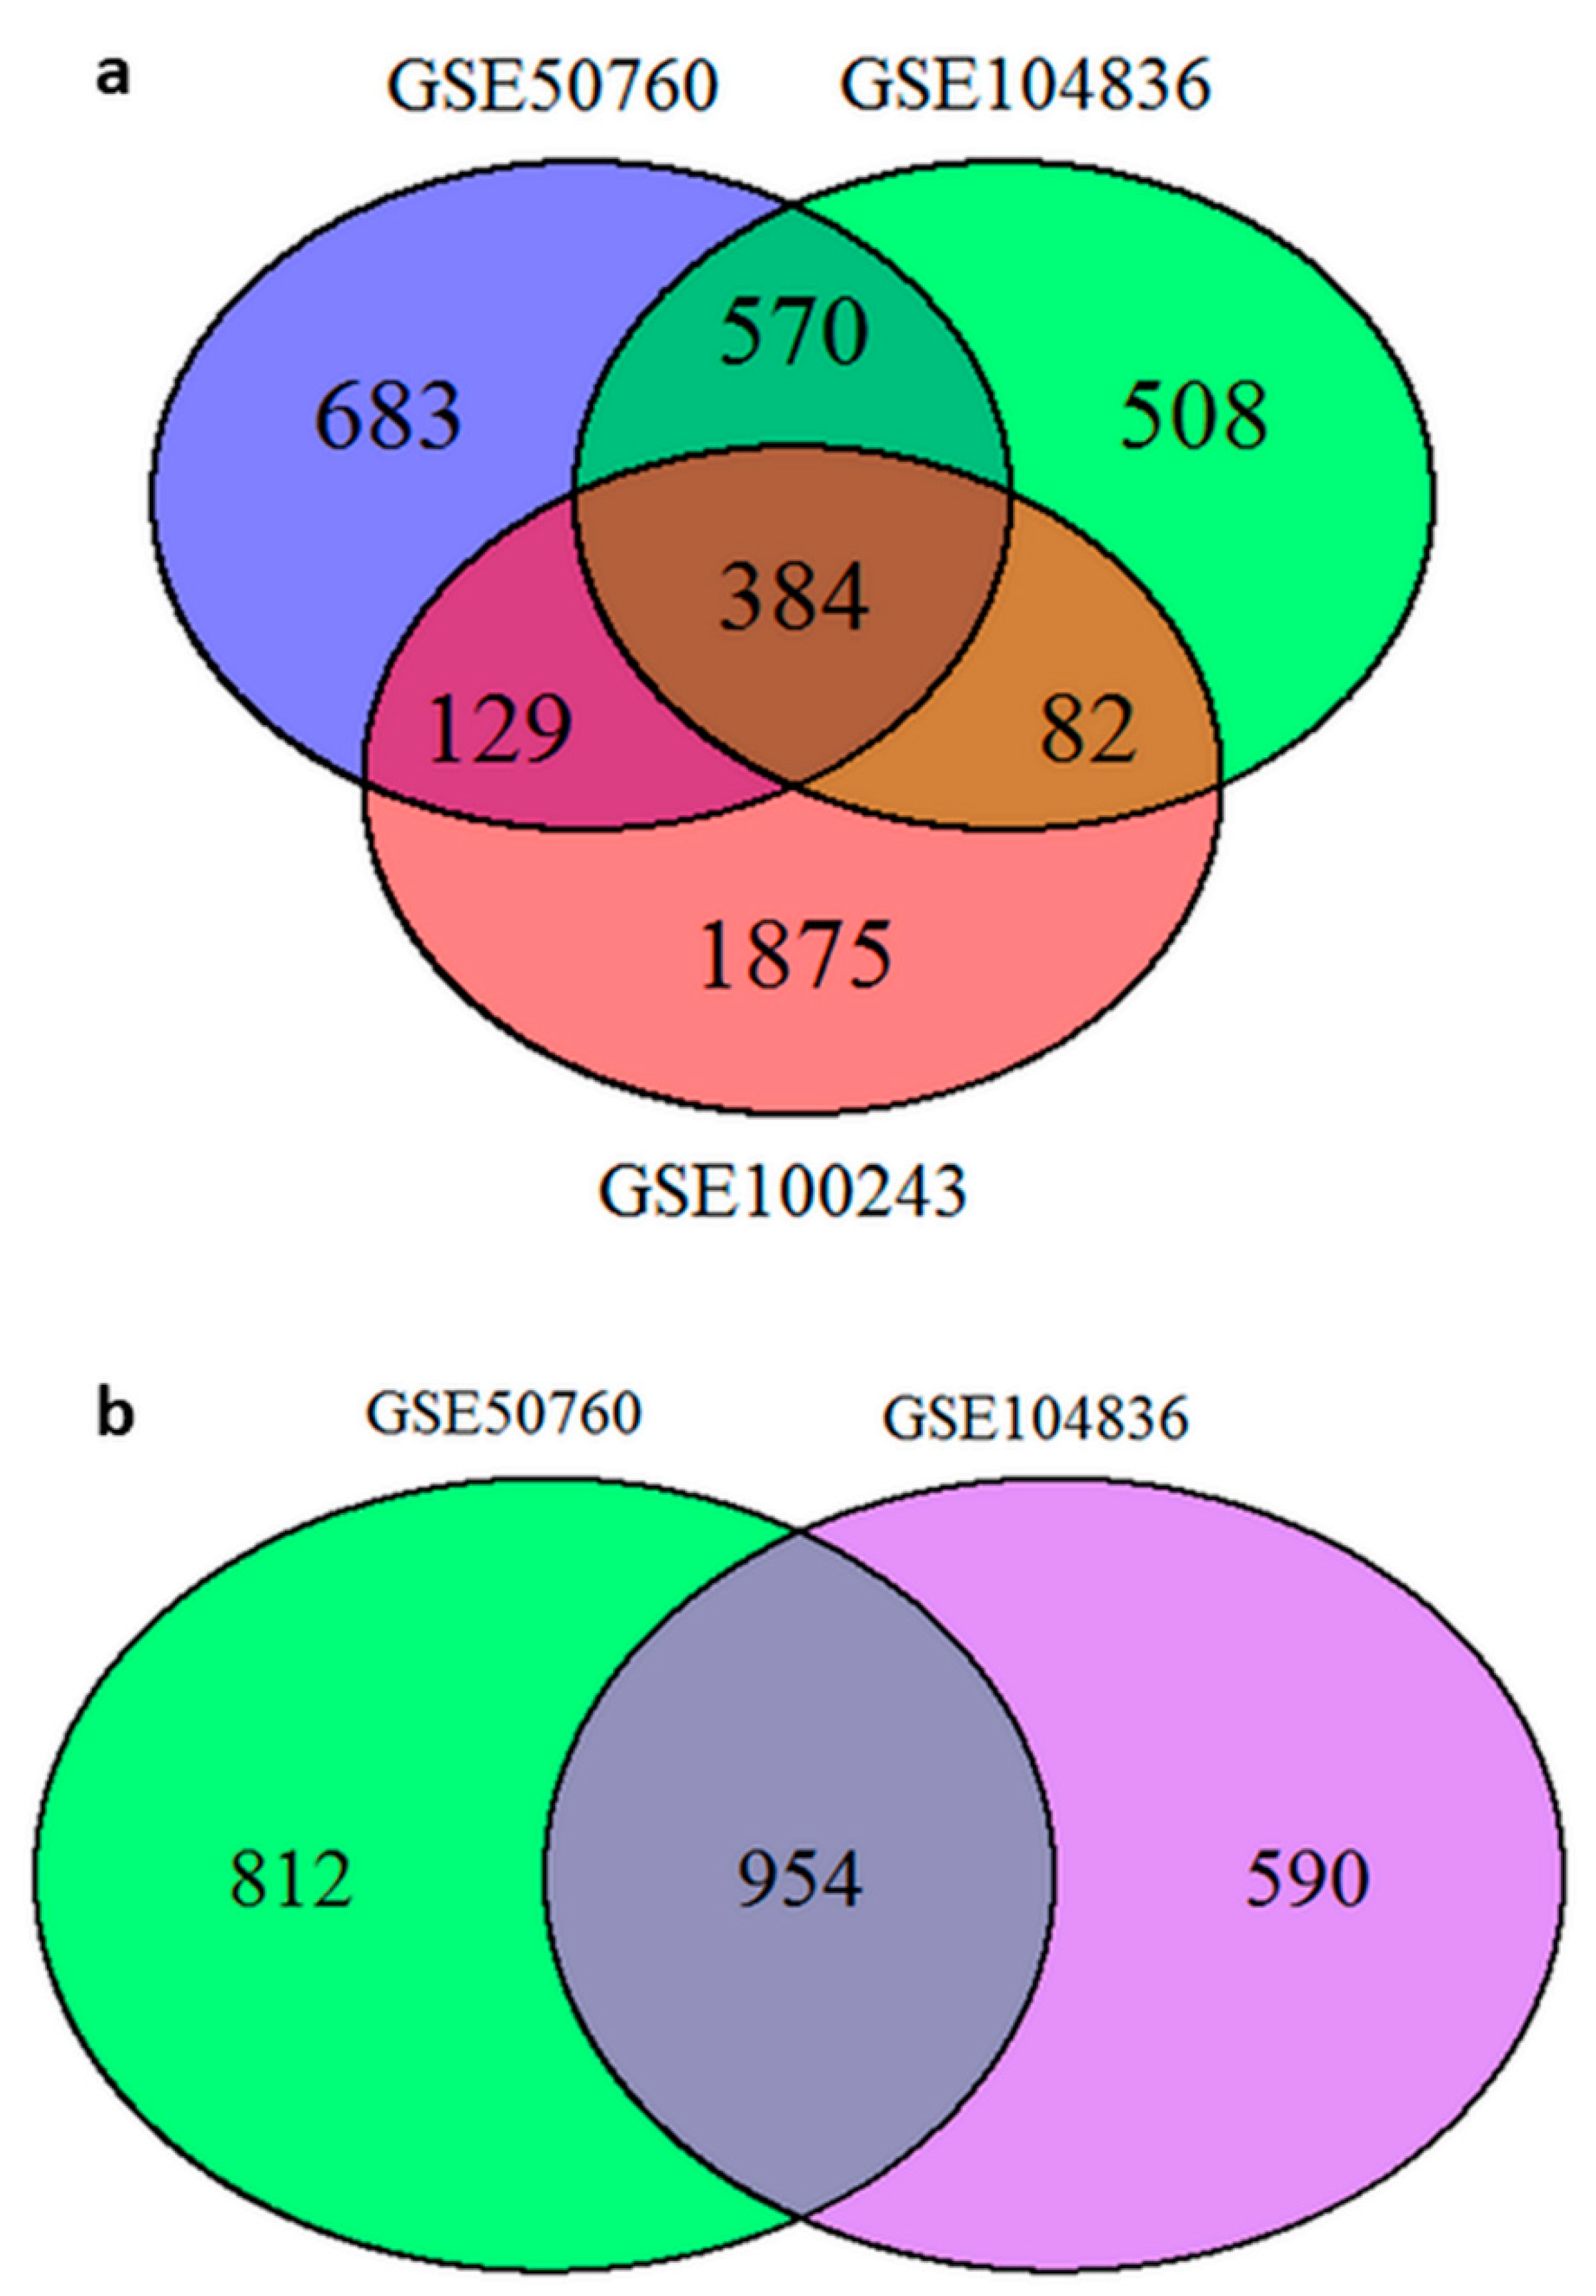
2.1.2. Comparing Results between Projects from GEO Database—CRC and Corresponding Normal Mucosa

In the first comparison, we included experiments performed on the Ion Torrent sequencer. We identified 384 DEGs between all three projects that included normal tissue and carcinoma pairs, GSE50760, GSE104836, and GSE100243. Project GSE92914 was excluded from this analysis, as there were no DEGs to compare. The full list of overlapping DEGs is available in Supplementary File S2, sheet 1. Venn diagram showing the overlapping DEGs between projects is shown in Figure 1a.
PEI analysis. Through the gene ontology (GO) analysis on the list of overlapping genes, we identified 48 biological processes, 14 cellular localization terms, and 15 molecular functions. The full results are available in Supplementary File S2, sheet GO. We identified 6 pathways associated with the overlapping DEGs in the KEGG database and 17 pathways in the REACTOME database using the DAVID tool and previously mentioned settings. The full results are available in Supplementary File S2, sheet Path.
PPI analysis. The PPI analysis on the overlapping DEGs resulted in 32 STRING local network terms shown in Supplementary File S2, sheet String.
The identified predicted functional partners are TRIP13, PSMD8, AURKA, NCAPG, and CCNB1.
In the next comparison, we performed overlaps between projects, including carcinoma and corresponding normal mucosa, but excluding experiments performed on the Ion Torrent sequencer. We identified 954 DEGs between two projects that included carcinoma and corresponding normal mucosa, GSE50760 and GSE104836 that were performed on the same sequencing technology. Project GSE92914 was excluded from this analysis as there were no DEGs to compare. The full list of overlapping DEGs is available in Supplementary File S3, sheet 1. Venn diagram showing the overlapping DEGs between projects is shown in Figure 1b.
PEI analysis. Through the GO analysis on the list of overlapping genes, we identified 88 biological processes, 24 cellular localization terms, and 23 molecular functions. The full results are available in Supplementary File S3, sheet GO. We identified 17 pathways associated with the overlapping DEGs in the KEGG database and 33 pathways in the REACTOME database using the DAVID tool and previously mentioned settings. The full results are available in Supplementary File S3, sheet Path.
PPI analysis. The PPI analysis on the overlapping DEGs resulted in 52 STRING local network terms shown in Supplementary Table S3, sheet String.
The predicted functional partners are PSMD8, KAT2A, GNB3, GNB4, and ORC2.

2.1.3. Identification of DEGs through Joint Projects—CRC and Adenomas

For this analysis, we joined the counts data from projects GSE72820, GSE104836, GSE50760, GSE92914, and GSE76987 performed on the same sequencing technology (Illumina) in one project and analyzed the data.
For comparisons between normal tissue and carcinomas at logarithm of base 2 of the fold change value (logFC) > 1.5 and adjusted p < 0.05, we identified 1524 DEGs. The full list of DEGs is available in Supplementary File S4, table NvsC, sheet 1. Additionally, the top 100 genes from this analysis are featured in the heatmap shown in Figure 2. For comparisons between adenomas and carcinomas at logFC > 1.5 and adjusted p < 0.05, we identified 706 DEGs. The full list of identified DEGs is available in Supplementary File S4, table AvsC, sheet 1. Additionally, the top 100 genes from this analysis are featured in the heatmap shown in Figure 3.
When overlapping 706 DEGs between adenomas and carcinomas with 1524 DEGs between normal tissue and carcinomas, we identified 569 overlapping DEGs. The full list of overlapping DEGs and the PEI and PPI analyses is available in Supplementary File S4, table ACvsNC, sheet 1.
PEI analysis. Through the GO analysis on the list of overlapping genes, we identified 67 biological processes, 16 cellular localization terms, and 21 molecular functions. The full results are available in Supplementary File S4, table ACvsNC, sheet GO. We identified 17 pathways associated with the overlapping DEGs in the KEGG database and 18 pathways in the REACTOME database using the DAVID tool and previously mentioned settings. The full results are available in Supplementary File S4, table ACvsNC, sheet Path.
PPI analysis. The PPI analysis on the overlapping DEGs resulted in 36 STRING local network terms shown fully in Supplementary Table S4, table ACvsNC, sheet String. The full PPI network is shown in Figure 4a, while the physical PPI network is shown in Figure 4b. The physical PPI network represents shared physical complexes. The edges indicate that the directly linked proteins are part of the same physical complex.
The predicted functional partners are AURKA, GNB3, GNB4, ORC2, and NCAPG.

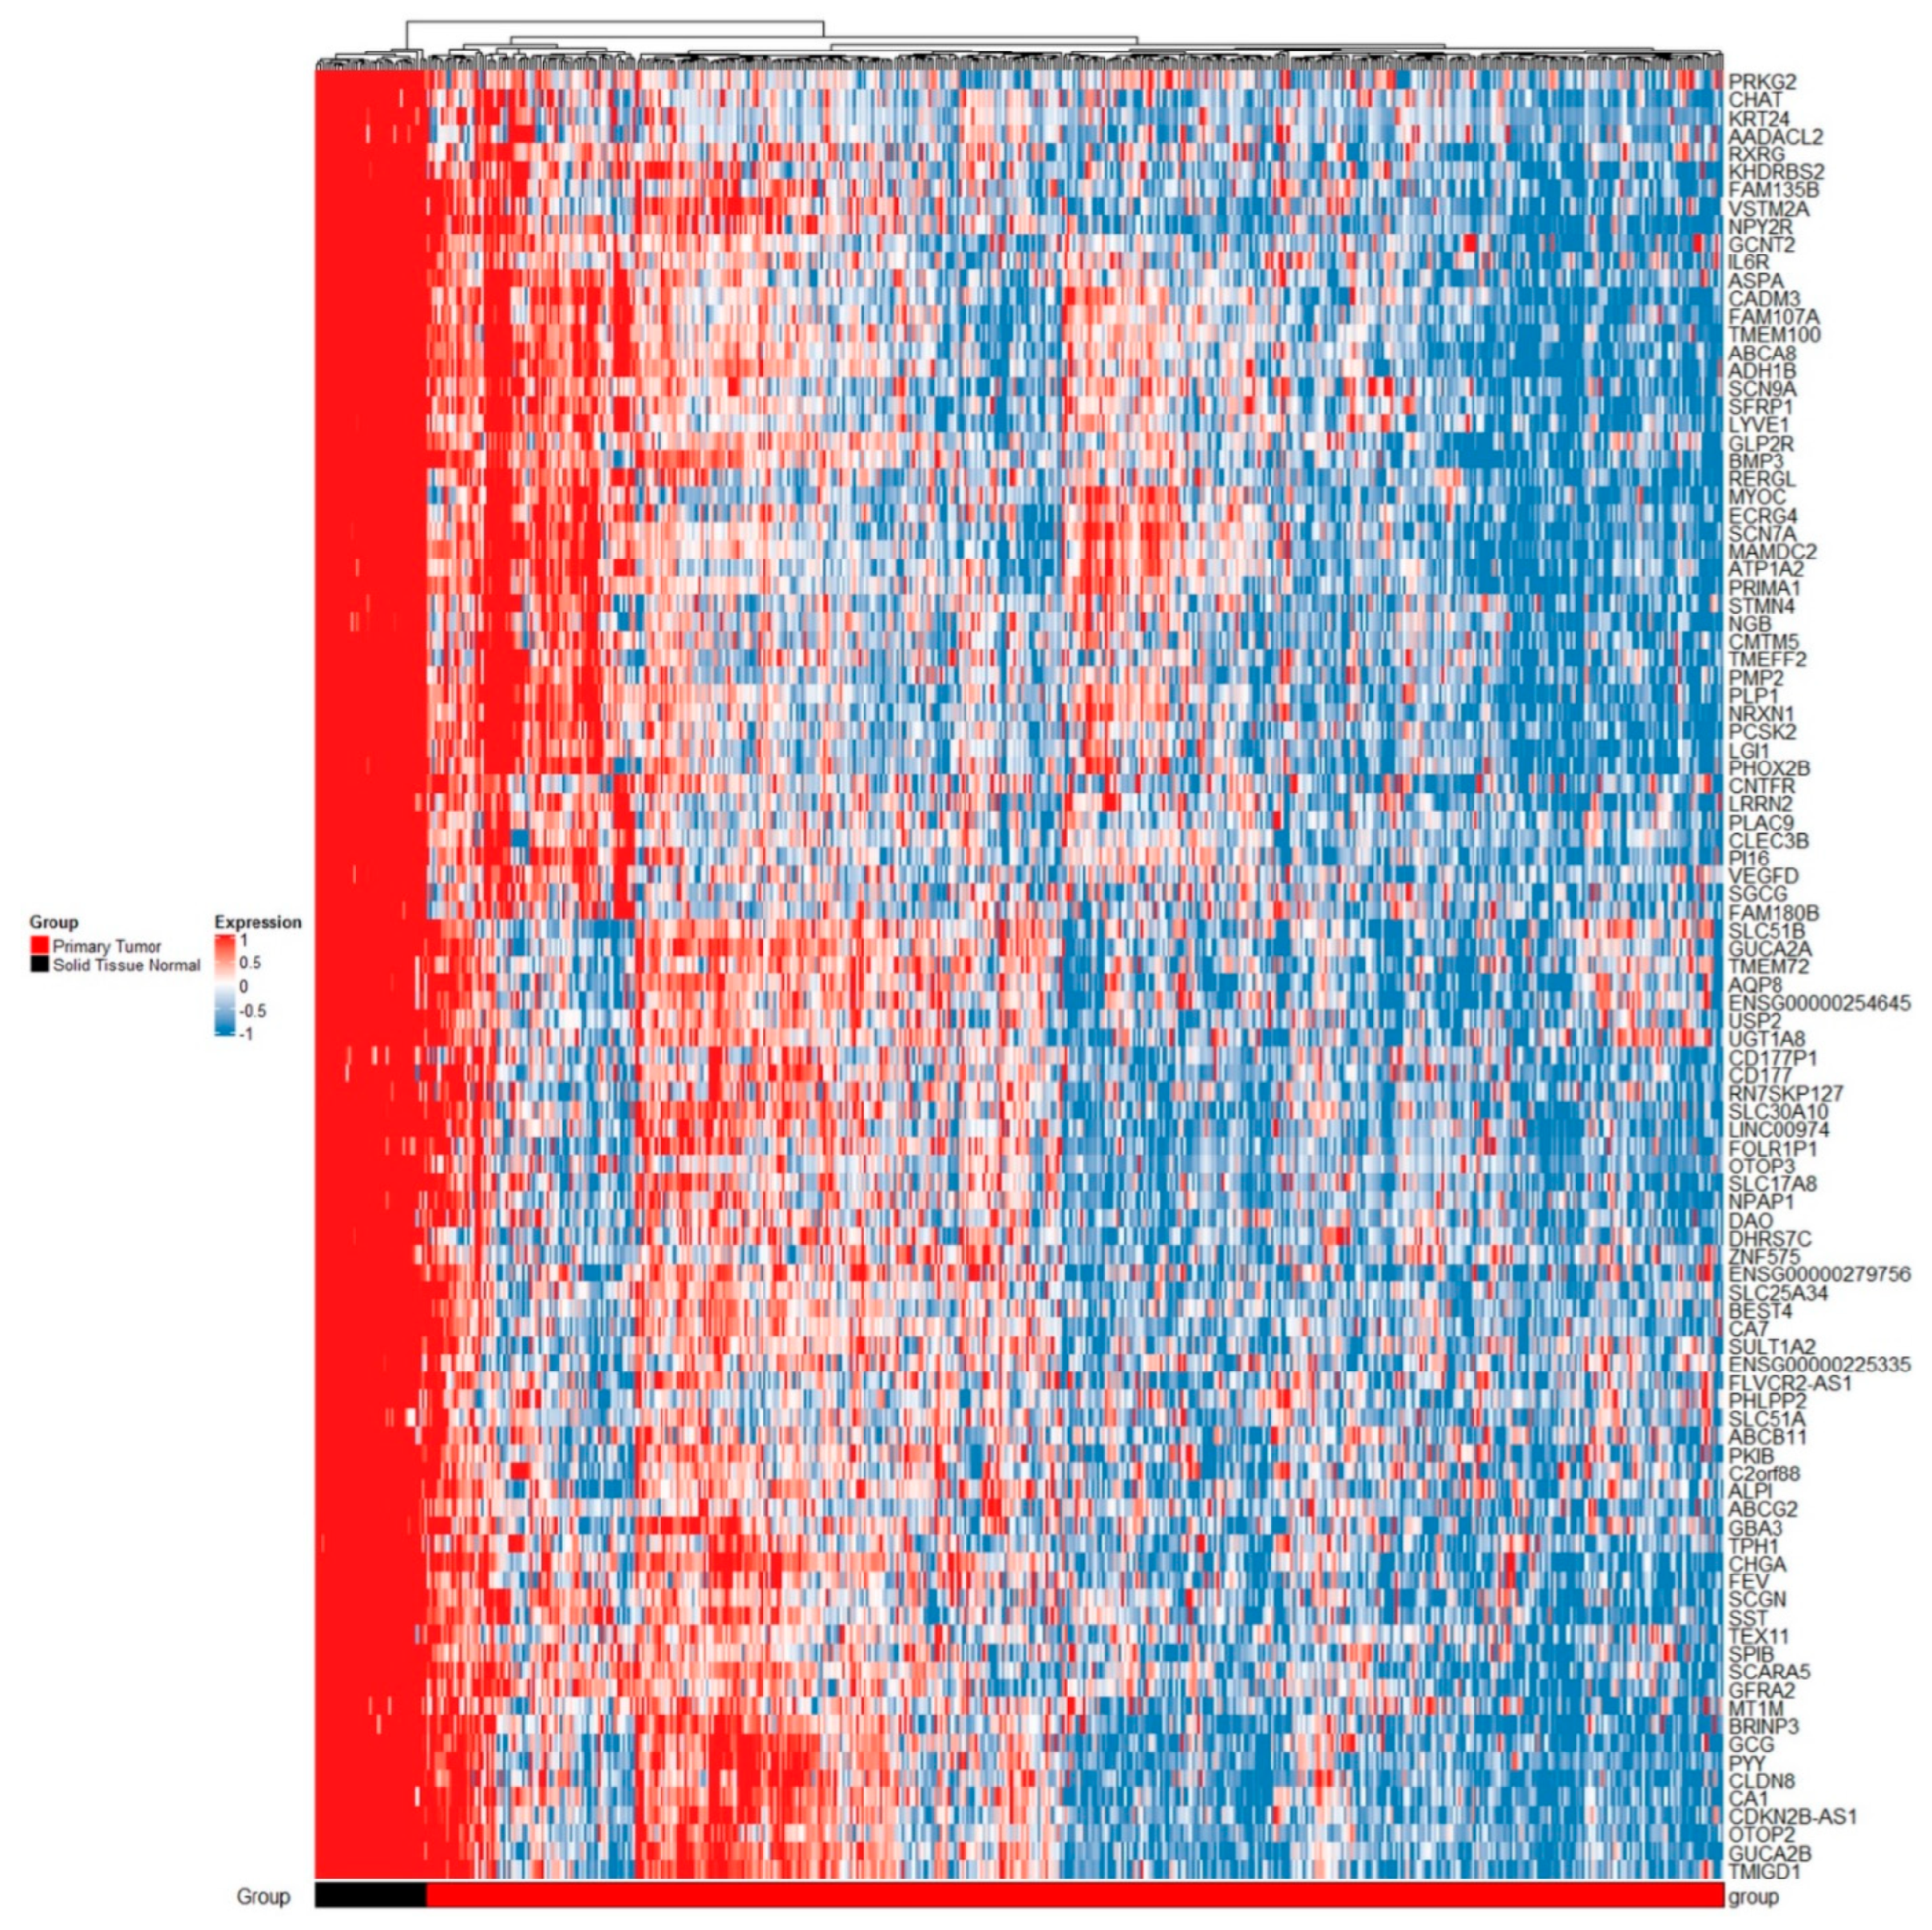
2.1.4. TCGA Analysis

The analysis of data from The Cancer Genome Atlas (TCGA) database was performed on 519 samples from TCGA-COAD (colon) RNA-seq project available for public analysis. The HTSeq-Counts workflow data were obtained for primary tumors and normal tissue samples. The independent analysis between groups was performed as explained in the Materials and Methods section.
The aforementioned procedure for identification of DEGs in this project resulted in 4259 DEGs at logFC > 1.5 and p < 0.05, after adjustment, for comparing normal tissue and carcinomas. Top 100 DEGs are shown in Figure 5 heatmap of expression between the primary tumor and normal samples. The full results including PEI analysis is available in Supplementary File S1, table TCGA. The number of DEGs was too high to perform PPI analysis. PPI analysis and PEI analysis were also performed separately for the upregulated and downregulated (only the first 2000 per STRING limit) DEGs. The results are available in Supplementary File S1, table TCGA upregulated, table TCGA downregulated.

2.1.5. Comparing Results from GEO Projects and TCGA Results

The 1524 DEGs identified between the normal tissue and carcinoma tissue from GEO (Supplementary File S4, table NvsC, sheet 1) were compared to the 4259 DEGs identified in the TCGA analysis. We identified 1165 overlapping DEGs. The full list of overlapping DEGs is available in Supplementary File S5, sheet 1.
PEI analysis. Through the GO analysis on the list of overlapping genes, we identified 132 biological processes, 38 cellular localization terms, and 41 molecular functions. The full results are available in Supplementary File S5, sheet GO. We identified 16 pathways associated with the overlapping DEGs in the KEGG database and 40 pathways in the REACTOME database using the DAVID tool and previously mentioned settings. The full results are available in Supplementary File S5, Path.
PPI analysis. The PPI analysis on the overlapping DEGs resulted in 44 STRING local network terms shown fully in Supplementary Table S5, sheet String.
The predicted functional partners are RCF2, MCM5, AURKA, ORC2, and NCAPG.

2.2. Identification of Candidate Genes for Further Validation

Among the identified DEGs in the joint GEO projects analysis, also the DEGs identified comparing adenoma and corresponding normal mucosa as well as overlap between carcinomas and corresponding normal tissue were considered for further validation. In the PEI analysis from the adenoma versus carcinoma comparison, the PI3K-Akt signaling pathway, associated with CSC [45,46,47] was chosen for identification of candidates for further validation. In the PPI analysis CL:12302 mixed, incl. mitotic cytokinesis, and G2/M DNA replication checkpoint and CL:12305 mixed, incl. mitotic cytokinesis, and G2/M DNA replication checkpoint terms were chosen for further validation. The DEGs from the aforementioned pathway and from the PPI analysis were then checked for references associating them with CSC or stem cell terms and checked for presence in the Stemformatics database [48]. Finally, six genes were identified for further validation, namely anillin, actin binding protein (ANLN), cyclin dependent kinase 1 (CDK1), epithelial cell transforming 2 (ECT2), platelet derived growth factor D (PDGFD), tenascin C (TNC) and tenascin XB (TNXB). The summary of comparisons is represented in Figure 6.

2.3. Validation of Identified Candidate Genes on Samples of Normal Mucosa, Adenoma, Adenoma with Early Carcinoma, and Carcinoma without and with Lymph Node Invasion

2.3.1. Differential Gene Expression in Adenoma and Adenoma with Early Carcinoma

∆Cq for the investigated genes in adenoma and adenoma with early carcinoma were statistically evaluated independently against normal mucosa samples. Statistically significant results in adenomas include 12.4-fold downregulation of TNC (p ≤ 0.001), 9.4-fold downregulation of TNXB (p ≤ 0.001), and 6.0-fold upregulation of ECT2 (p ≤ 0.001). In adenomas with early carcinomas, statistically significant results include TNXB with 7.7-fold downregulation (p ≤ 0.001), 4.4-fold upregulation of CDK1 (p ≤ 0.01), 14.1-fold upregulation of ANLN (p ≤ 0.001), and 26.3-fold upregulation of ECT2 (p ≤ 0.001). We identified statistically significant differences between the adenoma and adenoma with early carcinoma for ANLN (p ≤ 0.001), CDK1 (p ≤ 0.05), ECT2 (p ≤ 0.01), and TNC (p ≤ 0.05). The results are shown in Figure 7a.

2.3.2. Gene Expression in Carcinoma Compared to Corresponding Normal Mucosa

∆Cq for the investigated genes in CRC without and with lymph node metastases were statistically evaluated against corresponding normal mucosa. In CRC without lymph node metastases, 4.8-fold upregulation of TNC (p ≤ 0.05) was observed. The results are shown in Figure 7b.
In CRC with lymph node metastases, there was 51.4-fold upregulation of PDGFD (p ≤ 0.01), 2.7-fold upregulation of CKD1 (p ≤ 0.05), and 7.9-fold upregulation (p ≤ 0.05) of ANLN. The results are shown in Figure 7c.
When comparing the ∆∆Cq data (normalized to paired mucosa samples) of CRC without to CRC with lymph node metastases, we identified statistically significant upregulation at p ≤ 0.05 for PDGFD and ANLN. Results are shown in Figure 7d.
We report all of the investigated comparisons in the tested groups below in Table 2.

2.3.3. Association with Level of Malignancy

Additionally, we identified positive correlation of several genes in relation to malignancy levels (from normal mucosa, adenoma, adenoma with early carcinoma, CRC without to CRC with lymph node metastasis) with the use of Spearman correlation coefficient. The correlated genes were PDGFD (rs = 0.637; p ≤ 0.001), CDK1 (rs = 0.256; p ≤ 0.05), ANLN (rs = 0.453; p ≤ 0.001), and ECT2 (rs = 0.312; p ≤ 0.05).

3. Discussion

In the present study, we identified six CSC-related genes associated with CRC development by analyzing RNA-seq data from GEO and TCGA databases, comparing data of normal mucosa, adenoma, and CRC. Previous bioinformatics studies on CRC have identified many gene expression profiles mainly between normal tissue, carcinoma, and metastases; however, studies on gene expression profiles between adenoma and carcinoma are less common [22,23,26,36,37,38,39,40,41,42,43,44,49,50,51,52,53]. The DEGs between adenoma and carcinoma are important for identification of potential biomarkers of malignant transformation [22,23,38,39,40,42,43,44,51,52,53], some of which were previously identified by our group, by analyzing publicly available data on microarray analyses from the GEO database [26]. Whereas the previous bioinformatics studies were focused on any differential expressed gene between adenoma and CRC, in the current study, we focused on genes that are related to CSC. We performed an independent analysis irrespective of original procedures. The six identified CSC-related genes could be potential biomarkers indicating malignant potential and cancer progression.

3.1. Identified DEGs, PEI and PPI Related to CSC

By combining results of carcinoma compared to normal tissue and normalized adenoma and carcinoma compared to each other, we identified 384 and 706 overlapping DEGs, respectively. We identified several pathways that can be associated with CSC alone or both CSC and extracellular matrix (ECM). Some of them were identified by our group in previous studies, associated with the ECM and CSC, and were already validated in CRC development [4,54]. The identified pathways in current study were the ECM-receptor interaction pathway [55], PPAR signaling pathway [56], and the PI3K-Akt signaling pathway [45,46,47]. Six genes were chosen for further validation after identification of association with CSC: three DEGs were associated with CSC, namely platelet derived growth factor D (PDGFD), tenascin C (TNC) and tenascin XB (TNXB) from the pathway PI3K-Akt, and three DEGs, namely anillin actin binding protein (ANLN), cyclin dependent kinase 1 (CDK1), and epithelial cell transforming 2 (ECT2) that are associated with G2/M DNA replication checkpoint in the PPI analysis.
Previous studies suggested that TNC positively correlates with SOX2 and AKT/HIF1a and with stem cell properties [57]. TNXB induced invasive growth and metastases in tumor cells with stem cell properties [58]. Its expression was downregulated during cancer progression, while upregulation was associated with better prognosis [59]. PDGFD was reported to be associated with epithelial-mesenchymal transition (EMT) and stem cells in a breast cancer cell line, where it was also associated with tumor growth [60]. Its expression in mesenchymal stem cells obtained from stomach carcinoma was associated with cancer progression in vitro and in vivo [61]. CDK1 was associated with maintenance of stem cell properties in lung cancer by interacting with SOX2 [62], another stem cell marker in CRC, and its protein expression increases significantly from normal mucosa to dysplasia and from dysplasia to carcinoma [63,64]. It was also associated in maintenance of pluripotency and genomic stability in human pluripotent stem cells [65]. ANLN was associated with migration, growth, and metastasis of breast cancer cells through control of stemness and differentiation [66]. It also enhanced stemness of triple negative breast cancer [67]. Higher expression of ECT2 was associated with worse prognosis in stomach cancer, where its transcriptomic profile was associated with stem cell properties in cancer cells and was suggested as a potential biomarker for cancer cells with stem cell properties [68].

3.2. Expression of Investigated Genes in Association with Malignant Transformation, Progression, and Mestastases of CRC

The genes TNC, CDK1, ANLN, and ECT2 were significantly upregulated in adenoma with early carcinoma when compared to adenoma and can be considered as potential biomarkers for malignant transformation. To the best of our knowledge, no relevant data on ANLN expression in adenoma in comparison to carcinoma of CRC has been published so far. CDK1 was identified as expressed in adenomas and CRC, while expression of its partner CDKN1A was absent, suggesting that the proliferative activity of CRC, which may be an early event in carcinogenesis, is not solely dependent on control of the cell cycle by these two genes [69]. Similarly, we identified CDK1 upregulation in adenomas with early carcinomas and when compared to adenomas. ECT2 was identified as overexpressed in adenomas and CRC, elevated nucleated ECT2 correlated with poorly differentiated tumors, a low cytoplasmic to nuclear ratio of ECT2 was associated with poor patient survival and suggests that this gene is a driver of tumor progression [70]. We similarly identified its upregulation from normal mucosa to adenomas and adenomas with early carcinoma. The expression of TNC was identified in adenomas and CRC, often in invading edges, it was associated with a positive relationship between degree of protein-coding gene expression levels and the depth of invasion, as well as frequency of metastasis, suggesting an important role during cancer development and progression [71]. Although we identified downregulation of TNC in adenomas when compared to normal mucosa, we observed upregulation when comparing adenoma with early carcinoma to adenoma.
The gene TNC was upregulated in CRC without lymph node metastases when compared to corresponding normal mucosa. ANLN, CDK1, and PDGFD were upregulated in CRC with lymph node metastases compared to corresponding normal mucosa. ANLN and PDGFD were significantly upregulated in CRC with lymph node metastases when compared to those without lymph node metastases and can be considered as potential biomarkers for metastases in CRC.
For some genes, information is available in the field of cancer progression and metastases development. Expression of TNC protein in stromal cells of CRC was associated with late-stage CRC and a shorter long-term survival [72], similarly, in our research it was upregulated in CRC without lymph node metastases. PDGFD downregulation was associated with lower proliferation levels not only in CRC but also in prostate cancer [73]. Its upregulation was also associated with cancer cell migration, invasiveness, and proliferation in CRC [74]. Similarly, in our research it was significantly upregulated in CRC with lymph node metastases compared to CRC without lymph node metastases and corresponding normal mucosa. It also positively correlated with the level of malignancy. Upregulation of ANLN was associated with CRC progression and poor prognosis [75]. Similarly to PDGFD, in our research, ANLN was upregulated in CRC with lymph node metastases when compared to normal mucosa and to CRC without lymph node metastases and positively correlated with the level of malignancy. It is regulated by SP2 and promotes proliferation of CRC cells through the PI3K/AKT and MAPK pathways [76]. High nuclear/cytoplasmic ratio of CDK1 expression predicted poor prognosis in CRC patients [77]. Similarly, in our research it was upregulated in CRC with lymph node metastases and was positively correlated with the level of malignancy. In CRC patients harboring BRAF mutations, apoptosis resistance can be overcome when the therapeutic targets are CDK1 and MEK/ERK [78]. Upregulation of ECT2 was associated with a shorter survival without CRC recurrence [79] and a shorter overall survival in CRC patients [79,80]. While we identified no significant differences in expression of ECT2 between CRC and their corresponding normal mucosa or between CRC without and with lymph node metastases, our findings of positive correlation with malignancy levels are in line with the findings in the field.
Additionally, through identification of positive correlation of PDGFD, ANLN, CDK1, and ECT2 to the level of malignancy, we propose these genes to be considered also as potential biomarkers for CRC progression.

3.3. The Most Common Predicted Functional Partners in the PPI Analysis

The most common predicted functional partners in the PPI analysis of our CRC data were AURKA, ORC2, and NCAPG.
AURKA plays important roles in mitosis and chromosome stability, it is a prognostic marker in CRC [81], it increased the chemosensitivity of colon cancer cells to oxaliplatin by inhibiting the TP53-mediated DNA damage response genes [82], and its expression in CRC liver metastases was associated with poor prognosis [83]. Additionally, it promoted cancer metastasis by regulation of EMT and CSC properties in hepatocellular carcinoma [84], and it enhanced the breast CSC phenotype [85].
Depletion of ORC2 was associated with mitotic arrest due to chromosome condensation defects. In hepatocellular carcinoma, ORC2 was not associated with overall survival; however, its expression was correlated with disease-free survival [86]. It was also upregulated in microarray data analysis on the cisplatin-sensitive T24 and the cisplatin-resistant T24R2 bladder cancer cell line [87]. It was identified that HCT116 colon cancer cells initiate DNA replication normally in the absence of ORC5 and ORC2 proteins [88]. Additionally, ORC2 was associated with prevention of apoptosis induction and could serve as a potential target for cancer therapy by inhibition of cancer cell stemness [89].
NCAPG facilitated colorectal cancer cell proliferation, migration, invasion, and EMT by activation of the Wnt/β-catenin signaling pathway [90]. Additionally, miR-23b-3p/NCAPG/PI3K/AKT signaling axis may play an important role in CRC carcinogenesis [91].
Through validation of expression of the investigated genes in normal mucosa, adenomas, adenomas with early carcinomas, and CRC without and CRC with lymph node metastases, we identified potential CSC-related biomarkers for malignant transformation, progression, and metastases of CRC. Our results are further supported by PPI analyses and most common predicted functional partners.

3.4. Limitations of the Study

An important limitation of our study is associated with the use of normal mucosa samples. Although they were taken at least 20 cm away from the tumor and showed no microscopic abnormalities, genetic and protein aberrations may already be present in morphologically normal mucosa [92,93]. However, these samples can still be used as corresponding control samples to overcome differences in the physiological and genetic background. Another limitation of our study is a relatively small sample size. The latter is due to the use of formalin-fixed paraffin-embedded (FFPE) tissue samples, in which nucleic acids are challenging to analyze. Therefore, only samples that successfully passed the initial quality control and samples with stable expression of the reference genes were selected for further analysis, thus limiting the number of included samples. Moreover, further validation on a higher number of samples may be needed for additional confirmation of potential biomarkers.

4. Materials and Methods

4.1. Bioinformatics Analysis of Publicly Available Data

4.1.1. Project Selection

Several projects (GSE72820, GSE104836 [50], GSE50760, GSE92914 [49], GSE76987 [51], GSE100243) with gene expression profiles of colon normal, and/or adenoma, and/or carcinoma were downloaded from the public functional genomics data repository Gene Expression Omnibus database (GEO, http://www.ncbi.nlm.nih.gov/geo) (accessed on 30 March 2020) of the National Center for Biotechnology Information (NCBI). Where available, TNM status was considered for project inclusion. Only samples where corresponding normal tissue was available were included in the analysis. Five projects were performed on Illumina HiSeq/NextSeq technology, while one (GSE100243) was performed on Ion Torrent Proton technology. An overview of projects included samples, and additional information is shown in Table 3.
We also included data downloaded from the cancer genome atlas, TCGA-COAD data, which included in total 519 samples, 478 primary tumors, and 41 normal tissue samples.

4.1.2. Data Processing

For all GEO projects, the original raw data fastq files were downloaded from ENA (https://www.ebi.ac.uk/ena/browser/home) (accessed on 30 March 2020). All projects, including TCGA data, were processed in R language (https://www.r-project.org/) (accessed on 30 March 2020).
First the fastq, data were checked using the fastQC tool (Babraham Bioinformatics—FastQC A Quality Control tool for High Throughput Sequence Data). The full index for the reference genome »GRCh38« was first built using the function »buildindex« of the Rsubread package [94]. The fastq files were aligned to the reference GRCh38 genome using the align function of Rsubread package. Additional trimming of the reads was not performed as the Rsubread aligner performs “soft clipping” according to publication [95]. Afterward, mapped sequencing reads were assigned to specified genomic features using the function »featureCounts« of Rsubread package. Annotation was performed on human reference genome GRCh38. The feature counting summary file was checked for each sample using the FastQC tool.

4.1.3. Analysis of Projects Obtained from GEO/TCGA Database

Data from selected GEO projects and data from TCGA were analyzed separately.
For data from GEO projects, samples from each project were merged into one corresponding object using the BiocGenerics package [96]; tissue group information for each sample was obtained from GEO project page or by obtaining the series matrix file from GEO using the GEOquery package [97]. Annotation data for genes and gene length was obtained from a feature counted sample file. Counts for each sample, tissue group info, and annotation data were joined using EdgeR package [98].
TCGA count data were first preprocessed using the TCGAbiolinks package. Afterward, further data processing was performed as for GEO projects.
Count data were filtered by using the edgeR package. After filtration, the first round of quality control was performed on count per million data (cpm) and log2 count per million data (lcpm). Density plots and boxplots were compared for unfiltered and filtered data. A dendrogram was constructed, and distances were calculated using lcpm data with Spearman method. A MDS plot was also constructed from the distances.
Afterward, gene expression distribution was normalized across samples using the method trimmed mean of M values (TMM). A new round of quality control using cpm and lcpm data was performed on the normalized project by density plots, box plots, dendrogram, and the MDS plot. Design of the matrix was performed as paired samples for GEO data and as independent samples for TCGA data. The design matrix was afterward used in the voom normalization step and linear modeling. Before linear modeling, the »voom« function from the Limma package [99] was used for transforming the filtered and normalized count data to logCPM and estimation of the mean-variance relationship, using these estimates to compute appropriate observation-level weights.
The processed data were fitted with a linear model for each gene. For the independent comparisons, contrasts.fit of the Limma package was used to compute contrasts from linear model fit and the previously designed contrasts matrix. The eBayes function of the Limma package was used to compute moderated t-statistics, moderated F-statistic, and log-odds of differential expression from a given linear model fit. Finally, the topTable function of the Limma package was used to extract a table of the top-ranked genes from a linear model fit with a p-value less than 0.05 and an absolute logFC more than 1.5 with the Benjamini Hochberg method of adjusting p-value.

4.2. Pathway Enrichment Analysis of Publicly Available Data

Pathway enrichment analysis was performed by using Database for Annotation, Visualization and Integrated Discovery (DAVID) v6.8 [100]. Entrez gene IDs were uploaded to the service and homo sapiens was selected as the species. We analyzed the GO results for biological process, cellular component, and molecular function data at the following settings: the count cutoff was at 2, the Modified Fisher Exact p-value (EASE) at 0.01, and Bonferroni statistic was chosen at the display level. Pathway results were analyzed for Biocarta, if available, Kyoto Encyclopedia of Genes and Genomes (KEGG) and REACTOME. Settings used in this analysis were the same as with GO results. Results of both analyses were saved to a corresponding excel file with the analyzed DEGs.

4.3. Protein–Protein Interaction Analysis

For construction of the protein–protein interactions (PPI) network, the Search Tool for the Retrieval of Interacting Genes (STRING) database was used (https://string-db.org/) (accessed on 30 March 2020) [101]. PPI network analysis is an important tool for interpretation of molecular mechanisms in the process of carcinogenesis. The settings used in the analyses were a required score at the highest confidence (0.900), a FDR stringency at medium setting (5 percent); a meaning of network edges—confidence; textmining was removed from the active interaction sources; disconnected nodes were not shown in the network; and only query proteins were considered for the interactions. Additionally, the first analysis did not include clustering; afterward, the k-means clustering and Markov cluster algorithm (MCL) clustering methods were applied separately, with the number of clusters set at the default 3. We also performed the analysis with the physical network chosen as the edges indicate that the proteins are part of a physical complex. Lastly, we allowed for the identification of predicted functional partners with the setting of »no more than 5 interactors« on the first shell. All networks were exported as a bitmap image corresponding to the specific DEGs analysis, and the local network clustering analysis from STRING was considered.

4.4. Validation of Selected Potential Candidate Genes

4.4.1. Patient and Tissue Selection

Patients who underwent excision or resection of adenoma, adenoma with early carcinoma, and CRC, from 2015 to 2019, were included in the study. For routine histopathologic examination, tissue samples were fixed in 10% buffered formalin and embedded in paraffin (FFPE). During routine examination, all specimens were evaluated by pathologists according to standard procedures and, after histopathologic examination, pTNM (pathologic tumor node metastasis) classification was assessed on the basis of the depth of invasion and the extent of the primary tumor, the number of lymph nodes with metastases, and the presence of distant metastases. For the purpose of this study, biopsy samples were collected retrospectively from the archives of the Institute of Pathology, Faculty of Medicine, University of Ljubljana. After reevaluation of consecutive cases for each group by a pathologist and initial quality check, representative samples were selected for further study. Samples of normal mucosa obtained from resected CRC specimens were used as control samples. Patients treated by radiotherapy, chemotherapy or biologic drugs prior to surgery were not included in this study. Patients with mucinous carcinomas or signet cell carcinomas were also excluded. Only sporadic CRC cases were included. Tissue samples were grouped as normal mucosa, adenoma, adenoma with early carcinoma, CRC without lymph node metastases (CRC N0), or CRC with lymph node metastases (CRC N+).
The study was conducted according to the guidelines of the Declaration of Helsinki and approved by the National Medical Ethics Committee (Republic of Slovenia, Ministry of Health), approval number 0120-54/2020/4.
Approximately 30% of retrospectively selected cases successfully passed initial quality control, as described below (4.6.2). Our study therefore included 70 biopsy samples from 47 patients with adenoma (n = 11), adenoma with early carcinoma (n = 13), CRC without lymph node metastases (n = 10), and CRC with lymph node metastases (n = 13). There were 15 women and 32 men, aged 73.7 ± 8.4 and 65.7 ± 11.4 years, respectively. As a control group, microscopically normal mucosa from CRC resected specimens was used (n = 23). Characteristics of the included patients are shown in Table 4.

4.4.2. RNA Isolation and Quality Assessment

RNA was obtained from FFPE tissue slides using a microtome (4 × 10 µm-thick slides). RNA was isolated using an AllPrep DNA/RNA FFPE kit (Qiagen, Hilden, Germany) according to the manufacturer’s protocol. Concentration and quality assessment of the isolated RNA was performed using a spectrophotometer ND-1000 or ND-One (Nanodrop, Thermo Fisher Scientific, Waltham, MA, USA) at wavelengths 260 nm and 280 nm. Prior to further analysis, RNA quality was tested using reverse transcription and amplification of GAPDH (Hs_GAPDH_vb.1_SG, 100 bp) by SybrGreen technology. Samples that did not amplify during this initial control step were excluded from further analysis.

4.4.3. Reverse Transcription (RT) and Pre-Amplification

Reverse transcription (RT) of the isolated mRNA was performed using OneTaq®® RT-PCR Kit (New England Biolabs, Ipswich, MA, USA) using a mix of random hexamers and oligo-dT primers according to the manufacturer’s protocol. We used 60 ng of RNA in the total 10 µL RT reaction and 1 µL of random hexamers and incubated for 5 min at 70 °C. Afterward, we added 5 µL of the Reaction mix and 1 µL of Enzyme mix to the reaction and incubated at 25 °C for 5 min, 42 °C for 1 h and 80 °C for 5 min.
Preamplification of the obtained cDNA was performed using the TaqMan® Preamp Master Mix (Thermo Fisher Scientific, Waltham, MA, USA) according to the manufacturer’s instructions. For a 10 µL reaction, we added 5 µL of Pre-Amp Master Mix (2×), 2.5 µL of Pooled TaqMan® Gene Expression probes (Thermo Fisher Scientific, Waltham, MA, USA) (0.2×, diluted in TE buffer), and 2.5 µL of cDNA. Incubation was performed at 95 °C for 10 min, 95 °C for 15 s, and 60 °C for 4 min.

4.4.4. Selection of Primers and Probes

The TaqMan-based approach (Thermo Fisher scientific, Waltham, MA, USA) was used for the quantitative real-time PCR (qPCR) methodology. A predesigned mixture of primers and probes was used for expression analysis of DEGs relative to reference genes (RGs). The genes were selected as described above. Selected probes are shown in Table 5, with reference genes (RGs) presented in bold.

4.4.5. Quantitative Real-Time PCR (qPCR)

Prior to qPCR amplification, efficiencies were determined in triplicate reactions for each probe and for each group of samples. The dilution series included 4-point dilutions ranging from 5-fold to 625-fold. A Rotor Gene Q (Qiagen, Hilden, Germany) machine was used for all qPCR analyses, and all 10 µL testing reactions were performed in duplicate. The cycling protocol was 50 °C for 2 min, 95 °C for 10 min, 40 cycles of 95 °C for 15 s, and 62 °C for 1 min. The reactions included 5.0 µL of the FastStart™ PCR Master mix (Roche Diagnostics, Basel, Switzerland) (2×), 0.5 µL of the TaqMan assay (predesigned mixture of primers and probes) (20×), and 4.5 µL of cDNA (60 ng of RNA reverse transcribed to cDNA and pre-amplified, as explained in Section 4.4.4; the cDNA was diluted 5-fold).
After efficiency correction, the obtained ΔCq (normalized Cq of analyzed mRNAs relative to geometric mean of RGs) were used for analysis of target gene. The fold difference in the expression was calculated against the normal mucosa samples group using the ΔΔCq method [102].

4.4.6. Statistics

Differences in expression were compared between tumor and corresponding normal mucosa using ΔCq and the Willcoxon rank test (nonparametric test for dependent samples). For comparison of relative quantification of mRNAs between independent groups of samples (e.g., adenoma vs. normal mucosa), ΔCq and the Mann–Whitney U test were used (nonparametric test for independent group of samples). ΔΔCq and the Mann–Whitney U test were used for comparison between CRC without and CRC with lymph node metastases. Using the Spearman coefficient, we analyzed whether protein-coding gene expression levels were associated with cancerogenesis. All statistical analyses of experimental data were performed using SPSS version 27 (SPSS Inc., Chicago, IL, USA). Differences in expression between groups were considered significant at p ≤ 0.05.

5. Conclusions

In conclusion, we analyzed publicly available RNA-seq data from normal mucosa, adenomas, and carcinomas of colon from six projects from GEO and TCGA databases for identification of differentially expressed CSC-related genes. We identified six genes associated with CSC in CRC cancerogenesis: ANLN, CDK1, ECT2, PDGFD, TNC, and TNXB. We showed that genes ANLN, CDK1, ECT2, and TNC were associated with adenoma progression to carcinoma, ANLN and PDGFD with development of metastases, while genes ANLN, CDK1, ECT2, and PDGFD were associated with the level of malignancy. Our results provide further evidence for the involvement of the CSC-associated genes in the development and progression of CRC, and several of them are promising candidates for further validation. Future perspectives include further validation on a higher number of samples for additional confirmation of the results and using immunohistochemistry to investigate localized expression of the tested genes to directly confirm these genes as potential biomarkers for CSC in CRC development.

Supplementary Materials

The following supporting information can be downloaded at: https://www.mdpi.com/article/10.3390/ijms232113252/s1.

Author Contributions

Conceptualization, K.U., E.B. and N.Z.; methodology, K.U. and E.B., validation, K.U.; formal analysis, K.U.; data curation, K.U.; writing—original draft preparation, K.U. and E.B., writing—review and editing, E.B. and N.Z.; visualization, K.U.; supervision, E.B. and N.Z. All authors have read and agreed to the published version of the manuscript.

Funding

This research was funded by the Slovenian Research Agency (research core funding no. P3-0054; project funding J3-1754; PhD research funding).

Institutional Review Board Statement

The study was conducted according to the guidelines of the Declaration of Helsinki and approved by the National Medical Ethics Committee (Republic of Slovenia, Ministry of Health), approval number 0120-54/2020/4.

Informed Consent Statement

Patient consent was waived due to the following reason: As stated in the approval document, the study is retrospective, observational, performed on tissue samples that were obtained during routine diagnostic/therapeutic procedures, and consisted of either excision or resection. Therefore, enough tissue was available for routine analysis and research. Moreover, tissue is still available for any additional analysis in the future. Our State Ethical Committee does not require informed consent from patients in such studies. However, the informed consent for the procedure was obtained before the routine procedure. Further need for consent for participation in scientific studies was waived by the National Medical Ethics Committee (approval number 0120-54/2020/7) due to the nature of the study as explained above.

Data Availability Statement

All scripts and ∆∆Cq data are available upon reasonable request from the authors.

Conflicts of Interest

The authors declare no conflict of interest.

References

  1. Blank, A.; Roberts, D.E., 2nd; Dawson, H.; Zlobec, I.; Lugli, A. Tumor heterogeneity in primary colorectal cancer and corresponding metastases. Does the apple fall far from the tree? Front. Med. 2018, 5, 234. [Google Scholar] [CrossRef] [PubMed] [Green Version]
  2. Saiki, Y.; Ishimaru, S.; Mimori, K.; Takatsuno, Y.; Nagahara, M.; Ishii, H.; Yamada, K.; Mori, M. Comprehensive analysis of the clinical significance of inducing pluripotent stemness-related gene expression in colorectal cancer cells. Ann. Surg. Oncol. 2009, 16, 2638–2644. [Google Scholar] [CrossRef] [PubMed]
  3. Dylla, S.J.; Beviglia, L.; Park, I.K.; Chartier, C.; Raval, J.; Ngan, L.; Pickell, K.; Aguilar, J.; Lazetic, S.; Smith-Berdan, S.; et al. Colorectal cancer stem cells are enriched in xenogeneic tumors following chemotherapy. PLoS ONE 2008, 3, e2428. [Google Scholar] [CrossRef]
  4. Urh, K.; Žlajpah, M.; Zidar, N.; Boštjančič, E. Identification and validation of new cancer stem cell-related genes and their regulatory microRNAs in colorectal cancerogenesis. Biomedicines 2021, 9, 179. [Google Scholar] [CrossRef]
  5. Urh, K.; Zidar, N.; Tomažič, A.; Boštjančič, E. Intra-tumor heterogeneity of cancer stem cell-related genes and their potential regulatory microRNAs in metastasizing colorectal carcinoma. Oncol. Rep. 2022, 48, 193. [Google Scholar] [CrossRef] [PubMed]
  6. Kudryavtseva, A.V.; Lipatova, A.V.; Zaretsky, A.R.; Moskalev, A.A.; Fedorova, M.S.; Rasskazova, A.S.; Shibukhova, G.A.; Snezhkina, A.V.; Kaprin, A.D.; Alekseev, B.Y.; et al. Important molecular genetic markers of colorectal cancer. Oncotarget 2016, 7, 53959–53983. [Google Scholar] [CrossRef] [Green Version]
  7. Cao, H.; Xu, E.; Liu, H.; Wan, L.; Lai, M. Epithelial-mesenchymal transition in colorectal cancer metastasis: A system review. Pathol. Res. Pract. 2015, 211, 557–569. [Google Scholar] [CrossRef]
  8. Balch, C.; Ramapuram, J.B.; Tiwari, A.K. The epigenomics of embryonic pathway signaling in colorectal cancer. Front. Pharmacol. 2017, 8, 267. [Google Scholar] [CrossRef] [Green Version]
  9. Sepulveda, A.R.; Del Portillo, A.J. Molecular basis of diseases of the gastrointestinal tract. In Molecular Pathology, 2nd ed.; Coleman, W.B., Tsongalis, G.J., Eds.; Elsevier: Amsterdam, The Netherlands, 2018; pp. 387–415. [Google Scholar] [CrossRef]
  10. Jarvinen, H.J.; Mecklin, J.P.; Sistonen, P. Screening reduces colorectal cancer rate in families with hereditary nonpolyposis colorectal cancer. Gastroenterology 1995, 108, 1405–1411. [Google Scholar] [CrossRef]
  11. Brenner, H.; Jansen, L.; Ulrich, A.; Chang-Claude, J.; Hoffmeister, M. Survival of patients with symptom- and screening-detected colorectal cancer. Oncotarget 2016, 7, 44695–44704. [Google Scholar] [CrossRef] [Green Version]
  12. Fischer, J.; Walker, L.C.; Robinson, B.A.; Frizelle, F.A.; Church, J.M.; Eglinton, T.W. Clinical implications of the genetics of sporadic colorectal cancer. ANZ J. Surg. 2019, 89, 1224–1229. [Google Scholar] [CrossRef] [PubMed]
  13. Giampieri, R.; Scartozzi, M.; Loretelli, C.; Piva, F.; Mandolesi, A.; Lezoche, G.; Del Prete, M.; Bittoni, A.; Faloppi, L.; Bianconi, M.; et al. Cancer stem cell gene profile as predictor of relapse in high risk stage II and stage III, radically resected colon cancer patients. PLoS ONE 2013, 8, e72843. [Google Scholar] [CrossRef] [PubMed] [Green Version]
  14. Merlos-Suarez, A.; Barriga, F.M.; Jung, P.; Iglesias, M.; Cespedes, M.V.; Rossell, D.; Sevillano, M.; Hernando-Momblona, X.; da Silva-Diz, V.; Munoz, P.; et al. The intestinal stem cell signature identifies colorectal cancer stem cells and predicts disease relapse. Cell Stem Cell 2011, 8, 511–524. [Google Scholar] [CrossRef] [Green Version]
  15. Colak, S.; Zimberlin, C.D.; Fessler, E.; Hogdal, L.; Prasetyanti, P.R.; Grandela, C.M.; Letai, A.; Medema, J.P. Decreased mitochondrial priming determines chemoresistance of colon cancer stem cells. Cell Death Differ. 2014, 21, 1170–1177. [Google Scholar] [CrossRef] [PubMed] [Green Version]
  16. Lombardo, Y.; Scopelliti, A.; Cammareri, P.; Todaro, M.; Iovino, F.; Ricci-Vitiani, L.; Gulotta, G.; Dieli, F.; de Maria, R.; Stassi, G. Bone morphogenetic protein 4 induces differentiation of colorectal cancer stem cells and increases their response to chemotherapy in mice. Gastroenterology 2011, 140, 297–309. [Google Scholar] [CrossRef]
  17. Lotti, F.; Jarrar, A.M.; Pai, R.K.; Hitomi, M.; Lathia, J.; Mace, A.; Gantt, G.A., Jr.; Sukhdeo, K.; DeVecchio, J.; Vasanji, A.; et al. Chemotherapy activates cancer-associated fibroblasts to maintain colorectal cancer-initiating cells by IL-17A. J. Exp. Med. 2013, 210, 2851–2872. [Google Scholar] [CrossRef] [Green Version]
  18. Zeuner, A.; Todaro, M.; Stassi, G.; De Maria, R. Colorectal cancer stem cells: From the crypt to the clinic. Cell Stem Cell 2014, 15, 692–705. [Google Scholar] [CrossRef] [Green Version]
  19. Safiyeva, A.; Bayramov, N.; Avunduk, M. The role of “Prominin-1” marker in adenomatous colorectal polyps. Pol. Przegl. Chir. 2021, 94, 19–26. [Google Scholar] [CrossRef]
  20. Sahin, I.; Gundogdu, B.; Ceylan, A.C.; Erdem, H.B.; Tatar, A. High expression of stem cell-related genes in polyps with villous features and high-grade dysplasia support malignant phenotype and colorectal carcinogenesis. Asian Pac. J. Cancer Prev. 2021, 22, 2429–2435. [Google Scholar] [CrossRef]
  21. Cui, G.; Li, G.; Pang, Z.; Florholmen, J.; Goll, R. The presentation and regulation of the IL-8 network in the epithelial cancer stem-like cell niche in patients with colorectal cancer. Biomed. Pharmacother. 2022, 152, 113252. [Google Scholar] [CrossRef]
  22. Becker, W.R.; Nevins, S.A.; Chen, D.C.; Chiu, R.; Horning, A.M.; Guha, T.K.; Laquindanum, R.; Mills, M.; Chaib, H.; Ladabaum, U.; et al. Single-cell analyses define a continuum of cell state and composition changes in the malignant transformation of polyps to colorectal cancer. Nat. Genet. 2022, 54, 985–995. [Google Scholar] [CrossRef] [PubMed]
  23. Chen, B.; Scurrah, C.R.; McKinley, E.T.; Simmons, A.J.; Ramirez-Solano, M.A.; Zhu, X.; Markham, N.O.; Heiser, C.N.; Vega, P.N.; Rolong, A.; et al. Differential pre-malignant programs and microenvironment chart distinct paths to malignancy in human colorectal polyps. Cell 2021, 184, 6262–6280.e26. [Google Scholar] [CrossRef] [PubMed]
  24. Koehler, A.; Bataille, F.; Schmid, C.; Ruemmele, P.; Waldeck, A.; Blaszyk, H.; Hartmann, A.; Hofstaedter, F.; Dietmaier, W. Gene expression profiling of colorectal cancer and metastases divides tumours according to their clinicopathological stage. J. Pathol. 2004, 204, 65–74. [Google Scholar] [CrossRef] [PubMed]
  25. Lee, J.R.; Kwon, C.H.; Choi, Y.; Park, H.J.; Kim, H.S.; Jo, H.J.; Oh, N.; Park, D.Y. Transcriptome analysis of paired primary colorectal carcinoma and liver metastases reveals fusion transcripts and similar gene expression profiles in primary carcinoma and liver metastases. BMC Cancer 2016, 16, 539. [Google Scholar] [CrossRef] [Green Version]
  26. Hauptman, N.; Boštjančič, E.; Žlajpah, M.; Ranković, B.; Zidar, N. Bioinformatics analysis reveals most prominent gene candidates to distinguish colorectal adenoma from adenocarcinoma. Biomed. Res. Int. 2018, 2018, 9416515. [Google Scholar] [CrossRef] [Green Version]
  27. Uhan, S.; Zidar, N.; Tomazič, A.; Hauptman, N. Hypermethylated promoters of genes UNC5D and KCNA1 as potential novel diagnostic biomarkers in colorectal cancer. Epigenomics 2020, 12, 1677–1688. [Google Scholar] [CrossRef]
  28. Hrašovec, S.; Hauptman, N.; Glavač, D.; Jelenc, F.; Ravnik-Glavač, M. TMEM25 is a candidate biomarker methylated and down-regulated in colorectal cancer. Dis. Markers 2013, 34, 93–104. [Google Scholar] [CrossRef]
  29. Szigeti, K.A.; Kalmár, A.; Galamb, O.; Valcz, G.; Barták, B.K.; Nagy, Z.B.; Zsigrai, S.; Felletár, I.; VPatai, Á.; Micsik, T.; et al. Global DNA hypomethylation of colorectal tumours detected in tissue and liquid biopsies may be related to decreased methyl-donor content. BMC Cancer 2022, 22, 605. [Google Scholar] [CrossRef]
  30. Muller, D.; Gyorffy, B. DNA methylation-based diagnostic, prognostic, and predictive biomarkers in colorectal cancer. Biochim. Biophys. Acta Rev. Cancer 2022, 1877, 188722. [Google Scholar] [CrossRef]
  31. Mehrgou, A.; Teimourian, S. Update of gene expression/methylation and miRNA profiling in colorectal cancer; application in diagnosis, prognosis, and targeted therapy. PLoS ONE 2022, 17, e0265527. [Google Scholar] [CrossRef]
  32. Caruso, F.P.; D’Andrea, M.R.; Coppola, L.; Landriscina, M.; Condelli, V.; Cerulo, L.; Giordano, G.; Porras, A.; Pancione, M. Lymphocyte antigen 6G6D-mediated modulation through p38alpha MAPK and DNA methylation in colorectal cancer. Cancer Cell Int. 2022, 22, 253. [Google Scholar] [CrossRef] [PubMed]
  33. Yu, J.; Yang, K.; Zheng, J.; Sun, X.; Zhao, W. Establishment of a novel prognostic signature based on an identified expression profile of integrin superfamily to predict overall survival of patients with colorectal adenocarcinoma. Gene 2022, 808, 145990. [Google Scholar] [CrossRef] [PubMed]
  34. Herreros-Villanueva, M.; Duran-Sanchon, S.; Martin, A.C.; Perez-Palacios, R.; Vila-Navarro, E.; Marcuello, M.; Diaz-Centeno, M.; Cubiella, J.; Diez, M.S.; Bujanda, L.; et al. Plasma microRNA signature validation for early detection of colorectal cancer. Clin. Transl. Gastroenterol. 2019, 10, e00003. [Google Scholar] [CrossRef] [PubMed]
  35. Islam Khan, M.Z.; Tam, S.Y.; Azam, Z.; Law, H.K.W. Proteomic profiling of metabolic proteins as potential biomarkers of radioresponsiveness for colorectal cancer. J. Proteom. 2022, 262, 104600. [Google Scholar] [CrossRef] [PubMed]
  36. Shi, S.; Zheng, H.C.; Zhang, Z.G. Roles of Fascin mRNA expression in colorectal cancer: Meta-analysis and bioinformatics analysis. Mol. Clin. Oncol. 2020, 13, 119–128. [Google Scholar] [CrossRef]
  37. Zhou, J.; Xie, Z.; Cui, P.; Su, Q.; Zhang, Y.; Luo, L.; Li, Z.; Ye, L.; Liang, H.; Huang, J. SLC1A1, SLC16A9, and CNTN3 are potential biomarkers for the occurrence of colorectal cancer. Biomed. Res. Int. 2020, 2020, 1204605. [Google Scholar] [CrossRef] [PubMed]
  38. Komor, M.A.; de Wit, M.; van den Berg, J.; Martens de Kemp, S.R.; Delis-van Diemen, P.M.; Bolijn, A.S.; Tijssen, M.; Schelfhorst, T.; Piersma, S.R.; Chiasserini, D.; et al. Molecular characterization of colorectal adenomas reveals POFUT1 as a candidate driver of tumor progression. Int. J. Cancer 2020, 146, 1979–1992. [Google Scholar] [CrossRef]
  39. Fan, Y.; Guo, L.; Zheng, H.; Ji, C.; Wang, W.; Sun, H. BMP-9 is a novel marker for colorectal tumorigenesis undergoing the normal mucosa-adenoma-adenocarcinoma sequence and is associated with colorectal cancer prognosis. Oncol. Lett. 2020, 19, 271–282. [Google Scholar] [CrossRef] [Green Version]
  40. An, N.; Zhao, C.; Yu, Z.; Yang, X. Identification of prognostic genes in colorectal cancer through transcription profiling of multi-stage carcinogenesis. Oncol. Lett. 2019, 17, 432–441. [Google Scholar] [CrossRef]
  41. Chen, J.; Wang, Z.; Shen, X.; Cui, X.; Guo, Y. Identification of novel biomarkers and small molecule drugs in human colorectal cancer by microarray and bioinformatics analysis. Mol. Genet Genomic. Med. 2019, 7, e00713. [Google Scholar] [CrossRef] [Green Version]
  42. Zhang, Y.; Wu, W.; Qu, H. Integrated analysis of the gene expression changes during colorectal cancer progression by bioinformatic methods. J. Comput. Biol. 2019, 26, 1168–1176. [Google Scholar] [CrossRef] [PubMed]
  43. Guan, Q.; Zeng, Q.; Jiang, W.; Xie, J.; Cheng, J.; Yan, H.; He, J.; Xu, Y.; Guan, G.; Guo, Z.; et al. A qualitative transcriptional signature for the risk assessment of precancerous colorectal lesions. Front. Genet. 2020, 11, 573787. [Google Scholar] [CrossRef] [PubMed]
  44. He, Y.; Pan, Z.; Shi, Q.; Zhang, X.; Shen, W.; Huo, L.; Guo, H.; Tang, C.; Ling, Y. Bioinformatics profiling and experimental validation of 4 differentially-expressed LIM genes in the course of colorectal-adenoma-carcinoma. Med. Sci. Monit. 2022, 28, e937081. [Google Scholar] [CrossRef] [PubMed]
  45. Xia, P.; Xu, X.Y. PI3K/Akt/mTOR signaling pathway in cancer stem cells: From basic research to clinical application. Am. J. Cancer Res. 2015, 5, 1602–1609. [Google Scholar]
  46. Yoon, C.; Lu, J.; Yi, B.C.; Chang, K.K.; Simon, M.C.; Ryeom, S.; Yoon, S.S. PI3K/Akt pathway and Nanog maintain cancer stem cells in sarcomas. Oncogenesis 2021, 10, 12. [Google Scholar] [CrossRef]
  47. Karami Fath, M.; Ebrahimi, M.; Nourbakhsh, E.; Zia Hazara, A.; Mirzaei, A.; Shafieyari, S.; Salehi, A.; Hoseinzadeh, M.; Payandeh, Z.; Barati, G. PI3K/Akt/mTOR signaling pathway in cancer stem cells. Pathol. Res. Pract. 2022, 237, 154010. [Google Scholar] [CrossRef]
  48. Choi, J.; Pacheco, C.M.; Mosbergen, R.; Korn, O.; Chen, T.; Nagpal, I.; Englart, S.; Angel, P.W.; Wells, C.A. Stemformatics: Visualize and download curated stem cell data. Nucleic Acids Res. 2019, 47, D841–D846. [Google Scholar] [CrossRef] [Green Version]
  49. Ma, Y.S.; Huang, T.; Zhong, X.M.; Zhang, H.W.; Cong, X.L.; Xu, H.; Lu, G.X.; Yu, F.; Xue, S.B.; Lv, Z.W.; et al. Proteogenomic characterization and comprehensive integrative genomic analysis of human colorectal cancer liver metastasis. Mol. Cancer 2018, 17, 139. [Google Scholar] [CrossRef] [Green Version]
  50. Li, M.; Zhao, L.M.; Li, S.L.; Li, J.; Gao, B.; Wang, F.F.; Wang, S.P.; Hu, X.H.; Cao, J.; Wang, G.Y. Differentially expressed lncRNAs and mRNAs identified by NGS analysis in colorectal cancer patients. Cancer Med. 2018, 7, 4650–4664. [Google Scholar] [CrossRef] [Green Version]
  51. Kanth, P.; Bronner, M.P.; Boucher, K.M.; Burt, R.W.; Neklason, D.W.; Hagedorn, C.H.; Delker, D.A. Gene Signature in sessile serrated polyps identifies colon cancer subtype. Cancer Prev. Res. 2016, 9, 456–465. [Google Scholar] [CrossRef]
  52. Wu, Z.; Liu, Z.; Ge, W.; Shou, J.; You, L.; Pan, H.; Han, W. Analysis of potential genes and pathways associated with the colorectal normal mucosa-adenoma-carcinoma sequence. Cancer Med. 2018, 7, 2555–2566. [Google Scholar] [CrossRef] [PubMed]
  53. Druliner, B.R.; Wang, P.; Bae, T.; Baheti, S.; Slettedahl, S.; Mahoney, D.; Vasmatzis, N.; Xu, H.; Kim, M.; Bockol, M.; et al. Molecular characterization of colorectal adenomas with and without malignancy reveals distinguishing genome, transcriptome and methylome alterations. Sci. Rep. 2018, 8, 3161. [Google Scholar] [CrossRef] [PubMed] [Green Version]
  54. Žlajpah, M.; Hauptman, N.; Boštjančič, E.; Zidar, N. Differential expression of extracellular matrixrelated genes DCN, EPHA4, FN1, SPARC, SPON2 and SPP1 in colorectal carcinogenesis. Oncol. Rep. 2019, 42, 1539–1548. [Google Scholar] [CrossRef] [PubMed]
  55. Kesh, K.; Gupta, V.K.; Durden, B.; Garrido, V.; Mateo-Victoriano, B.; Lavania, S.P.; Banerjee, S. Therapy resistance, cancer stem cells and ECM in cancer: The matrix reloaded. Cancers 2020, 12, 3067. [Google Scholar] [CrossRef]
  56. Zhang, Y.; Zhang, X.; Wang, J.; Shen, Y.; Tang, X.; Yu, F.; Wang, R. Expression and function of PPARs in cancer stem cells. Curr. Stem. Cell Res. Ther. 2016, 11, 226–234. [Google Scholar] [CrossRef]
  57. Yang, Z.; Zhang, C.; Feng, Y.; Qi, W.; Cui, Y.; Xuan, Y. Tenascin-C is involved in promotion of cancer stemness via the Akt/HIF1a axis in esophageal squamous cell carcinoma. Exp. Mol. Pathol. 2019, 109, 104239. [Google Scholar] [CrossRef]
  58. Efremov, Y.R.; Proskurina, A.S.; Potter, E.A.; Dolgova, E.V.; Efremova, O.V.; Taranov, O.S.; Ostanin, A.A.; Chernykh, E.R.; Kolchanov, N.A.; Bogachev, S.S. Cancer Stem Cells: Emergent Nature of Tumor Emergency. Front. Genet. 2018, 9, 544. [Google Scholar] [CrossRef]
  59. Liot, S.; Aubert, A.; Hervieu, V.; Kholti, N.E.; Schalkwijk, J.; Verrier, B.; Valcourt, U.; Lambert, E. Loss of Tenascin-X expression during tumor progression: A new pan-cancer marker. Matrix Biol. Plus 2020, 6-7, 100021. [Google Scholar] [CrossRef]
  60. Devarajan, E.; Song, Y.H.; Krishnappa, S.; Alt, E. Epithelial-mesenchymal transition in breast cancer lines is mediated through PDGF-D released by tissue-resident stem cells. Int. J. Cancer 2012, 131, 1023–1031. [Google Scholar] [CrossRef]
  61. Huang, F.; Wang, M.; Yang, T.; Cai, J.; Zhang, Q.; Sun, Z.; Wu, X.; Zhang, X.; Zhu, W.; Qian, H.; et al. Gastric cancer-derived MSC-secreted PDGF-DD promotes gastric cancer progression. J. Cancer Res. Clin. Oncol. 2014, 140, 1835–1848. [Google Scholar] [CrossRef]
  62. Huang, Z.; Shen, G.; Gao, J. CDK1 promotes the stemness of lung cancer cells through interacting with Sox2. Clin. Transl. Oncol. 2021, 23, 1743–1751. [Google Scholar] [CrossRef]
  63. Miller, T.J.; McCoy, M.J.; Hemmings, C.; Iacopetta, B.; Platell, C.F. Expression of PD-L1 and SOX2 during rectal tumourigenesis: Potential mechanisms for immune escape and tumour cell invasion. Oncol. Lett. 2018, 16, 5761–5768. [Google Scholar] [CrossRef] [PubMed] [Green Version]
  64. Talebi, A.; Kianersi, K.; Beiraghdar, M. Comparison of gene expression of SOX2 and OCT4 in normal tissue, polyps, and colon adenocarcinoma using immunohistochemical staining. Adv. Biomed. Res. 2015, 4, 234. [Google Scholar] [CrossRef]
  65. Neganova, I.; Tilgner, K.; Buskin, A.; Paraskevopoulou, I.; Atkinson, S.P.; Peberdy, D.; Passos, J.F.; Lako, M. CDK1 plays an important role in the maintenance of pluripotency and genomic stability in human pluripotent stem cells. Cell Death Dis. 2014, 5, e1508. [Google Scholar] [CrossRef] [PubMed] [Green Version]
  66. Wang, D.; Naydenov, N.G.; Dozmorov, M.G.; Koblinski, J.E.; Ivanov, A.I. Anillin regulates breast cancer cell migration, growth, and metastasis by non-canonical mechanisms involving control of cell stemness and differentiation. Breast Cancer Res. 2020, 22, 3. [Google Scholar] [CrossRef] [PubMed] [Green Version]
  67. Maryam, A.; Chin, Y.R. ANLN enhances triple-negative breast cancer stemness through TWIST1 and BMP2 and promotes its spheroid growth. Front Mol. Biosci. 2021, 8, 700973. [Google Scholar] [CrossRef]
  68. Gong, D.Y.; Chen, X.; Yang, T.L.; Wang, Y.; Guo, Y.; Zeng, J.H.; Chen, S.Z. Upregulation of ECT2 is associated with transcriptional program of cancer stem cells and predicts poor clinical outcome in gastric cancer. Oncol. Lett. 2020, 20, 54. [Google Scholar] [CrossRef]
  69. Egilmez, R.; Elagoz, S.; Kanik, E.A. CDK1/P34CDC2 and P21WAF expression in colorectal adenomas and carcinomas. J. Exp. Clin. Cancer Res. 2001, 20, 549–552. [Google Scholar]
  70. Cook, D.R.; Kang, M.; Martin, T.D.; Galanko, J.A.; Loeza, G.H.; Trembath, D.G.; Justilien, V.; Pickering, K.A.; Vincent, D.F.; Jarosch, A.; et al. Aberrant expression and subcellular localization of ECT2 drives colorectal cancer progression and growth. Cancer Res. 2022, 82, 90–104. [Google Scholar] [CrossRef]
  71. Hanamura, N.; Yoshida, T.; Matsumoto, E.; Kawarada, Y.; Sakakura, T. Expression of fibronectin and tenascin-C mRNA by myofibroblasts, vascular cells and epithelial cells in human colon adenomas and carcinomas. Int. J. Cancer 1997, 73, 10–15. [Google Scholar] [CrossRef]
  72. Sis, B.; Sagol, O.; Kupelioglu, A.; Sokmen, S.; Terzi, C.; Fuzun, M.; Ozer, E.; Bishop, P. Prognostic significance of matrix metalloproteinase-2, cathepsin D, and tenascin-C expression in colorectal carcinoma. Pathol. Res. Pract. 2004, 200, 379–387. [Google Scholar] [CrossRef] [PubMed]
  73. Satow, R.; Inagaki, S.; Kato, C.; Shimozawa, M.; Fukami, K. Identification of zinc finger protein of the cerebellum 5 as a survival factor of prostate and colorectal cancer cells. Cancer Sci. 2017, 108, 2405–2412. [Google Scholar] [CrossRef] [PubMed] [Green Version]
  74. Jiang, B.; Chen, J.; Yuan, W.; Ji, J.; Liu, Z.; Wu, L.; Tang, Q.; Shu, X. Platelet-derived growth factor-D promotes colorectal cancer cell migration, invasion and proliferation by regulating Notch1 and matrix metalloproteinase-9. Oncol. Lett. 2018, 15, 1573–1579. [Google Scholar] [CrossRef] [Green Version]
  75. Wang, G.; Shen, W.; Cui, L.; Chen, W.; Hu, X.; Fu, J. Overexpression of Anillin (ANLN) is correlated with colorectal cancer progression and poor prognosis. Cancer Biomark. 2016, 16, 459–465. [Google Scholar] [CrossRef] [PubMed]
  76. Liu, Y.; Cao, P.; Cao, F.; Wang, S.; He, Y.; Xu, Y.; Wang, Y. ANLN, Regulated by SP2, promotes colorectal carcinoma cell proliferation via PI3K/AKT and MAPK Signaling Pathway. J. Invest. Surg. 2022, 35, 268–277. [Google Scholar] [CrossRef] [PubMed]
  77. Sung, W.W.; Lin, Y.M.; Wu, P.R.; Yen, H.H.; Lai, H.W.; Su, T.C.; Huang, R.H.; Wen, C.K.; Chen, C.Y.; Chen, C.J.; et al. High nuclear/cytoplasmic ratio of CDK1 expression predicts poor prognosis in colorectal cancer patients. BMC Cancer 2014, 14, 951. [Google Scholar] [CrossRef] [Green Version]
  78. Zhang, P.; Kawakami, H.; Liu, W.; Zeng, X.; Strebhardt, K.; Tao, K.; Huang, S.; Sinicrope, F.A. Targeting CDK1 and MEK/ERK overcomes apoptotic resistance in BRAF-mutant human colorectal cancer. Mol. Cancer Res. 2018, 16, 378–389. [Google Scholar] [CrossRef] [Green Version]
  79. Li, Y.; Cai, X.; Chen, B.; Gu, H.; Liu, C. Overexpression of epithelial cell transforming 2 protein in colorectal carcinoma predicts a poor prognosis. Exp. Ther. Med. 2017, 14, 4862–4868. [Google Scholar] [CrossRef] [Green Version]
  80. Luo, Y.; Qin, S.L.; Mu, Y.F.; Wang, Z.S.; Zhong, M.; Bian, Z.Q. Elevated expression of ECT2 predicts unfavorable prognosis in patients with colorectal cancer. Biomed. Pharmacother. 2015, 73, 135–139. [Google Scholar] [CrossRef]
  81. Koh, H.M.; Jang, B.G.; Hyun, C.L.; Kim, Y.S.; Hyun, J.W.; Chang, W.Y.; Maeng, Y.H. Aurora kinase a is a prognostic marker in colorectal adenocarcinoma. J. Pathol. Transl. Med. 2017, 51, 32–39. [Google Scholar] [CrossRef] [Green Version]
  82. Shan, B.; Zhao, R.; Zhou, J.; Zhang, M.; Qi, X.; Wang, T.; Gong, J.; Wu, Y.; Zhu, Y.; Yang, W.; et al. AURKA increase the chemosensitivity of colon cancer cells to oxaliplatin by inhibiting the TP53-mediated dna damage response genes. Biomed. Res. Int. 2020, 2020, 8916729. [Google Scholar] [CrossRef] [PubMed]
  83. Goos, J.A.; Coupe, V.M.; Diosdado, B.; Delis-Van Diemen, P.M.; Karga, C.; Belien, J.A.; Carvalho, B.; van den Tol, M.P.; Verheul, H.M.; Geldof, A.A.; et al. Aurora kinase A (AURKA) expression in colorectal cancer liver metastasis is associated with poor prognosis. Br. J. Cancer 2013, 109, 2445–2452. [Google Scholar] [CrossRef] [PubMed] [Green Version]
  84. Chen, C.; Song, G.; Xiang, J.; Zhang, H.; Zhao, S.; Zhan, Y. AURKA promotes cancer metastasis by regulating epithelial-mesenchymal transition and cancer stem cell properties in hepatocellular carcinoma. Biochem. Biophys. Res. Commun. 2017, 486, 514–520. [Google Scholar] [CrossRef] [PubMed]
  85. Zheng, F.; Yue, C.; Li, G.; He, B.; Cheng, W.; Wang, X.; Yan, M.; Long, Z.; Qiu, W.; Yuan, Z.; et al. Nuclear AURKA acquires kinase-independent transactivating function to enhance breast cancer stem cell phenotype. Nat. Commun. 2016, 7, 10180. [Google Scholar] [CrossRef] [PubMed] [Green Version]
  86. Wang, X.K.; Wang, Q.Q.; Huang, J.L.; Zhang, L.B.; Zhou, X.; Liu, J.Q.; Chen, Z.J.; Liao, X.W.; Huang, R.; Yang, C.K.; et al. Novel candidate biomarkers of origin recognition complex 1, 5 and 6 for survival surveillance in patients with hepatocellular carcinoma. J. Cancer 2020, 11, 1869–1882. [Google Scholar] [CrossRef] [Green Version]
  87. Kim, S.H.; Ho, J.N.; Jin, H.; Lee, S.C.; Lee, S.E.; Hong, S.K.; Lee, J.W.; Lee, E.S.; Byun, S.S. Upregulated expression of BCL2, MCM7, and CCNE1 indicate cisplatin-resistance in the set of two human bladder cancer cell lines: T24 cisplatin sensitive and T24R2 cisplatin resistant bladder cancer cell lines. Investig. Clin. Urol. 2016, 57, 63–72. [Google Scholar] [CrossRef]
  88. Shibata, E.; Dutta, A. A human cancer cell line initiates DNA replication normally in the absence of ORC5 and ORC2 proteins. J. Biol. Chem. 2020, 295, 16949–16959. [Google Scholar] [CrossRef]
  89. Song, S.; Wang, Y.; Liu, P. DNA replication licensing factors: Novel targets for cancer therapy via inhibiting the stemness of cancer cells. Int. J. Biol. Sci. 2022, 18, 1211–1219. [Google Scholar] [CrossRef]
  90. Shi, Y.; Ge, C.; Fang, D.; Wei, W.; Li, L.; Wei, Q.; Yu, H. NCAPG facilitates colorectal cancer cell proliferation, migration, invasion and epithelial-mesenchymal transition by activating the Wnt/beta-catenin signaling pathway. Cancer Cell Int. 2022, 22, 119. [Google Scholar] [CrossRef]
  91. Li, P.; Wen, J.; Ren, X.; Zhou, Y.; Xue, Y.; Yan, Z.; Li, S.; Tian, H.; Tang, X.G.; Zhang, G.J. MicroRNA-23b-3p targets non-SMC condensing I complex subunit G to promote proliferation and inhibit apoptosis of colorectal cancer cells via regulation of the PI3K/AKT signaling pathway. Oncol. Lett. 2021, 22, 812. [Google Scholar] [CrossRef]
  92. Sanz-Pamplona, R.; Berenguer, A.; Cordero, D.; Mollevi, D.G.; Crous-Bou, M.; Sole, X.; Pare-Brunet, L.; Guino, E.; Salazar, R.; Santos, C.; et al. Aberrant gene expression in mucosa adjacent to tumor reveals a molecular crosstalk in colon cancer. Mol. Cancer 2014, 13, 46. [Google Scholar] [CrossRef] [PubMed]
  93. Polley, A.C.; Mulholland, F.; Pin, C.; Williams, E.A.; Bradburn, D.M.; Mills, S.J.; Mathers, J.C.; Johnson, I.T. Proteomic analysis reveals field-wide changes in protein expression in the morphologically normal mucosa of patients with colorectal neoplasia. Cancer Res. 2006, 66, 6553–6562. [Google Scholar] [CrossRef] [PubMed] [Green Version]
  94. Liao, Y.; Smyth, G.K.; Shi, W. The R package Rsubread is easier, faster, cheaper and better for alignment and quantification of RNA sequencing reads. Nucleic Acids Res. 2019, 47, e47. [Google Scholar] [CrossRef] [PubMed] [Green Version]
  95. Liao, Y.; Shi, W. Read trimming is not required for mapping and quantification of RNA-seq reads at the gene level. NAR Genom. Bioinform. 2020, 2, lqaa068. [Google Scholar] [CrossRef] [PubMed]
  96. Huber, W.; Carey, V.J.; Gentleman, R.; Anders, S.; Carlson, M.; Carvalho, B.S.; Bravo, H.C.; Davis, S.; Gatto, L.; Girke, T.; et al. Orchestrating high-throughput genomic analysis with Bioconductor. Nat. Methods 2015, 12, 115–121. [Google Scholar] [CrossRef] [PubMed]
  97. Davis, S.; Meltzer, P.S. GEOquery: A bridge between the Gene Expression Omnibus (GEO) and BioConductor. Bioinformatics 2007, 23, 1846–1847. [Google Scholar] [CrossRef] [Green Version]
  98. McCarthy, D.J.; Chen, Y.; Smyth, G.K. Differential expression analysis of multifactor RNA-Seq experiments with respect to biological variation. Nucleic Acids Res. 2012, 40, 4288–4297. [Google Scholar] [CrossRef] [Green Version]
  99. Ritchie, M.E.; Phipson, B.; Wu, D.; Hu, Y.; Law, C.W.; Shi, W.; Smyth, G.K. limma powers differential expression analyses for RNA-sequencing and microarray studies. Nucleic Acids Res. 2015, 43, e47. [Google Scholar] [CrossRef]
  100. Huang da, W.; Sherman, B.T.; Lempicki, R.A. Systematic and integrative analysis of large gene lists using DAVID bioinformatics resources. Nat. Protoc. 2009, 4, 44–57. [Google Scholar] [CrossRef]
  101. Szklarczyk, D.; Gable, A.L.; Lyon, D.; Junge, A.; Wyder, S.; Huerta-Cepas, J.; Simonovic, M.; Doncheva, N.T.; Morris, J.H.; Bork, P.; et al. STRING v11: Protein-protein association networks with increased coverage, supporting functional discovery in genome-wide experimental datasets. Nucleic Acids Res. 2019, 47, D607–D613. [Google Scholar] [CrossRef] [Green Version]
  102. Latham, G.J. Normalization of microRNA quantitative RT-PCR data in reduced scale experimental designs. Methods Mol. Biol. 2010, 667, 19–31. [Google Scholar] [CrossRef] [PubMed]
Figure 1. Venn diagrams of overlapping differentially expressed genes: (a) overlap between projects GSE50760 (blue color), GSE104836 (green color), and GSE100243 (red color); (b) overlap between project GSE50760 (green color) and GSE104836 (violet color). Legend: GSE: gene expression omnibus series.
Ijms 23 13252 g001
Figure 2. Heatmap of top 100 DEGs between normal tissue and carcinomas. Legend: GEO, gene expression omnibus; GSE, gene expression omnibus series; group N, normal tissue; group C, carcinoma tissue; gene names are shown on the right side of the heatmap; downregulation is associated with blue color, no difference in expression is associated with white color, and upregulation is associated with red color.
Ijms 23 13252 g002
Figure 3. Heatmap of top 100 DEGs between adenomas and carcinomas. Legend: GEO, gene expression omnibus; GSE, gene expression omnibus series; group A, adenoma; group C, carcinoma tissue; gene names are shown on the right side of the heatmap; downregulation is associated with blue color, no difference in expression is associated with white color, and upregulation is associated with red color.
Ijms 23 13252 g003
Figure 4. Protein interaction network: (a) full protein–protein interaction network; (b) physical protein–protein interaction network. Legend: nodes are associated with proteins; edges are associated with protein–protein interactions.
Ijms 23 13252 g004
Figure 5. Top 100 DEGs heatmap of expression between the primary tumor and normal samples. Legend: group Primary Tumor, carcinoma; group Solid Tissue Normal, normal tissue; gene names, where available, otherwise Ensembl Gene identificators are shown on the right side of the heatmap; downregulation is associated with blue color, no difference in expression is associated with white color, and upregulation is associated with red color.
Ijms 23 13252 g005
Figure 6. Workflow of identification of differentially expressed genes in the bioinformatics analysis. Legend: N, normal colon tissue; A, adenomas; CRC, colorectal cancer; DEGs, differentially expressed genes; TCGA, the cancer genome atlas; R, R programming language; R studio, R studio programme; DAVID, The Database for Annotation, Visualization and Integrated Discovery; STRING; STRING database for protein–protein interaction analysis.
Ijms 23 13252 g006
Figure 7. Expression of six genes (TNC, TNXB, PDGFD, CDK1, ANLN, ECT2) in colorectal cancerogenesis: (a) ∆Cq of six genes in normal mucosa, adenoma, and adenoma with early carcinoma; (b) ∆Cq of six genes in colorectal cancer without lymph node metastases (CRC N0) compared to corresponding normal mucosa; (c) ∆Cq of six genes in colorectal cancer with lymph node metastases (CRC N+) compared to corresponding normal mucosa; (d) ∆∆Cq of six genes in colorectal cancer with (CRC N+) compared to those without lymph node metastases (CRC N0). Legend: x, mean; ◦, outlier; *, p ≤ 0.05; **, p ≤ 0.01; ***, p ≤ 0.001.
Ijms 23 13252 g007
Table 1. Results of identification of differentially expressed genes (DEGs) on individual projects, including project number, comparison, number of DEGs, and additional data.
Project NumberComparisonNumber of DEGsAdditional Data
GSE728207 adenomas and corresponding normal tissue//
GSE769878 adenomas and corresponding normal tissue3 *Supplementary File S1, table GSE76987
GSE10483610 carcinomas and corresponding normal tissue1544Supplementary File S1, table GSE104836
GSE929143 carcinomas and corresponding normal tissue//
GSE1002436 carcinomas and corresponding normal tissue2470Supplementary File S1, table GSE100243
GSE5076018 carcinomas and corresponding normal tissue1766Supplementary File S1, table GSE50760
Legend: * the procedure for identification of DEGs in this project resulted in 3 DEGs at logarithm of base 2 of the fold change value (logFC) > 1.5 and p < 0.05, with “no adjustment” setting used in the toptable function for comparing paired normal tissue and adenomas. With standard settings, no DEGs were identified.
Table 2. All statistical comparisons for the investigated genes.
TNCNormal MucosaAdenomaAdenoma with Early CarcinomaCRC N0CRC N+
Normal mucosa10.000/0.039/
Adenoma 10.0120.0000.002
Adenoma with early carcinoma 10.003/
CRC N0 1/
CRC N+ 1
TNXBNormal mucosaAdenomaAdenoma with early carcinomaCRC N0CRC N+
Normal mucosa10.0000.000//
Adenoma 1/0.0000.001
Adenoma with early carcinoma 10.0000.004
CRC N0 1/
CRC N+ 1
PDGFDNormal mucosaAdenomaAdenoma with early carcinomaCRC N0CRC N+
Normal mucosa1///0.008
Adenoma 1/0.0180.003
Adenoma with early carcinoma 10.0290.000
CRC N0 10.03
CRC N+ 1
CDK1Normal mucosaAdenomaAdenoma with early carcinomaCRC N0CRC N+
Normal mucosa1/0.006/0.042
Adenoma 10.027//
Adenoma with early carcinoma 1//
CRC N0 1/
CRC N+ 1
ANLNNormal mucosaAdenomaAdenoma with early carcinomaCRC N0CRC N+
Normal mucosa1/0.000/0.019
Adenoma 10.000//
Adenoma with early carcinoma 1//
CRC N0 10.046
CRC N+ 1
ECT2Normal mucosaAdenomaAdenoma with early carcinomaCRC N0CRC N+
Normal mucosa10.0000.000//
Adenoma 10.002/0.02
Adenoma with early carcinoma 10.0230.001
CRC N0 1/
CRC N+ 1
Legend: CRC N0, colorectal cancer without lymph node metastases; CRC N+, colorectal cancer with lymph node metastases; /, not statistically significant.
Table 3. Overview of projects included in the study.
ProjectPlatformTissue typeNormalAdenomaCarcinoma
GSE72820IlluminaNo data770
GSE104836IlluminaFresh frozen10010
GSE50760IlluminaNo data18018
GSE76987IlluminaRNA-later880
GSE92914IlluminaFresh frozen303
GSE100243Ion TorrentFFPE608
Table 4. Characteristics of the included patients.
PatientsAdenomaAdenoma with Early CarcinomaCRC without Lymph Node MetastasesCRC with Lymph Node Metastases
M:F10:19:44:69:4
Age62.3 ± 10.764.9 ± 5.772.7 ± 11.673.2 ± 11.8
Legend: CRC, colorectal cancer; F, female; M, male.
Table 5. Selected probes.
GeneEntrez Gene IDAssay ID
B2M567Hs99999907_m1
IPO810526Hs00183533_m1
TNC3371Hs01115665_m1
TNXB7148Hs00372889_g1
PDGFD80310Hs00228671_m1
CDK1983Hs00364293_m1
ANLN54443Hs01122612_m1
ECT21894Hs00978168_m1
Publisher’s Note: MDPI stays neutral with regard to jurisdictional claims in published maps and institutional affiliations.

