Article

Oxidative Stress Response in Adipose Tissue-Derived Mesenchymal Stem/Stromal Cells

1
Department of Cell Biology, University Medical Centre Rostock, Schillingallee 69, 18057 Rostock, Germany
2
AMP-Lab GmbH, Mendelstr. 11, 48149 Münster, Germany
*
Author to whom correspondence should be addressed.
Int. J. Mol. Sci. 2022, 23(21), 13435; https://doi.org/10.3390/ijms232113435
Submission received: 12 October 2022 / Revised: 26 October 2022 / Accepted: 28 October 2022 / Published: 3 November 2022
(This article belongs to the Special Issue Stem Cell Biology & Regenerative Medicine)

Abstract

:
Reactive oxygen species (ROS) can irreversibly damage biological molecules, a process known as oxidative stress. Elevated ROS levels are associated with immune cell activation. Sustained immune system activation can affect many different cells in the environment. One cell type that has been detected in almost all tissues of the body is mesenchymal stem/stromal cells (MSC). MSC possess proliferation and differentiation potential, thus facilitating regeneration processes. However, the regenerative capacity of MSC might be impaired by oxidative stress, and the effects of long-term oxidative stress on MSC functions are sparsely described. The examination of oxidative stress is often performed by exposure to H2O2. Since H2O2 is rapidly degraded, we additionally exposed the cell cultures to glucose oxidase (GOx), resulting in sustained exposure to H2O2. Using these model systems, we have focused on the effects of short- and long-term oxidative stress on viability, migration, differentiation, and signaling. All cellular functions examined were affected by the applied oxidative stress. The differences that occur between pulsed and sustained oxidative stress indicated higher oxidative stress in MSC upon direct H2O2 exposure, whereas the GOx-induced prolonged exposure to H2O2 seems to allow for better cellular adaptation. The mechanisms underlying these different responses are currently unknown.

1. Introduction

Reactive oxygen species (ROS) are highly reactive compounds derived from oxygen and formed by the capture of electrons by an oxygen atom [1]. ROS are by-products of normal metabolism and play a role in cell signaling and homeostasis by regulating cellular proliferation, differentiation, and survival [2]. However, ROS can also cause irreversible damage to biological molecules (i.e., DNA, proteins, lipids) [3,4]. To protect biological macromolecules from oxidative stress, mammalian cells have evolved a sophisticated antioxidant defense system that includes molecules (e.g., glutathione (GSH), ascorbic acid), enzymes (e.g., catalase, GSH peroxidase (GPX), superoxide dismutase (SOD)) [5]. The condition in which there is an imbalance between the levels of ROS or reactive nitrogen species (RNS) and the antioxidant molecules, as well as enzymes, is termed oxidative stress [6,7]. The three major physiological significance ROS molecules are hydroxyl radical (OH), superoxide anion (O2•−), and hydrogen peroxide (H2O2) [6]. A decrease in antioxidant levels with increased ROS accumulation can lead to cellular dysfunction or damage and may result in cell death [8].
Elevated ROS levels are often connected to the activation of immune cells (e.g., macrophages and neutrophils) releasing ROS, which is known as an oxidative burst. As part of innate immunity, this process is essential for the degradation of internalized pathogens (e.g., bacteria) [9]. However, this process also involves risks. In wound healing, for example, the double-edged nature of ROS release by immune cells becomes apparent. Whereas slightly elevated ROS levels exert an antimicrobial effect by activating pro-inflammatory signaling pathways and immune cells, excessive ROS levels lead to destructive effects in the wound, which perpetuate inflammation and can also chronify the wound healing process leading to wound healing disorder [10,11]. This chronification can affect many different cells in the afflicted tissue regions, causing fibrotic reactions compromising tissue functions, such as in fibrotic lung or diabetic wounds [12,13]. One cell type that has been identified in almost all tissues of the body, including subcutaneous tissue, is the mesenchymal stem/stromal cells (MSC) [14,15].
MSC have a high proliferation and differentiation potential. These properties allow them to renew the fraction of mesenchymal progenitor cells or to differentiate into tissue-specific cell types [16,17]. Thus, these properties contribute to the maintenance and regeneration of supportive and connective tissue, such as bone, cartilage, tendon, or adipose tissue [15,18]. MSC are considered to facilitate regeneration processes by exerting anti-inflammatory and immunomodulatory effects through the release of cytokines and other soluble factors, in addition to the aforementioned proliferative and differentiation properties [19,20]. Therefore, the cell therapeutic use of MSC is of great interest in many respects, which is also reflected in the large number of clinical studies involving MSC [21]. However, the success of MSC in cell therapy depends on various important factors. These include nutrient supply, accessibility of growth factors, and oxidative stress [22,23]. The regenerative capacity of MSC might be impaired by an unfavorable coincidence of the levels of these three factors, as mentioned earlier.
The effects of oxidative stress are often illustrated in vitro by exposure to the oxidative stressor H2O2 [24,25,26]. H2O2 is one of the most important compounds for the study of ROS signaling due to its physicochemical properties, which are relatively low reactivity and the ability to diffuse through membranes [27]. A number of molecules that respond to H2O2-induced oxidative stress include superoxide dismutase (SOD), catalase, and glutathione peroxidase (GPx) [28]. However, many questions about the effects of oxidative stress in MSC, such as the effects of long-term exposure to H2O2 or ROS, are still unclear. The effects of long-term ROS exposure are of particular interest as persistent ROS production has been reported in the chronification of inflammatory processes [29,30]. ROS initiates signaling pathways that activate several transcription factors, such as nuclear factor kappa B (NF-ҡB), by initiating its release from its inhibitor IҡB and facilitating its translocation into the nucleus. Thereafter, NF-ҡB induces several genes responsible for the activation of pro-inflammatory cytokines and chemokines [3].
Therefore, this study focused on understanding the effects of short- and long-term oxidative stress induced by H2O2 exposure on MSC from adipose tissue (adipose tissue-derived MSC, adMSC) in vitro. Not only were the adMSC treated with H2O2, but also with glucose oxidase (GOx), an enzyme that produces H2O2 by glucose oxidation [31]. In this way, sustained production of H2O2 was induced in the culture medium. Thus, we induced two different characteristics of H2O2 exposure: the first rather pulsatile, the second rather persistent.
In this study, we quantified the amount of H2O2 and ROS present or generated after treatments with these oxidative stressors and investigated their effects on the proliferation, viability, migration, and differentiation of adMSC. In addition, the underlying signaling processes were investigated. These studied aspects are important influencing variables of the regeneration and wound healing process [32,33]. Understanding the influence of long-term oxidative stress on MSC in terms of the variables described above might also provide a basis for improving the therapeutic efficacy of MSC in the wound healing process.

2. Results

2.1. Quantification of Extracellular H2O2 and Intracellular Reactive Oxygen Species (ROS)

To determine the concentration of H2O2 in the cell culture medium, the Amplex UltraRed assay was performed. This measurement allows us to assess the amount of H2O2 added or produced by GOx and the scavenging capacity of the cell culture medium. For this purpose, different concentrations of H2O2 and GOx (H2O2: 0.01, 0.05, 0.1 and 0.25 mM, and GOX: 0.1, 0.5, 1, 2.5, and 5 mU/mL) were added to the cell culture medium (Dulbecco’s Modified Eagle’s Medium/DMEM containing 10% fetal calf serum/FCS, 1% penicillin/streptomycin/P/S, 0.4% GlutaMaxTM without pyruvate). The quantification of H2O2 was carried out for 48 h at different time points. Directly added H2O2 in the cell culture medium was almost completely degraded over a period of 48 h (at all H2O2 concentrations except 0.25 mM, where approximately 5% of the initially applied amount remained). After 24 h of exposure, a maximum of 10% of the initially applied amount was detectable in each case (Figure 1A and Figure S1A). In contrast, GOx exposure led to an enzyme activity-dependent significant increase in the amount of H2O2 in the cell culture medium, which largely remained over the observation period of 48 h (Figure 1A and Figure S1B).
To determine the effect of H2O2 exposure on the amount of intracellular ROS, cell cultures were incubated with the redox-sensitive substance 2′-7′-dichlorofluorescein diacetate (CM-H2DCFDA) and thereafter exposed to H2O2 or GOx, and the resulting fluorescence was quantified. The intracellular ROS amount increased dose- and time-dependently (significant at 0.25 mM H2O2) and was nearly saturated after 50 min in H2O2-treated adMSC (Figure 1B and Figure S1C). After GOx exposure, a time- and concentration-dependent increase in the amount of ROS in the adMSC was observed (Figure 1C and Figure S1D). However, GOx-induced ROS accumulation was not as high as in adMSC treated with H2O2. The highest amount of GOx induces less than half of the ROS compared to the highest amount of H2O2 after 50 min, in accordance with the higher amount of H2O2 measured after 1 h for the direct H2O2 addition compared to the H2O2 production induced by GOx.

2.2. Quantification of Cell Number and Metabolic Activity

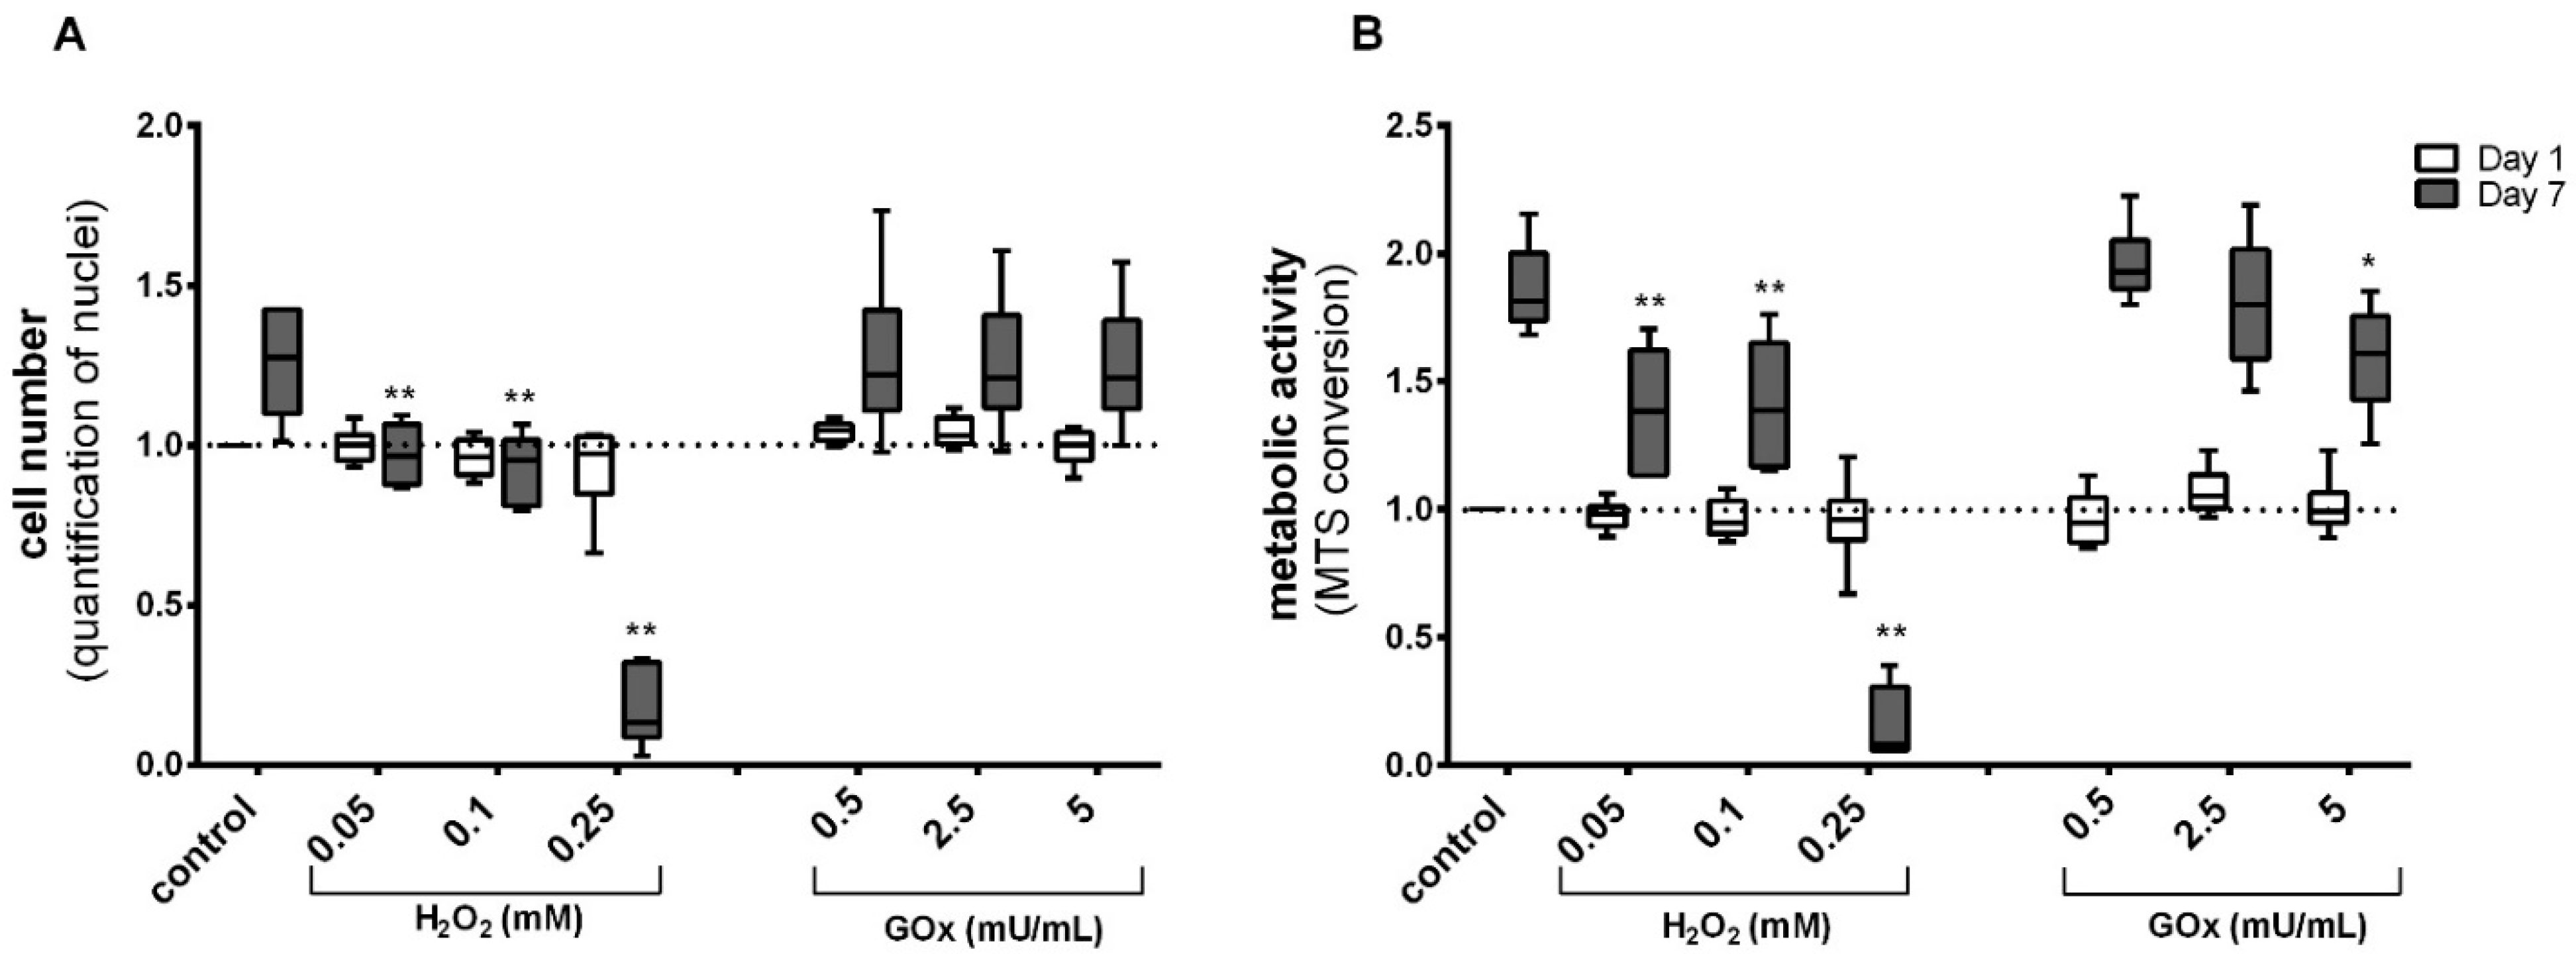
The toxicity threshold of H2O2 and GOx was evaluated in adMSC for up to 7 days. Therefore, the cell numbers and the metabolic activity (MTS conversion assay) were determined after the exposure to H2O2 and GOx in different concentrations (as stated above). The H2O2 and GOx treatment took place every second day. This results in different treatment frequencies depending on the respective analysis time point. After 1 day of treatment, no significant change in adMSC number (Figure 2A) and metabolic activity (Figure 2B) was observed. Also, no apparent differences could be detected on the 3rd day of exposure (i.e., after two treatments) (Figure S2). However, after 7 days of exposure with three repeated treatments, a threshold decrease in cell number was observed at higher H2O2 concentrations, which was significant (p < 0.001) from 0.05 mM H2O2 (Figure 2A and Figure S2A). A similar effect was seen for the metabolic activity, where a significant reduction occurred after 7 days with H2O2 concentration from 0.05 mM (Figure 2B and Figure S2B). A clear cytotoxic effect was visible in adMSC treated with the highest H2O2 concentration of 0.25 mM. In contrast, the treatment with all concentrations of GOx did not induce a cytotoxic effect. However, a significant decrease in metabolic activity was observed in the cells treated with 5 mU GOx/mL. For this reason, only non-toxic concentrations of H2O2 and GOx were used for the subsequent investigations.

2.3. Profiling of Cell Stress Protein Expression

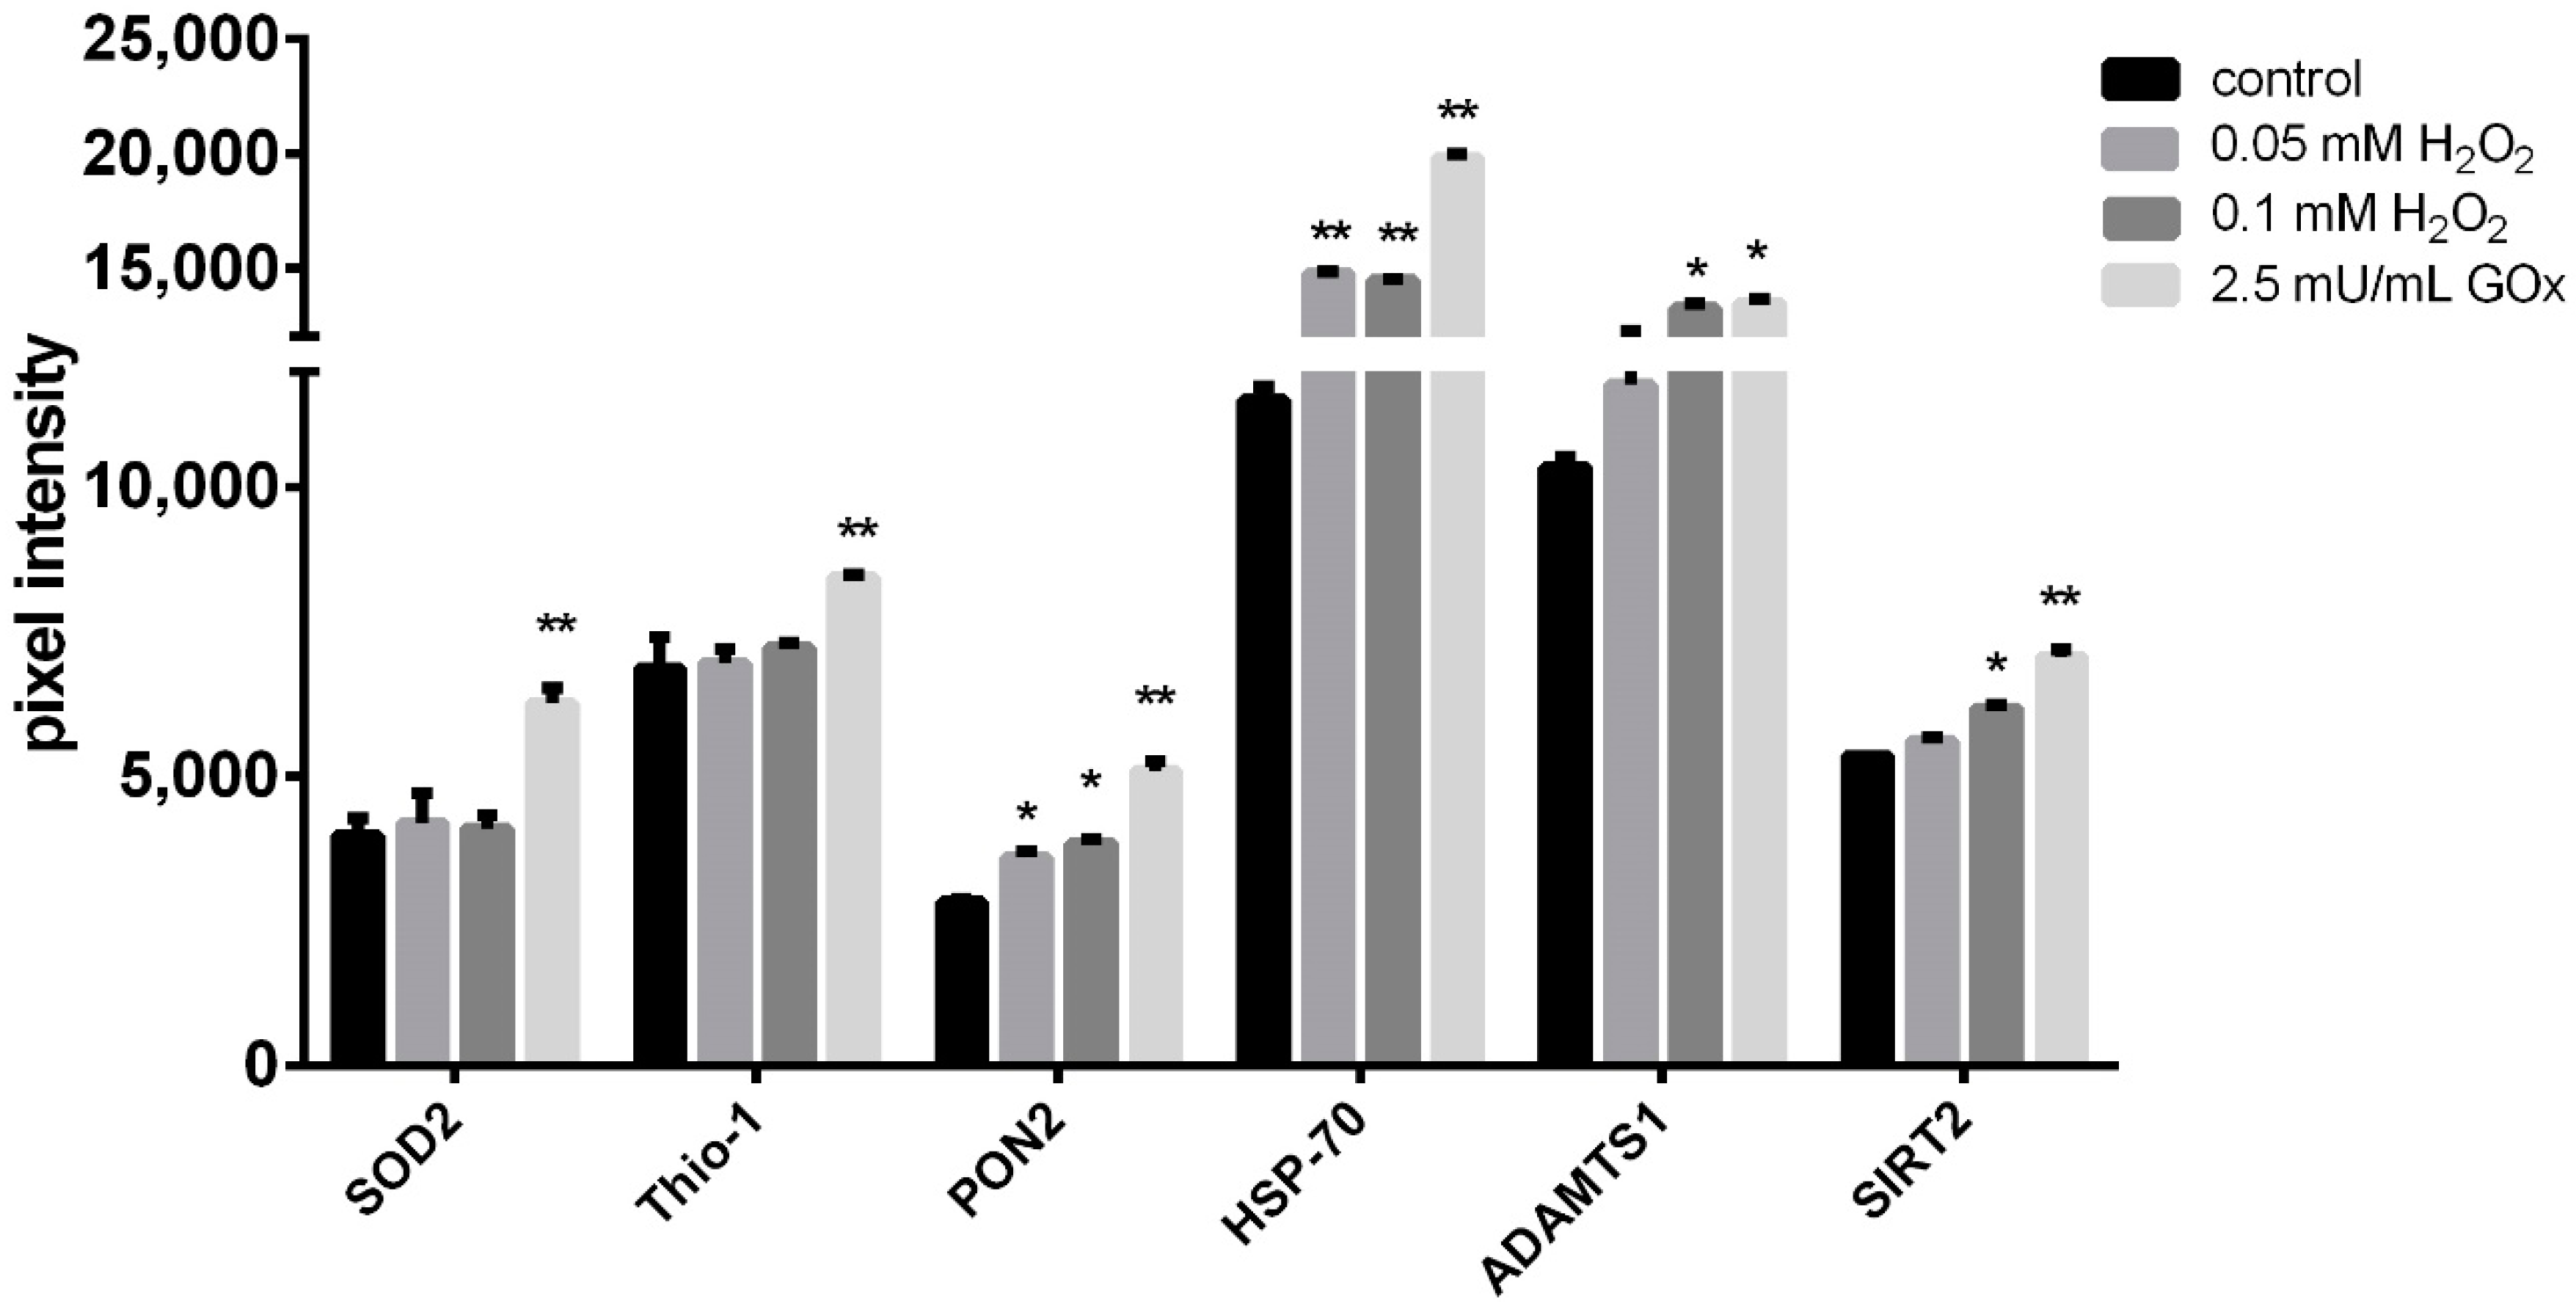
To investigate the extent of stress exerted by H2O2 exposure on adMSC, a ‘Proteome Profiler Human Cell Stress Array Kit’ was used. This kit allows the simultaneous analysis of 26 cell stress-related proteins (Table S1). For this purpose, lysates of adMSC after 24- and 48-h treatment with 0.05, 0.1 mM H2O2, and 2.5 mU/mL GOx, were prepared and subjected to membrane/antibody-based analysis, and the blots were subsequently quantified (Figure S3A,B). The protein levels of six of these cell stress-associated proteins (i.e., 23% of the proteins analyzed) were differentially regulated in response to H2O2 and GOx exposure, respectively. The following proteins were elevated in lysates from adMSC treated for 24 h with H2O2 and GOx compared to the control: superoxide dismutase 2 (SOD2), thioredoxin-1 (Thio-1), paraoxonase 2 (PON2), heat shock protein-70 (HSP-70), ADAM metallopeptidase 1 (ADAMTS1), and sirtuin 2 (SIRT2) (Figure 3). The most significant effects were observed in adMSC treated with 2.5 mU GOx/mL. In contrast, lysates obtained from adMSC treated for 48 h with the oxidative stressors showed a significant reduction in expression of these same stress proteins in a dose-dependent manner compared to the control (Figure S3C).

2.4. Oxidative Stress and Inflammatory Signaling

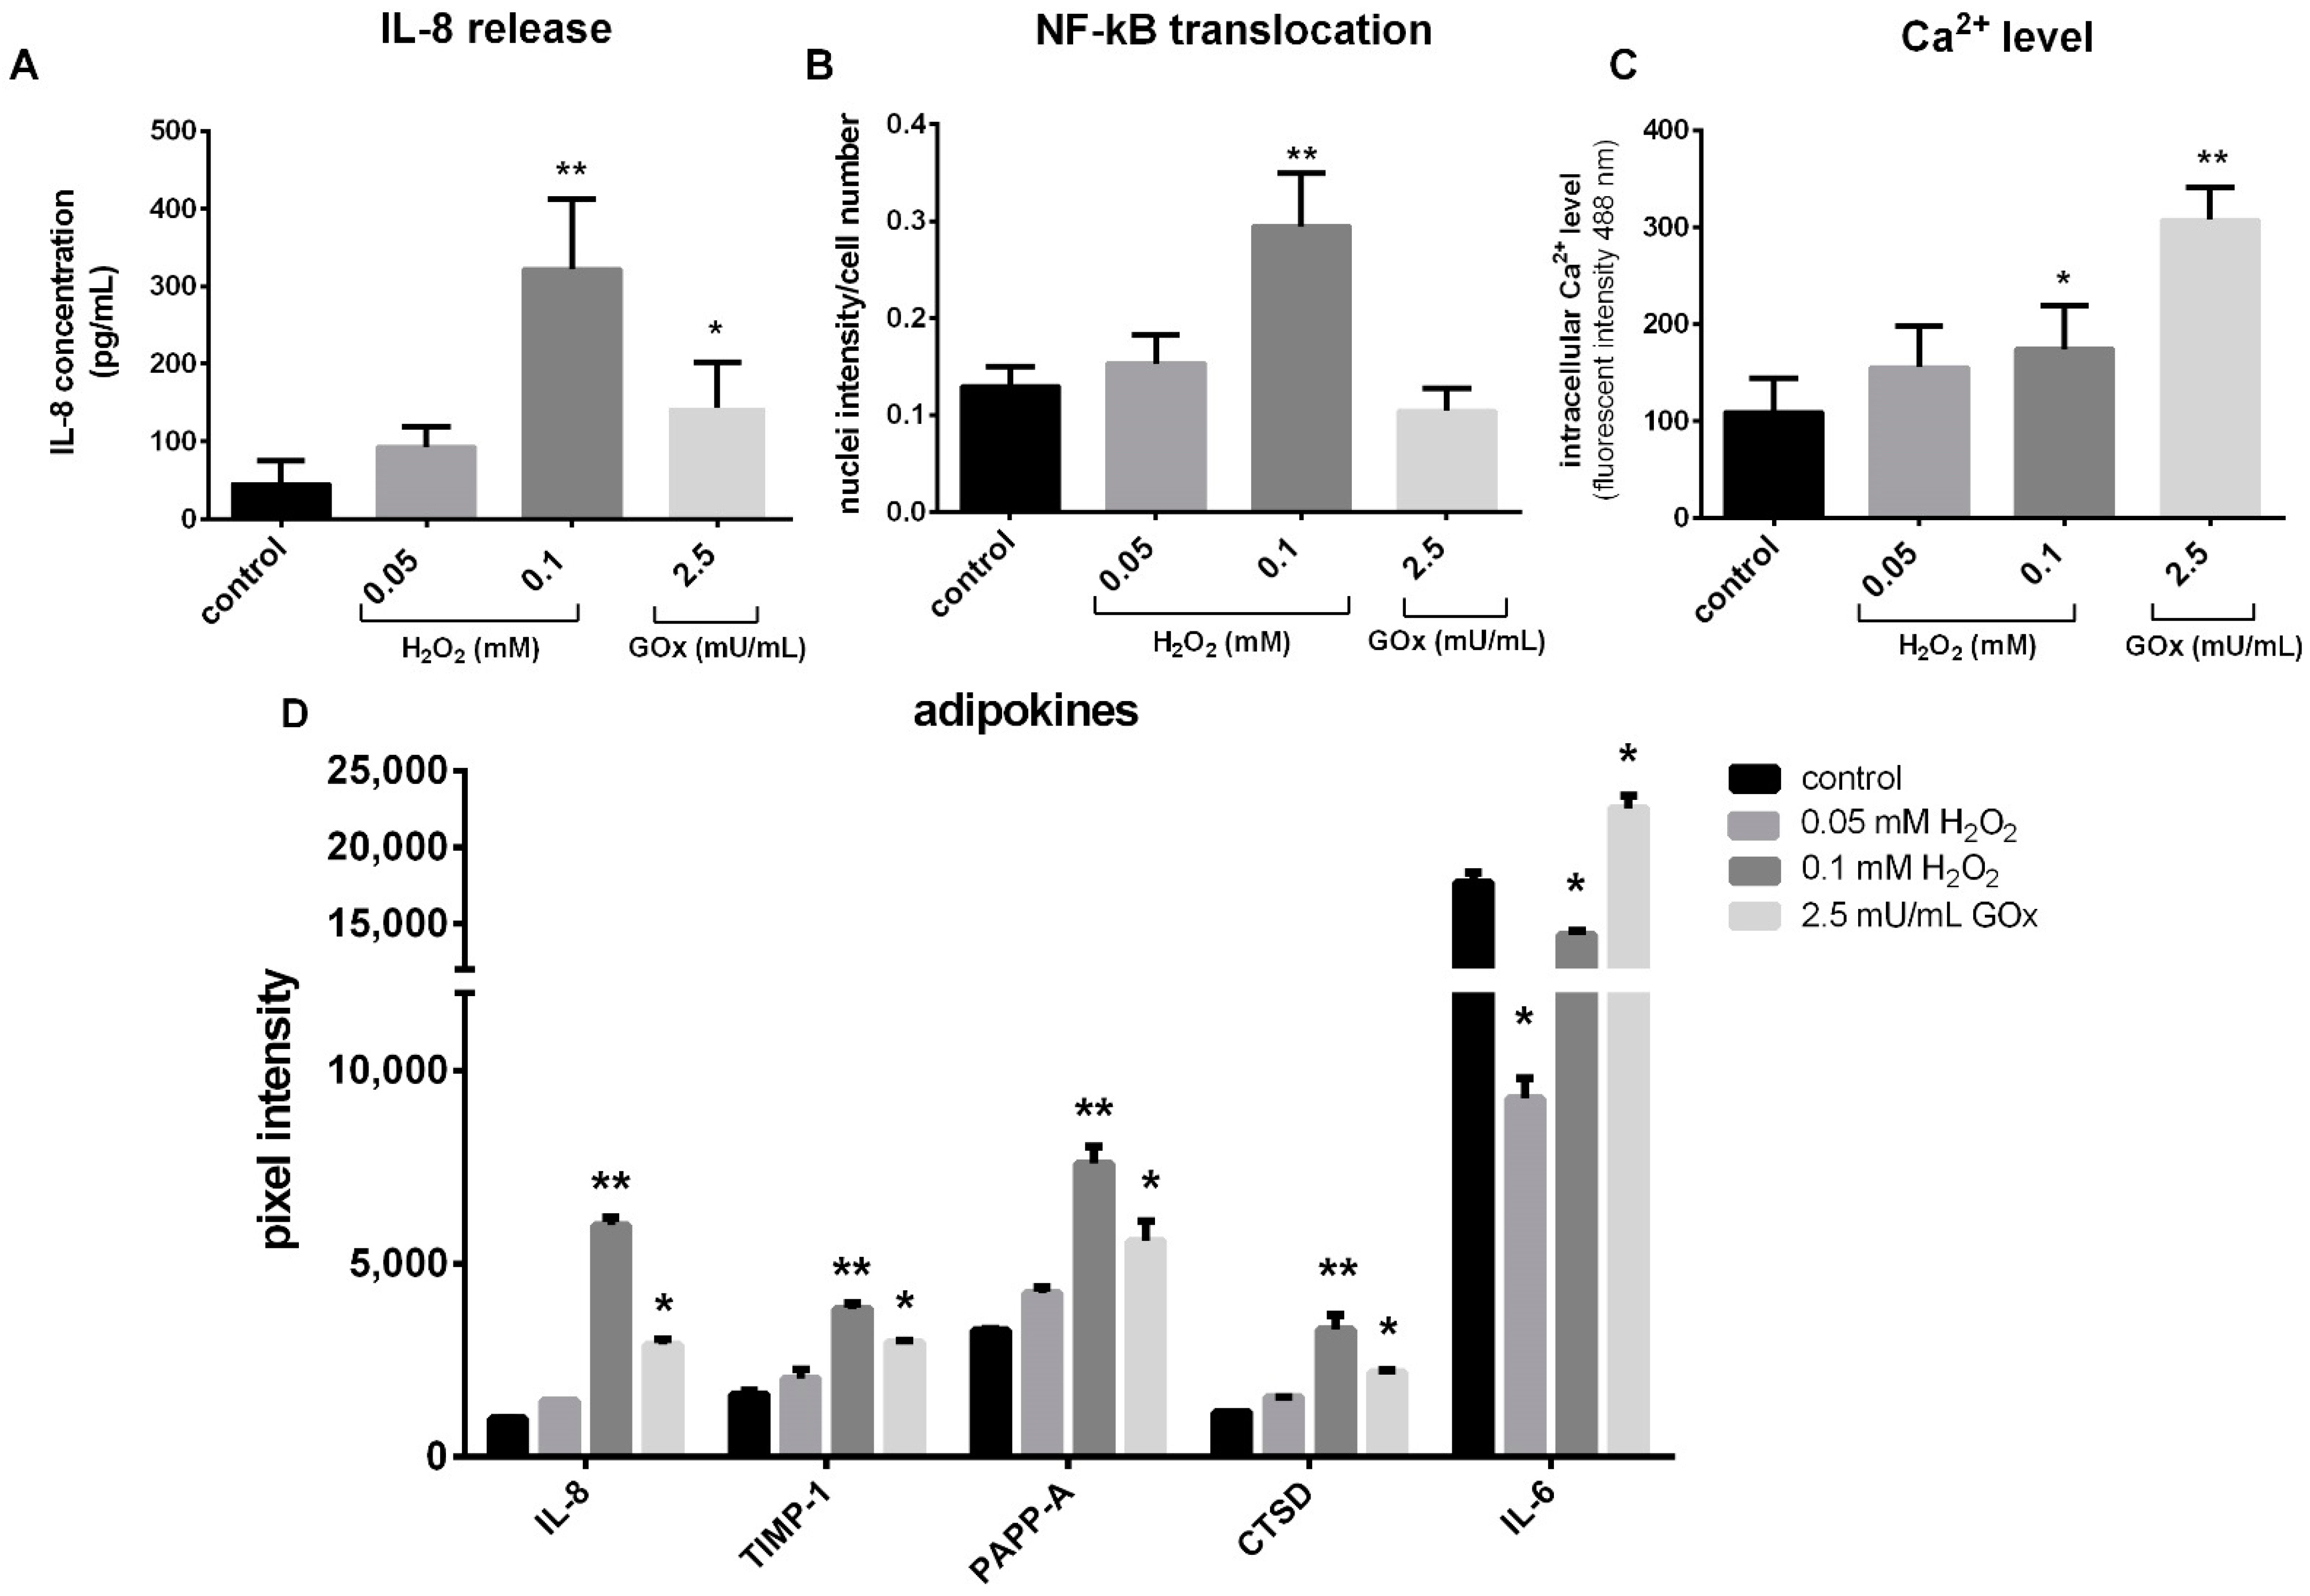
The influence of oxidative stress on inflammatory reactions of adMSC was investigated by the quantification of the proinflammatory cytokine Interleukin-8 (IL-8). adMSC treated with 0.05, 0.1 mM H2O2, and 2.5 mU/mL of GOx for 48 h showed an increased release of IL-8 in the cell culture supernatant. The most significant effect was observed in 0.1 mM H2O2-treated adMSC, where 322 pg IL-8/mL was detected compared to 46 pg/mL in the untreated control cultures (Figure 4A). To further investigate the involvement of oxidative stressors in proinflammatory signaling, the nuclear translocation of NF-ҡB, an inducer of various inflammatory genes was analyzed. A significant increase in nuclear translocation of NF-ҡB was observed in adMSC treated with 0.1 mM H2O2 for 24 h (Figure 4B). The lower tested H2O2 concentration (0.05 mM) and 2.5 mU/mL of GOx did not induce marked differences in nuclear translocation at the two tested time points of 8 and 24 h.
Furthermore, the effect of H2O2 exposure on the intracellular calcium (Ca2+) level was investigated. The Ca2+ concentration was measured by flow cytometry after the treatment of adMSC with different concentrations of H2O2 and GOx for 24 h (Figure S4A). Intracellular Ca2+ levels were dose-dependent and starting at a concentration of 0.1 mM H2O2, and 2.5 mU/mL significantly increased (Figure 4C).
In addition, the supernatants of adMSC treated with 0.05, 0.1 mM H2O2, and 2.5 mU/mL GOx were analyzed for adipogenesis and obesity-related factors (adipokines) in response to oxidative stress using a ‘Human Adipokine Array kit’ (Figure S4B). This array allows the simultaneous quantification of 58 obesity-related factors (Table S2). The densitometric evaluation of the membranes revealed that the ‘classic’ adipokines, such as leptin or adiponectin, were not regulated by H2O2 or GOx. However, the factors that mainly influence the inflammatory processes, such as IL-6, IL-8, and tissue inhibitor of metalloproteinase 1 (TIMP-1), were differentially regulated by exposure to the oxidative stressors (Figure 4D). Thus, the release pattern of IL-8, TIMP-1, metalloproteinases-related protein pappalysin-1 (PAPP-A), and the lysosomal protease cathepsin D (CTSD) was similar in that the two H2O2 concentrations resulted in a concentration-dependent increase in releases, and exposure to 2.5 mU/mL caused a milder increase compared to the higher H2O2 concentration. Only the release pattern of IL-6 differs; here, GOx exposure causes a significant increase in the release from adMSC, whereas H2O2 exposure causes a significant decrease (Figure 4D).

2.5. adMSC Migration after Exposure to H2O2 and GOx

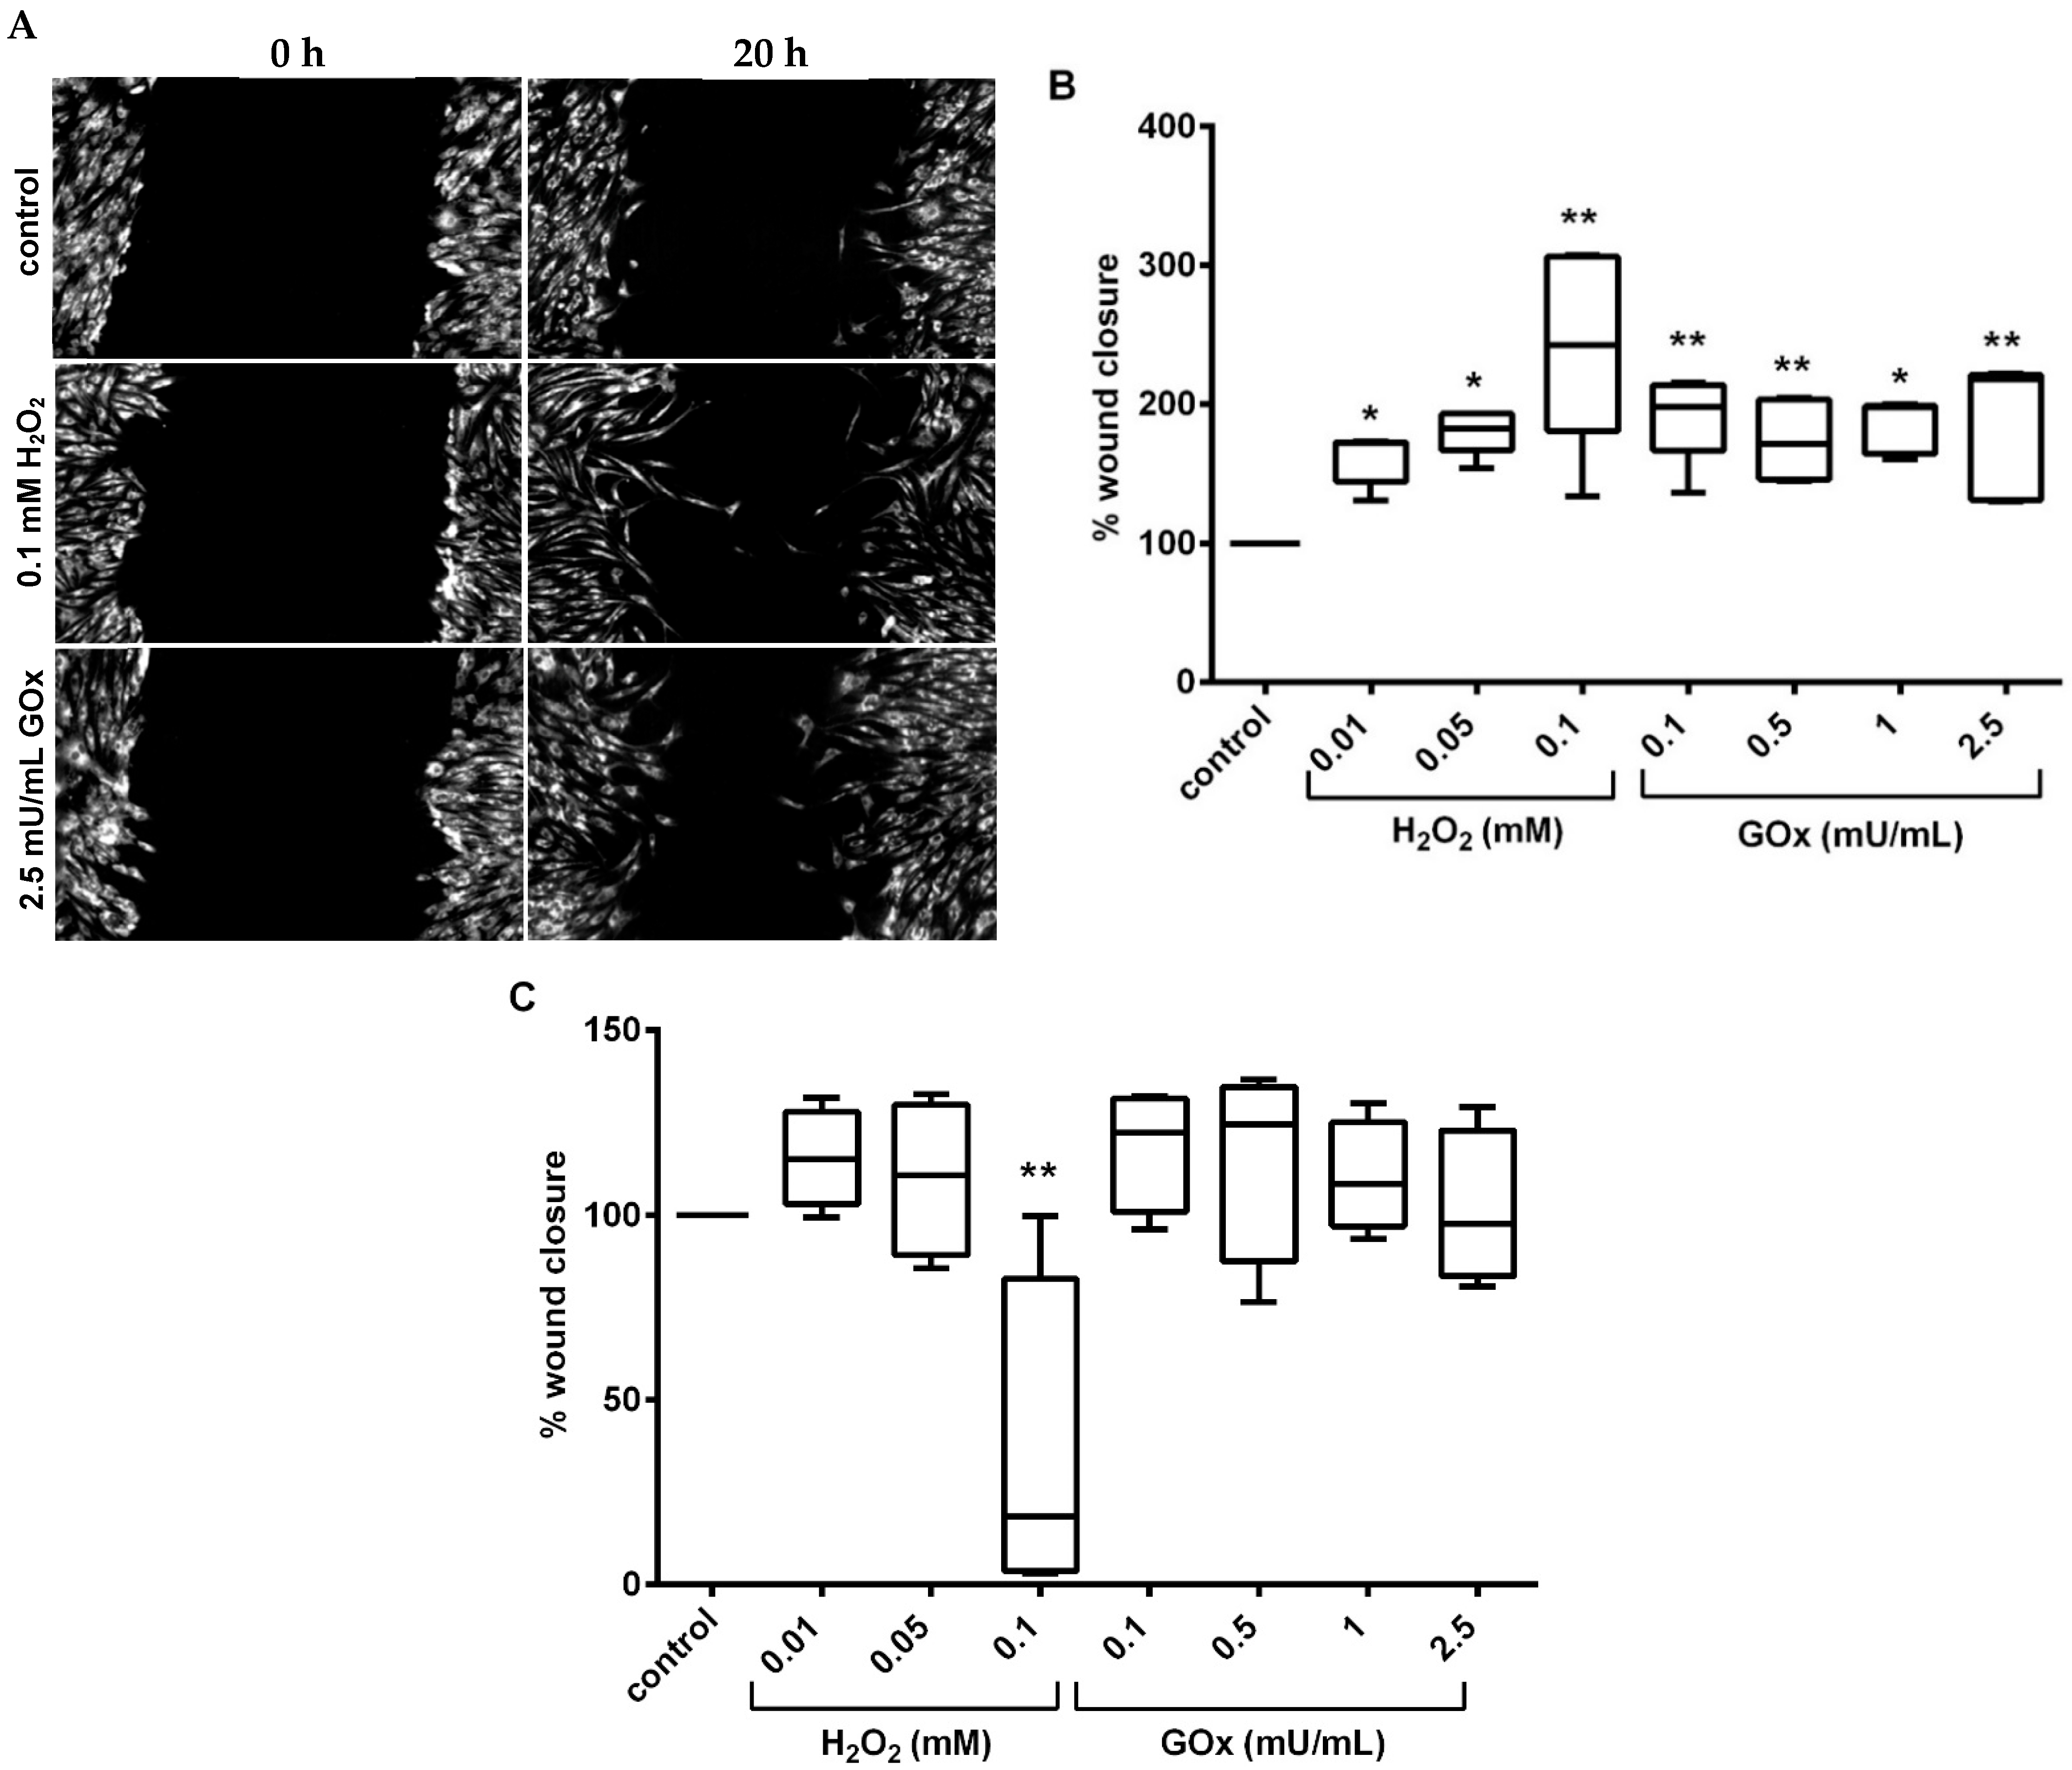
To evaluate the effect of oxidative stress on the migratory capacity of adMSC, we performed a so-called wound healing assay (also known as scratch assay). This test was performed under two different settings. First setting: the cells were treated with the oxidative stressors (H2O2: 0.01, 0.05, and 0.1 mM and GOx: 0.1, 0.5, 1, and 2.5 mU/mL) for 24 h before scratch and were not further treated with the oxidative stressors after scratching. Second setting: cells were both pre-treated with the oxidative stressors and further treated with the oxidative stressors after scratching. In setting one, the fluorescent depiction of the scratch area indicated an increased migratory capacity in all treated adMSC compared to the control, as more cells covered the scratch area (Figure 5A). Quantification of wound closure (in % of the scratch area) revealed that the first setting led to a significantly increased migratory activity of adMSC after pre-incubation with oxidative stressors and subsequent absence of oxidative stress during migration (Figure 5B).
In contrast, the second setting, where cells were pre-treated with the oxidative stressors for 2 h and continued exposure to the oxidative stressors after scratching, does not significantly increase the migratory activity. Lower H2O2 concentrations or GOx activities tested led to a slight increase in the migration of adMSC. On the other hand, the adMSC migration was almost entirely suppressed by increasing the amount of H2O2 to 0.1 mM. This means that there is a high sensitivity of adMSC to the extent of oxidative stress. The GOx-induced H2O2 exposure did not lead to a change in adMSC migration at any time (Figure 5C).

2.6. Adipogenic Differentiation of adMSC under Oxidative Stress

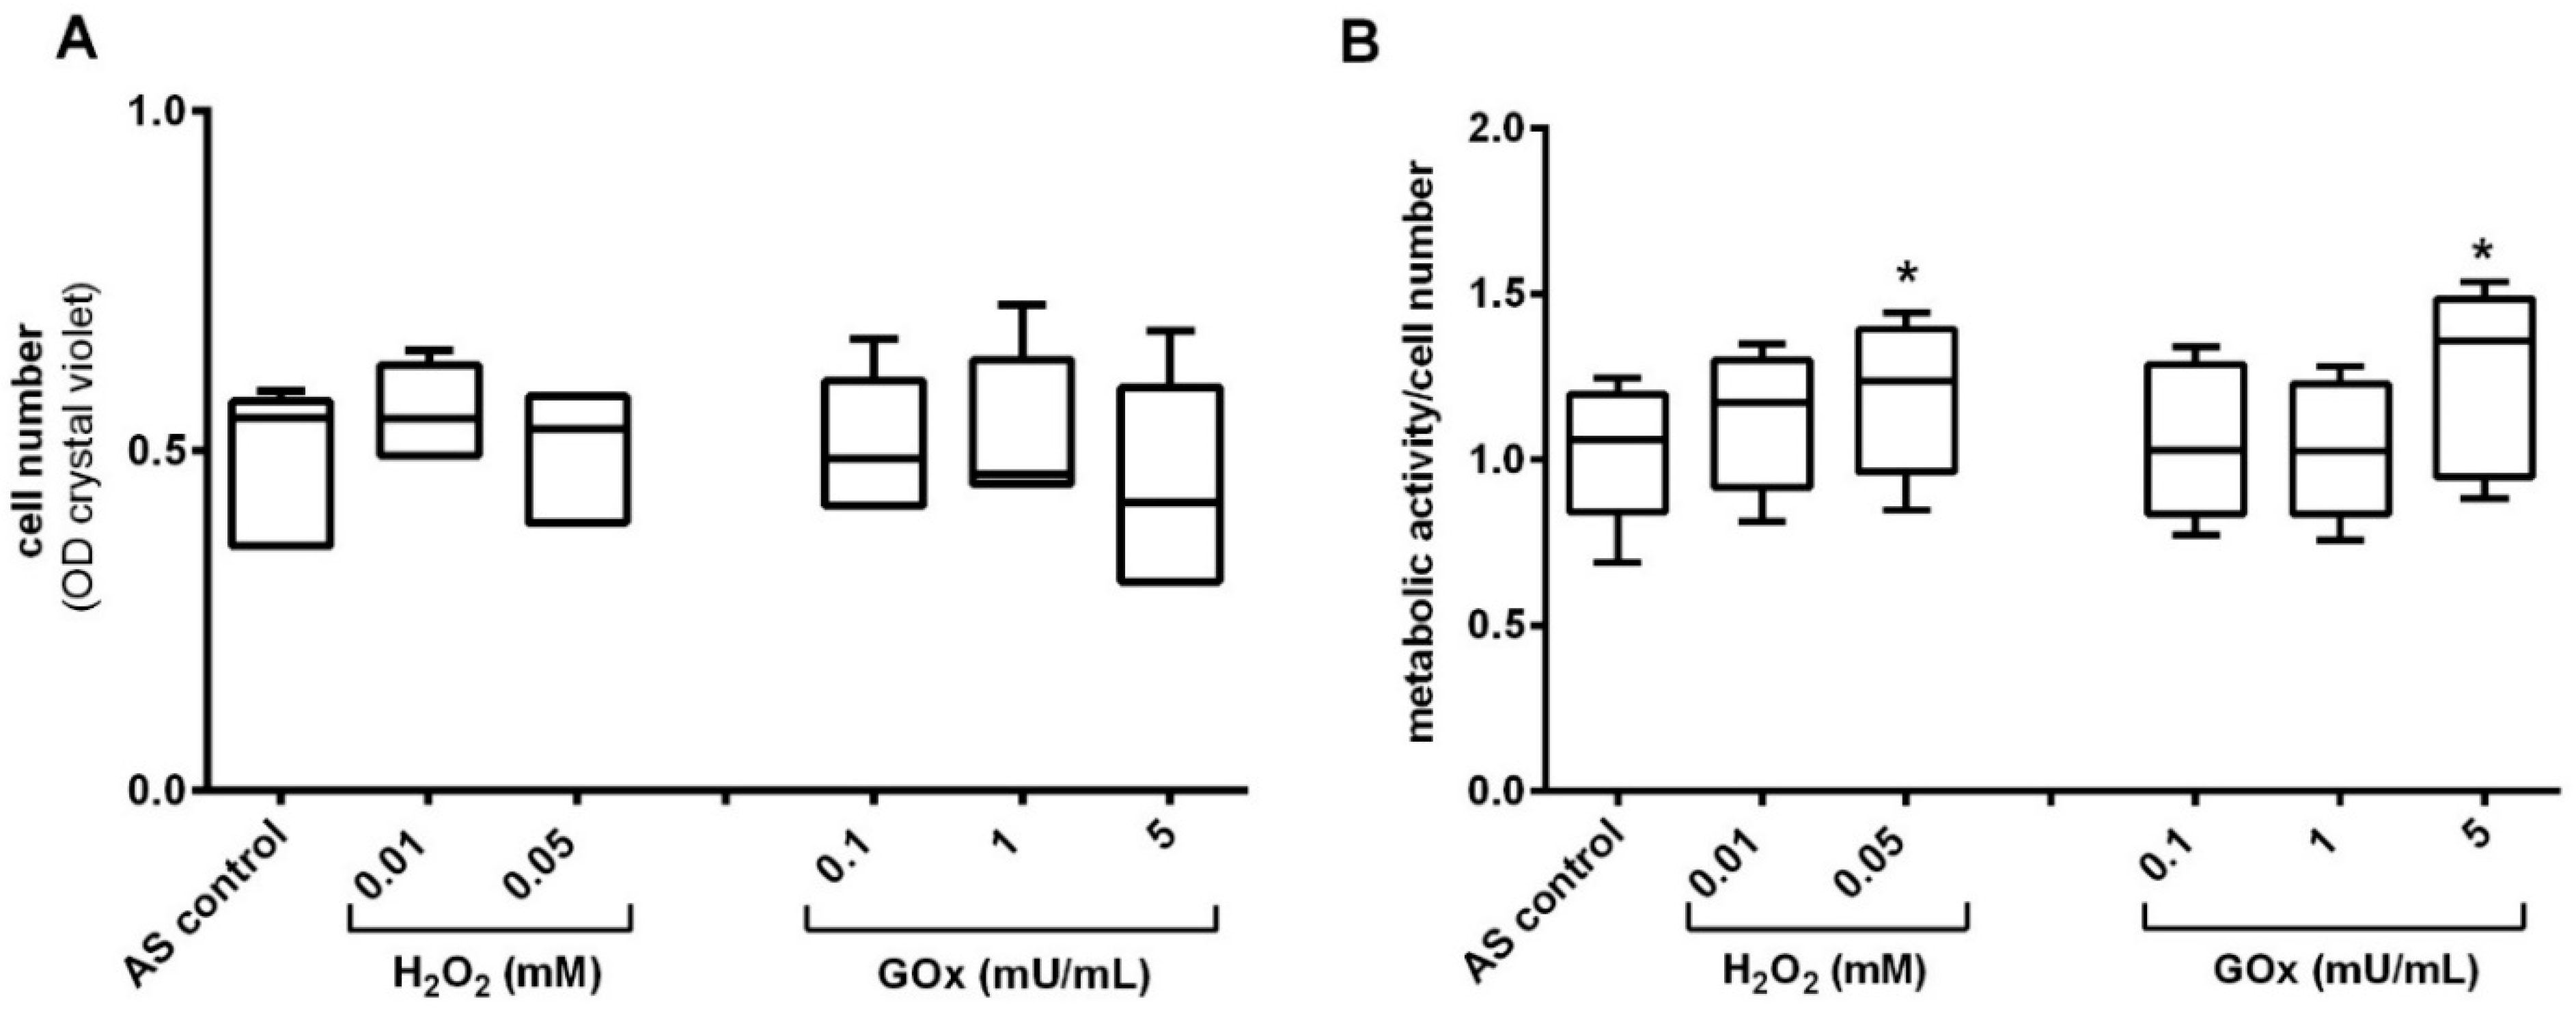
The adipogenic differentiation capacity of adMSC under oxidative stress was demonstrated by the detection and quantification of lipid accumulation after 14 days of adipogenic stimulation and repeated treatments with oxidative stressors. At the end of the 14-day adipogenic stimulation period, there were no H2O2- or GOx-induced changes in cell numbers compared to the untreated control (Figure 6A). Interestingly the metabolic activity (determined by MTS conversion assay) of H2O2/GOx treated and simultaneously adipogenically stimulated adMSC increased concentration-dependently (Figure 6B).
The depiction of lipid accumulation after 14 days revealed a clear adipogenic differentiation of adMSC, whereas non-adipogenic stimulated adMSC (unstimulated, US) were free of lipid accumulation (Figure 6C). Notably, upon H2O2 treatment, even the lowest concentration tested (0.01 mM) led to an apparent reduction in the number of lipids (Figure 6C). The quantification of the lipid accumulation also confirmed the reduction. Exposure to all oxidative stressors resulted in a concentration-dependent decrease in the number of lipids. However, this effect was more pronounced after H2O2 exposure than after exposure to GOx (Figure 6D).

2.7. Osteogenic Differentiation of adMSC under Oxidative Stress

Osteogenic differentiation capacity was investigated by the measurement of alkaline phosphatase (ALP) activity, a bone-specific enzyme, and an early marker for osteogenic stimulation. The relative cell amount was determined after 21 days of osteogenic stimulation and repeated H2O2-/GOx-treatments. A dose-dependent decrease in relative cell amount was observed in adMSC repeatedly treated with H2O2 and GOx compared to the osteogenically stimulated, non-oxidatively stressed control (significant at 0.05 mM H2O2 and 5 mU/mL GOx) (Figure 7A). In contrast, the metabolic activity increased significantly (p < 0.001) in osteogenically stimulated adMSC with increasing concentrations of H2O2 and GOx (Figure 7B). The detection of ALP activity showed only a few slightly ALP-positive cells in the unstimulated adMSC after 21 days of cultivation (Figure 7C). In contrast, the osteogenically stimulated cells were clearly ALP-positive after 21 days (Figure 7C). Osteogenically stimulated adMSC, repeatedly treated with H2O2 and GOx, indicated a concentration-dependent decrease in ALP activity. The result was supported by photometrical quantification of ALP activity (normalized to cell amount). Where the osteogenic stimulation and simultaneous treatment of adMSC with H2O2 and GOx reduce the ALP activity in a dose-dependent manner (significantly at 0.05 mM H2O2 and 5 mU/mL GOx with p < 0.05) (Figure 7D).

3. Discussion

ROS serve as an essential signaling molecule in the maintenance of cellular functions [3,34]. ROS are involved in coordinating effective tissue repair by regulating different cell types, including blood vessel formation. Given this important role of ROS, understanding the detailed background of ROS signaling is a promising route for improving tissue repair and potentially influencing processes by balancing the ROS composition [30]. In this context, ROS could also have an impact on the clinical application of MSC [35]. In contrast, excessive ROS production induces oxidative stress in the cells, which has been associated with the progression of many diseases [4,36]. Although the effects of oxidative stress have been studied widely, many questions remain unanswered due to the complex interrelationships of many influencing factors and heterogeneous reported results. We have focused our investigations on MSC because they are an important cell type in tissue regeneration and hold promise for cell therapy in various diseases. The capacity to maintain MSC properties depends on the balance of complex signals in their microenvironment, partly regulated by ROS [37]. For example, MSC engraftment in the case of chronic wounds has been proposed to be an efficient method of promoting wound healing [38,39]. However, their therapeutic efficacy in the injured tissue is limited because of their low survival rate and poor engraftment efficiency due to oxidative stress [40]. Therefore, understanding the contributions of oxidative stress in the regenerative capacity and the survival of MSC in the injured tissue microenvironment is essential to promote MSC engraftment and enhance tissue repair.

3.1. Oxidative Stress Signaling in MSC

A number of in vitro studies have investigated the effects of H2O2 on oxidative stress response in MSC [41,42,43,44]. The stability of H2O2 in biological environments is fundamentally limited, and antioxidant substances in biological environments (e.g., vitamins, carotenoids, flavonoids, and antioxidant enzymes) shorten the shelf life of H2O2 [5]. This basically results in pulsed exposure when using H2O2 as a model substance for oxidative stress. For this reason, we have additionally chosen exposure with GOx for our in vitro model. GOx produces H2O2 in a two-step redox reaction, and the concentration of the end product (H2O2) depends on enzyme activity and substrate (glucose) availability [31]. Treatment with GOx has been evaluated by extensive studies on the wound-healing ability of medicinal honey. In the wound-healing environment, GOx could exert its antimicrobial activity through the production of H2O2 [45].
Our results confirm that the H2O2 concentration in the medium after direct exposure to H2O2 is significantly reduced over 24 h. In contrast, the H2O2 concentration after GOx exposure in the medium is relatively stable over the period of 48 h. Therefore, we refer to direct H2O2 exposure as pulsed H2O2 exposure in the following discussion, whereas we refer to GOx treatment as sustained H2O2 exposure. It is important to note that the resulting maximal amounts of H2O2 detected were almost the same for the direct H2O2 treatment or with GOx activities we investigated. However, adMSC direct exposure to H2O2 leads to a significantly higher intracellular ROS accumulation compared to exposure to GOx (H2O2 induces more than twice as high ROS quantities). We assumed that cellular response to the exposure of both oxidative stress types could differ.
Cells can activate several signaling pathways in response to the elevation of ROS production [46]. These signaling pathways are essential for cell redox regulation or controlled ROS generation [47]. Activation of these signaling pathways leads to the upregulation of several stress proteins to maintain cellular homeostasis. The main systems for scavenging ROS in cells are antioxidant enzymes [5]. Our experiments showed that exposure of adMSC to both H2O2 and GOx for 24 h led to an elevation of stress proteins, PON2, ADAMTS1, Sirt2, and HSP-70, also antioxidant proteins, SOD2 and Thio-1. We observed a more prominent elevation of these proteins in adMSC exposed to GOx (2.5 mU/mL). The increase in these proteins was confirmed for their cytoprotective effect. For example, HSP-70 works together with antioxidant systems to inhibit the ROS effect and impair the apoptotic mechanism [48]. Elevations in antioxidant enzymes enhance adMSC resistance to oxidative damage. The lower cytotoxic effect of GOx-induced H2O2 exposure compared to pulsed H2O2 exposure that we have shown could be due to the higher increase in antioxidant factors in GOx. However, exposure of adMSC to oxidative stressors for 48 h led to a decrease in the expression of the mentioned antioxidant factors. This indicates that prolonged ROS generation might induce exhaustion of antioxidant enzymes. Moreover, disturbed redox equilibrium between ROS and antioxidants confers cellular dysfunction and progresses to oxidative damage [6,7].
Furthermore, ROS initiate several signaling processes, including the expression of genes responsible for survival through the activation of transcription factors, like NF-ҡB and hypoxia-inducible factor-1α (HIF-1α) [3]. ROS initiate the activation of protein kinase, thus the release of NF-ҡB from its inhibitor IҡB, which is then translocated into the nucleus, where it induces the expression of several genes responsible for the activation of pro-inflammatory cytokines and chemokines. Once triggered, these cytokines and chemokines bind to their respective receptors to regulate redox-sensitive pathways, resulting in numerous cellular responses [3]. Our result showed an elevation of NF-ҡB with the 24 h treatment of adMSC with 0.1 mM H2O2, and in turn, pro-inflammatory cytokines IL-6 and IL-8 confirmed ROS facilitated the production of these cytokines. GOx-induced H2O2 exposure in adMSC instigates lower inflammatory responses.
Several studies have shown that intracellular Ca2+ regulates the generation and degradation of ROS, thereby maintaining the redox state in the cell [46]. Therefore, we investigated the effects of oxidative stress in adMSC on intracellular Ca2+ levels. Exposure of adMSC to oxidative stressors increased the cytosolic Ca2+ levels dose-dependently. However, we observed a more pronounced increase in cytosolic Ca2+ in adMSC exposed to GOx-induced H2O2 than direct H2O2 exposure. An increase in intracellular Ca2+ has also been described upon H2O2 treatment in human endometrial stem cells [49]. The interaction between ROS and Ca2+ is bidirectional; increased Ca2+ concentrations activate ROS-generating enzymes and free radical formation, leading to increased ROS production [50]. There is increasing evidence that this cross-talk plays an essential role in ROS influence in the pathogenesis of several diseases.

3.2. Migration of MSC under Oxidative Stress

In a disease state with increased inflammation and oxidative stress, the migration of MSC is another important property required for their regenerative activity [41]. However, little is known about the influence of oxidative stress on MSC migration. We investigated the migratory capacity of adMSC in two different settings. Firstly, after preconditioning adMSC with H2O2 and GOx before induced migration (i.e., the start of the scratch assay, setting 1) or their continuous exposure during induced migration (setting 2). We found that both oxidative stress types had a stimulatory effect on adMSC migration and that preconditioning enhanced their capacity to migrate dose-dependently.
Furthermore, the migratory capacity of adMSC was improved by preconditioning with H2O2 rather than GOx. There is evidence that pre-incubation of bone marrow or Decidua Basalis MSC with H2O2 leads to enhanced migration when the migration process is induced without sustained oxidative stress [24,25]. Since the direct influences of H2O2 on the migration of MSC are sparsely studied, conclusions can be drawn from the light treatment of MSC with resulting ROS formation. Light treatment (low-level laser) of MSC induced increased intracellular ROS levels and was found to accelerate MSC’s migration through the extracellular signal-regulated kinases (ERK) 1/2 and focal adhesion kinase (FAK) pathways. Gingival fibroblasts have also been shown to migrate to a greater extent when treated with a blue diode laser. adMSC treated with light of different wavelengths have been shown to stimulate their migration capacities [51]. Considering this evidence and the limited information in the literature, the mechanisms underlying these migration-promoting effects in mesenchymal cells should be further investigated.

3.3. Differentiation of MSC under Oxidative Stress

The differentiation capacity of MSC is another important function in regeneration processes. In our study, all kinds of induced oxidative stress, even at very low concentrations of H2O2 or GOx, resulted in a concentration-dependent decrease in adipogenic and osteogenic differentiation in adMSC. Recent studies have described the influence of ROS on adipogenic or osteogenic differentiation of MSC through the activation or inhibition of the signaling cascade involved in the respective differentiation process [47,52]. Rodrigues et al. showed that ROS could induce the activation of mitogen-activated protein kinase (MAPK) pathways such as c-Jun N-terminal kinase (JNK) and p38MAPK, and ERK in MSC [53]. Atashi et al. (2015) concluded that ROS positively influence adipogenesis in MSC and other adipogenic progenitor cells, whereas osteogenesis is inhibited by increased amounts of ROS [47]. Osteogenic differentiation of bone marrow MSC is shown to be suppressed by oxidative stress upon exposure to H2O2 [26,54]. Oxidative stress is associated with many bone diseases, including osteoporosis, inflammatory joint disease, and impaired healing of fractures [55], and may, therefore, partly explain the development of these diseases.
However, a literature review on the adipogenic differentiation capacity of MSCs under oxidative stress reveals ambiguities, as some studies have reported reduced adipogenic differentiation, which may be related to oxidative stress-induced cell aging and senescence [56,57,58]. It remains unclear whether the restriction of MSC differentiation observed in our study, caused by both types of oxidative stress, is a controlled omission of differentiation or a targeted preservation of the stem cell status. The investigation of further differentiation pathways of oxidatively stressed MSC, e.g., differentiation into myofibroblasts, which can be induced under pro-inflammatory conditions [59], could shed light on this open question.
Ultimately, there is agreement that ROS and oxidative stress have an influence on MSC differentiation. It must be emphasized that all the results have arisen from differently designed in vitro models and the various models used to show apparent differences in their setup. For example, we deliberately omitted pyruvate from our experimental approaches, as the H2O2 is degraded more rapidly by this compound [60]. These differences in the culture methods, such as the composition of the cell culture medium, source of MSC, the timing of stimulation, level of oxidative stress, etc., will have an impact on many cellular dimensions and might explain the inconclusive data situation.
This study extends the current knowledge on the effects of long-term exposure of adMSC to pulsed H2O2 or sustained H2O2 exposure through the enzymatic reaction of GOx, as some differences between these two types of treatment were revealed:
  • Despite nearly equal maximum H2O2 concentrations, direct pulsed exposure of adMSC to H2O2 resulted in significantly higher ROS development compared to sustained GOx-induced H2O2 exposure.
  • Direct pulsed exposure of adMSC to H2O2 showed higher cytotoxicity than sustained GOx-induced H2O2 exposure.
  • Antioxidant enzymes were more abundant during sustained GOx-induced H2O2 exposure.
  • Release of inflammatory factors was higher during pulsed H2O2 exposure.
  • Migratory activity of adMSC was increased by exposure to H2O2 before migration and showed high sensitivity to the degree of oxidative stress since exposure to higher but non-cytotoxic pulsed H2O2 concentrations during migration completely blocked their migratory activity.
  • Both adipogenic and osteogenic differentiation is reduced under all H2O2 exposure conditions.
These results indicate that the direct pulsed H2O2 exposure induces higher oxidative stress in adMSC in vitro than in GOx-induced, sustained H2O2 exposure. This is probably triggered by a better cellular adaptation to the oxidative stress conditions when they are constant. However, patient-specific characteristics, such as age, gender, chronic diseases, and genetic variants might influence the resistance of MSC to oxidative stress [61,62]. These individual characteristics could impact not only the results shown in this study but also the effectiveness of cell therapy. Therefore, further studies are needed to understand the mechanisms underlying the regulation of these functions. Nevertheless, these results are another step towards a broader knowledge of the effects of oxidative stress on adMSC.

4. Materials and Methods

4.1. adMSC Isolation and Cell Culture

Primary human adipose tissue-derived mesenchymal stem/stromal cells (adMSC) were isolated from liposuction tissue of healthy patients with an average age of 50 ± 10 years. The aspirated tissue was transported overnight at room temperature (RT), and the stromal vascular fraction (SVF) was isolated according to a previously described protocol [63]. CD34-positive subpopulation was isolated from SVF based on a standard protocol [64], and CD34-positive cells were seeded in passage 1 with 12 mL of DMEM (Gibco by Life technologies, Paisley, UK) containing 10% FCS (PAN Biotech, Aidenbach, Germany), 1% P/S, and 0.4% GlutaMaxTM (Gibco, by Life technologies, Paisley, UK), hence referred to as the ‘complete culture medium’ and cryopreserved in passage 2 based on the previously described procedure [65]. For all cell culture experiments, adMSC were thawed from passage 2 with a standard laboratory protocol and seeded in a 75 cm2 flask (Greiner Bio-one, Frickenhausen, Germany) [66]. All experiments were carried out in passage 4. Unless otherwise stated, cells were seeded at a density of 20,000 cells/cm2 in plates 4- to 96-well (Greiner Bio-one, Frickenhausen, Germany). DNA staining with DAPI (Sigma Aldrich, Saint Louis, MO, USA) microscopically confirmed the absence of mycoplasma contamination.

4.2. Treatment of adMSC with Oxidative Stressors, H2O2, and GOx

After 72 h of cell cultivation in a complete culture medium without pyruvate, cells were supplemented with H2O2 (30% w/w solution, Sigma Aldrich, Saint Louis, MO, USA) or GOx (Sigma Aldrich, Saint Louis, MO, USA) with a final concentration of 0.01, 0.05, 0.1, 0.25 mM and 0.1, 0.5, 1, 2.5, and 5 mU/mL, respectively. Unless otherwise stated, these were the treatment media used for the experiments. adMSC with media without these oxidative stressors will be referred to as control hereafter. Treatments were repeated every 2–3 days throughout the experiment.

4.3. Extracellular H2O2 and Intracellular ROS

The amount of H2O2 in the treated media was quantified using Amplex UltraRed (Thermo Fischer Scientific, Waltham, MA, USA) according to the manufacturer’s instructions. Complete media treated with different concentrations of H2O2 and GOx were measured for 1 h to 48 h. Relative fluorescent intensity was measured using a microplate reader (TECAN, Männedorf, Switzerland). The H2O2 concentration was calculated using a standard curve.
Intracellular ROS were detected using 2′-7′-dichlorofluorescein diacetate (CM-H2DCFDA, Thermo Fischer Scientific, Waltham, MA, USA) ROS indicator. 72 h after seeding, CM-H2DCFDA was added to the cells as a probe at a final concentration of 10 µM in pre-warmed phosphate-buffered saline (PBS, PAN Biotech, Aidenbach, Germany) without Ca2+ and Mg2+ and incubated at 37 °C for 30 min. After incubation, the fluorescent probe was removed, and the cells were washed with 1 × PBS without Ca2+ and Mg2+. Finally, cells were exposed to different concentrations of H2O2 and GOx, as described above, whereas cell cultures without treatment served as controls. Intracellular ROS accumulation was measured using a microplate reader (TECAN, Männedorf, Switzerland). Fluorescence was quantified at 492 nm excitation and 527 nm emission every 10 min for 50 min until saturation was reached. The results were normalized to the cell count to estimate the amount of accumulated ROS per individual cell.

4.4. Cell Number

Quantification of cell number was conducted with Hoechst H33342 (Applichem, Darmstadt, Germany). Cells were first washed with PBS without Ca2+ and Mg2+ and fixed with 4% paraformaldehyde (PFA, Sigma-Aldrich, Saint Louis, MO, USA). Cells were washed three times with PBS without Ca2+ and Mg2+ and incubated with 5 µg/mL Hoechst H33342 for 10 min in the dark, and the washing step was repeated. Images were acquired using the Hermes WiScan system (IDEA Bio-Medical, Rehovot, Israel) and analyzed using the Athena software (IDEA Bio-Medical, Rehovot, Israel). The total number of nuclei and the average and standard deviation of triplicates for each treatment were calculated for the cell number. This process was also performed on days 1, 3, and 7.

4.5. Metabolic Activity

The metabolic activity of adMSC was determined with the CellTiter 96 Aqueous One Solution Cell Proliferation Assay (MTS, Promega, Madison, WI, USA) on days 1, 3, and 7 after treatment, according to the manufacturer’s instructions. For this purpose, the cells were incubated with the MTS solution for 1.5 h, using the MTS solution without cells as a blank. Afterward, the supernatant and the blank were transferred into an ELISA reading plate (Greiner Bio-one, Frickenhausen, Germany), and the absorbance was measured in a microplate reader (TECAN, Männedorf, Switzerland) at an absorbance wavelength of 490 nm (reference wavelength 620 nm).

4.6. Cell Stress-Related Proteins

4.6.1. Cell Stress

26 cell stress-related proteins (Table S1) were detected using their respective antibodies coated on the membrane from human cell stress array kit (R & D Systems, Minneapolis, MN, USA). For this, cells were treated with 0.05, 0.1 mM H2O2, and 2.5 mU/mL GOx for 24 and 48 h. The cell supernatants were then collected and stored at −80 °C for further cytokines analyses. Whereas cells were lysed for 30 min at 4 °C with a lysis buffer containing a cocktail of protease inhibitors (10 μg/mL Aprotinin, Leupeptin, and Pepstatin, respectively; all from R & D System, Minneapolis, MN, USA). The lysates were centrifuged at 14,000× g for 5 min at 4 °C. For each analysis, 250 µg of protein was pooled from the lysates of 5 individuals. Cell stress-related proteins were detected using the kit according to the manufacturer’s instructions. For this, chemiluminescence blots were recorded with ChemiDoc XRS (Bio-Rad Laboratories GmbH, Munich, Germany), and protein intensity was quantified by densitometric analysis of the blot using the Image Lab 3.0.1 software (Bio-Rad, Laboratories GmbH, Munich, Germany).

4.6.2. Proinflammatory Cytokines

For the determination of pro-inflammatory cytokines, IL-8 ELISA and NF-ҡB translocation were performed.
For the IL-8, the previously processed cell supernatants were used and analyzed with the ELISA (R&D System, Minneapolis, MN, USA) according to the manufacturer’s instructions. The measured IL-8 concentration in pg/mL was normalized to the concentration of the lysates for each treatment.
NF-ҡB nuclear translocation was determined after 8 and 24 h treatment with the same concentrations of H2O2 (0.05, 0.1 mM) and GOx (2.5 mU/mL). As a positive control, adMSC incubated with 50 ng/mL TNFα (Proteintech, Rosemont, IL, USA) for 30 min was included. Cells were then fixed with 4% PFA, and NF-ҡB antibody staining (Cell Signaling, Danvers, MA, USA) was performed according to the manufacturer’s instructions. The cell nuclei were stained with Hoechst H33342, as previously described. After staining, imaging was performed using the Hermes WiScan microscope (IDEA Bio-Medical, Rehovot, Israel). NF-ҡB translocation was quantified by the fluorescence intensity of the nuclei using Athena software (IDEA Bio-Medical, Rehovot, Israel). The average intensity of the nuclei was calculated from the sum of all mean intensities divided by the number of nuclei measured.

4.6.3. Adipokines

The previously processed cell supernatants were used for the detection of 58 different obesity-related adipokines (Table S2) with a Proteome Profiler Human Adipokine Array Kit (R & D Systems, Minneapolis, MN, USA). 500 µL of supernatants were pooled from 5 individuals. Adipokines were detected using the kit according to the manufacturer’s instructions. For this, chemiluminescence blots were recorded with ChemiDoc XRS (Bio-Rad Laboratories GmbH, Munich, Germany), and the protein intensity was quantified by densitometric analysis of the blot using the Image Lab 3.0.1 software.

4.7. Intracellular Basal Calcium Levels

The intracellular basal Ca2+ levels were determined via flow cytometry by staining the cells with 5 µM Fluo-3-acetoxymethyl ester AM (fluo-3/AM) calcium indicator (Life Technologies Corporation, Eugene, OR, USA). For this approach, cells were first seeded in a 24-well plate and treated with 0.01, 0.05, 0.1, 0.25 mM H2O2 and 0.1, 0.5, 1, 2.5, and 5 mU/mL GOx for 24 h. After treatment with the stressors, the cells were washed, trypsinized, and the cell suspension was recovered in the FACS tube (BD Biosciences, Franklin Lakes, NJ, USA). The intracellular basal Ca2+ level was determined according to a previously published protocol [67]. CellQuest Pro 4.0.1 software (BD Biosciences, Franklin Lakes, NJ, USA) was used for data acquisition and analyses of the results.

4.8. Determination of Cell Migration

Cell migration was investigated with a scratch assay. Cells were seeded at 29,000 cells/cm2 in a 96-well plate to achieve complete cell spreading and an almost 100% confluent monolayer. 24 h after seeding, the medium was replaced with a complete culture medium, without phenol red diluted with a red cell tracking dye, DMSO free (Abcam, Cambridge, UK) according to the manufacturer’s instructions. The cells were divided into two settings according to their experimental arrangement. 72 h after seeding, the cells were incubated with 0.01, 0.05, and 0.1 mM H2O2 and 0.1, 0.5, 1, and 2.5 mU/mL GOx.
The first settings consisted of cells preconditioned for 24 h with H2O2 and GOx. Afterward, the confluent monolayer was scratched with an Incucyte® Woundmaker (Sartorius, Göttingen, Germany). The cells were washed three times with PBS without Ca2+ and Mg2+, and the media were replaced with supplemented low serum media (1% FCS) without pyruvate to limit the proliferation factor. Live-cell imaging was observed immediately after scratch using the Hermes WiScan system (IDEA Bio-Medical, Rehovot, Israel) at 10-fold magnification in a humidified atmosphere with 37 °C and 5% CO2 for 20 h. Quantification of the wound area was performed using Fiji ImageJ software version 1.8.0_72 [68], and the percentage of wound closure was calculated by the following formula:
(initial wound area − final wound area)/initial wound area × 100%.
The second setting was 2 h preconditioned adMSC and 15 h in treatment. The cells were incubated with the same concentrations of H2O2 and GOx described above for 2 h. Subsequently, the scratch was made, and the cells were treated again with the same concentrations of H2O2 and GOx in the supplemented media, with 10% FCS without pyruvate. Imaging was performed immediately after the scratch and continued for 15 h.

4.9. Differentiation of the adMSC

4.9.1. Quantification of Cell Number

The cell number of adipogenically differentiated cells was determined 14 days after stimulation and of osteogenically differentiated cells, 14, 21, and 28 days after stimulation. Quantification of cell number was performed using crystal violet staining, as previously described [64].

4.9.2. Quantification of Metabolic Activity

In addition, an MTS assay was conducted on the days mentioned above to check the metabolic activity of the cells and was carried out as previously described.

4.9.3. Adipogenic Differentiation

To observe the effect of oxidative stress on adipogenic differentiation, cells were treated with 0.01, 0.05, and 0.1 mM H2O2 and 0.1, 0.5, 1, 2.5, and 5 mU/mL GOx. The procedure of adipogenic differentiation was performed based on a previously published protocol [69]. The cells were divided into two groups, the first group being the unstimulated (US) adMSC, in which the above-defined concentrations of H2O2 and GOx were added to the medium. In contrast, cells without treatment served as controls (US control). The second group was the adipogenically stimulated (AS) adMSC, in which the adipogenic media (containing 1 µM dexamethasone, 500 µM 3-isobutyl-1-methylxanthine, 200 µM indomethacin, and 10 µM insulin; all from Sigma-Aldrich, Saint Louis, MO, USA) was added to the cells. At the same time, they were simultaneously treated with the above-defined concentrations of H2O2 and GOx, and the control cells (AS control) without treatment. After 14 days of stimulation and treatment, adipogenic differentiation was determined by Bodipy staining, as previously described [69].

4.9.4. Osteogenic Differentiation

The osteogenic differentiation capacity was determined by quantifying the enzyme alkaline phosphatase (ALP) activity. Stimulation of osteogenesis was realized by replacing the medium every 2–3 days and simultaneous repeated treatment with the stressors. The cells were divided into two groups, the first group being the unstimulated (US) adMSC, in which the above-defined concentrations of H2O2 and GOx were added to the medium. Cells without treatment served as controls (US control). The second group was the osteogenically stimulated (OS) adMSC, in which the osteogenic media (containing 0.25 g/L, ascorbic acid, 1 µM dexamethasone, and 10 mM β-glycerolphosphate; all from Sigma-Aldrich Saint Louis, MO, USA) was added to the cells. At the same time, they were simultaneously treated with the above-defined concentrations of H2O2 and GOx, and the control cells (OS control) without treatment. ALP quantification was carried out according to a previously established protocol [69] and was performed after 14, 21, and 28 days of stimulation and treatment. For visual analysis, cells were stained with a solution of 67 mM 2-Amino-2-methyl-1.3-propanediol, 2.7 mM Naphthol AS-MX phosphate, and 2.7 mM Fast Red Violet LB Salt (all from Sigma Aldrich, Saint Louis, MO, USA) in H2O according to a protocol published [69], and imaged using a Zeiss Microscope (Zeiss, Oberkochen, Germany).

4.10. Data and Statistical Analysis

All experiments were performed independently on cells from five or more different donors, each in triplicates, and the mean of each triplicate was used for one individual. Data were visualized and statistically analyzed with Microsoft Excel 2010 (Microsoft, Redmond, WA) and GraphPad Prism, Version 6.05 (GraphPad Software Inc., San Diego, CA, USA). Data were presented as bars with standard deviations and boxplots. The horizontal line within the box plot indicates the median, with whiskers showing the minimum and maximum data points. The statistical significance of the data set was calculated using a two-way analysis of variance, followed by Dunnett’s multiple comparison tests, and the level of significance was set to a p-value of 0.05.

4.11. Ethical Statement

All tissue samples analyzed for this experiment were collected with the patient’s consent. The use of the tissue samples was approved by the local ethics committee under registration A2019-0107.

Supplementary Materials

The supporting information can be downloaded at: https://www.mdpi.com/article/10.3390/ijms232113435/s1.

Author Contributions

Conceptualization, O.H., G.K. and K.P.; methodology, T.O.W., O.H., K.S. and C.M.; software, T.O.W., O.H. and K.S.; validation, T.O.W., O.H. and K.S.; formal analysis, T.O.W., O.H. and K.S.; investigation, T.O.W., O.H., K.S. and K.P.; resources, K.P.; data curation, T.O.W. and O.H.; writing, T.O.W., O.H. and K.P.; writing—review and editing, T.O.W., O.H., K.S., C.M., G.K. and K.P.; visualization, T.O.W., O.H. and K.P.; supervision, O.H. and K.P.; project administration, K.P.; funding acquisition, K.P. All authors have read and agreed to the published version of the manuscript.

Funding

This work was financially supported by the European Union and the Federal State Mecklenburg-Vorpommern (“ActiHeal”, EFRE Project-No. TBI-V-1-336-VBW-116) and the EuroTransBio (ETB) project “ASCaffolds” (Project-No. 031A244C).

Institutional Review Board Statement

The use of the tissue samples was approved by the local ethics committee under registration A2019-0107.

Informed Consent Statement

All tissue samples analyzed for this experiment were collected with the patient’s consent.

Data Availability Statement

The data presented in this study are available in the article and supplementary materials.

Acknowledgments

We gratefully acknowledge Klaus Ueberreiter (Parkklinik Birkenwerder, Germany) and his patients for kindly providing liposuction tissue, and Nina Gehm for the technical assistance.

Conflicts of Interest

The authors declare no conflict of interest.

References

  1. Gupta, S.C.; Hevia, D.; Patchva, S.; Park, B.; Koh, W.; Aggarwal, B.B. Upsides and Downsides of Reactive Oxygen Species for Cancer: The Roles of Reactive Oxygen Species in Tumorigenesis, Prevention, and Therapy. Antioxid. Redox Signal. 2012, 16, 1295–1322. [Google Scholar] [CrossRef] [PubMed] [Green Version]
  2. Kalogeris, T.; Bao, Y.; Korthuis, R.J. Mitochondrial Reactive Oxygen Species: A Double Edged Sword in Ischemia/Reperfusion vs Preconditioning. Redox Biol. 2014, 2, 702–714. [Google Scholar] [CrossRef] [PubMed] [Green Version]
  3. Chatterjee, S. Oxidative Stress, Inflammation, and Disease. In Oxidative Stress and Biomaterials; Elsevier: Amsterdam, The Netherlands, 2016; pp. 35–58. ISBN 9780128032701. [Google Scholar]
  4. Redza-Dutordoir, M.; Averill-Bates, D.A. Activation of Apoptosis Signalling Pathways by Reactive Oxygen Species. Biochim. Biophys. Acta-Mol. Cell Res. 2016, 1863, 2977–2992. [Google Scholar] [CrossRef] [PubMed]
  5. Ali, S.S.; Ahsan, H.; Zia, M.K.; Siddiqui, T.; Khan, F.H. Understanding Oxidants and Antioxidants: Classical Team with New Players. J. Food Biochem. 2020, 44, 1–13. [Google Scholar] [CrossRef]
  6. Birben, E.; Sahiner, U.M.; Sackesen, C.; Erzurum, S.; Kalayci, O. Oxidative Stress and Antioxidant Defense. World Allergy Organ. J. 2012, 5, 9–19. [Google Scholar] [CrossRef] [Green Version]
  7. Poljsak, B.; Šuput, D.; Milisav, I. Achieving the Balance between ROS and Antioxidants: When to Use the Synthetic Antioxidants. Oxid. Med. Cell. Longev. 2013, 2013, 956792. [Google Scholar] [CrossRef] [PubMed]
  8. Trachootham, D.; Lu, W.; Ogasawara, M.A.; Valle, N.R.-D.; Huang, P. Redox Regulation of Cell Survival. Antioxid. Redox Signal. 2008, 10, 1343–1374. [Google Scholar] [CrossRef] [Green Version]
  9. Tavassolifar, M.J.; Vodjgani, M.; Salehi, Z.; Izad, M. The Influence of Reactive Oxygen Species in the Immune System and Pathogenesis of Multiple Sclerosis. Autoimmune Dis. 2020, 2020, 5793817. [Google Scholar] [CrossRef]
  10. Schilrreff, P.; Alexiev, U. Chronic Inflammation in Non-Healing Skin Wounds and Promising Natural Bioactive Compounds Treatment. Int. J. Mol. Sci. 2022, 23, 4928. [Google Scholar] [CrossRef]
  11. Raziyeva, K.; Kim, Y.; Zharkinbekov, Z.; Kassymbek, K.; Jimi, S.; Saparov, A. Immunology of Acute and Chronic Wound Healing. Biomolecules 2021, 11, 700. [Google Scholar] [CrossRef]
  12. Aghasafari, P.; George, U.; Pidaparti, R. A Review of Inflammatory Mechanism in Airway Diseases. Inflamm. Res. 2019, 68, 59–74. [Google Scholar] [CrossRef] [PubMed]
  13. Kajdaniuk, D.; Marek, B.; Borgiel-Marek, H.; Kos-Kudła, B. Transforming Growth Factor Beta1 (TGFbeta1) in Physiology and Pathology. Endokrynol. Pol. 2013, 64, 384–396. [Google Scholar] [CrossRef] [PubMed] [Green Version]
  14. Kim, J.; Breunig, M.J.; Escalante, L.E.; Bhatia, N.; Denu, R.A.; Dollar, B.A.; Stein, A.P.; Hanson, S.E.; Naderi, N.; Radek, J.; et al. Biologic and Immunomodulatory Properties of Mesenchymal Stromal Cells Derived from Human Pancreatic Islets. Cytotherapy 2012, 14, 925–935. [Google Scholar] [CrossRef] [PubMed] [Green Version]
  15. Xi, J.; Yan, X.; Zhou, J.; Yue, W.; Pei, X. Mesenchymal Stem Cells in Tissue Repairing and Regeneration: Progress and Future. Burn. Trauma 2013, 1, 13–20. [Google Scholar] [CrossRef]
  16. Girdlestone, J. Mesenchymal Stromal Cells with Enhanced Therapeutic Properties. Immunotherapy 2016, 8, 1405–1416. [Google Scholar] [CrossRef] [Green Version]
  17. Krawczenko, A.; Klimczak, A. Adipose Tissue-Derived Mesenchymal Stem/Stromal Cells and Their Contribution to Angiogenic Processes in Tissue Regeneration. Int. J. Mol. Sci. 2022, 23, 2425. [Google Scholar] [CrossRef]
  18. Dominici, M.; Le Blanc, K.; Mueller, I.; Slaper-Cortenbach, I.; Marini, F.; Krause, D.S.; Deans, R.J.; Keating, A.; Prockop, D.J.; Horwitz, E.M. Minimal Criteria for Defining Multipotent Mesenchymal Stromal Cells. The International Society for Cellular Therapy Position Statement. Cytotherapy 2006, 8, 315–317. [Google Scholar] [CrossRef]
  19. Ceccarelli, S.; Pontecorvi, P.; Anastasiadou, E.; Napoli, C.; Marchese, C. Immunomodulatory Effect of Adipose-Derived Stem Cells: The Cutting Edge of Clinical Application. Front. Cell Dev. Biol. 2020, 8, 236. [Google Scholar] [CrossRef]
  20. Ben-Dov, M.; Nakdimon, I.; Benhamou, M.; Klein, A.; Schwartz, S.; Loewenstein, A.; Barak, A.; Barzelay, A. Regenerative Effect of Adipose Derived Mesenchymal Stem Cell on Ganglion Cells in the Hypoxic Organotypic Retina Culture. Investig. Ophthalmol. Vis. Sci. 2021, 62, 540. [Google Scholar]
  21. Madrigal, M.; Rao, K.S.; Riordan, N.H. A Review of Therapeutic Effects of Mesenchymal Stem Cell Secretions and Induction of Secretory Modification by Different Culture Methods. J. Transl. Med. 2014, 12, 260. [Google Scholar] [CrossRef] [Green Version]
  22. Chen, C.; Tang, Q.; Zhang, Y.; Dai, M.; Jiang, Y.; Wang, H.; Yu, M.; Jing, W.; Tian, W. Metabolic Reprogramming by HIF-1 Activation Enhances Survivability of Human Adipose-Derived Stem Cells in Ischaemic Microenvironments. Cell Prolif. 2017, 50, e12363. [Google Scholar] [CrossRef] [PubMed]
  23. Abbasi-Malati, Z.; Roushandeh, A.M.; Kuwahara, Y.; Roudkenar, M.H. Mesenchymal Stem Cells on Horizon: A New Arsenal of Therapeutic Agents. Stem Cell Rev. Rep. 2018, 14, 484–499. [Google Scholar] [CrossRef]
  24. Khatlani, T.; Algudiri, D.; Alenzi, R.; Al Subayyil, A.M.; Abomaray, F.M.; Bahattab, E.; AlAskar, A.S.; Kalionis, B.; El-Muzaini, M.F.; Abumaree, M.H. Preconditioning by Hydrogen Peroxide Enhances Multiple Properties of Human Decidua Basalis Mesenchymal Stem/Multipotent Stromal Cells. Stem Cells Int. 2018, 2018, 6480793. [Google Scholar] [CrossRef] [PubMed] [Green Version]
  25. Li, S.; Deng, Y.; Feng, J.; Ye, W. Oxidative Preconditioning Promotes Bone Marrow Mesenchymal Stem Cells Migration and Prevents Apoptosis. Cell Biol. Int. 2009, 33, 411–418. [Google Scholar] [CrossRef] [PubMed]
  26. Saleem, R.; Mohamed-Ahmed, S.; Elnour, R.; Berggreen, E.; Mustafa, K.; Al-Sharabi, N. Conditioned Medium from Bone Marrow Mesenchymal Stem Cells Restored Oxidative Stress-Related Impaired Osteogenic Differentiation. Int. J. Mol. Sci. 2021, 22, 13458. [Google Scholar] [CrossRef] [PubMed]
  27. Winterbourn, C.C.; Hampton, M.B. Thiol Chemistry and Specificity in Redox Signaling. Free Radic. Biol. Med. 2008, 45, 549–561. [Google Scholar] [CrossRef] [PubMed]
  28. Andrés, C.M.C.; Pérez de la Lastra, J.M.; Juan, C.A.; Plou, F.J.; Pérez-Lebeña, E. Chemistry of Hydrogen Peroxide Formation and Elimination in Mammalian Cells, and Its Role in Various Pathologies. Stresses 2022, 2, 256–274. [Google Scholar] [CrossRef]
  29. Deptuła, M.; Brzezicka, A.; Skoniecka, A.; Zieliński, J.; Pikuła, M. Adipose-Derived Stromal Cells for Nonhealing Wounds: Emerging Opportunities and Challenges. Med. Res. Rev. 2021, 41, 2130–2171. [Google Scholar] [CrossRef]
  30. Dunnill, C.; Patton, T.; Brennan, J.; Barrett, J.; Dryden, M.; Cooke, J.; Leaper, D.; Georgopoulos, N.T. Reactive Oxygen Species (ROS) and Wound Healing: The Functional Role of ROS and Emerging ROS-Modulating Technologies for Augmentation of the Healing Process. Int. Wound J. 2017, 14, 89–96. [Google Scholar] [CrossRef]
  31. Bankar, S.B.; Bule, M.V.; Singhal, R.S.; Ananthanarayan, L. Glucose Oxidase—An Overview. Biotechnol. Adv. 2009, 27, 489–501. [Google Scholar] [CrossRef]
  32. Guillamat-Prats, R. The Role of MSC in Wound Healing, Scarring and Regeneration. Cells 2021, 10, 1729. [Google Scholar] [CrossRef] [PubMed]
  33. Latifi-Pupovci, H.; Kuçi, Z.; Wehner, S.; Bönig, H.; Lieberz, R.; Klingebiel, T.; Bader, P.; Kuçi, S. In Vitro Migration and Proliferation (“wound Healing”) Potential of Mesenchymal Stromal Cells Generated from Human CD271+ Bone Marrow Mononuclear Cells. J. Transl. Med. 2015, 13, 315. [Google Scholar] [CrossRef] [PubMed] [Green Version]
  34. Bedard, K.; Krause, K.-H. The NOX Family of ROS-Generating NADPH Oxidases: Physiology and Pathophysiology. Physiol. Rev. 2007, 87, 245–313. [Google Scholar] [CrossRef] [PubMed]
  35. Krasilnikova, O.A.; Baranovskii, D.S.; Lyundup, A.V.; Shegay, P.V.; Kaprin, A.D.; Klabukov, I.D. Stem and Somatic Cell Monotherapy for the Treatment of Diabetic Foot Ulcers: Review of Clinical Studies and Mechanisms of Action. Stem Cell Rev. Reports 2022, 18, 1974–1985. [Google Scholar] [CrossRef]
  36. Sharma, P.; Jha, A.B.; Dubey, R.S.; Pessarakli, M. Reactive Oxygen Species, Oxidative Damage, and Antioxidative Defense Mechanism in Plants under Stressful Conditions. J. Bot. 2012, 2012, 217037. [Google Scholar] [CrossRef] [Green Version]
  37. Rochette, L.; Mazini, L.; Malka, G.; Zeller, M.; Cottin, Y.; Vergely, C. The Crosstalk of Adipose-Derived Stem Cells (ADSC), Oxidative Stress, and Inflammation in Protective and Adaptive Responses. Int. J. Mol. Sci. 2020, 21, 9262. [Google Scholar] [CrossRef]
  38. Wu, Y.; Chen, L.; Scott, P.G.; Tredget, E.E. Mesenchymal Stem Cells Enhance Wound Healing Through Differentiation and Angiogenesis. Stem Cells 2007, 25, 2648–2659. [Google Scholar] [CrossRef] [Green Version]
  39. Shin, L.; Peterson, D.A. Human Mesenchymal Stem Cell Grafts Enhance Normal and Impaired Wound Healing by Recruiting Existing Endogenous Tissue Stem/Progenitor Cells. Stem Cells Transl. Med. 2013, 2, 33–42. [Google Scholar] [CrossRef]
  40. Isakson, M.; de Blacam, C.; Whelan, D.; McArdle, A.; Clover, A.J.P. Mesenchymal Stem Cells and Cutaneous Wound Healing: Current Evidence and Future Potential. Stem Cells Int. 2015, 2015, 831095. [Google Scholar] [CrossRef] [Green Version]
  41. Guo, L.; Du, J.; Yuan, D.; Zhang, Y.; Zhang, S.; Zhang, H.; Mi, J.; Ning, Y.; Chen, M.; Wen, D.; et al. Optimal H2O2 Preconditioning to Improve Bone Marrow Mesenchymal Stem Cells’ Engraftment in Wound Healing. Stem Cell Res. Ther. 2020, 11, 434. [Google Scholar] [CrossRef]
  42. Hu, C.; Li, L. Preconditioning Influences Mesenchymal Stem Cell Properties in Vitro and in Vivo. J. Cell. Mol. Med. 2018, 22, 1428–1442. [Google Scholar] [CrossRef] [PubMed]
  43. Garrido-Pascual, P.; Alonso-Varona, A.; Castro, B.; Burón, M.; Palomares, T. H2O2-Preconditioned Human Adipose-Derived Stem Cells (HC016) Increase Their Resistance to Oxidative Stress by Overexpressing Nrf2 and Bioenergetic Adaptation. Stem Cell Res. Ther. 2020, 11, 335. [Google Scholar] [CrossRef] [PubMed]
  44. Wang, L.; Zhang, F.; Peng, W.; Zhang, J.; Dong, W.; Yuan, D.; Wang, Z.; Zheng, Y. Preincubation with a Low-Dose Hydrogen Peroxide Enhances Anti-Oxidative Stress Ability of BMSCs. J. Orthop. Surg. Res. 2020, 15, 392. [Google Scholar] [CrossRef]
  45. Kwakman, P.H.S.; Zaat, S.A.J. Antibacterial Components of Honey. IUBMB Life 2012, 64, 48–55. [Google Scholar] [CrossRef] [PubMed]
  46. Zhang, J.; Wang, X.; Vikash, V.; Ye, Q.; Wu, D.; Liu, Y.; Dong, W. ROS and ROS-Mediated Cellular Signaling. Oxid. Med. Cell. Longev. 2016, 2016, 4350965. [Google Scholar] [CrossRef] [PubMed] [Green Version]
  47. Atashi, F.; Modarressi, A.; Pepper, M.S. The Role of Reactive Oxygen Species in Mesenchymal Stem Cell Adipogenic and Osteogenic Differentiation: A Review. Stem Cells Dev. 2015, 24, 1150–1163. [Google Scholar] [CrossRef] [Green Version]
  48. Ikwegbue, P.C.; Masamba, P.; Oyinloye, B.E.; Kappo, A.P. Roles of Heat Shock Proteins in Apoptosis, Oxidative Stress, Human Inflammatory Diseases, and Cancer. Pharmaceuticals 2017, 11, 2. [Google Scholar] [CrossRef] [Green Version]
  49. Borodkina, A.V.; Shatrova, A.N.; Deryabin, P.I.; Griukova, A.A.; Abushik, P.A.; Antonov, S.M.; Nikolsky, N.N.; Burova, E.B. Calcium Alterations Signal Either to Senescence or to Autophagy Induction in Stem Cells upon Oxidative Stress. Aging (Albany. NY) 2016, 8, 3400–3418. [Google Scholar] [CrossRef] [Green Version]
  50. Görlach, A.; Bertram, K.; Hudecova, S.; Krizanova, O. Calcium and ROS: A Mutual Interplay. Redox Biol. 2015, 6, 260–271. [Google Scholar] [CrossRef] [Green Version]
  51. Crous, A.; Jansen van Rensburg, M.; Abrahamse, H. Single and Consecutive Application of Near-Infrared and Green Irradiation Modulates Adipose Derived Stem Cell Proliferation and Affect Differentiation Factors. Biochimie 2022, 196, 225–233. [Google Scholar] [CrossRef]
  52. James, A.W. Review of Signaling Pathways Governing MSC Osteogenic and Adipogenic Differentiation. Scientifica (Cairo) 2013, 2013, 684736. [Google Scholar] [CrossRef] [PubMed]
  53. Rodrigues, M.; Turner, O.; Stolz, D.; Griffith, L.G.; Wells, A. Production of Reactive Oxygen Species by Multipotent Stromal Cells/Mesenchymal Stem Cells upon Exposure to Fas Ligand. Cell Transplant. 2012, 21, 2171–2187. [Google Scholar] [CrossRef] [PubMed] [Green Version]
  54. Liu, A.-L.; Zhang, Z.-M.; Zhu, B.-F.; Liao, Z.-H.; Liu, Z. Metallothionein Protects Bone Marrow Stromal Cells against Hydrogen Peroxide-Induced Inhibition of Osteoblastic Differentiation. Cell Biol. Int. 2004, 28, 905–911. [Google Scholar] [CrossRef] [PubMed]
  55. Philippe, C.; Wittrant, Y. Oxidative Stress in Musculoskeletal Disorders—Bone Disease. In Systems Biology of Free Radicals and Antioxidants; Springer: Berlin/Heidelberg, Germany, 2012; pp. 2951–2959. ISBN 9783642300189. [Google Scholar]
  56. Wagner, W.; Horn, P.; Castoldi, M.; Diehlmann, A.; Bork, S.; Saffrich, R.; Benes, V.; Blake, J.; Pfister, S.; Eckstein, V.; et al. Replicative Senescence of Mesenchymal Stem Cells: A Continuous and Organized Process. PLoS ONE 2008, 3, e2213. [Google Scholar] [CrossRef] [Green Version]
  57. Digirolamo, C.M.; Stokes, D.; Colter, D.; Phinney, D.G.; Class, R.; Prockop, D.J. Propagation and Senescence of Human Marrow Stromal Cells in Culture: A Simple Colony-Forming Assay Identifies Samples with the Greatest Potential to Propagate and Differentiate. Br. J. Haematol. 1999, 107, 275–281. [Google Scholar] [CrossRef]
  58. Alt, E.U.; Senst, C.; Murthy, S.N.; Slakey, D.P.; Dupin, C.L.; Chaffin, A.E.; Kadowitz, P.J.; Izadpanah, R. Aging Alters Tissue Resident Mesenchymal Stem Cell Properties. Stem Cell Res. 2012, 8, 215–225. [Google Scholar] [CrossRef] [Green Version]
  59. Qin, L.; Liu, N.; Bao, C.-M.; Yang, D.-Z.; Ma, G.-X.; Yi, W.-H.; Xiao, G.-Z.; Cao, H.-L. Mesenchymal Stem Cells in Fibrotic Diseases—the Two Sides of the Same Coin. Acta Pharmacol. Sin. 2022. [Google Scholar] [CrossRef]
  60. Babich, H.; Liebling, E.J.; Burger, R.F.; Zuckerbraun, H.L.; Schuck, A.G. Choice of DMEM, Formulated with or without Pyruvate, Plays an Important Role in Assessing the in Vitro Cytotoxicity of Oxidants and Prooxidant Nutraceuticals. Vitr. Cell. Dev. Biol.-Anim. 2009, 45, 226–233. [Google Scholar] [CrossRef]
  61. Kizilay Mancini, Ö.; Lora, M.; Shum-Tim, D.; Nadeau, S.; Rodier, F.; Colmegna, I. A Proinflammatory Secretome Mediates the Impaired Immunopotency of Human Mesenchymal Stromal Cells in Elderly Patients with Atherosclerosis. Stem Cells Transl. Med. 2017, 6, 1132–1140. [Google Scholar] [CrossRef]
  62. Fonteneau, G.; Bony, C.; Goulabchand, R.; Maria, A.T.J.; Le Quellec, A.; Rivière, S.; Jorgensen, C.; Guilpain, P.; Noël, D. Serum-Mediated Oxidative Stress from Systemic Sclerosis Patients Affects Mesenchymal Stem Cell Function. Front. Immunol. 2017, 8, 988. [Google Scholar] [CrossRef] [Green Version]
  63. Peters, K.; Salamon, A.; Van Vlierberghe, S.; Rychly, J.; Kreutzer, M.; Neumann, H.-G.; Schacht, E.; Dubruel, P. A New Approach for Adipose Tissue Regeneration Based on Human Mesenchymal Stem Cells in Contact to Hydrogels-an In Vitro Study. Adv. Eng. Mater. 2009, 11, B155–B161. [Google Scholar] [CrossRef]
  64. Fiedler, T.; Salamon, A.; Adam, S.; Herzmann, N.; Taubenheim, J.; Peters, K. Impact of Bacteria and Bacterial Components on Osteogenic and Adipogenic Differentiation of Adipose-Derived Mesenchymal Stem Cells. Exp. Cell Res. 2013, 319, 2883–2892. [Google Scholar] [CrossRef] [PubMed]
  65. Hahn, O.; Ingwersen, L.-C.; Soliman, A.; Hamed, M.; Fuellen, G.; Wolfien, M.; Scheel, J.; Wolkenhauer, O.; Koczan, D.; Kamp, G.; et al. TGF-SS1 Induces Changes in the Energy Metabolism of White Adipose Tissue-Derived Human Adult Mesenchymal Stem/Stromal Cells In Vitro. Metabolites 2020, 10, 59. [Google Scholar] [CrossRef] [PubMed] [Green Version]
  66. Klemenz, A.C.; Meyer, J.; Ekat, K.; Bartels, J.; Traxler, S.; Schubert, J.K.; Kamp, G.; Miekisch, W.; Peters, K. Differences in the Emission of Volatile Organic Compounds (Vocs) between Non-Differentiating and Adipogenically Differentiating Mesenchymal Stromal/Stem Cells from Human Adipose Tissue. Cells 2019, 8, 697. [Google Scholar] [CrossRef] [PubMed] [Green Version]
  67. Staehlke, S.; Koertge, A.; Nebe, B. Intracellular Calcium Dynamics Dependent on Defined Microtopographical Features of Titanium. Biomaterials 2015, 46, 48–57. [Google Scholar] [CrossRef] [PubMed]
  68. Rueden, C.T.; Schindelin, J.; Hiner, M.C.; DeZonia, B.E.; Walter, A.E.; Arena, E.T.; Eliceiri, K.W. ImageJ2: ImageJ for the next Generation of Scientific Image Data. BMC Bioinformatics 2017, 18, 529. [Google Scholar] [CrossRef] [PubMed] [Green Version]
  69. Meyer, J.; Salamon, A.; Herzmann, N.; Adam, S.; Kleine, H.-D.; Matthiesen, I.; Ueberreiter, K.; Peters, K. Isolation and Differentiation Potential of Human Mesenchymal Stem Cells From Adipose Tissue Harvested by Water Jet-Assisted Liposuction. Aesthetic Surg. J. 2015, 35, 1030–1039. [Google Scholar] [CrossRef]
Figure 1. Quantification of H2O2 in the cell culture medium and analysis of the formation of intracellular ROS. (A) Quantification of H2O2 in the cell culture medium treated with different concentrations of H2O2 and GOx for 1 and 24 h. (B) Intracellular ROS levels were quantified after treatment with different concentrations of H2O2 and (C) GOx for 50 min (data presented as bar graphs for H2O2 concentration measured from the fluorescent intensity with Amplex UltraRed, and ROS measured from relative fluorescence intensity normalized to cell count with CM-H2DCFDA ROS indicator, n = 5, mean and standard deviation of the mean, significance compared to the respective control, two-way ANOVA with Dunnett’s multiple comparison test, * p < 0.05, ** p < 0.001).
Ijms 23 13435 g001
Figure 2. The effect of H2O2 and GOx on (A) cell numbers and (B) metabolic activity after day 1 and day 7 of repeated treatment; ((A) cell number analyzed by quantification of nuclei upon staining with Hoechst H33342, (B) metabolic activity quantified by MTS conversion assay). The data set was normalized to the control on day 1 after the treatment; (n = 6, significance compared to the control group on the respective days of the treatment, two-way ANOVA with Dunnett’s multiple comparison test, * p < 0.05, ** p < 0.001).
Ijms 23 13435 g002
Figure 3. Analysis of human cell stress proteins. adMSC were treated with 0.05 and 0.1 mM H2O2, or 2.5 mU/mL GOx, respectively. adMSC lysates after 24 h of treatment were analyzed with ‘Proteome Profiler Human Cell Stress Array Kit’ (pixel intensity of the protein spots quantified by densitometry analysis using the Image Lab 3.0.1 software; n = 5, significance compared to the control, 2-way ANOVA with Dunnett’s multiple comparison test, * p < 0.05, ** p < 0.001).
Ijms 23 13435 g003
Figure 4. Inflammation-related signaling upon treatment of adMSC with 0.05, 0.1 mM H2O2, and 2.5 mU/mL GOx. (A) Quantification of IL-8 releases into the supernatant (analysis by enzyme-linked immunosorbent assay, ELISA). (B) Quantification of nuclear translocation of NF-ҡB normalized to cell number (analysis of nuclei fluorescence by Athena software). (C) Intracellular Ca2+ level detection with the fluo-3/AM calcium indicator (analysis by flow cytometry). (D) Depiction of differentially released adipokines with ‘Human Adipokine Array Kit’ (pixel intensities were quantified by densitometry using the Image Lab 3.0.1 software, n = 5, significance compared to the control, two-way ANOVA with Dunnett’s multiple comparison test, * p < 0.05, ** p < 0.001).
Ijms 23 13435 g004
Figure 5. Migratory capacity of adMSC tested by the scratch assay. (A) Fluorescent depiction of adMSC preconditioned with H2O2 and GOx for 24 h in the scratch area (referred to as setting 1: cell staining was with cell tracking red dye, scale bar: 50 µm), and imaging at an initial time point, 0 h, and 20 h after scratching. (B) Quantification of wound closure after cells were preconditioned 24 h with H2O2 and GOx before scratch, and no incubation with H2O2 and GOx during migration (setting one); (C) adMSC preconditioned 2 h before scratch and exposed to H2O2 and GOx during migration (setting two). % wound closure normalized to the control; (n = 5, significance compared to the control, two-way ANOVA with Dunnett’s multiple comparison test, * p < 0.05, ** p < 0.001).
Ijms 23 13435 g005
Figure 6. Adipogenic differentiation in oxidatively stressed adMSC after 14 days. (A) Quantification of relative cell number in adipogenic stimulated (AS) adMSC (quantified with crystal violet staining) and (B) metabolic activity (quantified by MTS conversion assay related to the cell amount). (C) Fluorescent depiction of accumulated lipid in unstimulated (US) control cultures, adipogenic stimulated control cultures, and adipogenically stimulated and oxidatively stressed adMSC treated with 0.01 and 0.05 mM H2O2, and 0.1 and 5 mU/mL GOx, respectively; (nuclei stained with Hoechst H33342, lipid accumulation stained with Bodipy, representative images, scale bar: 50 µm). (D) Quantification of fluorescence intensity of the lipid staining after 14 days of stimulation and repeated treatments with different concentrations of H2O2 and GOx (normalized values to unstimulated control; n = 5, significance compared to the stimulated control, two-way ANOVA with Dunnett’s multiple comparison test, * p < 0.05).
Ijms 23 13435 g006aIjms 23 13435 g006b
Figure 7. Osteogenic differentiation in oxidatively stressed adMSC after 21 days. (A) Quantification of relative cell number in osteogenic stimulated (OS) adMSC (quantified with crystal violet staining) and (B) metabolic activity (quantified by MTS conversion assay related to the cell amount). (C) Microscopic depiction of ALP staining in untreated and unstimulated (US) control, untreated and OS control, OS adMSC treated with 0.01 mM and 0.05 mM H2O2, 0.1 and 5 mU/mL GOx, respectively (representative images, scale bar: 100 µm). (D) Quantification of ALP activity by p-Nitrophenyl Phosphate (pNPP) after 21 days of osteogenic stimulation and repeated treatment with different concentrations of H2O2 and GOx (normalized values to unstimulated control; n = 5, significance compared to the stimulated control; two-way ANOVA with Dunnett’s multiple comparison test, * p < 0.05, ** p < 0.001).
Ijms 23 13435 g007
Publisher’s Note: MDPI stays neutral with regard to jurisdictional claims in published maps and institutional affiliations.