Article

Impact of Ni Content on the Structure and Sonophotocatalytic Activity of Ni-Zn-Co Ferrite Nanoparticles

1
Faculty of Science, Technical University of Cluj-Napoca, 76 Victoriei Street, 430122 Baia Mare, Romania
2
Research Institute for Analytical Instrumentation Subsidiary, National Institute for Research and Development for Optoelectronics INOE 2000, 67 Donath Street, 400293 Cluj-Napoca, Romania
3
Faculty of Chemistry and Chemical Engineering, Babes-Bolyai University, 11 Arany Janos Street, 400028 Cluj-Napoca, Romania
4
National Institute for Research and Development of Isotopic and Molecular Technologies, 67-103 Donath Street, 400293 Cluj-Napoca, Romania
*
Author to whom correspondence should be addressed.
Int. J. Mol. Sci. 2022, 23(22), 14167; https://doi.org/10.3390/ijms232214167
Submission received: 18 October 2022 / Revised: 3 November 2022 / Accepted: 14 November 2022 / Published: 16 November 2022

Abstract

:
The structure, morphology, and sonophotocatalytic activity of Ni-Zn-Co ferrite nanoparticles, embedded in a SiO2 matrix and produced by a modified sol-gel method, followed by thermal treatment, were investigated. The thermal analysis confirmed the formation of metal succinate precursors up to 200 °C, their decomposition to metal oxides and the formation of Ni-Zn-Co ferrites up to 500 °C. The crystalline phases, crystallite size and lattice parameter were determined based on X-ray diffraction patterns. Transmission electron microscopy revealed the shape, size, and distribution pattern of the ferrite nanoparticles. The particle sizes ranged between 34 and 40 nm. All the samples showed optical responses in the visible range. The best sonophotocatalytic activity against the rhodamine B solution under visible irradiation was obtained for Ni0.3Zn0.3Co0.4Fe2O4@SiO2.

1. Introduction

Despite the measures taken to reduce pollution, industrial effluents containing dyes and pigments used in the textile industry often resurface in the surrounding environment. Dyes are complex organic structures with a high resistance to chemical and biological degradation, high water solubility, and have a negative impact on the environment, particularly aquatic ecosystems [1,2]. Therefore, the efficient treatment of industrial effluents and wastewaters containing dyes is crucial for environmental protection.
The photocatalytic degradation of dyes is a simple, cost-effective, and environmentally friendly approach for wastewater treatment as it allows the decomposition of complex organic structures into CO2 and water [3,4]. In the last few years, the use of sonophotocatalysis for the degradation of a wide range of organic pollutants in aqueous systems has been the topic of several studies [5,6]. Sonophotocatalysis use the synergistic effects of ultrasonic waves, UV-Vis irradiation and photocatalyst to form highly reactive free radicals in an aqueous medium that further react with dyes and lead to their degradation [7]. By providing additional nuclei, the heterogeneous catalyst enhances the formation of cavitation bubbles, which in turn increases the formation of reactive radicals through water pyrolysis [5]. The mechanism of sonophotocatalytic degradation, as well as the main advantages of combined ultrasound and photocatalytic processes, are presented by Abdurahman et al. [5]. The high energy consumption of sonophotocatalysis makes its large-scale application difficult, however, the high costs could be compensated by the low time required for the degradation of organic compounds [7]. Due to their magnetic properties, their recovery using an external magnetic field and their reuse is possible [8,9].
Oxides containing at least two types of metals are potential candidates for photoelectrochemistry and photocatalysis due to their band structure and energy position [10]. The bandgap of several MFe2O4-type ferrites are presented by Dillert et al. [11]. Nanosized spinel-type ferrites, containing first-row transition metals such are Ni, Co, Zn, Mn are attractive materials in electronics, magnetic storage, ferrofluid technology, gas sensors, catalysis, photocatalysis and biomedicine, including magnet-guided drug carriers, contrast agents and tracers for positive magnetic resonance imaging [12,13,14,15,16,17]. They are also promising candidates for wastewater treatment as they could act both as adsorbents, due to their high specific surface area, and as photocatalysis, due to their low energy band gap, that allow the conversion of UV or visible light into chemical energy that favors the degradation of dyes [8,17,18,19,20,21]. The strong photodegradation capacity of 3d transition metal ferrites such as CoFe2O4, CuFe2O4, NiFe2O4, and ZnFe2O4, with magnetic properties, was previously demonstrated for different organic compounds [12,13,21,22,23,24,25,26,27]. The surface coating of the ferrite nanoparticles with different materials, especially semiconductor materials such as TiO2 and SiO2, was proven to enhance the photocatalytic activity [28]. CoFe2O4 nanoparticles coated with TiO2–SiO2 efficiently degraded (up to 98%) the methylene blue dye [2], while Rhodamine B (RhB) degradation by CoFe2O4, was only 80% [29,30]. The enhancement of the photocatalytic performance of NixCo1-xFe2O4, prepared by the coprecipitation method against methylene blue at a high Ni content, was reported by Lassoued and Li [31]. A good photodegradation efficiency (about 80%) of methylene blue under visible light irradiation was also delineated for Co-Zn ferrite with various Co and Zn contents, obtained using the citrate precursor method [32]. The increase of the rate constant with the increasing Co content was also observed [32]. The photocatalytic activity of Co0.6Zn0.4NixFe2-xO4 powders, obtained by the sol-gel method under visible light against methyl orange dye in an aqueous solution, was also reported [33].
The spinel ferrite properties are determined by their composition, structure, particle size, and morphology [34,35,36,37]. These characteristics strongly depend on the synthesis route, chemical composition, doping cations, and sintering conditions [36,38]. The change in preparation method and temperature affects the microstructure, cation distribution among tetrahedral (A) and octahedral (B) sites and magnetic properties. Thus, to produce spinel ferrite nanoparticles with a desired stoichiometry, high compositional control, excellent chemical stability, high purity, crystallinity, saturation magnetization, and low coercivity are of interest and the selection of the synthesis route is critical [15,38].
Soft chemical routes such as sol-gel, solid-phase, hydrothermal, coprecipitation, sonochemical, spray pyrolysis, citrate gel, microwave refluxing, flash auto combustion, etc., are currently preferred for the synthesis of nano ferrites [17,37,39,40]. The solid-state reaction is a simple and attractive preparation method that allows large productivity and well-controllable grain sizes [41]. The conventional ceramic method is based on the solid-state reaction of metal oxides/carbonates at high temperatures (>1000 °C) and produces particles in the micrometer regime; however, agglomeration due to slow reaction kinetics is unavoidable [39]. Hence, wet chemical methods have been used intensively to avoid the limitations of conventional ceramic methods and to produce nanoscale materials with improved magnetic properties [35]. Wet chemical routes, such as hydrothermal, sol-gel method, and auto combustion, have been employed to obtain ferrite nanoparticles at low temperatures [34,39,41]. The main drawback of the wet methods is the formation of different oxide impurities, particularly Fe2O3 [17]. Highly homogenous Ni-Zn nanoferrite powders can be easily produced by a wet chemical route, using low-cost raw materials, and in air atmospheres. Its properties can be adjusted to fit the requirements of different applications by appropriately adjusting the Ni-Zn ratio and the sintering process [37,42]. The properties of Ni-Zn nanoferrites can be further improved by adding low amounts of other divalent ions such as Co2+ [37].
This paper investigates the formation, structure, morphology, and sonophotocatalytic activity of mixed Ni-Zn-Co ferrites embedded in SiO2, obtained by a modified sol-gel method and followed by thermal treatment. The reaction progress was investigated through thermal analysis (TG-DTA) and Fourier transform infrared spectroscopy (FT-IR), while the Ni-Zn-Co ferrites composition was investigated by inductively coupled plasma optical emission spectrometry (ICP-OES). The formation of the crystalline phase, crystallite size, and lattice constant were monitored by X-ray diffraction (XRD). The surface (specific surface area and porosity) was investigated using the Brunauer-Emmett-Teller (BET) method. The sonophotocatalytic properties of the samples were evaluated under visible light irradiation, assisted by sonication against RhB.

2. Results and Discussion

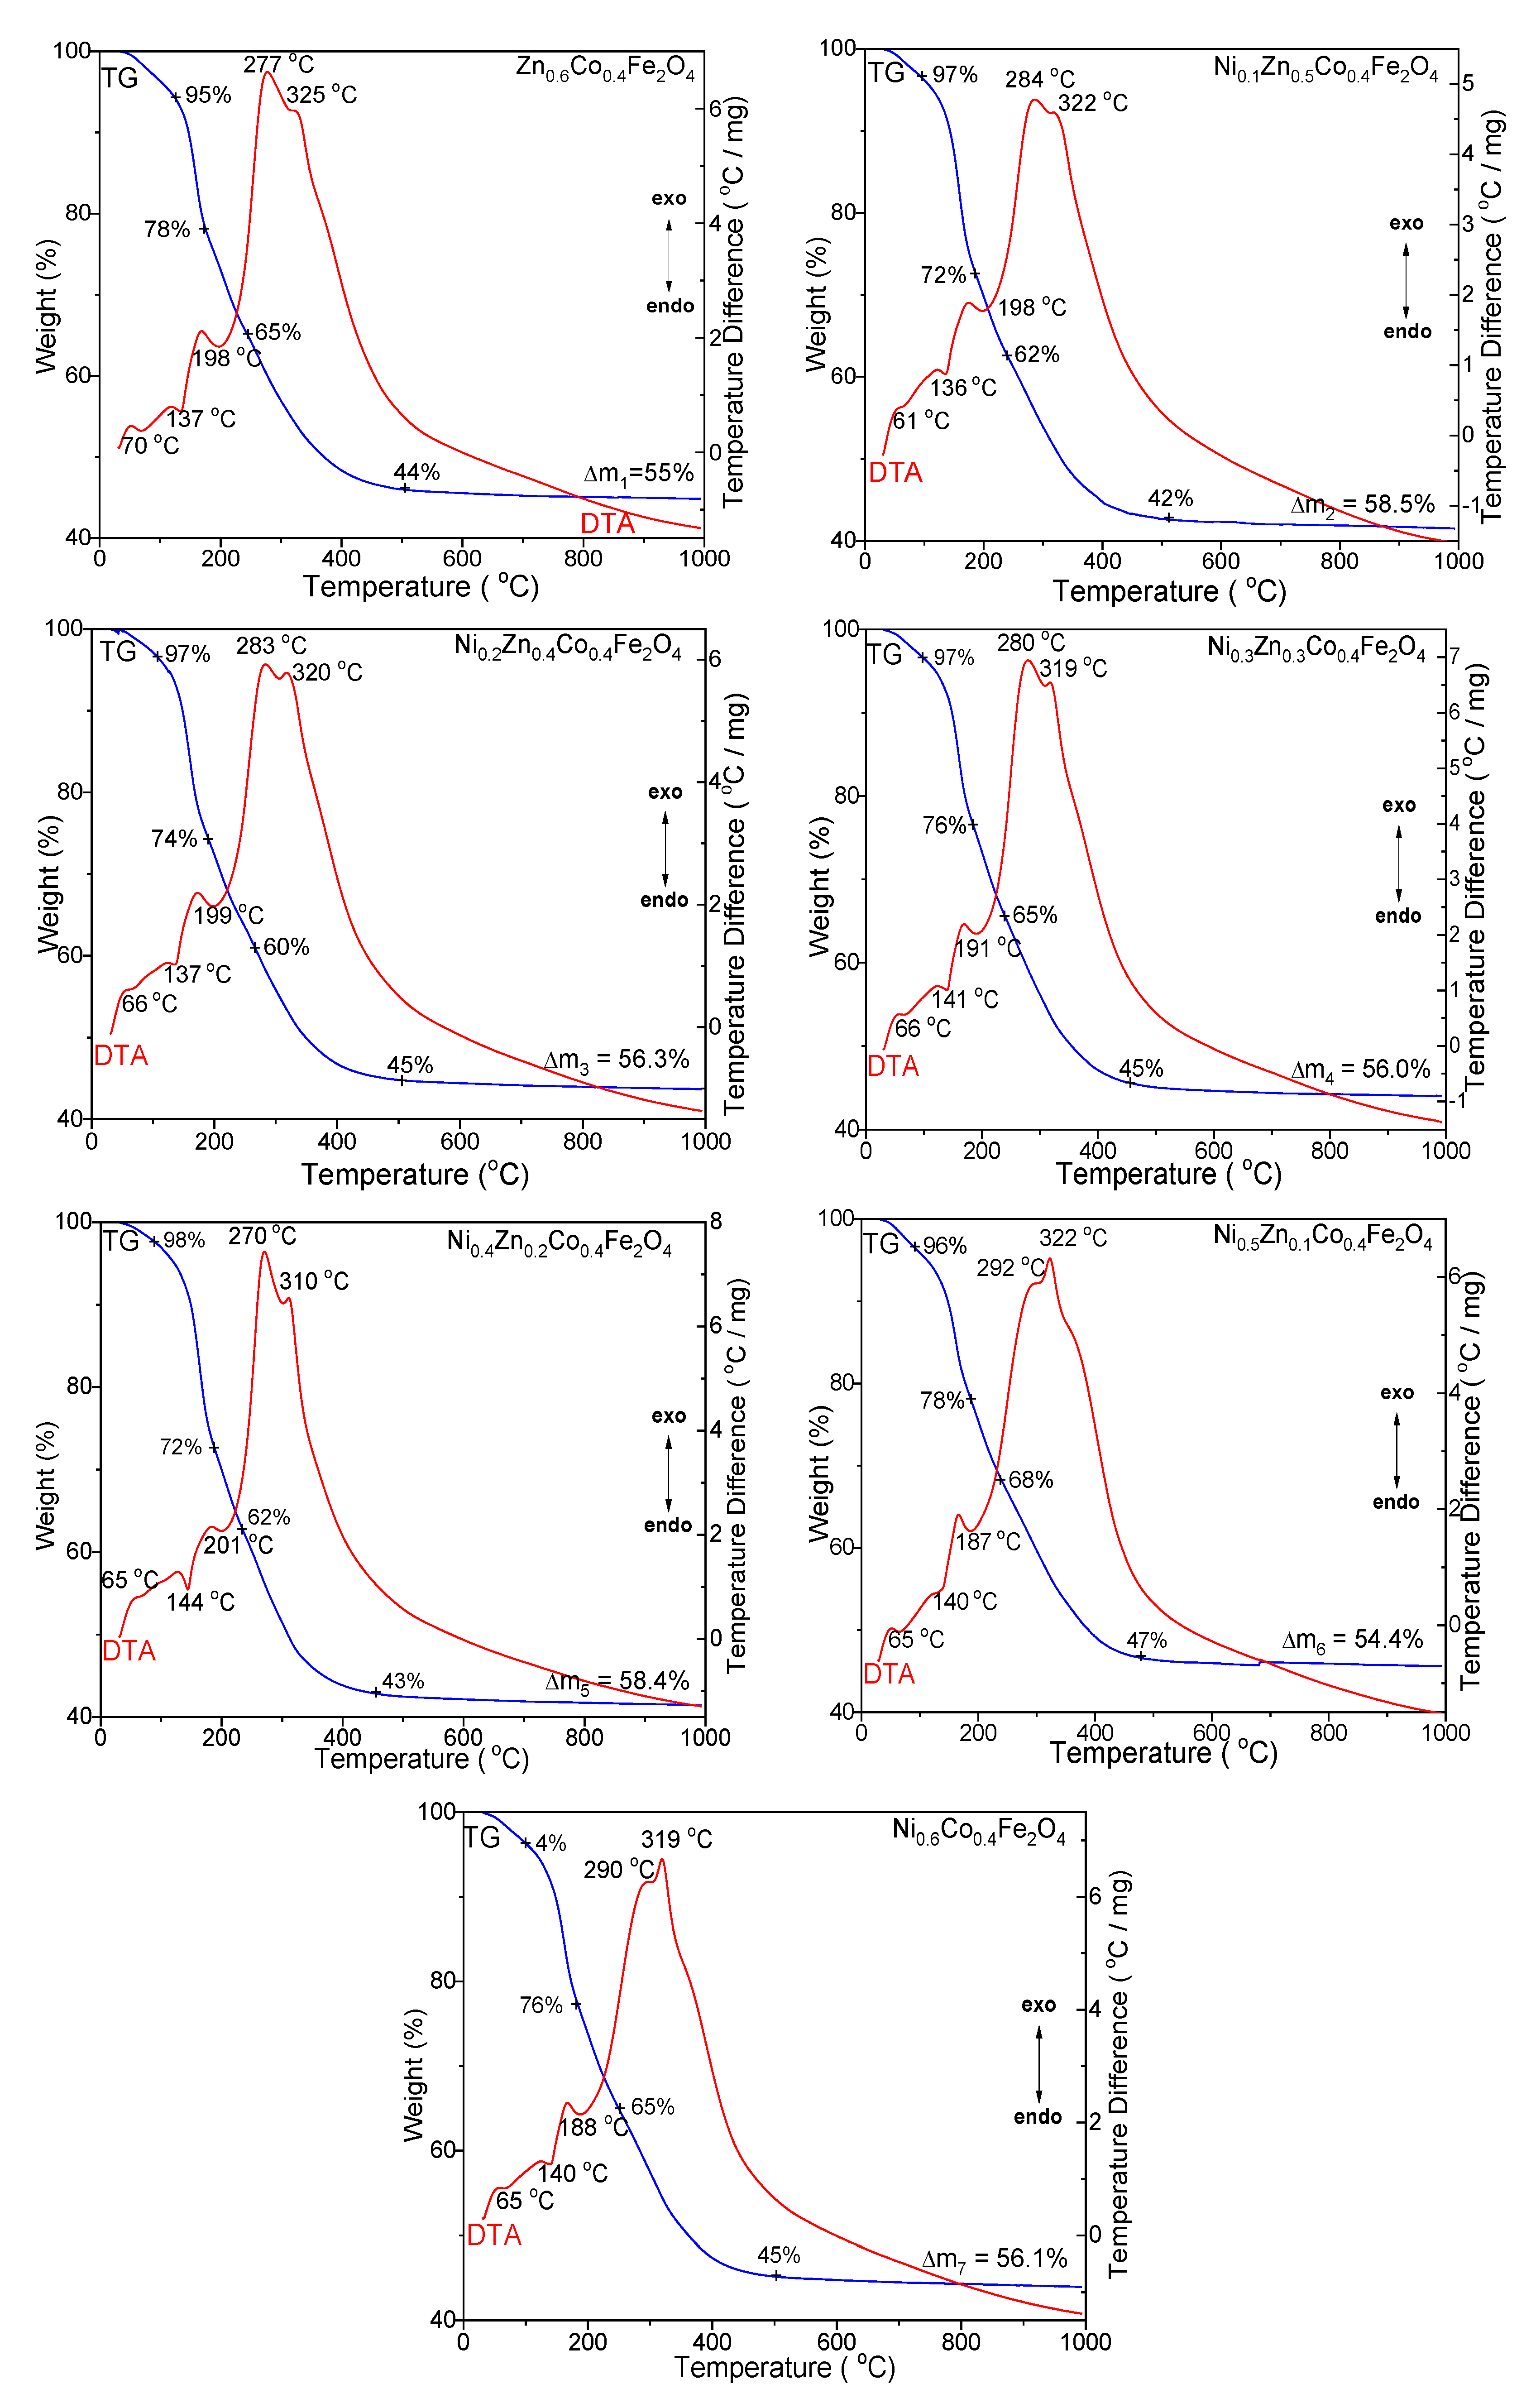
2.1. Thermal Analysis
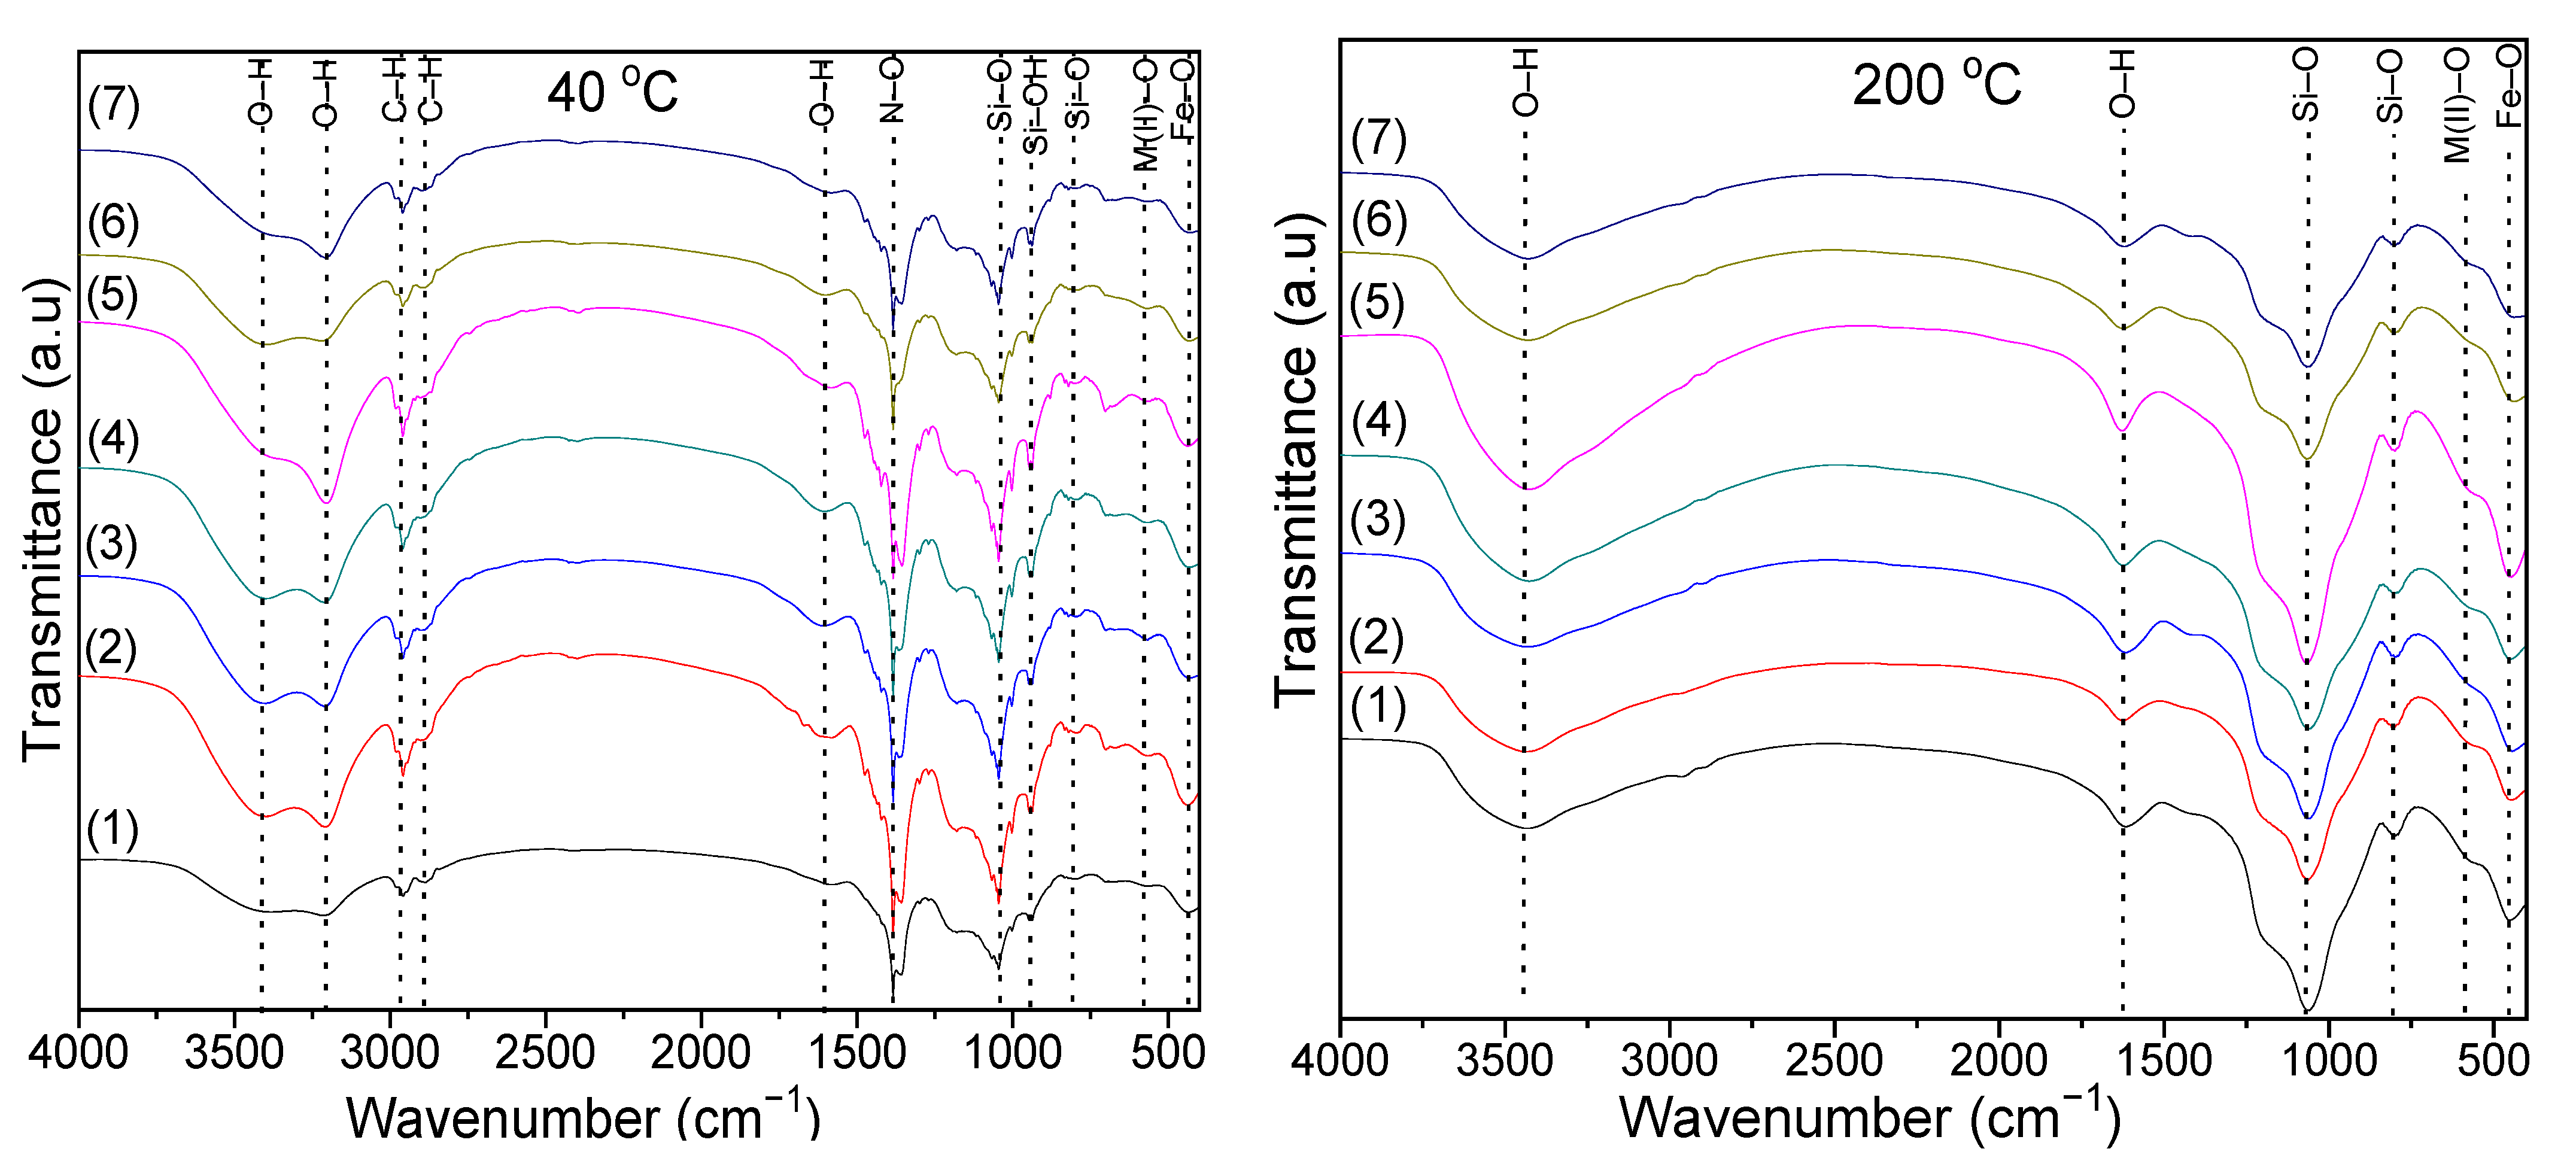
The TG-DTA curves of all of the samples show three endothermic and two exothermic processes characterized by very close, overlapping peaks (Figure 1).
The endothermic effect at 61–70 °C, accompanied by 3–5% mass loss, is attributed to the loss of crystallization and constitution water. The endothermic effect at 136–144 °C, accompanied by 17–26% mass loss, is assigned to the formation of divalent metal precursors (Co, Ni, and Zn succinates), while the endothermic effect at 187–201 °C accompanied by 9–14% mass loss, is ascribed to the formation of a trivalent metal precursor (Fe succinate). The distinct behavior of Fe succinate, compared to the divalent metal (Co, Ni, Zn) succinates, can be attributed to the redox reaction between Fe(NO3)3 and 1,4BD, as well as to the stronger acidity of the aqua-cation [Fe(H2O)6]3 [43]. The overlapping exothermic effects, at 270–292 °C and 310–325 °C, accompanied by 19–25% mass loss, are attributed to the decomposition of metal succinates to metal oxides, which leads to the formation of ferrites.
The exothermic peak, characteristic of the decomposition of divalent metal succinates, decreases with the increasing Zn content and shifts toward higher temperatures, leading to the increase of the exothermic peak, attributed to the decomposition of the Fe succinates. The SiO2 matrix suffers various transformations during the thermal process, making the demarcation of the processes attributed to the formation and decomposition of succinate precursors difficult [44]. The total mass loss increases in the following order: Ni0.5Zn0.1Co0.4Fe2O4@SiO2 < Zn0.6Co0.4Fe2O4@SiO2 < Ni0.3Zn0.3Co0.4Fe2O4@SiO2 < Ni0.6Co0.4Fe2O4@SiO2 < Ni0.2Zn0.4Co0.4Fe2O4@SiO2 < Ni0.4Zn0.2Co0.4Fe2O4@SiO2 < Ni0.1Zn0.5Co0.4Fe2O4@SiO2.

2.2. FT-IR Analysis

As vibrational modes in FT-IR spectroscopy are determined by the bond type, the symmetry of the lattice sites and the elements in the crystal lattice, the monitoring of the ferrite formation process is possible [44]. The FT-IR spectra of the gels dried at 40 and 200 °C are presented in Figure 2.
In the case of the samples dried at 40 °C, the intense band at 1379–1389 cm−1 is associated with the N-O bonds stretching vibration in metal nitrates. This band disappears in the case of samples dried at 200 °C, indicating the decomposition of nitrates [44]. The bands at 2958–2963 cm−1 and 2872–2888 cm−1 are specific to the symmetric and asymmetric vibration of C-H bonds in 1,4-BD or succinate precursors. These bands also disappear in samples heat-treated at 200 °C. The bands at 1578–1605 and 3200–3210 cm−1 are attributed to the stretching and bending vibrations of O-H in 1,4-BD and adsorbed molecular water [44,45]. In the samples dried at 200 °C, the band at 3200–3210 cm−1 is shifted towards higher wavenumbers (3421–3437 cm−1), indicating that the metal succinates are hygroscopic [44,45]. The presence of this absorption band could also be due to the O-H stretching vibration and Si-OH deformation vibration caused by the hydrolysis of –Si(OC2H5)4 [44,45]. For samples dried at 40 and 200 °C, the bands at 557–568 cm−1 are attributed to Ni-O and Zn-O vibrations, while the band at 433–452 cm−1 is attributed to the Fe-O vibration in the nitrates [44,45]. In samples at 40 °C, the band at 683–393 cm−1 is assigned to the Co-O bond vibration in the cobalt nitrate [44,45]. The formation of the SiO2 matrix in the samples dried at 40 and 200 °C is confirmed by the presence of specific bands of Si-O bond vibration (433–452 cm−1), cyclic Si-O-Si bonds vibration (557–568 cm−1, more noticeable in samples dried at 40 °C), Si-O symmetric stretching and bending vibration (792–815 cm−1), Si-OH bonds (938–943 cm−1, well delimited only in case of samples dried at 40 °C) vibration and Si-O-Si bonds stretching vibration (1045 cm−1 at 40 °C and 1058–1068 cm−1 at 200 °C). The band at 938–943 cm−1 is distinguishable for the samples dried at 40 °C, indicating the presence of unreacted TEOS, while the band at 1045 cm−1 suggests the formation of amorphous SiO2 [44,45]. Figure 3a shows the FT-IR spectra of NCs thermally treated at 1000 °C. The band at 618–626 cm−1 is attributed to the vibration of the M(II)-O (Co-O, Ni-O, Zn-O) bonds, while that at 485–490 cm−1 is attributed to the Fe-O bond [44,45,46].
In comparison to the samples dried at 40 °C and 200 °C, in the samples thermally treated at 1000 °C, the wavenumbers specific to Co-O bond vibration decrease, and the wavenumbers specific to M(II)-O increase. The Jan-Teller effect, determined by the presence of Fe2+ ions in the sublattices, can lead to band splitting, small bands and/or shoulders [47]. The Fe2+ ions may result from the hopping process, namely M2+ + Fe3+ ↔ M3+ + Fe2+ (M = Co, Ni, Zn). The Co3+ ion may migrate to tetrahedral (A) sites, while the Fe2+ ions remain in their sites [31].
The bands at 790–795 cm−1 are characteristic for the vibration of the Si-O bond in SiO2 matrix, while those at 1090–1095 cm−1 and 485–490 cm−1 are characteristic to the stretching and bending vibration of Si-O-Si chains and show a low degree of polycondensation of the SiO2 network [44,45]. The difference in band position could be attributed to the difference in M-O distance in the tetrahedral and octahedral sites [39].

2.3. XRD Analysis

The XRD patterns (Figure 3b) confirm the presence of well-crystallized ferrites in all of the samples, while the positions and intensities of the diffraction lines support the spinel structure [47]. The peaks with 2θ values of 30.07, 35.42, 37.07, 43.05, 53.41, 56.94, and 62.52 correspond to the (220), (311), (222), (400), (422), (511), and (440) planes [41,48]. In all of the samples, the local crystal structure is cubic spinel-type, belonging to the Fd-3m space group [21,40,41]. Additionally, two crystalline phases of the SiO2 matrix (SiO2-cristobalite, JCPDS card 39-1425 [48] and SiO2-tridymite, JCPDS card 042-1401 [48]) are identified. In the case of Zn0.6Co0.4Fe2O4@SiO2, the well-crystallized spinel is composed by CoFe2O4 (JCPDS card 22-1086 [48]) and ZnFe2O4 (JCPDS card 70-6491 [48]. In the case of Ni0.6Co0.4Fe2O4@SiO2, the well-crystallized spinel is composed of CoFe2O4 and NiFe2O4 (JCPDS card 74-2081 [48]), while in the other samples (Ni0.1Zn0.5Co0.4Fe2O4@SiO2, Ni0.2Zn0.4Co0.4Fe2O4@SiO2, Ni0.3Zn0.3Co0.4Fe2O4@SiO2, Ni0.4Zn0.2Co0.4Fe2O4@SiO2, and Ni0.5Zn0.1Co0.4Fe2O4@SiO2), the crystalline phase contains NiFe2O4, ZnFe2O4 and CoFe2O4. In ferrites with a high Zn content, the presence of hematite (Fe2O3, JCPDS card 89-0599 [48]) is also remarked. The presence of Fe2O3 indicates the decomposition of Fe(NO3)3 into Fe2O3, leading to the formation of spinel ferrite [39]. The excess of metal oxides in insoluble secondary phases (Fe2O3) can contribute to the densification by generating high pore volumes and demagnetizing fields. During synthesis, the homogeneity of the metal oxide particles may result in higher defects and pore volumes in the final products [36,42].
The average crystallites size (DXRD) was calculated using the Scherrer equation (Equation (1)).
D XRD = 0.9   · λ   β   · cos   θ
where λ is the wavelength of the CuKα radiation (1.5406 Å), β is the full width at half-maximum intensity (FWHM), hkl are the Miller indices and θ is the Bragg angle (°) [43,44,49,50].
The lattice constant (a), was calculated from Bragg’s law with Nelson-Riley Equation (2) [44,50].
a = λ h 2 + k 2 + l 2 2 · sin θ
where λ is the wavelength of CuKα radiation (1.5406 Å), hkl are the Miller indices, θ is the Bragg angle (°) [44,50].
The unit cell volume (V) and the hopping length (L) of magnetic ions for tetrahedral (A) and octahedral (B) sites were calculated using Equations (3)–(5) [44,50].
V = a 3
L A = 0.25 · a 3
L B = 0.25 · a 2
where a is the lattice constant (Å).
The average crystallite size lies in the nanocrystalline range and increases with the increasing Ni content, while the lattice parameter (a) decreases with the increasing Ni content (Table 1).
The change in the lattice constant (a) generates internal stress and suppresses additional grain growth during thermal treatment [44,50,51]. The tetrahedral (A) sites have smaller radii (0.52 Å) than the octahedral (B) site (0.81 Å) [9]. The ionic radii of Ni2+ (0.69 Å), Zn2+ (0.74 Å) and Co2+ (0.75 Å) ions are larger than the ionic radius of Fe3+ (0.64 Å) [3,38,52]. The amorphous to crystalline phase transformation and the relative content of crystalline phases, after thermal treatment at 1000 °C, were assessed using the relative degree of crystallinity (DC), calculated as the ratio between the area of diffraction peaks and the total area of diffraction peaks and halos. The DC increases with the increase of the crystallite size and Ni content. The Reference Intensity Ratio (RIR) method was used for the quantitative phase analysis of NCs thermally treated at 1000 °C.

2.4. Elemental Analysis

The Ni/Zn/Co molar ratios, determined by microwave digestion and combined with inductively coupled plasma optical emission spectrometry, are in good agreement with the theoretical values (Table 1).

2.5. BET Analysis

Due to the low amount of adsorbed/desorbed nitrogen, the determination of porosity and specific surface area (SSA) for the samples thermally treated at 1000 °C was not possible. The SSA below the method detection limit (0.5 m2/g) suggests that all ferrites have a non-porous structure, probably due to particle agglomeration that limits nitrogen absorption.

2.6. TEM Analysis

The TEM images of the mixed Ni-Zn-Co ferrites following thermal treatment at 1000 °C (Figure 4) reveal spherical, small (high Zn content), or large (high Ni content) nanoparticles that form large spongy aggregates.
The formation of agglomerates with irregular morphology composed of high Zn content ferrite particles and the homogenous dispersion of high Ni content ferrite particles is also remarked. The small grains have a high surface area to volume ratio and allow faster oxygen diffusion than the larger grains, leading to an increase in the stoichiometry of the sample [35]. Although the small particles are closely arranged together, a clear boundary between adjacent particles is still observed. The average particle size is 34–36 nm, the difference being attributed to the grain boundary motion that exerts a dragging force, while the pores delay the force over the grain [41]. Moreover, the driving force increases the grain boundaries over the pores, resulting in lower pore volume and higher density [41]. The average crystallite size estimated by XRD is close to the particle size determined by TEM, the slight differences being attributed to the amorphous SiO2 matrix and large-size nanoparticles [43,44,50].

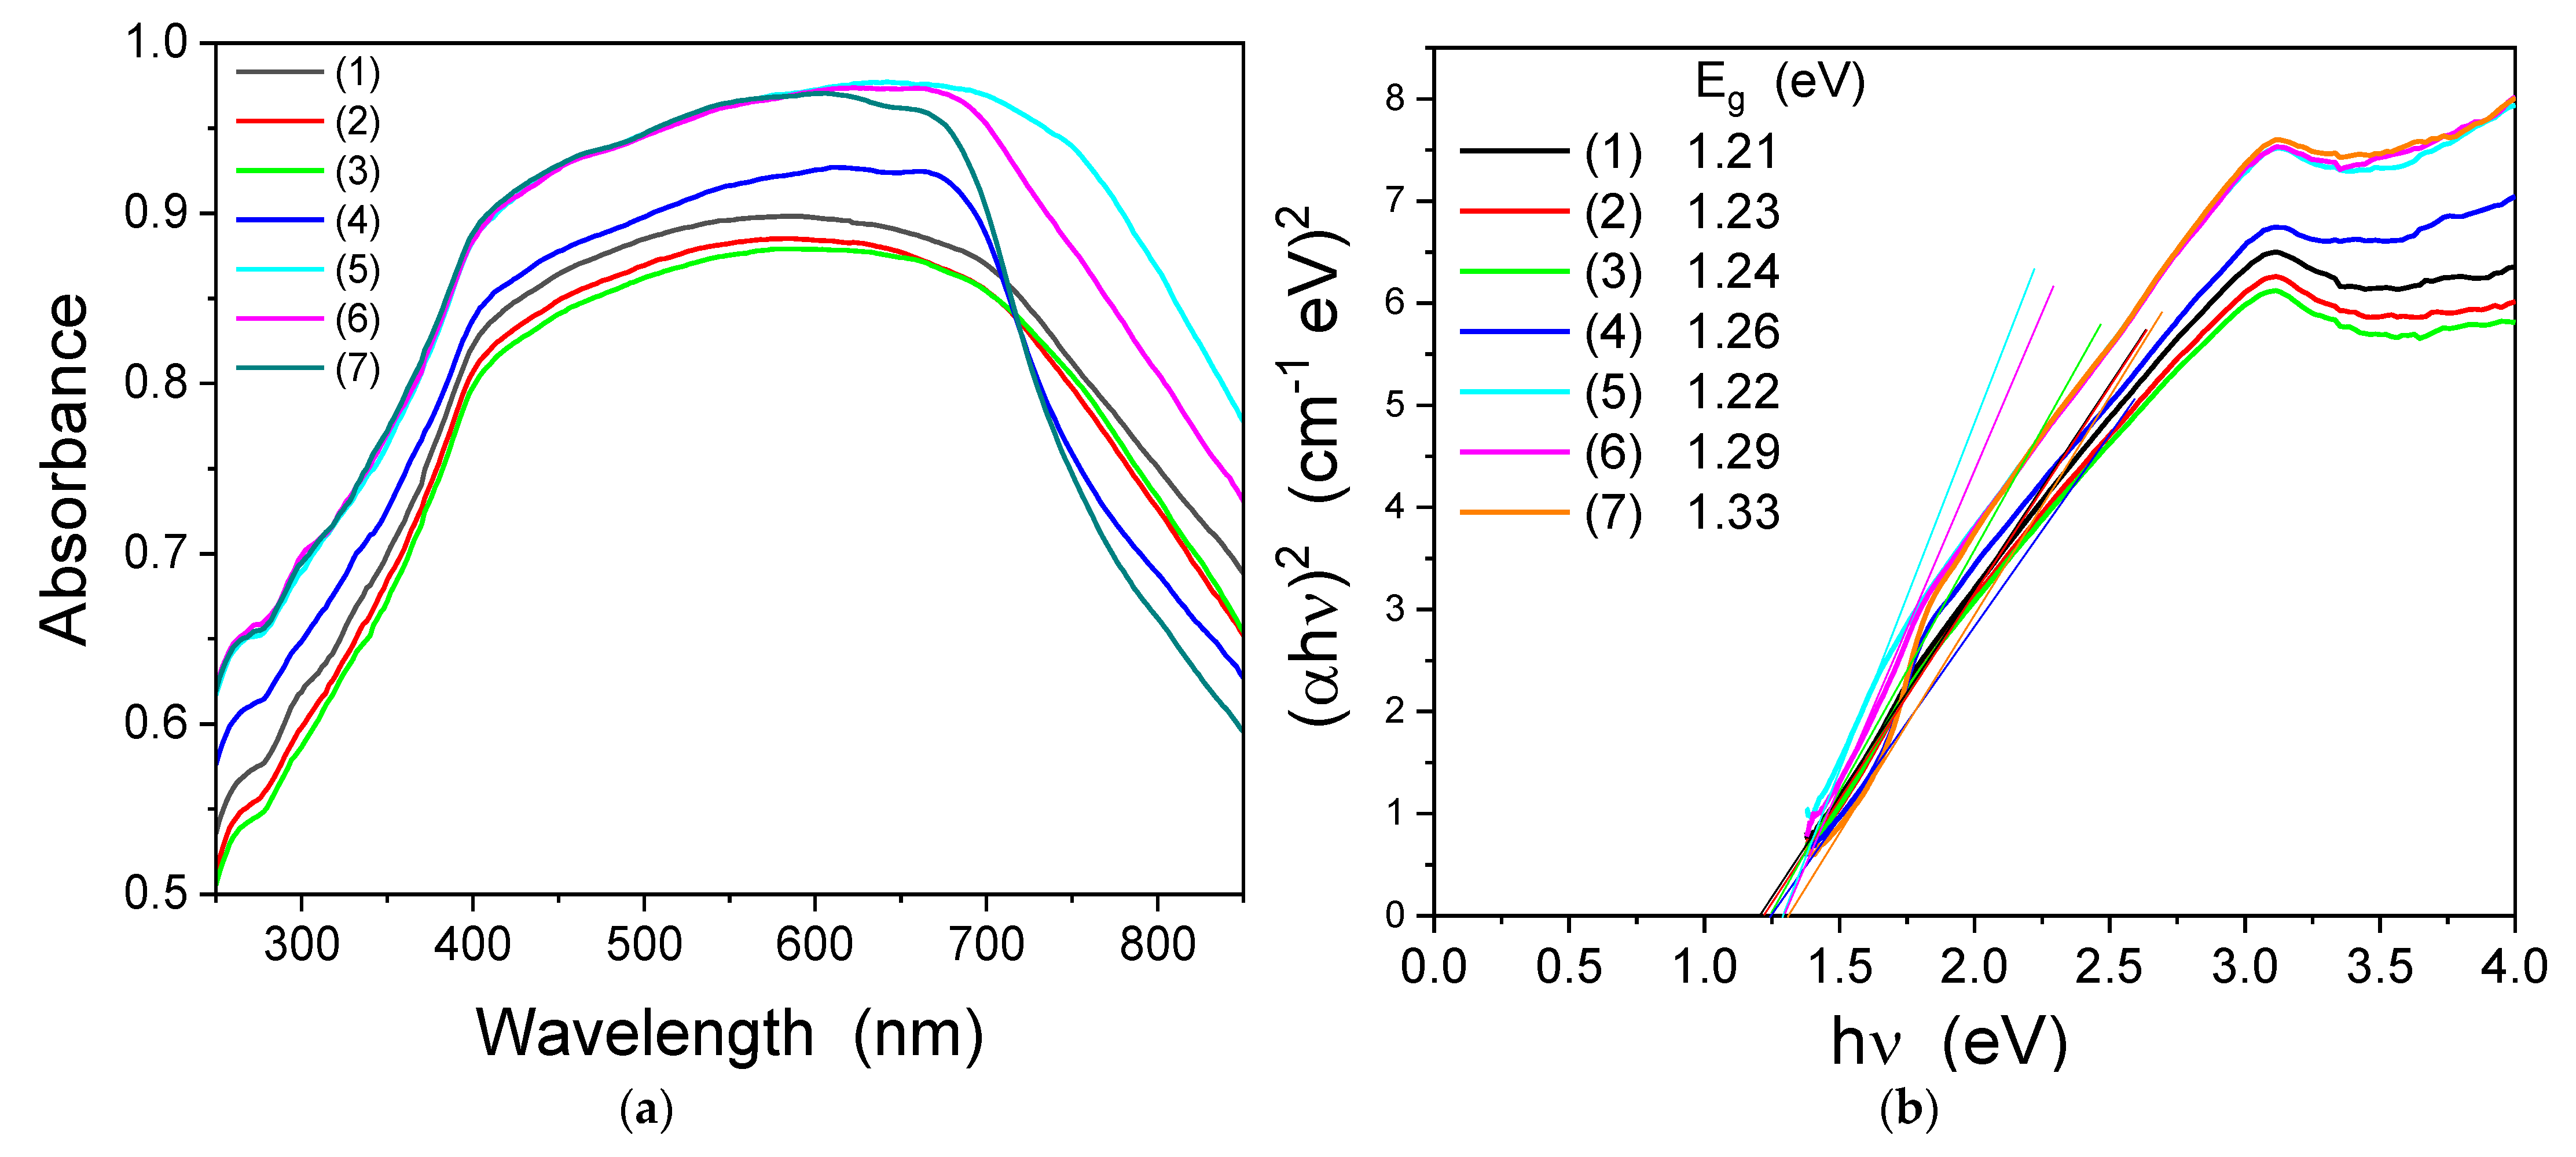
2.7. UV-VIS Analysis

The optical response of the samples was evaluated by UV-Vis spectroscopy. The UV-Vis absorption (Figure 5a) shows that all the samples have a broad response in the visible range. Based on the absorption spectra and using the Tauc’s relation [50], the band gap energy of the samples was evaluated (Figure 5b).
The band gap energy values are in the range 1.21–1.49 eV, are lower than that of NiFe2O4 (2.2 eV), ZnFe2O4 (1.91 eV) and CoFe2O4 (2.31 eV), and are comparable to those reported for CoFe2O4 xerogel calcined at 500 °C (1.5 eV) [33,50]. The band gap of our samples was also lower than those of NixCo1-xFe2O4 (1.37–1.78 eV) obtained by coprecipitation [52]. The optical band gap of the samples is due to the d-d transition. The crystal field splits the d level in the eg and t2g levels and the band gap energy depends on octahedral (B) and tetrahedral (A) sites. The band gap energy, in the case of the octahedral site, is higher than that of the tetrahedral (A) site [53]. The variation of the band gap energy, by replacing Zn2+ ions with Ni2+, can be explained by the redistribution of Ni2+ ions between the octahedral (B) and tetrahedral (A) sites. In the XRD data, the peaks corresponding to the plane (220) and (422) are sensitive to the tetrahedral (A) site, whereas the peak corresponding to the (222) plane is sensitive to the octahedral (B) site [54,55]. The values of the I(220)/I(222) ratio, for the samples annealed at 1000 °C, are 4.29 for Zn0.6Co0.4Fe2O4@SiO2, 3.79 for Ni0.1Zn0.5Co0.4Fe2O4@SiO2, 4.26 for Ni0.2Zn0.4Co0.4Fe2O4@SiO2, 4.10 for Ni0.3Zn0.3Co0.4Fe2O4@SiO2, 3.52 for Ni0.4Zn0.2Co0.4Fe2O4@SiO2, 3.22 for Ni0.5Zn0.1Co0.4Fe2O4@SiO2 and 3.77 for Ni0.6Co0.4Fe2O4@SiO2, which indicates that the population at the tetrahedral (A) site tends to decrease with the increase of the Ni2+ ions. These findings are correlated with the optical band gap values, which increases with the increase of Ni2+ content. The low band gap energy makes our samples suitable for the absorption of visible light. The activation energy of the Co0.6Zn0.4NixFe2-xO4 ferrite nanoparticles obtained by sol-gel route decreased with the increasing Ni content, from 2.71 eV (x = 0.2) to 1.46 eV (x = 1) [33].

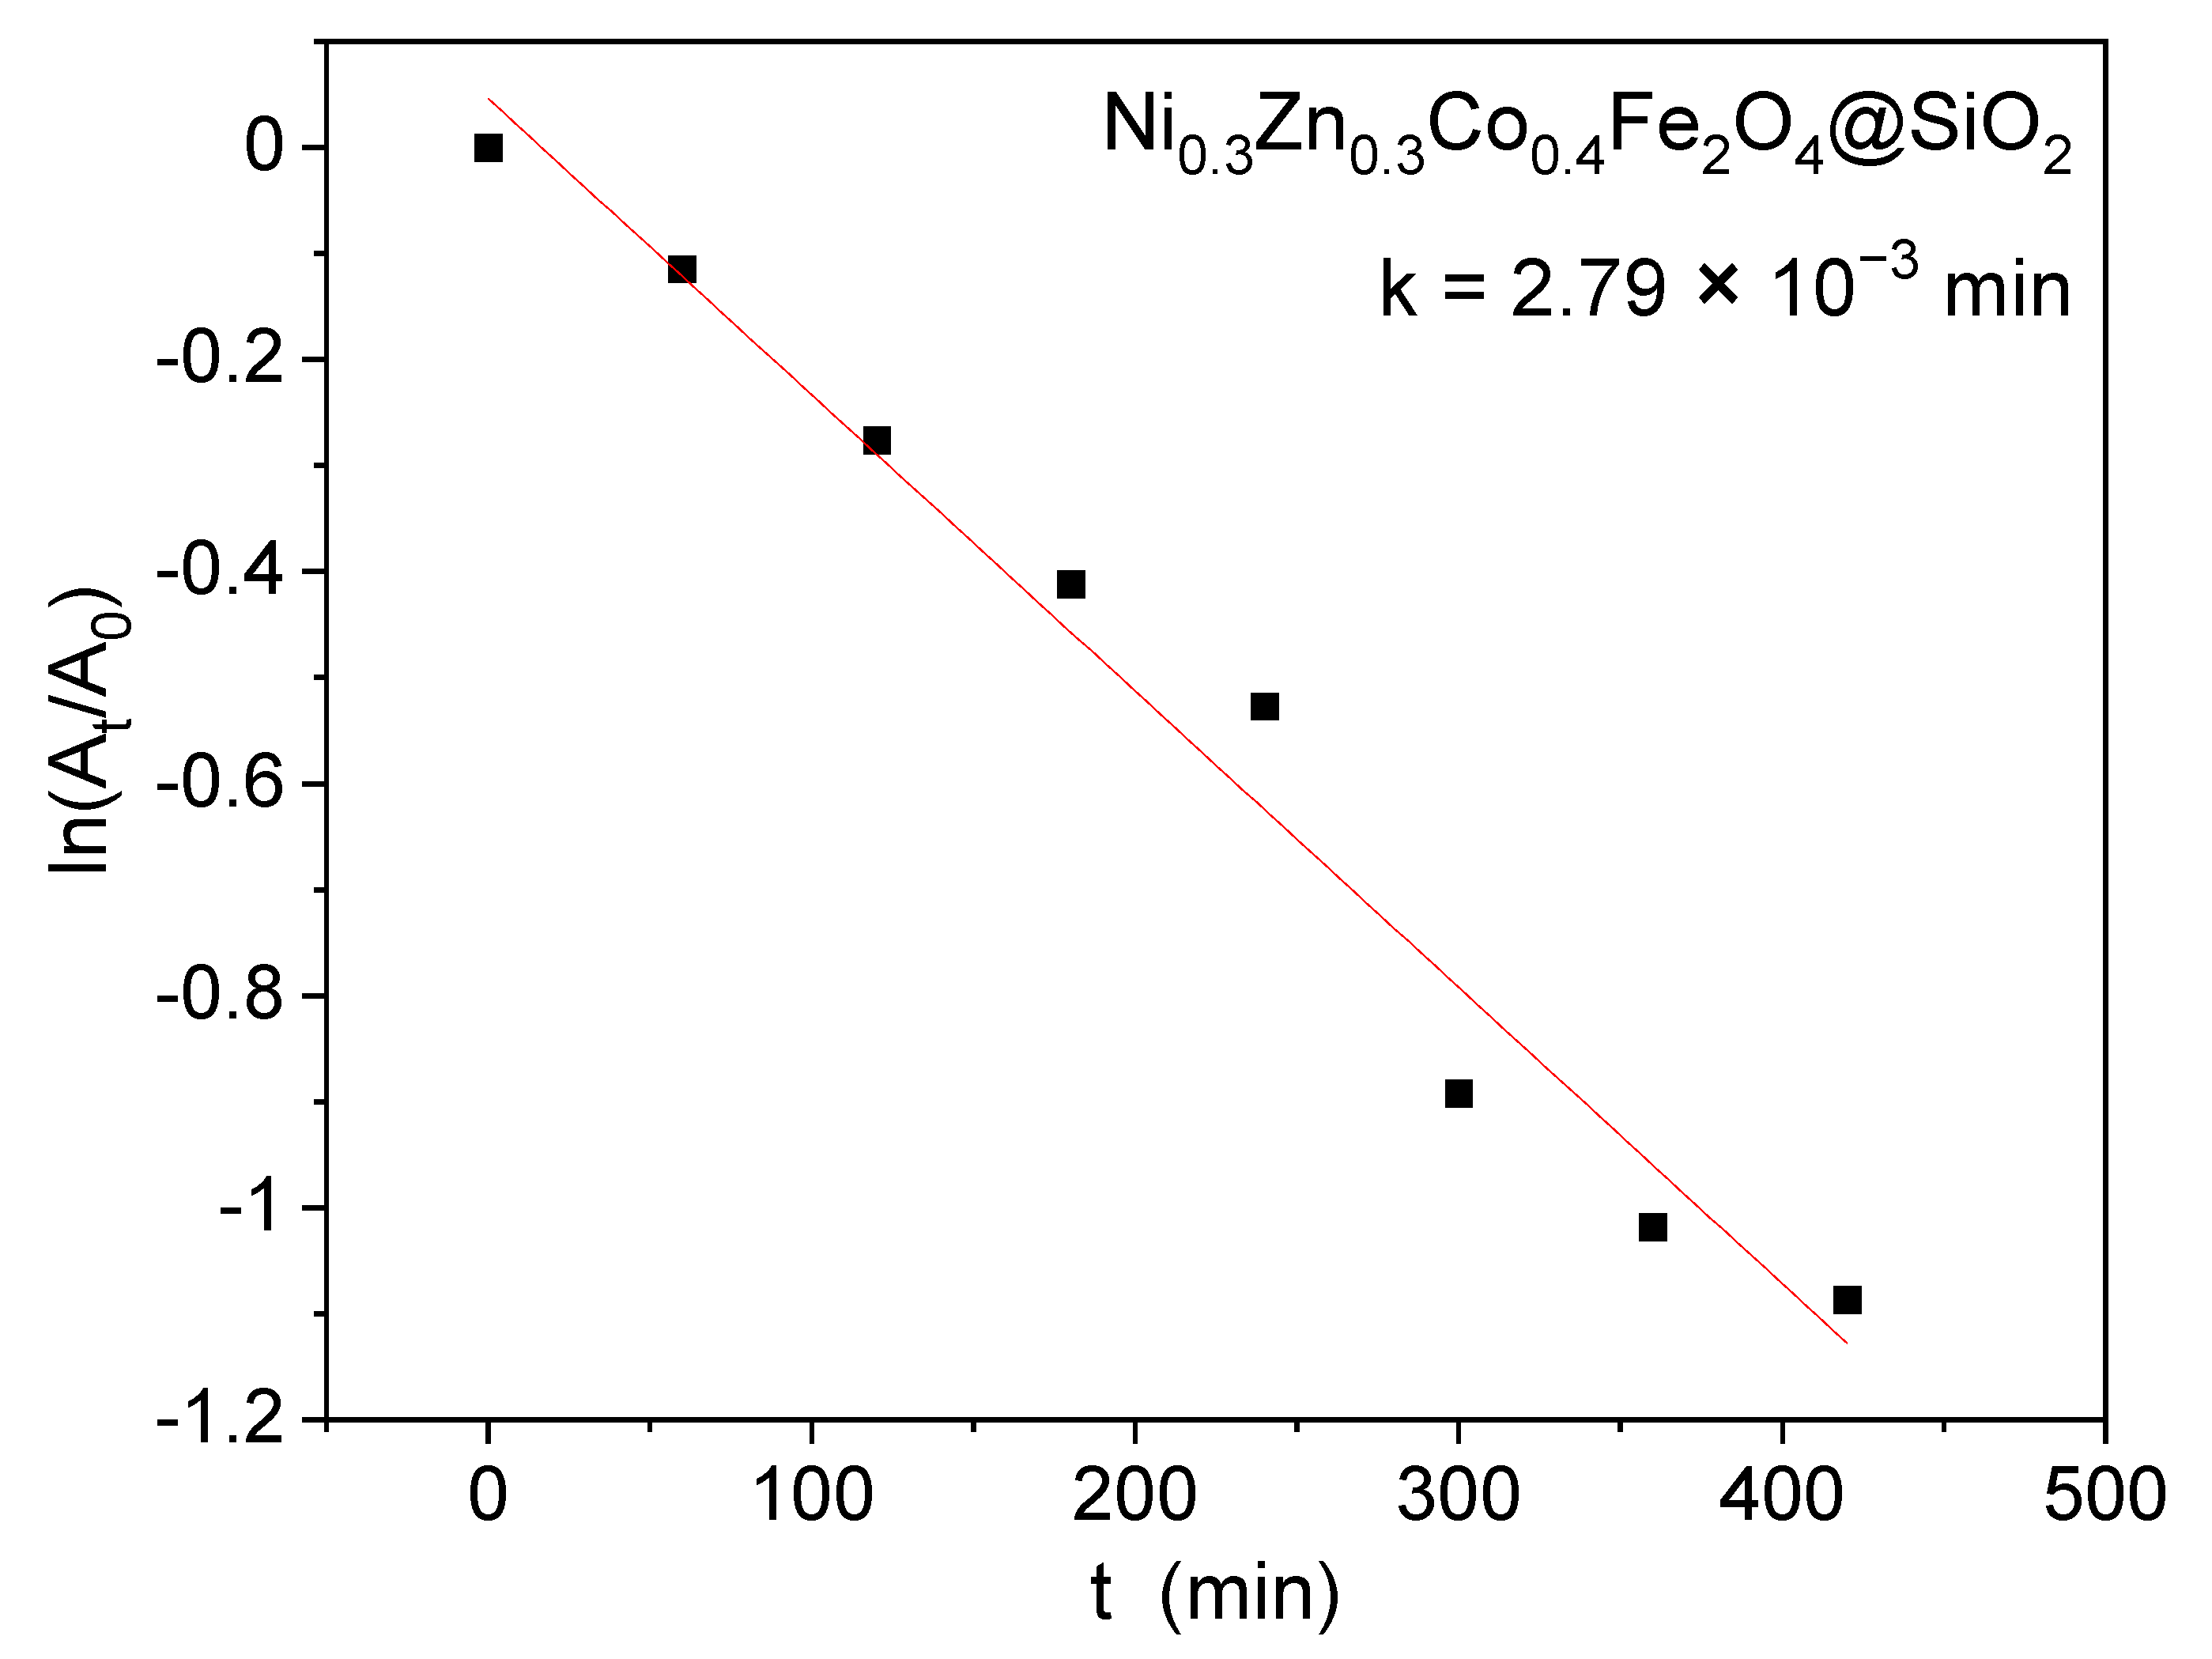
2.8. Sonophotocatalytic Activity

The sonophotocatalytic activity of the samples was evaluated using an RhB synthetic solution under visible irradiation. Before visible irradiation, the samples were kept in the dark for 1 h to reach the adsorption-desorption equilibrium. The adsorption capacity of the sample varied between 7–28%. The adsorption properties depend on the surface sites and specific surface area. In our case, the samples had almost identical particle sizes; thus, those surface sites were responsible for the adsorption properties. The removal rate (Figure 6) was evaluated after 7 h of visible irradiation and varied between 16 and 75%. Similar removal efficiencies (83.9%) for methylene blue were obtained using Ni-Cu-Zn ferrite@SiO2@TiO2 by Chen et al. [52,55].
The sample with similar Zn2+ and Ni2+ ions content (Ni0.3Zn0.3Co0.4Fe2O4@SiO2) shows the highest removal capacity, indicating that the equilibrium between Ni-ferrite and Zn-ferrite assures the best photocatalytic performance. In addition, based on the quantitative crystalline phase analysis, this sample contains a lower amount of α-Fe2O3 (2%) compared with samples Zn0.6Co0.4Fe2O4@SiO2 (1), Ni0.1Zn0.5Co0.4Fe2O4@SiO2 (2), Ni0.2Zn0.4Co0.4Fe2O4@SiO2 (3), which means that in the case of this sample, α-Fe2O3 does not significantly influence photocatalytic activity.
For this sample, the photodegradation kinetic was analyzed with respect to the absorbance of RhB using the pseudo-first order kinetic model (Equation (6)).
l n A t A 0 * = k i · t
where At is the absorbance of RhB at time t, A 0 *   is the absorbance of RhB at time t0 and ki is the apparent kinetic constant (min−1). A linear relationship with the irradiation time (Figure 7), with a rate constant of 2.79 × 10⁻³ min was obtained.

3. Materials and Methods

3.1. Synthesis

The Ni-Zn-Co ferrite embedded in SiO2 matrix (60% wt. ferrite, 40% wt. SiO2) were synthesized by sol-gel method using Ni(NO3)2∙6H2O, Zn(NO3)2∙6H2O, Co(NO3)2∙6H2O, Fe(NO3)3∙9H2O, 1,4-butanediol (1,4-BD), tetraethyl orthosilicate (TEOS), ethanol and HNO3 65%, using a Ni:Zn:Co:Fe molar ratio of 0:6:4:20 (Zn0.6Co0.4Fe2O4@SiO2), 1:5:4:20 (Ni0.1Zn0.5Co0.4Fe2O4@SiO2), 1:2:2:10 (Ni0.2Zn0.4Co0.4Fe2O4@SiO2), 3:3:4:20 (Ni0.3Zn0.3Co0.4Fe2O4@SiO2), 2:1:2:10 (Ni0.4Zn0.2Co0.4Fe2O4@SiO2), 5:1:4:20 (Ni0.5Zn0.1Co0.4Fe2O4@SiO2), 6:0:4:20 (Ni0.6Co0.4Fe2O4@SiO2) and a nitrate:1,4-BD:TEOS molar ratio of 1:1:0.67. All chemicals were of analytical grade (Merck) and used without further purification. The resulting sols were kept at room temperature until gelation (5 weeks), ground, dried at 40 °C (5 h), and then subjected to thermal treatment 1000 °C.

3.2. Characterization

The formation and decomposition of the carboxylate-type precursor were investigated by thermogravimetry (TG) and differential thermal analysis (DTA) using the SDT Q600 thermogravimeter, in air, up to 1000 °C, at 10 °C·min−1 heating rate, using alumina standards. The FT-IR spectra were recorded on KBr pellets containing 1% samples using a Perkin Elmer Spectrum BX II spectrometer, while the XRD patterns were recorded at room temperature using a Bruker D8 Advance diffractometer with CuKα1 radiation (λ = 1.54060 Å). The Ni/Zn/Co molar ratios were confirmed using Perkin Elmer ICP-OES Optima 5300 DV (Norwalk, CT, USA) after closed-vessel microwave-assisted aqua regia digestion using a Speedwave Xpert system (Berghof, Germany). The specific surface area (SSA) was obtained using the BET model from N2 adsorption-desorption isotherms recorded at −196 °C by a Sorptomatic 1990 (Thermo Fisher Scientific) instrument. The UV–VIS absorption spectra were recorded using a JASCO V570 UV–VIS-NIR spectrophotometer, equipped with a JASCO ARN-475 absolute reflectivity measurement accessory.

3.3. Sonophotocatalysis

The sonophotocatalytic activity of the samples was evaluated against RhB solution under visible light irradiation in a Laboratory-Visible-Reactor system using a 400 W halogen lamp (Osram) and an ultrasonic bath. The catalyst (10 mg) was suspended in an aqueous solution of RhB (1.0 × 10⁻⁵ mol L−1, 20 mL), and the mixture was stirred in the dark to achieve the adsorption equilibrium on the catalyst surface. Each degradation experiment was conducted for 240 min. Samples from a given mixture (3.5 mL) were withdrawn for analysis every 60 min. After separating the catalyst from the suspensions with a permanent magnet, the solution was analyzed using a UV–Vis spectrophotometer by recording the maximum absorbance of RhB at 554 nm. The sonophotocatalytic activity was estimated based on the calculated degradation rate. Before the sonophotodegradation experiments, the RhB adsorption on the surface of the nanoparticles was analyzed. The adsorption was verified in the dark by mixing the photocatalyst into the RhB solution for 60 min until the adsorption-desorption equilibrium was reached.

4. Conclusions

Ni-Zn-Co ferrites, with different Ni:Zn:Co ratios (Zn0.6Co0.4Fe2O4, Ni0.1Zn0.5Co0.4Fe2O4, Ni0.2Zn0.4Co0.4Fe2O, Ni0.3Zn0.3Co0.4Fe2O4, Ni0.4Zn0.2Co0.4Fe2O4, Ni0.5Zn0.1Co0.4Fe2O4, and Zn0.6Co0.4Fe2O4@SiO2), embedded in SiO2 were obtained by sol-gel method, followed by thermal treatment at 1000 °C. The thermal analysis revealed the formation and decomposition of metal succinate precursors in two stages, with distinct formation and decomposition of divalent (Ni2+, Zn2+, Co2+) and trivalent (Fe3+) succinates. The shapes of the DTA curves are similar, with the exception of the divalent metal’s succinate decomposition stage, where for samples with high Ni content, the intensity of the exothermic peak decreases and shifts to higher temperatures. The total mass losses vary between 54.4–58.5%. The precursor formation and their decomposition into ferrites, as well as the formation of the silica matrix, are also confirmed by the FT-IR spectra. The XRD revealed the presence of well-crystallized ferrites along two crystalline phases of the SiO2 matrix (cristobalite and tridymite). In samples with high Zn content, traces of hematite were also identified. The agglomeration of particles and the particle size of Ni-Zn-Co ferrites increase with the increasing Ni content, from 34 nm to 40 nm. All of the samples show a good optical response in the visible range, the best sonophotocatalytic performance being found for the Ni0.3Zn0.3Co0.4Fe2O4@SiO2 sample, most likely due to the equilibrium between Ni-ferrite and Zn-ferrite.

Author Contributions

Conceptualization, T.D.; methodology, T.D., O.C. and E.A.L.; formal analysis, T.D., O.C., F.G., D.T. and E.A.L.; investigation, T.D., O.C., F.G., D.T. and E.A.L.; resources, T.D., O.C., F.G., D.T. and E.A.L.; data curation, T.D.; writing—original draft preparation, T.D., O.C. and E.A.L.; writing—review and editing, T.D., O.C. and E.A.L.; visualization, T.D.; supervision, T.D. All authors have read and agreed to the published version of the manuscript.

Funding

The APC was funded by the Technical University of Cluj-Napoca Grant Support GC1/2021.

Institutional Review Board Statement

Not applicable.

Informed Consent Statement

Not applicable.

Data Availability Statement

Not applicable.

Acknowledgments

This study was supported by the Ministry of Research, Innovation and Digitization through Program 1—Development of the national research and development system, Subprogram 1.2—Institutional performance -Projects that finance the RDI excellence, Contracts no. 18PFE/30.12.2021 (O.C. and E.A.L.) and 37PFE/30.12.2021 (D.T.). The funder had no role in the design of the study; in the collection, analysis and interpretation of data; in the writing of the manuscript; and in the decision to submit the article for publication.

Conflicts of Interest

The authors declare no conflict of interest.

References

  1. Kefeni, K.K.; Mamba, B.B. Photocatalytic application of spinel ferrite nanoparticles and nanocomposites in wastewater treatment: Review. Sustain. Mater. Technol. 2020, 23, e00140. [Google Scholar] [CrossRef]
  2. Sun, M.; Han, X.; Chen, S. Synthesis and photocatalytic activity of nano-cobalt ferrite catalyst for the photo-degradation various dyes under simulated sunlight irradiation. Mater. Sci. Semicond. Process. 2019, 91, 367–376. [Google Scholar] [CrossRef]
  3. Rajabi, H.R.; Arjmand, H.; Kazemdehdashti, H.; Farsi, M. A comparison investigation on photocatalytic activity performance and adsorption efficiency for the removal of cationic dye: Quantum dots vs. magnetic nanoparticles. J. Environ. Chem. Eng. 2016, 4, 2830–2840. [Google Scholar] [CrossRef]
  4. AlSalka, Y.; Granone, L.I.; Ramadan, W.; Hakki, A.; Dillert, R.; Bahnemann, D.W. Iron-based photocatalytic and photoelectrocatalytic nano-structures: Facts, perspectives, and expectations. Appl. Catal. B Environ. 2019, 244, 1065–1095. [Google Scholar] [CrossRef]
  5. Abdurahman, M.H.; Abdullah, A.Z.; Shoparwe, N.F. A comprehensive review on sonocatalytic, photocatalytic, and sonophotocatalytic processes for the degradation of antibiotics in water: Synergistic mechanism and degradation pathway. Chem. Eng. J. 2021, 413, 127412. [Google Scholar] [CrossRef]
  6. Paustian, D.; Franke, M.; Stelter, M.; Braeutigam, P. Sonophotocatalysis—Limits and possibilities for synergistic effects. Catalysts 2022, 12, 754. [Google Scholar] [CrossRef]
  7. Joseph, C.G.; Puma, G.L.; Bono, A.; Krishnaiah, D. Sonophotocatalysis in advanced oxidation process: A short review. Ultrason. Sonochem. 2009, 16, 583–589. [Google Scholar] [CrossRef]
  8. Anjum, M.; Miandad, R.; Waqas, M.; Gehany, F.; Barakat, M.A. Remediation of wastewater using various nanomaterials. Arab. J. Chem. 2019, 12, 4897–4919. [Google Scholar] [CrossRef] [Green Version]
  9. Munoz, M.; De Pedro, Z.M.; Casas, J.A.; Rodriguez, J.J. Preparation of magnetite-based catalysts and their application in heterogeneous Fenton oxidation—A review. Appl. Catal. B Environ. 2015, 176–177, 249–265. [Google Scholar] [CrossRef] [Green Version]
  10. Matsumoto, Y. Energy positions of oxide semiconductors and photocatalysis with iron complex oxides. J. Solid State Chem. 1996, 126, 227–234. [Google Scholar] [CrossRef]
  11. Dillert, R.; Taffa, D.H.; Wark, M.; Bredow, T.; Bahnemann, D.W. Research Update: Photoelectrochemical water splitting and photocatalytic hydrogen production using ferrites (MFe2O4) under visible light irradiation. APL Mater. 2015, 3, 104001. [Google Scholar] [CrossRef] [Green Version]
  12. Taffa, D.H.; Dillert, R.; Ulpe, A.C.; Bauerfeind, K.C.L.; Bredow, T.; Bahnemann, D.W.; Wark, D. Photoelectrochemical and theoretical investigations of spinel type ferrites (MxFe3−xO4) for water splitting: A mini-review. J. Photon Energy 2017, 7, 012009. [Google Scholar] [CrossRef] [Green Version]
  13. Chakrabarty, S.; Bandyopadhyay, S.; Pal, M.; Dutta, A. Sol-gel derived cobalt containing Ni–Zn ferrite nanoparticles: Dielectric relaxation and enhanced magnetic property study. Mater. Chem. Phys. 2021, 259, 124193. [Google Scholar] [CrossRef]
  14. Sepelak, V.; Feldhoff, A.; Heitjans, P.; Krumeich, F.; Menzel, D.; Litterst, F.J.; Bergmann, I.; Becker, K.D. nonequilibrium cation distribution, canted spin arrangement, and enhanced magnetization in nanosized MgFe2O4 prepared by a one-step mechanochemical route. Chem. Mater. 2006, 18, 3057–3067. [Google Scholar] [CrossRef]
  15. Dolcet, P.; Kirchberg, K.; Antonello, A.; Suchomski, C.; Marschall, R.; Diodati, S.; Muñoz-Espí, R.; Landfester, K.; Gross, S. Exploring wet chemistry approaches to ZnFe2O4 spinel ferrite nanoparticles with different inversion degrees: A comparative study. Inorg. Chem. Front. 2019, 6, 1527. [Google Scholar] [CrossRef]
  16. Simon, C.; Zakaria, M.B.; Kurz, H.; Tetzlaff, D.; Blösser, A.; Weiss, M.; Timm, J.; Weber, B.; Apfel, U.P.; Marschall, R. Magnetic NiFe2O4 nanoparticles prepared via non-aqueous microwave-assisted synthesis for application in electrocatalytic water oxidation. Chem. Eur. J. 2021, 27, 16990–17001. [Google Scholar] [CrossRef] [PubMed]
  17. Kirchberg, K.; Becker, A.; Bloesser, A.; Weller, T.; Timm, J.; Suchomski, C.; Marschall, R. Stabilization of monodisperse, phase-pure mgfe2o4 nanoparticles in aqueous and nonaqueous media and their photocatalytic behavior. J. Phys. Chem. C 2017, 121, 27126–27138. [Google Scholar] [CrossRef]
  18. He, H.Y. Photocatalytic degradations of dyes on magnetically separable Ni1 −xCoxFe2O4 nanoparticles synthesized by a hydrothermal process. Part Sci. Technol. 2016, 34, 143–151. [Google Scholar] [CrossRef]
  19. Kefeni, K.K.; Mamba, B.B.; Msagati, T.A.M. Application of spinel ferrite nanoparticles in water and wastewater treatment: A review. Sep. Purif. Technol. 2017, 188, 399–422. [Google Scholar] [CrossRef]
  20. Casbeer, E.; Sharma, V.K.; Li, X.Z. Synthesis and photocatalytic activity of ferrites under visible light: A review. Sep. Purif. Technol. 2012, 87, 1–14. [Google Scholar] [CrossRef]
  21. Sundararajan, M.; Sailaja, V.; Kennedy, L.J.; Vijaya, J.J. Photocatalytic degradation of rhodamine B under visible light using nanostructured zinc doped cobalt ferrite: Kinetics and mechanism. Ceram. Int. 2017, 43, 540–548. [Google Scholar] [CrossRef]
  22. Stergiou., C. Magnetic, dielectric and microwave adsorption properties of rare earth doped Ni-Co and Ni-Co-Zn spinel ferrite. J. Magn. Magn. Mater. 2017, 426, 629–635. [Google Scholar] [CrossRef]
  23. Shetty, K.; Renuka, L.; Nagaswarupa, H.P.; Nagabhushana, H.; Anantharaju, K.S.; Rangappa, D.; Prashantha, S.C.; Ashwini, K. A comparative study on CuFe2O4, ZnFe2O4 and NiFe2O4: Morphology, impedance and photocatalytic studies. Mater. Today Proc. 2017, 4, 11806–11815. [Google Scholar] [CrossRef]
  24. Zhu, H.; Jiang, R.; Fu, Y.; Li, R.; Yao, J. Novel multifunctional NiFe2O4/ZnO hybrids for dye removal by adsorption, photocatalysis and magnetic separation. Appl. Surf. Sci. 2016, 369, 1–10. [Google Scholar] [CrossRef]
  25. Li, Y.; Zhang, Z.; Pei, L.; Li, X.; Fan, T.; Ji, J.; Shen, J.; Ye, M. Multifunctional photocatalytic performances of recyclable Pd-NiFe2O4/reduced graphene oxide nanocomposites via different co-catalyst strategy. Appl. Catal. B Environ. 2016, 190, 1–11. [Google Scholar] [CrossRef]
  26. Mahmoodi, N.M. Zinc ferrite nanoparticle as a magnetic catalyst: Synthesis and dye degradation. Mater. Res. Bull. 2013, 48, 4255–4260. [Google Scholar] [CrossRef]
  27. Revathi, J.; Abel, M.J.; Archana, V.; Sumithra, T.; Thiruneelakandan, R. Synthesis and characterization of CoFe2O4 and Ni-doped CoFe2O4 nanoparticles by chemical co-precipitation technique for photo-degradation of organic dyestuffs under direct sunlight. Phys. B Condens. Matter. 2020, 587, 412136. [Google Scholar] [CrossRef]
  28. Harraz, F.A.; Mohamed, R.M.; Rashad, M.M.; Wang, Y.C.; Sigmund, W. Magnetic nanocomposite based on titania-silica/cobalt ferrite for photocatalytic degradation of methylene blue dye. Ceram. Int. 2014, 40, 375–384. [Google Scholar] [CrossRef]
  29. Ahmadi Golsefidi, M.; Yazarlou, F.; Naeimi Nezamabad, M.; Naeimi Nezamabad, B.; Karimi, M. Effects of capping agent and surfactant on the morphology and size of CoFe2O4 nanostructures and photocatalyst properties. J. Nanostruct. 2016, 6, 121–126. [Google Scholar]
  30. Abbasi, A.; Khojasteh, H.; Hamadanian, M.; Salavati-Niasari, M. Synthesis of CoFe2O4 nanoparticles and investigation of the temperature, surfactant, capping agent and time effects on the size and magnetic properties. J. Mater. Sci. Mater. Electron. 2016, 27, 4972–4980. [Google Scholar] [CrossRef]
  31. Lassoued, A.; Li, J.F. Magnetic and photocatalytic properties of Ni–Co ferrites. Solid State Sci. 2020, 104, 106199. [Google Scholar] [CrossRef]
  32. Chahar, D.; Taneja, S.; Bisht, S.; Kesarwani, S.; Thakur, P.; Thakur, A.; Sharma, P.B. Photocatalytic activity of cobalt substituted zinc ferrite for the degradation of methylene blue dye under visible light irradiation. J. Alloys Compd. 2021, 851, 156878. [Google Scholar] [CrossRef]
  33. Bhukal, S.; Bansal, S.; Singhal, S. Structural, electrical and magnetic properties of Ni doped Co-Zn nanoferrites and their application in photo-catalytic degradation of methyl orange dye. Solid State Phenom. 2015, 232, 197–211. [Google Scholar] [CrossRef]
  34. Vatsalya, V.L.S.; Sundari, G.S.; Sridhar, C.S.L.N.; Lakshmi, C.S. Evidence of superparamagnetism in nano phased copper doped nickel zinc ferrites synthesized by hydrothermal method. Optik 2021, 247, 167874. [Google Scholar] [CrossRef]
  35. Raju, K.; Venkataiah, G.; Yoon, D.H. Effect of Zn substitution on the structural and magnetic properties of Ni–Co ferrites. Ceram. Int. 2014, 40, 9337–9344. [Google Scholar] [CrossRef]
  36. Huili, H.; Grindi, B.; Viau, G.; Tahar, L.B. Influence of the stoichiometry and grain morphology on the magnetic properties of Co substituted Ni–Zn nanoferrites. Ceram. Int. 2016, 42, 17594–17604. [Google Scholar] [CrossRef]
  37. Sherstyuk, D.P.; Starikov, A.Y.; Zhivulin, V.E.; Zherebstov, D.A.; Gudkova, S.A.; Perov, N.S.; Alekhina, Y.A.; Astapovich, K.A.; Vinnik, D.A.; Trukhanov, A.V. Effect of Co content on magnetic features and SPIN states in Ni–Zn spinel ferrites. Ceram. Int. 2021, 47, 12163–12169. [Google Scholar] [CrossRef]
  38. Kumar, R.; Barman, P.B.; Singh, R.R. An innovative direct non-aqueous method for the development of Co doped Ni-Zn ferrite nanoparticles. Mater. Today Commun. 2021, 27, 102238. [Google Scholar] [CrossRef]
  39. Kaur, M.; Jain, P.; Singh, M. Studies on structural and magnetic properties of ternary cobalt magnesium zinc (CMZ) Co0.6-xMgxZn0.4Fe2O4 (x = 0.0, 0.2, 0.4, 0.6) ferrite nanoparticles. Mater. Chem. Phys. 2015, 162, 332–339. [Google Scholar] [CrossRef]
  40. Vinnik, D.A.; Sherstyuk, D.P.; Zhivulin, V.E.; Zhivulin, D.E.; Starikov, A.Y.; Gudkova, S.A.; Zherebtsov, D.A.; Pankratov, D.A.; Alekhina, Y.A.; Perov, N.S.; et al. Impact of the Zn–Co content on structural and magnetic characteristics of the Ni spinel ferrites. Ceram. Int. 2022, 48, 18124–18133. [Google Scholar] [CrossRef]
  41. Mohapatra, P.P.; Singh, H.K.; Kiran, M.S.R.N.; Dobbidi, P. Co substituted Ni–Zn ferrites with tunable dielectric and magnetic response for high-frequency applications. Ceram. Int. 2022, 48, 29217–29228. [Google Scholar] [CrossRef]
  42. Ramesh, S.; Sekhar, B.C.; Rao, P.S.V.S.; Rao, B.P. Microstructural and magnetic behavior of mixed Ni–Zn–Co and Ni–Zn–Mn ferrites. Ceram. Int. 2014, 40, 8729–8735. [Google Scholar] [CrossRef]
  43. Stefanescu, M.; Stoia, M.; Dippong, T.; Stefanescu, O.; Barvinschi, P. Preparation of CoxFe3-xO4 Oxydic System Starting from Metal Nitrates and Propanediol. Acta Chim. Slov. 2009, 56, 379–385. [Google Scholar]
  44. Dippong, T.; Levei, E.A.; Lengauer, C.L.; Daniel, A.; Toloman, D.; Cadar, O. Investigation of thermal, structural, morphological and photocatalytic properties of CuxCo1-xFe2O4 (0≤x≤1) nanoparticles embedded in SiO2 matrix. Mater. Caract. 2020, 163, 110268. [Google Scholar] [CrossRef]
  45. Dippong, T.; Levei, E.A.; Cadar, O.; Goga, F.; Barbu-Tudoran, L.; Borodi, G. Size and shape-controlled synthesis and characterization of CoFe2O4 nanoparticles embedded in a PVA- SiO2 hybrid matrix. J. Anal. Appl. Pyrol 2017, 128, 121–130. [Google Scholar] [CrossRef]
  46. Amer, M.A.; Tawfik, A.; Mostafa, A.G.; El-Shora, A.F.; Zaki, S.M. Spectral studies of Co substituted Ni–Zn ferrites. J. Magn. Magn. Mater. 2011, 323, 1445–1452. [Google Scholar] [CrossRef]
  47. Mallapur, M.M.; Chougule, B.K. Synthesis, characterization and magnetic properties of nanocrystalline Ni–Zn–Co ferrites. Mater. Lett. 2010, 64, 231–234. [Google Scholar] [CrossRef]
  48. ASTM. Joint Committee on Powder Diffraction Standards-International Center for Diffraction Data; ASTM: Philadelphia, PA, USA, 1999. [Google Scholar]
  49. Ghodake, J.S.; Shinde, T.J.; Patil, R.P.; Patil, S.B.; Patil, S.B.; Suryavanschi, S.S. Initial permeability of Zn–Ni–Co ferrite. J. Magn. Magn. Mater. 2015, 378, 436–439. [Google Scholar] [CrossRef]
  50. Dippong, T.; Levei, E.A.; Cadar, O. Formation, structure and magnetic properties of MFe2O4@SiO2 (M = Co, Mn, Zn, Ni, Cu) nanocomposites. Materials 2021, 14, 1139. [Google Scholar] [CrossRef]
  51. Dalal, M.; Mallick, A.; Mahapatra, A.S.; Mitra, A.; Das, A.; Das, D.; Chakrabarti, P.K. Effect of cation distribution on the magnetic and hyperfine behavior of nanocrystalline Co doped Ni–Zn ferrite (Ni0.4Zn0.4Co0.2Fe2O4). Mater. Res. 2016, 76, 389–401. [Google Scholar]
  52. Chen, C.; Jaihindh, D.; Hu, S.; Fu, Y. Magnetic recyclable photocatalysts of Ni-Cu-Zn ferrite@SiO2@TiO2@Ag and their photocatalytic activities. J. Photochem. Photobiol. A Chem. 2017, 334, 74–85. [Google Scholar] [CrossRef]
  53. Meena, S.; Anantharaju, K.S.; Malini, S.; Dey, A.; Renuka, L.; Prashantha, S.C.; Vidya, Y.S. Impact of temperature-induced oxygen vacancies in polyhedron MnFe2O4 nanoparticles: As excellent electrochemical sensor, supercapacitor and active photocatalyst. Ceram. Int. 2021, 47, 14723–14740. [Google Scholar] [CrossRef]
  54. Sharma, D.; Khare, N. Tuning of optical bandgap and magnetization of CoFe2O4 thin films. Appl. Phys. Lett. 2014, 105, 032404. [Google Scholar] [CrossRef]
  55. Toloman, D.; Stefan, M.; Pana, O.; Rostas, A.M.; Silipas, T.D.; Pogacean, F.; Leostean, C.; Barbu-Tudoran, L.; Popa, A. Transition metal ions as a tool for controlling the photocatalytic activity of MWCNT-TiO2 nanocomposites. J. Alloys Compd. 2022, 921, 166095. [Google Scholar] [CrossRef]
Figure 1. TG-DTA diagrams of Zn0.6Co0.4Fe2O4@SiO2, Ni0.1Zn0.5Co0.4Fe2O4@SiO2, Ni0.2Zn0.4Co0.4Fe2O4@SiO2, Ni0.3Zn0.3Co0.4Fe2O4@SiO2, Ni0.4Zn0.2Co0.4Fe2O4@SiO2, Ni0.5Zn0.1Co0.4Fe2O4@SiO2 and Ni0.6Co0.4Fe2O4@SiO2 samples.
Ijms 23 14167 g001
Figure 2. FT-IR spectra of Zn0.6Co0.4Fe2O4@SiO2 (1) Ni0.1Zn0.5Co0.4Fe2O4@SiO2 (2), Ni0.2Zn0.4Co0.4Fe2O4@SiO2 (3), Ni0.3Zn0.3Co0.4Fe2O4@SiO2 (4) Ni0.4Zn0.2Co0.4Fe2O4@SiO2 (5) Ni0.5Zn0.1Co0.4Fe2O4@SiO2 (6) and Ni0.6Co0.4Fe2O4@SiO2 (7) samples at 40 and 200 °C.
Ijms 23 14167 g002
Figure 3. FT-IR spectra (a) and XRD patterns (b) of Zn0.6Co0.4Fe2O4@SiO2 (1), Ni0.1Zn0.5Co0.4Fe2O4@SiO2 (2), Ni0.2Zn0.4Co0.4Fe2O4@SiO2 (3), Ni0.3Zn0.3Co0.4Fe2O4@SiO2 (4), Ni0.4Zn0.2Co0.4Fe2O4@SiO2 (5), Ni0.5Zn0.1Co0.4Fe2O4@SiO2 (6) and Ni0.6Co0.4Fe2O4@SiO2 (7) samples at 1000 °C.
Ijms 23 14167 g003
Figure 4. TEM images of Zn0.6Co0.4Fe2O4@SiO2 (1), Ni0.1Zn0.5Co0.4Fe2O4@SiO2 (2), Ni0.2Zn0.4Co0.4Fe2O4@SiO2 (3), Ni0.3Zn0.3Co0.4Fe2O4@SiO2 (4), Ni0.4Zn0.2Co0.4Fe2O4@SiO2 (5), Ni0.5Zn0.1Co0.4Fe2O4@SiO2 (6) and Ni0.6Co0.4Fe2O4@SiO2 (7) samples at 1000 °C.
Ijms 23 14167 g004
Figure 5. (a) UV-Vis absorption spectra and (b) Tauc’s plot of the of Zn0.6Co0.4Fe2O4@SiO2 (1), Ni0.1Zn0.5Co0.4Fe2O4@SiO2 (2), Ni0.2Zn0.4Co0.4Fe2O4@SiO2 (3), Ni0.3Zn0.3Co0.4Fe2O4@SiO2 (4), Ni0.4Zn0.2Co0.4Fe2O4@SiO2 (5), Ni0.5Zn0.1Co0.4Fe2O4@SiO2 (6) and Ni0.6Co0.4Fe2O4@SiO2 (7) samples at 1000 °C.
Ijms 23 14167 g005
Figure 6. Removal rate of Zn0.6Co0.4Fe2O4@SiO2 (1), Ni0.1Zn0.5Co0.4Fe2O4@SiO2 (2), Ni0.2Zn0.4Co0.4Fe2O4@SiO2 (3), Ni0.3Zn0.3Co0.4Fe2O4@SiO2 (4), Ni0.4Zn0.2Co0.4Fe2O4@SiO2 (5), Ni0.5Zn0.1Co0.4Fe2O4@SiO2 (6) and Ni0.6Co0.4Fe2O4@SiO2 (7) samples.
Ijms 23 14167 g006
Figure 7. Photodegradation kinetics of RhB in the presence of Ni0.3Zn0.3Co0.4Fe2O4@SiO2.
Ijms 23 14167 g007
Table 1. Parameters obtained from TEM, XRD and ICP-OES analysis for samples thermally treated at 1000 °C.
NanocompositeDTEM
(nm)
DXRD
(nm)
DC
(%)
a
(Å)
V
3)
LA
(Å)
LB
(Å)
Quantitative Analysis (%)Ni/Zn/Co
Zn0.6Co0.4Fe2O4@SiO23433.289.08.45660514.612.012% Zn0.6Co0.4Fe2O4/
4% α-Fe2O3/ 84% SiO2
0/0.60/0.39
Ni0.1Zn0.5Co0.4Fe2O4@SiO23533.689.48.40559414.511.914% Ni0.1Zn0.5Co0.4Fe2O4/
4% α-Fe2O3/ 82% SiO2
0.08/0.49/0.39
Ni0.2Zn0.4Co0.4Fe2O4@SiO23634.189.88.37558714.511.815% Ni0.2Zn0.4Co0.4Fe2O4/
4% α-Fe2O3/ 81% SiO2
0.19/0.38/0.41
Ni0.3Zn0.3Co0.4Fe2O4@SiO23634.590.18.36658614.511.817% Ni0.3Zn0.3Co0.4Fe2O4/
2% α-Fe2O3/ 81% SiO2
0.28/0.27/0.42
Ni0.4Zn0.2Co0.4Fe2O4@SiO23735.090.48.35458314.411.813% Ni0.4Zn0.2Co0.4Fe2O4/
87% SiO2
0.41/0.08/0.38
Ni0.5Zn0.1Co0.4Fe2O4@SiO23836.690.68.34658114.411.815% Ni0.5Zn0.1Co0.4Fe2O4/
85% SiO2
0.49/0.08/0.38
Ni0.6Co0.4Fe2O4@SiO24036.990.88.33557914.411.720% Ni0.6Co0.4Fe2O4/
80% SiO2
0.61/0.39/0
Publisher’s Note: MDPI stays neutral with regard to jurisdictional claims in published maps and institutional affiliations.

