Article

Genome-Wide Identification of ATG Gene Family Members in Fagopyrum tataricum and Their Expression during Stress Responses

1
College of Life Science, Sichuan Agricultural University, No. 46, Xinkang Road, Ya’an 625014, China
2
State Key Laboratory of Crop Gene Exploration and Utilization in Southwest China, Sichuan Agricultural University, No. 211, Huimin Road, Wenjiang District, Chengdu 611130, China
*
Authors to whom correspondence should be addressed.
These authors contributed equally to this work.
Int. J. Mol. Sci. 2022, 23(23), 14845; https://doi.org/10.3390/ijms232314845
Submission received: 6 September 2022 / Revised: 9 November 2022 / Accepted: 24 November 2022 / Published: 27 November 2022
(This article belongs to the Special Issue Omics Study to Uncover Signalling and Gene Regulation in Plants)

Abstract

:
Abiotic stresses such as drought and salinity are major environmental factors limiting plant productivity. Autophagy-related genes are extensively involved in plant growth, development, and adverse stress responses, which have not yet been characterized in Tartary buckwheat (Fagopyrum tataricum, TB). In this study, we verified that drought stress could induce autophagy in TB roots. Next, 49 FtATGs in the whole genome of TB were identified. All FtATGs were randomly distributed in 8 known chromosomes, while 11 FtATGs were predictably segmental repeats. As the core component of autophagy, there were 8 FtATG8s with similar gene structures in TB, while FtATG8s showed high expression at the transcription level under drought and salt stresses. The cis-acting element analysis identified that all FtATG8 promoters contain light-responsive and MYB-binding elements. FtATG8s showed a cell-wide protein interaction network and strongly correlated with distinct stress-associated transcription factors. Furthermore, overexpression of FtATG8a and FtATG8f enhanced the antioxidant enzyme activities of TB under adverse stresses. Remarkably, FtATG8a and FtATG8f may be vital candidates functioning in stress resistance in TB. This study prominently aids in understanding the biological role of FtATG genes in TB.

1. Introduction

Plants survive in adverse changing environments, which could affect their growth and development [1]. These environmental stimulators consist of biotic stresses, pathogenic infections, aggressive herbivores, and abiotic stresses, including drought, high temperature, cold, lack of nutrients, and excessive salinity in the soil [2]. Plants usually degrade or restore damaged proteins and organelles to adapt to these pressures. Autophagy, as a conservative degradation pathway, plays a central role in eukaryotic stress response.
After autophagy was first discovered and reported in yeast, more autophagy-related genes were excavated, named ATG1, ATG2, ATG3, etc. [3]. Subsequently, 47 ATG family proteins were identified in Arabidopsis thaliana, which was named according to their homology with yeast ATG proteins. Compared to the single-copy genes in yeast, some autophagy genes in plants have multiple copies that form subgroups such as ATG8 and ATG12. As a conserved protein degradation and recycling mechanism in plants, autophagy is a fundamental part of the biochemical and physiological processes of plants, including chloroplast renewal [4], pollen development [5], and seed germination [6]. In parallel to growth and development, autophagy widely responds to abiotic stresses in plants. Ion stress caused by drought and salt stress induces oxidative damage in plant cells, which can be repaired by autophagy under the activation of various biological factors [7]. Silencing OsATG2 and OsATG7 inhibits autophagy and reduces wheat salt tolerance [8]. Overexpression of MdATG18a enhanced the adaptable ability of apples to drought stress [9].
Among ATGs, ATG8s are critical players in autophagy. Especially when monitoring autophagy is possible, ATG8s become the most remarkable discovery in identifying the ATG family. The deletion of ATG8s led to the failure of smaller autophagosomes to fuse with lysosomes [10,11]. In addition, ATG8 also plays an essential role in the adaptation to abiotic stresses in plants. Arabidopsis thaliana overproducing MaATG8f had better drought resistance and sensitivity to ABA than the wild type [12]. Overexpression of OsATG8c significantly increased autophagic activity and tolerance to N starvation. In addition, the salt and drought resistance were enhanced in apples overexpressing MdATG8i [13,14]. Altogether, it emphasizes that ATG8s have a crucial effect on improving the Resistance to abiotic stresses of plants. Tartary buckwheat (Fagopyrum tataricum, TB) is a grain crop used in food and medicine which attracts attention because of its rich flavonoid content [15]. Although TB with enriched nutrition has strong environmental adaptability to grow in high-altitude barren areas, drought is still the main factor inhibiting TB yield. It is necessary to reveal its stress resistance mechanism and identify the stress resistance-associated gene family. Abiotic stress often leads to the appearance of damaged organelles and proteins. ATG-involved autophagy is a conservative recycling mechanism for plants and an important mechanism for responding to abiotic stress.
However, ATG in TB has not been systematically well established yet. In this study, a comprehensive investigation was performed for FtATG family genes in the TB genome. A series of studies on the molecular characteristics and functional verification of FtATGs, proposed that FtATGs were potentially involved in stress tolerance in TB, laying a foundation for the functional characterization of FtATGs in TB.

2. Results

2.1. Autophagy Occurs in TB under Drought Stress

Although TB has good stress resistance, drought is still the most severe abiotic stress reducing its yield and quality. To test whether autophagy was involved in drought stress in TB, we visualized the autophagosome abundance in TB roots under drought stress. MDC (Monodansyl-cadaverine) was used for autophagosome staining. Compared to the control group without drought treatment, there was a significant increase of blue fluorescent spots after 24 h under natural drought, indicating autophagosomes accumulated in TB roots (Figure 1). It suggested that autophagy was significantly induced by drought stress in TB.

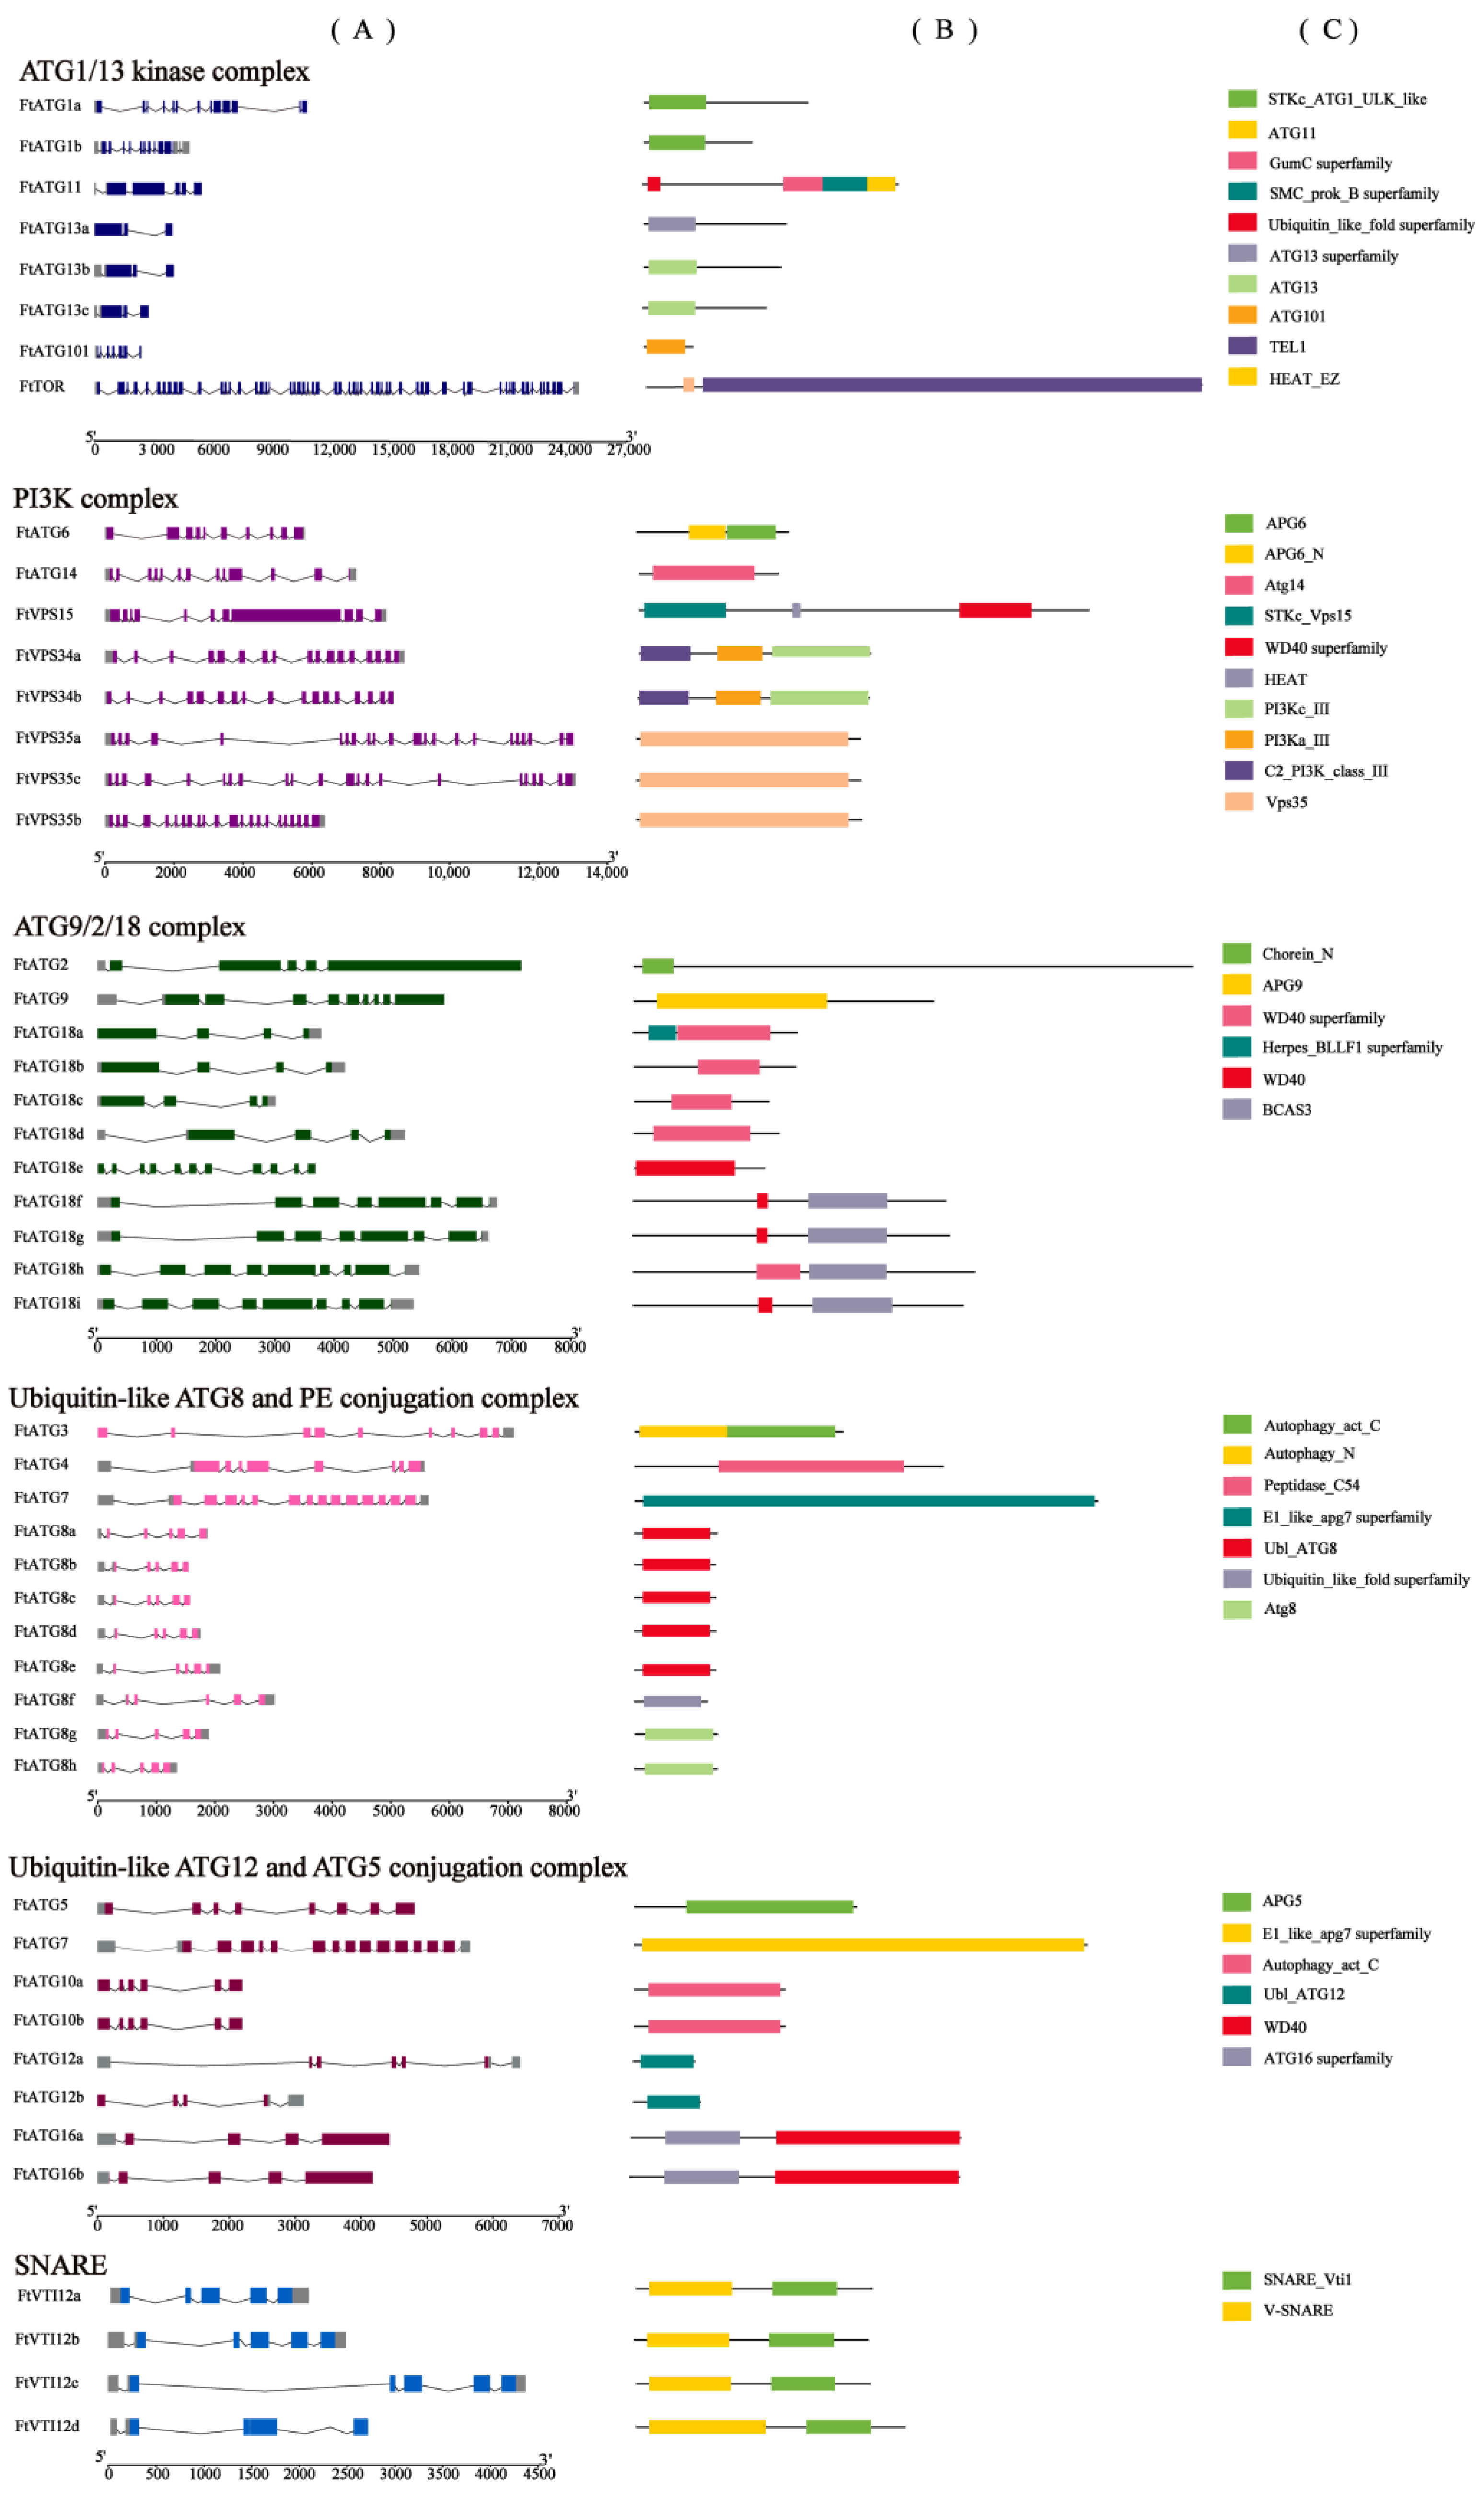
2.2. Genome-Wide Identification of FtATGs in TB

To identify the autophagy-associated genes in TB, 39 OsATGs, 29 NtATGs, and 47 AtATGs were taken as templates to align with genes from the TB gene database using BLASTp (Basic Local Alignment Search Tool for Proteins). Forty-nine presumptive FtATGs from 22 subfamilies were identified. The number of genes varied widely among subfamilies. Most genes clustered in the FtATG18 subfamily (9 members) while following in the FtATG8 subfamily (8 members). Some subfamily members were named based on the similarity to known proteins, while some were randomly named (Table S1). The FtATG sequences exhibited great differences, and their ORF lengths range from 289 bp (FtATG12a) to 7563 bp (FtTOR). Additionally, the physicochemical properties of FtATG genes and their encoding proteins were also different, which also addressed that FtATGs function in a diverse way.
To explore the phylogenetic relationship among ATGs, 22 Neighbor-joining trees of subfamilies were constructed with 49 FtATGs, 39 OsATGs, 29 NtATGs, and 47 AtATGs (Figure 2). For single-membered subfamilies, FtATGs were often clustered into the same branch as the NtATGs from tobacco. In contrast, for subfamilies with multiple members, FtATGs were usually clustered into the same branch, including ATG10, ATG12, ATG16, VPS34, and VTI12, or clustered into several branches, such as ATG8, ATG18, and VPS35. These results suggested potential functional differentiation of FtATGs in multiple subfamilies.

2.3. Phylogenetic Tree Construction and Conserved Motifs of FtATGs

The chromosomal distribution of 49 FtATGs is shown in Figure 3. FtATGs were unevenly located in the eight chromosomes of TB. Chromosomes 1 and 8 contained the most FtATGs, each having 11 FtATGs. In addition, chromosome 7 contained seven FtATGs, while chromosome 3 contained six FtATGs. The rest of the genes were sparsely located in the remaining chromosomes. Gene replication analysis confirmed that 11 FtATGs existed in highly replicated fragments, which constructed seven pairs of collinear genes. The Ka/Ks values of these collinear genes were lower than one, indicating that purification selection was a central impactor for the ATG subfamily members.
Next, according to the TB genome annotation and CDD-search online tool, we analyzed specific exons, introns, and conserved domains of FtATGs (Figure 4). Based on their functions, FtATGs were categorized into ubiquitin-like ATG12 and ATG5 conjugation complex, SNARE, ATG9/2/18 complex, ubiquitin-like ATG8, and PE conjugation complex, PI3K complex, and ATG1/13 kinase complex. There were significant differences in the number of exons and introns among the subgroups. FtATG13a only has three exons, while FtTOR has 57 exons. The exon-intron information within the same subgroups showed high similarity. For example, the genes in the FtATG8 subgroup all have five exons. According to the genome annotation information, FtATG13a and FtATG12b lacked the non-coding regions at the 5′ end, whereas the non-coding regions at the 3′ end were absent in FtATG2, FtATG9, FtVPS34b, FtVPS5a, FtATG8b, FtATG8c, FtATG10a, FtATG10b, FtATG16a, FtATG16b, and FtVTI12d, respectively. These results indicated that the genome annotation information might be partially incorrect, which means further improvement is required.

2.4. Analysis of FtATGs Expression Pattern under Stress

To identify the core candidates for FtATGs in response to drought and salt stress, we analyzed their expression pattern according to the transcriptome data of TB under the corresponding stress (Figure 5; Table S2). The results showed that FtATGs exhibited different expression patterns. Some genes expressed at extremely low levels, such as FtATG10b, FtATG13c, and FtATG16c. Among the rest of the FtATGs, the members of the FtATG8 subfamily were the most prominent. FtATG8a and FtATG8f showed remarkably high expression, suggesting that they may be potentially important stress resistance genes. Therefore, given the high total number of 49 FtATGs identified and the importance of FtATG8s in autophagy, we chose to conduct an in-depth study of FtATG8s.

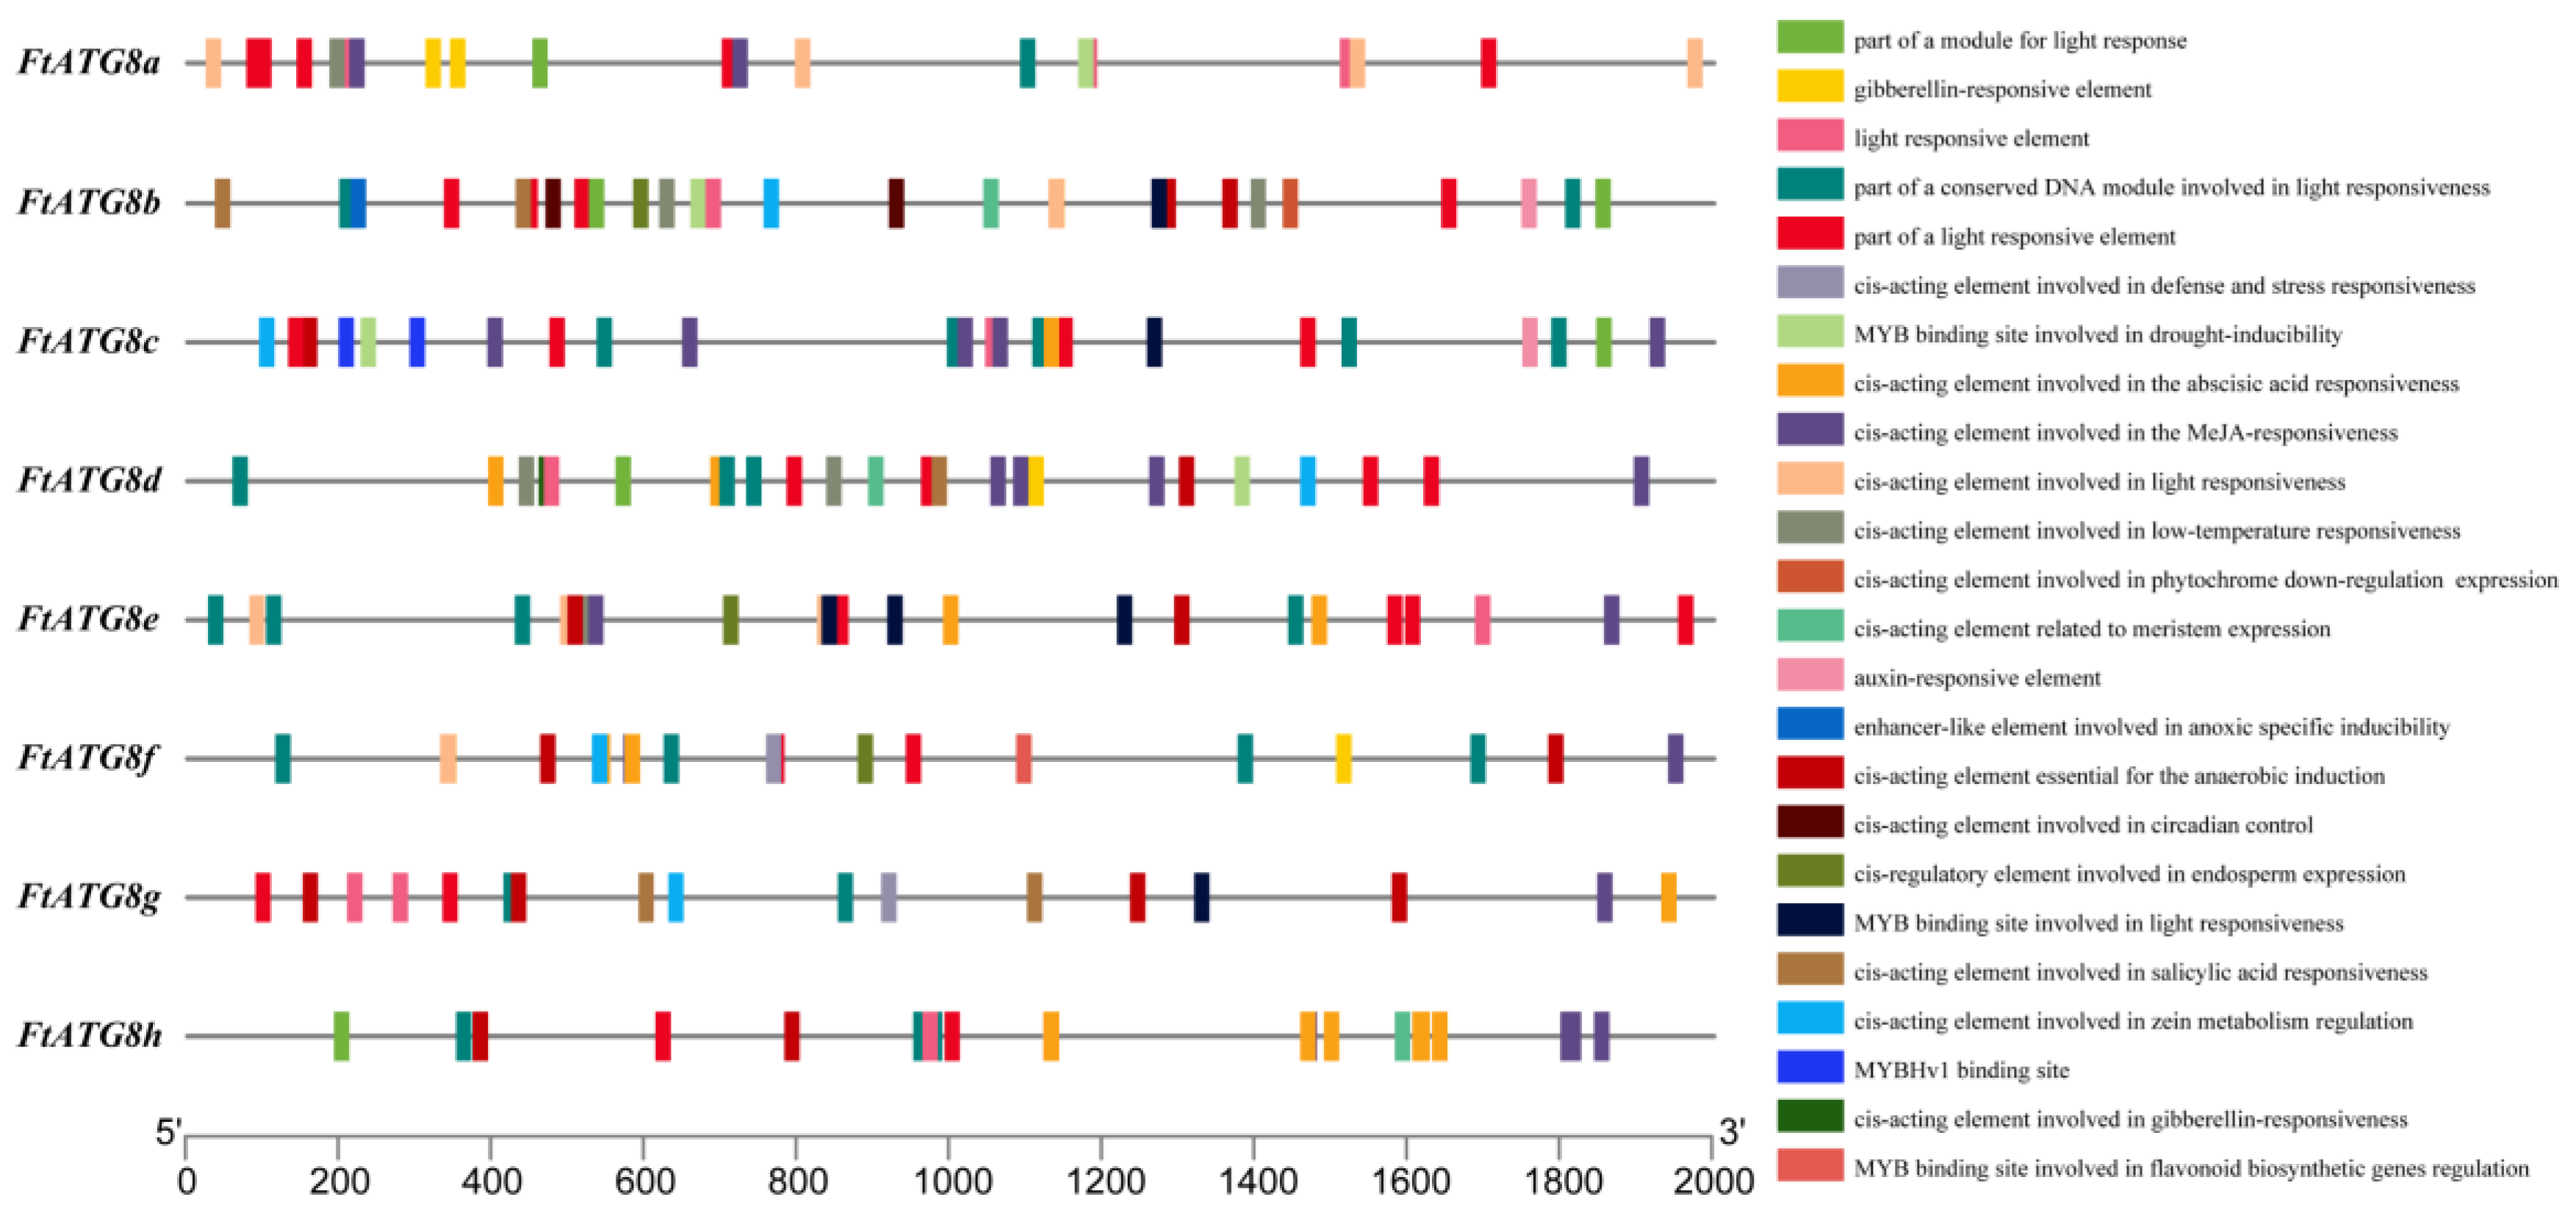
2.5. Cis-Acting Elements in FtATG8s Promoter

To accurately predict the function of FtATG8s and understand the potential regulation mechanism, the cis-acting elements in the promoter region of FtATG8s were analyzed (Figure 6; Table S3). The results showed that all FtATG8s contained anaerobic induction, light, and hormone (methyl jasmonate [MeJA] and abscisic acid [ABA]) cis-elements. Among them, the FtATG8a promoter had up to 15 light response elements. Four FtATG8s (FtATG8a, FtATG8b, FtATG8d, and FtATG8e) contain low-temperature response elements. Three FtATG8s (FtATG8a, FtATG8f, and FtATG8g) were with defense and stress elements, and only FtATG8b had circadian rhythm response elements. In addition, all FtATG8s had at least one MYB binding element. FtATG8f and FtATG8g have MYB binding sites involved regulating flavonoid biosynthesis genes, and FtATG8a, FtATG8b, and FtATG8c have MYB binding sites involved in drought induction.

2.6. Prediction of FtATGs Interacting Proteins

For the proteins interacting with FtATG8s in TB, an interaction network involving FtATG8s was established (Figure 7). Results showed that FtATG8s were more likely to interact with other members of the ATG family and possibly with four ubiquitin-related proteins such as FtPinG0004028300.01.T01, indicating that autophagy can also influence the protein degradation in the ubiquitous pathway. Besides, FtATG8s can interact with a peroxisomal biogenesis protein FtPinG0002923800.01.T01, suggesting autophagy might recruit peroxisome biogenesis in TB.

2.7. Correlation Analysis between FtATG8s and Stress Resistance-Related Transcription Factors

Here, to explore the potential transcriptional regulation mechanism of FtATG8s, the correlation analysis between the expression of FtATG8s and related transcription factor genes from TB under drought and salt stress was performed (Figure 8). The results implied that FtATG8a, FtATG8c, and FtATG8g exhibited a high correlation with numerous stress-related transcription factors in TB, suggesting that FtATG8s may be extensively transcriptionally regulated. These findings also revealed a high degree of correlation between the expression levels of FtATG8s and most stress-related transcription factors such as FtMYB10, FtMYB21, FtbHLH2, FtNAC2, and FtNAC6, which further indicates that FtATG8s may be involved in the salt and drought stress in TB.

2.8. Expression Analysis of FtATG8s in Different TB Tissues

The FtATG8s in TB may be related to the spatiotemporal specificity. Thus, we investigate the tissue-specific expressed FtATG8s. Expression patterns of such genes are diverse in the tissues of TB, showing that FtATG8s have different functions in TB (Figure 9). FtATG8b was significantly expressed at high levels in roots and seeds. In addition, the expression of FtATG8a and FtATG8e was much higher in roots and stems compared to other tissues. Meanwhile, FtATG8d, FtATG8f, and FtATG8g had the highest expression in seeds.

2.9. Expression Modes of FtATG8s under Abiotic Stresses

Since TB often grows in high-altitude barren areas, cold is the major abiotic stress it faces, except drought. Therefore, we studied the expression patterns of FtATG8s under cold, drought, and salt stress. As shown in Figure 10, most FtATG8s are up-regulated at least at one time point under different stresses. Remarkably, FtATG8s show significantly different expression patterns. The expression of FtATG8a and FtATG8e peaked at 3 h, while the rest of FtATG8s peaked at 12 h, especially FtATG8f. These results further illustrated the spatiotemporal specificity of FtATG8s in response to abiotic stress. FtATG8a and FtATG8f are significantly up-regulated under stress at the first and second time points, respectively.

2.10. Overexpression of FtATG8a and FtATG8f May Enhance Drought Resistance in TB

To explore the impacts of overexpression of FtATG8a and FtATG8f on drought stress, 2-week-old TB cotyledons were transformed by vacuum infiltration under the same growth conditions (Figure 11A). Compared to the control group, after transient transformation of FtATG8a and FtATG8f for 16 h, the expression level of FtATG8a increased to 2.34 times, and the expression level of FtATG8f was 2.74 times (p < 0.01) (Figure 11B). The determination of antioxidant enzyme activity after 12 h of drought stress suggests that the SOD and POD contents of the experimental group are significantly higher than those in the control group (Figure 11C,D). This suggests that overexpression of FtATG8a and FtATG8f strengthens the drought tolerance in TB, which might be related to the regulation of ROS levels.

3. Discussion

Drought, salt, and climate stress are the main natural environmental factors affecting the physical spread of plants, limiting agricultural plant productivity and threatening food security [16]. How plants adapt to these unfavorable environmental factors is a fundamental biological problem. In addition, enhancing plant resilience is vital to agricultural fertility and stability, as poorly resilient crops consume excessive water and fertilizer [17]. Autophagy extensively functions in plant growth, development, and stress response [18]. The in-depth study of autophagy in TB contributes to understanding the molecular mechanism of plant response to abiotic stress and promotes the breeding of excellent stress-resistant varieties. Besides Arabidopsis, autophagy genes are also found in higher plants, such as 32 OsATGs in rice [19], 26 CsATGs in Sweet Orange [20], 80 CsATGs in tea [21], etc. We screen 49 FtATGs genes in the TB genome. Similar to Arabidopsis and other plants, we found that FtATG8 and FtATG18 contained multiple members. However, TB had three FtATG16s and four FtVTI12s, respectively. It was different from Arabidopsis, with only one AtATG16 and ATVTI12. This result suggested that the autophagy genes in TB were species-specific.
The phylogenetic tree analysis showed that among Arabidopsis, Nicotiana tabacum, and Oryza sativa, FtATGs had the highest homology with Nicotiana tabacum, which is also a dicotyledon. Notably, FtATG8 and FtATG18 are the two most abundant subgroups, and their members share similar conservative domains and high-frequency gene duplication events. These results suggest that FtATG8s and FtATG18s may have functional redundancy, assuming their expression patterns may have space-time specificity. Our results also deepen the possibility of this speculation. Several duplication events were predicted in the FtATG family. Evolutionary events such as duplication can extend the gene family members, while some point mutations in exon regions, as well as the regulatory site, could affect the expression and function of duplicated members [22,23]. It seems that FtATG family genes have extended under evolutionary pressures, and some new members have acquired new functions.
Analysis of cis-acting elements in the gene promoter regions allowed the prediction of potential mechanisms of gene regulation [24]. The results showed that phytohormone-related acting elements were present in all FtATGs, indicating that FtATGs played an important role in TB growth. Different environmental stimulatory elements were found in the promoter regions of some FtATGs, suggesting that FtATGs crucially functioned in response to stress. The presence of many light-responsive elements suggested that light was an important signal regulating FtATGs expression.
ATG8 genes are critical in the plant abiotic stress response. We revealed that all FtATG8s were inductively expressed under drought, low temperature, or salt stress and showed different expression patterns. Among them, FtATG8a was upregulated under drought conditions while FtATG8e was significantly downregulated, similar to CsATGs in sweet orange [25], CaATGs in pepper [26], etc. The reason may be due to different abiotic stresses regulating autophagy through different pathways [27]. Moreover, autophagy is a long-term regulatory process. In grapes, genes such as Vvatg1b are induced in 20 days of drought stress but not in 24–48 h [28]. Some autophagy genes respond at the early stage, and some respond later, which is also supported by our results.
Due to its species specificity, the transient transformation of TB is challenging, difficult to manipulate, and has a low positivity rate [29]. Compared with general syringe injection methods, vacuum infiltration is simple to operate and has better applicability among tissues. This technique has been successfully applied in Arabidopsis [30], Brassica oleracea [31], and Prunus armeniaca [32]. In this experiment, the TB cotyledons were successfully transformed by Agrobacterium-mediated vacuum infiltration. It validated that their overexpression of FtATG8a and FtATG8f could enhance resistance to drought stress in TB.
Since the mechanism of autophagy has been fully studied, it is necessary to unravel its possible regulatory relationship. AtTGA9, a positive regulatory transcription factor for autophagy, was identified in Arabidopsis [33]. The promoter element analysis illustrated that FtATG8 promoters have MYB binding elements, and FtATG8e has three MYB binding elements. Combined with the high correlation of MYB transcription factors in the correlation analysis between FtATG8s and abiotic stress-related transcription factors of TB, it indicates that MYB transcription factors may regulate FtATG8s. Moreover, plants often adapt to the environment by synthesizing anthocyanins and other flavonoids upon abiotic stress, which also relates to autophagy. It reported that the deficient ATG in Arabidopsis caused the low vacuolar content of anthocyanin [34]. In this study, we also observed that FtATG8f and FtATG8g might regulate genes functioning in flavonoid biosynthesis together with MYB. This result strongly proposed that FtATG8s responding to stress in TB may not only be limited to the elimination of peroxidase but also be involved in the metabolism of secondary plant products.

4. Materials and Methods

4.1. Identification of FtATG Genes

In order to screen ATG genes in TB, we downloaded the genome data from the website http://www.mbkbase.org/Pinku1/, accessed on 12 April 2022. Arabidopsis thaliana, Nicotiana tabacum, and Oryza sativa ATG proteins from the website (https://www.ncbi.nlm.nih.gov/, accessed on 25 April 2022) were used as queries to search for TB proteins using BLASTP. All presumed ATG genes were submitted to the Pfam database (http://Pfam.xfam.org/, accessed on 25 April 2022) to verify the existence of ATG domains. The ATG genes of all identified in TB were named FtATGs.

4.2. Autophagosome Monitoring of TB Roots

2-week-old hydroponic TB seedlings were subjected to natural drought stress by removing water from the culture pots for 24 h and incubated with 300 μM Monodansyl-cadaverine (Solarbio, Beijing, China) dye for 15 min under vacuum. Subsequently, after the remaining Monodansyl-cadaverine dye was washed with PBS, roots were observed under a laser scanning confocal microscope (excitation light wavelength was 488 nm).

4.3. Analysis of Main Characteristics of ATG Family Members in TB

The phylogenetic tree of ATG protein sequences of TB and three other species (Arabidopsis thaliana, Nicotiana tabacum, and Oryza sativa) was constructed using the NJ method in MEGA 10 with 2000 bootstrap replicates, which was visualized by iTOL (https://iTOL.embl.de/, accessed on 6 May 2022). We analyzed all FtATG distributions, gene structures, motifs, and cis-acting elements, using TB genome annotation information. Then, we visualized the results by using TBtools [29]. The characteristic motifs of FtATGs were defined by MEME (http://MEME-suite.Org/tools/meme, accessed on 8 May 2022). Furthermore, in order to analyze the cis-acting function in the promoter region of the FtATGs, we truncated the 2 kb sequence upstream of the start codon of the FtATG genes, which was recorded in the PlantCARE Database (http://bioinformatics.psb.ugent.be/webtools/plantcare/html/, accessed on 9 May 2022). The gene duplication events and collinearity analysis of FtATGs were evaluated and performed.

4.4. Heat Map of the FtATG Expression Patterns under Stresses

The heat map was created to show the FtATG expression patterns under stress treatments using TBtools with available transcriptomic data (Table S2). Transcriptome data under salt stress were obtained from the NCBI with accession number PRJNA528524 (http://www.ncbi.nlm.nih.gov/Traces/sra/, accessed on 22 May 2022). Transcriptome data upon drought treatment (20% PEG6000) were generated confidentially (unpublished).

4.5. Plant Materials and Treatments

In this study, the TB variety “Xiqiao No. 2” was the plant material grown at Sichuan Agricultural University, Ya’an, China. The buckwheat cotyledon grown in hydroponic culture for 14 d were subjected to the following abiotic stress treatments (20% PEG6000 (w/v) and 150 mM NaCl and 4 °C). The cotyledons were collected at 3 h and 12 h, then immediately frozen in liquid nitrogen for storage at −80 °C refrigerator.

4.6. Construction of Protein-Protein Interaction Network

ATG8 protein sequences with string for protein-protein interaction prediction (http://string-db.org/, accessed on 11 June 2022) were combined. Cytoscape (http://www.cytoscape.Org/, accessed on 17 June 2022) was applied to visualize the regulatory network of other proteins and ATG8s.

4.7. Correlation Analysis between FtATG8s and Transcription Factors

To predict the function of FtATG8s, transcription factors whose functions have been identified from TB, including MYB (FtMYB7, FtMYB9, FtMYB10, FtMYB11, FtMYB13, FtMYB17, FtMYB21, and FtMYB22) bHLH (FtbHLH2, FtbHLH3, and FtbHLH4), NAC (FtNAC2, FtNAC3, FtNAC4, FtNAC5, FtNAC6, FtNAC7, FtNAC8, FtNAC9, and FtNAC31), bZIP (FtbZIP83 and FtbZIP5) were used to analyze. Together with the transcriptome data used in the heat map analysis, the correlation analysis between FtATG8s and transcription factors was calculated using the ggcor function in R language 4.2 and the default Pearson correlation coefficient.

4.8. Transient Expression of FtATG8a and FtATG8f in TB Cotyledons

To further investigate the function of TB FtATG genes, we chose to clone the full coding sequences of FtATG8a and FtATG8f, respectively. The ORF of FtATG8a and FtATG8f were PCR-amplified using primers (Table S4). Then, the sequence was inserted into the plant overexpression vector pCHF3-YFP (Vazyme, Nanjing, China). The recombinant plasmid was transformed into TB cotyledons by Agrobacterium-mediated vacuum infiltration. Under the same conditions, pCHF3-YFP was instantaneously transformed as a control group. Sixteen hours after transformation, cotyledons from the experimental and control groups were placed on MS plates containing 200 mM mannitol for 16 h; Superoxide peroxidase (POD) and dismutase (SOD) contents were then measured in the experimental and control groups. SOD and POD were measured by the method of Yao [29].

4.9. Quantitative Real-Time PCR Analysis

Total RNA was extracted by EASY spin Plant RNA Kit (Aidlab, Beijing, China) as a template for synthesis of the First-strand cDNAs by qPCR (Vazyme, Nanjing, China) using HiScrip® III–RT SuperMix. The qRT-PCR primers (Table S5) were designed with primer 3 (https://www.ncbi.nlm.nih.gov/Tool/primer-blast/, accessed on 29 June 2022). 2xChamQ Universal SYBR qPCR Master Mix (Vazyme, Nanjing, China) was used for qRT-PCR. The amplification procedure was as follows: 34 cycles of 98 °C for 45 s, then 98 °C for 15 s, and 60 °C for 45 s. The relevant expression data were calculated using the 2−ΔΔCT method, while FtH3 was used as the internal reference gene. Each group contains three replicates.

4.10. Statistical Analysis

The experimental data were processed and visualized by GraphPad Prism (GraphPad Prism 8.0, GraphPad Software, San Diego, CA, USA) and shown in mean ± SD. The significant difference was indicated at the 0.05 and 0.01 levels calculated with ANOVA in IBM SPSS Statistics. (IBM SPSS Statistics 22.0, International Business Machines Corporation, Armonk, NY, USA)

5. Conclusions

In this study, we revealed that autophagy in buckwheat responds to drought stress and identified 49 FtATG genes from the TB genome. The phylogenetic tree constructed and the motif analysis strongly support the FtATGs identification. Analysis of the protein interaction of FtATG8s and its expression patterns with stress-related transcription factors showed that FtATG8s might be involved in the expression regulation of stress genes. Lastly, stress experiments reveal that overexpression of FtATG8a and FtATG8f might improve the resistance of TB to stress by strengthening the activity of antioxidant enzymes.

Supplementary Materials

The following supporting information can be downloaded at: https://www.mdpi.com/article/10.3390/ijms232314845/s1, Table S1: Physical and chemical properties of ATG family. Table S2: Transcriptome data. Table S3: Cis-acting elements of FtATGs promoter. Table S4: Primers used for construct expression vector of FtATG8a and FtATG8f for expression of recombinant plasmid in Tartary buckwheat using pCHF-YFP vector. Table S5: Primer sequences of RT-qPCR.

Author Contributions

Y.F. completed the experiment and wrote the manuscript, S.W. analyzed the data, H.W. revised and edited the manuscript, C.L., H.Z. and H.C. directed the experiment, X.W. and Q.W. designed the entire experiment. All authors have read and agreed to the published version of the manuscript.

Funding

This work was supported by the State Key Laboratory of Crop Gene Exploration and Utilization in Southwest China (SKL-KF202211) and the National Key R&D Program of China (2021YFD1200105).

Acknowledgments

The authors are grateful to all colleagues in our laboratory for very useful discussions and technical assistance. We would like to thank the editor and reviewers for their constructive comments, valuable recommendations, and feedback, which facilitated the quality of the article.

Conflicts of Interest

The authors declare that they have no competing interests.

References

  1. Zhu, J.-K. Abiotic stress signaling and responses in plants. Cell 2016, 167, 313–324. [Google Scholar] [CrossRef] [PubMed] [Green Version]
  2. Miryeganeh, M. Plants’ epigenetic mechanisms and abiotic stress. Genes 2021, 12, 1106. [Google Scholar] [CrossRef] [PubMed]
  3. Nakamura, S.; Masanori, I. Chlorophagy is ATG gene-dependent microautophagy process. Plant Signal. Behav. 2019, 14, 1554469. [Google Scholar] [CrossRef] [PubMed] [Green Version]
  4. Izumi, M.; Ishida, H.; Nakamura, S.; Hidema, J. Entire photodamaged chloroplasts are transported to the central vacuole by autophagy. Plant Cell 2017, 29, 377–394. [Google Scholar] [CrossRef] [PubMed] [Green Version]
  5. Zhao, P.; Zhou, X.-M.; Zhao, L.-L.; Cheung, A.Y.; Sun, M.-X. Autophagy-mediated compartmental cytoplasmic deletion is essential for tobacco pollen germination and male fertility. Autophagy 2020, 16, 2180–2192. [Google Scholar] [CrossRef] [PubMed]
  6. Yoshitake, Y.; Ohta, H.; Shimojima, M. Autophagy-mediated regulation of lipid metabolism and its impact on the growth in algae and seed plants. Front. Plant Sci. 2019, 10, 709. [Google Scholar] [CrossRef] [Green Version]
  7. Chen, H.; Dong, J.; Wang, T. Autophagy in plant abiotic stress management. Int. J. Mol. Sci. 2021, 22, 4075. [Google Scholar] [CrossRef]
  8. Yue, J.; Wang, Y.; Jiao, J.; Wang, H. Silencing of ATG2 and ATG7 promotes programmed cell death in wheat via inhibition of autophagy under salt stress. Ecotoxicol. Environ. Saf. 2021, 225, 112761. [Google Scholar] [CrossRef]
  9. Sun, X.; Wang, P.; Jia, X.; Huo, L.; Che, R.; Ma, F. Improvement of drought tolerance by overexpressing MdATG18a is mediated by modified antioxidant system and activated autophagy in transgenic apple. Plant Biotechnol. J. 2018, 16, 545–557. [Google Scholar] [CrossRef] [Green Version]
  10. Nguyen, T.N.; Padman, B.S.; Usher, J.; Oorschot, V.; Ramm, G.; Lazarou, M. ATG8 family LC3/GABARAP proteins are crucial for autophagosome–lysosome fusion but not autophagosome formation during PINK1/Parkin mitophagy and starvation. J. Cell Biol. 2016, 215, 857–874. [Google Scholar] [CrossRef]
  11. Lystad, A.H.; Simonsen, A. Mechanisms and pathophysiological roles of the ATG8 conjugation machinery. Cells 2019, 8, 973. [Google Scholar] [CrossRef] [PubMed] [Green Version]
  12. Li, B.; Liu, G.; Wang, Y.; Wei, Y.; Shi, H. Overexpression of banana ATG8f modulates drought stress resistance in Arabidopsis. Biomolecules 2019, 9, 814. [Google Scholar] [CrossRef] [PubMed] [Green Version]
  13. Huo, L.; Sun, X.; Guo, Z.; Jia, X.; Che, R.; Sun, Y.; Zhu, Y.; Wang, P.; Gong, X.; Ma, F. MdATG18a overexpression improves basal thermotolerance in transgenic apple by decreasing damage to chloroplasts. Hortic. Res. 2020, 7, 21. [Google Scholar] [CrossRef] [PubMed] [Green Version]
  14. Huo, L.; Guo, Z.; Wang, P.; Zhang, Z.; Jia, X.; Sun, Y.; Sun, X.; Gong, X.; Ma, F. MdATG8i functions positively in apple salt tolerance by maintaining photosynthetic ability and increasing the accumulation of arginine and polyamines. Environ. Exp. Bot. 2020, 172, 103989. [Google Scholar] [CrossRef]
  15. Li, H.; Lv, Q.; Liu, A.; Wang, J.; Sun, X.; Deng, J.; Chen, Q.; Wu, Q. Comparative metabolomics study of Tartary (Fagopyrum tataricum (L.) Gaertn) and common (Fagopyrum esculentum Moench) buckwheat seeds. Food Chem. 2022, 371, 131125. [Google Scholar] [CrossRef]
  16. Jacques, C.; Salon, C.; Barnard, R.L.; Vernoud, V.; Prudent, M. Drought stress memory at the plant cycle level: A review. Plants 2021, 10, 1873. [Google Scholar] [CrossRef]
  17. Zhang, H.; Zhu, J.; Gong, Z.; Zhu, J.-K. Abiotic stress responses in plants. Nat. Rev. Genet. 2022, 23, 104–119. [Google Scholar] [CrossRef]
  18. Zeng, X.; Zeng, Z.; Liu, C.; Yuan, W.; Hou, N.; Bian, H.; Zhu, M.; Han, N. A barley homolog of yeast ATG6 is involved in multiple abiotic stress responses and stress resistance regulation. Plant Physiol. Biochem. 2017, 115, 97–106. [Google Scholar] [CrossRef] [Green Version]
  19. Xia, K.; Liu, T.; Ouyang, J.; Wang, R.; Fan, T.; Zhang, M. Genome-wide identification, classification, and expression analysis of autophagy-associated gene homologues in rice (Oryza sativa L.). DNA Res. 2011, 18, 363–377. [Google Scholar] [CrossRef] [Green Version]
  20. Fu, X.-Z.; Zhou, X.; Xu, Y.-Y.; Hui, Q.-L.; Chun, C.-P.; Ling, L.-L.; Peng, L.-Z. Comprehensive analysis of autophagy-related genes in sweet orange (Citrus sinensis) highlights their roles in response to abiotic stresses. Int. J. Mol. Sci. 2020, 21, 2699. [Google Scholar] [CrossRef]
  21. Huang, W.; Ma, D.-N.; Liu, H.-L.; Luo, J.; Wang, P.; Wang, M.-L.; Guo, F.; Wang, Y.; Zhao, H.; Ni, D.-J. Genome-wide identification of CsATGs in tea plant and the involvement of CsATG8e in nitrogen utilization. Int. J. Mol. Sci. 2020, 21, 7043. [Google Scholar] [CrossRef] [PubMed]
  22. Faraji, S.; Heidari, P.; Amouei, H.; Filiz, E.; Abdullah; Poczai, P. Investigation and computational analysis of the sulfotransferase (SOT) gene family in Potato (Solanum tuberosum): Insights into sulfur adjustment for proper development and stimuli responses. Plants 2021, 10, 2597. [Google Scholar] [CrossRef]
  23. Heidari, P.; Abdullah; Faraji, S.; Poczai, P. Magnesium transporter gene family: Genome-wide Identification and characterization in Theobroma cacao, Corchorus capsularis, and Gossypium hirsutum of family malvaceae. Agronomy 2021, 11, 1651. [Google Scholar] [CrossRef]
  24. Sheshadri, S.A.; Nishanth, M.J.; Simon, B. Stress-mediated cis-element transcription factor interactions interconnecting primary and specialized metabolism in planta. Front. Plant Sci 2016, 7, 1725. [Google Scholar] [CrossRef] [PubMed] [Green Version]
  25. Zhai, Y.; Guo, M.; Wang, H.; Lu, J.; Liu, J.; Zhang, C.; Gong, Z.; Lu, M. Autophagy, a conserved mechanism for protein degradation, responds to heat, and other abiotic stresses in Capsicum annuum L. Front. Plant Sci. 2016, 7, 131. [Google Scholar] [CrossRef] [Green Version]
  26. Yan, B. Links between drought stress and autophagy in plants. Plant Signal. Behav. 2020, 15, 87. [Google Scholar]
  27. Lv, X.; Pu, X.; Qin, G.; Zhu, T.; Lin, H. The roles of autophagy in development and stress responses in Arabidopsis thaliana. Apoptosis 2014, 19, 905–921. [Google Scholar] [CrossRef]
  28. Shangguan, L.; Fang, X.; Chen, L.; Cui, L.; Fang, J. Genome-wide analysis of autophagy-related genes (ARGs) in grapevine and plant tolerance to copper stress. Planta 2018, 247, 1449–1463. [Google Scholar] [CrossRef]
  29. Yao, Y.; Zhao, H.; Sun, L.; Wu, W.; Li, C.; Wu, Q. Genome-wide identification of MAPK gene family members in Fagopyrum tataricum and their expression during development and stress responses. BMC Genom. 2022, 23, 96. [Google Scholar] [CrossRef]
  30. Bernat-Silvestre, C.; De Sousa Vieira, V.; Sánchez-Simarro, J.; Aniento, F.; Marcote, M.J. Transient Transformation of A. thaliana Seedlings by Vacuum Infiltration; Springer: New York, NY, USA, 2021; pp. 147–155. [Google Scholar]
  31. Hu, D.; Bent, A.F.; Hou, X.; Li, Y. Agrobacterium-mediated vacuum infiltration and floral dip transformation of rapid-cycling. Brassica rapa. BMC Plant Biol. 2019, 19, 246. [Google Scholar] [CrossRef] [Green Version]
  32. Pérez-Caselles, C.; Faize, L.; Burgos, L.; Alburquerque, N. Improving adventitious shoot regeneration and transient Agrobacterium-mediated transformation of apricot (Prunus armeniaca L.) hypocotyl sections. Agronomy 2021, 11, 1338. [Google Scholar] [CrossRef]
  33. Wang, P.; Nolan, T.M.; Yin, Y.; Bassham, D.C. Identification of transcription factors that regulate ATG8 expression and autophagy in Arabidopsis. Autophagy 2020, 16, 123–139. [Google Scholar] [CrossRef] [PubMed]
  34. Katarzyna, S.; Andisheh, P.; Kenji, Y.; Shino, G. Microautophagy in plants: Consideration of its molecular mechanism. Cells 2020, 9, 887. [Google Scholar]
Figure 1. Accumulated autophagosomes in TB roots under drought stress. Autophagosomes were stained by MDC dye. Control indicates TB roots without drought treatment. Scale bars: 20 μm.
Ijms 23 14845 g001
Figure 2. Phylogenetic analysis of ATG proteins from Fagopyrum tataricum and other plants. Neighbor-joining trees are constructed with 49 FtATGs of Fagopyrum tataricum (Ft), 39 OsATGs of Oryza sativa (Os), 29 NtATGs of Nicotiana tabacum (Nt), and 47 AtATGs of Arabidopsis thaliana (At) using the MEGAX software, with 2000 bootstrap replicates. The proteins of TB are marked in red. The phylogenetic tree shows bootstrap values above 50%.
Ijms 23 14845 g002
Figure 3. Chromosomal distribution and gene duplication of FtATGs. FtATGs with fragment duplicates were marked in blue, and the red lines represent the collinearity between two genes.
Ijms 23 14845 g003
Figure 4. Domains and gene structures of FtATGs. (A) The exon-intron structures. The colorful rectangles represent exons, except the gray rectangles indicate the untranslated regions (UTRs). Introns are indicated by black lines. (B,C) Domains of the corresponding genes. The 49 FtATG genes were described based on their functions in autophagy.
Ijms 23 14845 g004
Figure 5. The expression heatmap of FtATGs under drought and salt stress. Each row represents one gene, and every three columns represent different replicates for each treatment.
Ijms 23 14845 g005
Figure 6. Cis-acting elements in the promoter regions of FtATG8s. Cis-acting elements with analogous functions were presented in the same color as indicated. The colorful rectangles on the right column represent cis-acting elements with different functions.
Ijms 23 14845 g006
Figure 7. Analysis of the functional interaction network of FtATG8 proteins. FtATG8s were highlighted in yellow. Proteins in red were predicted to encode ubiquitin-related proteins, and the pink indicated a peroxisomal protein. Other FtATGs were shown in blue, and undermined proteins were in green.
Ijms 23 14845 g007
Figure 8. Correlations of expression patterns between FtATGs and other transcription factors. RStudio was applied for this visualization. Line thickness mapping absolute value of correlation, color mapping p value credibility (* p < 0.05, ** p < 0.01, *** p < 0.001). FtMYB7 (FtPinG0003734600.01), FtMYB9 (FtPinG0002001900.01), FtMYB10 (FtPinG0002706600.01), FtMYB11 (FtPinG0008533900.01), FtMYB13 (FtPinG0005410000.01), FtMYB17 (FtPinG0006925500.01), FtMYB21 (FtPinG0004929500.01), FtMYB22 (FtPinG0003119800.01), FtNAC2 (FtPinG0005692100.01), FtNAC3 (FtPinG0000381200.01), FtNAC4 (FtPinG0005791100.01), FtNAC5 (FtPinG0006190400.01), FtNAC6 (FtPinG0005624400.01), FtNAC7 (FtPinG0005167000.01), FtNAC8 (FtPinG0002252000.01), FtNAC9 (FtPinG0002967400.01), FtNAC31 (FtPinG0005167000.01), FtbHLH2 (GenBank:KU296218), FtbHLH4 (FtPinG0002267300.01), FtbHLH3 (GenBank:KU296217.1), FtbZIP83 (FtPinG0002143600.01), FtbZIP5 (FtPinG0003196200.01).
Ijms 23 14845 g008
Figure 9. qRT-PCR analysis of FtATG8s in different tissues. R (root), S (stem), L (leaf), F (flower), FL (seed). The minimum expression levels of each gene in the five tissues were set to 1. Error bars represent SD calculated from three experiment repeats. Letters on the bars represent significant differences among (α = 0.05, Duncan) tissues.
Ijms 23 14845 g009
Figure 10. Relative expression of FtATG8 genes under cold, NaCl, and drought treatments. The expression of FtATG8s was set to “1” after 3 and 12 h without stress. The R package was used to generate a heat map based on the mean log2FC values of three biological replicates.
Ijms 23 14845 g010
Figure 11. Effects of transient overexpression of FtATG8a and FtATG8f on antioxidant enzyme activity in TB. (A) Transient transformation of TB cotyledon by pCHF3-FtATG8a-YFP (termed FtATG8a-OE), pCHF3-FtATG8f-YFP (termed FtATG8a-OE), and pCHF3-YFP (termed Control) mediated by Agrobacterium tumefaciens in vacuum infiltration. (B) Relative expression of FtATG8a and FtATG8f after transient expression. (C,D) Determination of POD and SOD under abiotic stress. Error bars indicate the SD of three independent experiments. Asterisks indicate significant differences (* p < 0.05, ** p < 0.01, *** p < 0.001).
Ijms 23 14845 g011
Publisher’s Note: MDPI stays neutral with regard to jurisdictional claims in published maps and institutional affiliations.

