Article

Identification of Novel Genomic Regions for Bacterial Leaf Pustule (BLP) Resistance in Soybean (Glycine max L.) via Integrating Linkage Mapping and Association Analysis

1
National Center for Soybean Improvement, Key Laboratory of Biology and Genetics and Breeding for Soybean, Ministry of Agriculture, State Key Laboratory of Crop Genetics and Germplasm Enhancement, Nanjing Agricultural University, Nanjing 210095, China
2
College of Plant Protection, Nanjing Agricultural University, Nanjing 210095, China
3
Department of Horticultural Science, North Carolina State University, Raleigh, NC 27607, USA
4
CSIR-Crops Research Institute, Kumasi AK420, Ghana
5
Department of Entomology and Plant Pathology, North Carolina State University, Raleigh, NC 27607, USA
6
National Soybean Improvement Center Shijiazhuang Sub-Center, North China Key Laboratory of Biology and Genetic Improvement of Soybean, Ministry of Agriculture, Laboratory of Crop Genetics and Breeding of Hebei, Cereal & Oil Crop Institute, Hebei Academy of Agricultural and Forestry Sciences, Shijiazhuang 050000, China
*
Authors to whom correspondence should be addressed.
Int. J. Mol. Sci. 2022, 23(4), 2113; https://doi.org/10.3390/ijms23042113
Submission received: 30 December 2021 / Revised: 9 February 2022 / Accepted: 11 February 2022 / Published: 14 February 2022
(This article belongs to the Special Issue Molecular Genetics and Breeding Mechanisms in Crops)

Abstract

:
Bacterial leaf pustule (BLP), caused by Xanthornonas axonopodis pv. glycines (Xag), is a worldwide disease of soybean, particularly in warm and humid regions. To date, little is known about the underlying molecular mechanisms of BLP resistance. The only single recessive resistance gene rxp has not been functionally identified yet, even though the genotypes carrying the gene have been widely used for BLP resistance breeding. Using a linkage mapping in a recombinant inbred line (RIL) population against the Xag strain Chinese C5, we identified that quantitative trait locus (QTL) qrxp–17–2 accounted for 74.33% of the total phenotypic variations. We also identified two minor QTLs, qrxp–05–1 and qrxp–17–1, that accounted for 7.26% and 22.26% of the total phenotypic variations, respectively, for the first time. Using a genome-wide association study (GWAS) in 476 cultivars of a soybean breeding germplasm population, we identified a total of 38 quantitative trait nucleotides (QTNs) on chromosomes (Chr) 5, 7, 8, 9,15, 17, 19, and 20 under artificial infection with C5, and 34 QTNs on Chr 4, 5, 6, 9, 13, 16, 17, 18, and 20 under natural morbidity condition. Taken together, three QTLs and 11 stable QTNs were detected in both linkage mapping and GWAS analysis, and located in three genomic regions with the major genomic region containing qrxp_17_2. Real-time RT-PCR analysis of the relative expression levels of five potential candidate genes in the resistant soybean cultivar W82 following Xag treatment showed that of Glyma.17G086300, which is located in qrxp–17–2, significantly increased in W82 at 24 and 72 h post-inoculation (hpi) when compared to that in the susceptible cultivar Jack. These results indicate that Glyma.17G086300 is a potential candidate gene for rxp and the QTLs and QTNs identified in this study will be useful for marker development for the breeding of Xag-resistant soybean cultivars.

1. Introduction

Bacterial leaf pustule (BLP), caused by the causal agent Xanthomonas axonopodis pv. glycines (Xag), is one of the most destructive foliar diseases in susceptible soybean cultivars. BLP causes a significant reduction in soybean yield and quality worldwide, especially in the soybean production areas in China [1], Korea [2], Thailand [3,4], the USA [5,6], and Benin [7], where seasonal high temperature and humidity favor Xag growth and development. Thus, BLP disease is more severe in South China, especially at Yangtze–Huai River Basins, in comparison with North China [1]. Recently, the incidence of BLP disease in South China has been rising along with global warming and the frequent occurrence of storms [1,8,9]. For example, the tropical storm ‘Rumbia’ caused an outbreak of BLP disease in the soybean growing area of Jianghuai River Basin in China in August 2018. In addition, it was reported that 88% of soybean growing in the fields in South Korea in 1998 were severely infected by Xag. Similarly, it accounted for 20.7–34.9% of soybean yield losses in Thailand in 1983 [2,10].
Xag infects soybean through natural openings and wounds on the abaxial surface of soybean leaves with the possibility to extend to stalks and petioles [5,11]. Typical BLP symptoms include small yellow-to-brown lesions with raised pustules in the lesion centers on infected soybean leaves, causing premature defoliation [5,11]. The pustule lesions caused by Xag can always be used as the infection sites by other microbial pathogens such as bacterium Pseudomonas tabaci, the causal agent of soybean wildfire disease [5]. Moreover, the BLP disease is easily misdiagnosed as Asian soybean rust caused by Phakopsora pachyrhizi [6], and the application of inappropriate pesticides could cause unnecessary economic burden to farmers.
To reduce economic losses in soybean production, disease resistance breeding is considered as the most cost-effective, efficient, and environmentally safe approach to achieve yield stability [12]. It was thought that a single major recessive resistance gene rxp confers BLP resistance while its dominant allele and associated genes regulate the degree of susceptibility [13,14]. The recessive rxp allele was originally determined in the soybean cv. CNS (P.I. 71,569), which is a highly BLP-resistant (near immune) cultivar and was developed in Nanjing, China [13]. To date, rxp has been widely used for the development of commercial BLP-resistant soybean cultivars worldwide [13,15]. In addition, rxp also confers resistance to soybean wildfire disease, which sometimes occurs with BLP disease [13].
The dominant Rxp allele, which confers susceptibility to the BLP disease, was originally found to be linked to the malate dehydrogenase (Mdh) locus with an about 16% recombination in a population of 650 F2 soybean plants developed from the crosses of Clark 63 and P.I. 437,477B [16]. Then, the Rxp locus was mapped to the genomic region between markers Satt372 and Satt014 on chromosome (Chr) 17 by using the hybrid offspring of resistant parent Coker 237 and susceptible parent P.I. 97,100, as well as the resistant parent Young and susceptible parent P.I. 416,937 [5].
QTL fine mapping located the recessive rxp in the 33-kb-long genomic fragment between markers SNUSSR17_9 and SNUSNP17_12 on Chr 17, which contains three genes, i.e., serine/threonine/tyrosine-protein kinase HT1 coding gene Glyma17g09770, membrane protein coding gene Glyma17g09780, and zinc finger protein coding gene Glyma17g09790; the latter two were predicted to be the key candidate resistance genes [2]. A GWAS study identified one significant SNP in each of Glyma01g40560, Glyma01g40590, Glyma11g20310, and Glyma17g09801 that was associated with BLP resistance [17]. An RNA-Seq analysis identified the differentially expressed genes (DEGs) between resistant and susceptible soybean varieties under the infection of Xag strain 8ra at 0, 6, and 12 h post-inoculation (hpi) [18]. Interestingly, no significant difference was detected in the relative expression levels of Glyma17g09780 and Glyma17g09790 between the resistant and susceptible soybean varieties at 0, 6, and 12 hpi [18]. Several minor QTLs conferring resistance to various Xag isolates were also identified on Chr 18, 05, 04, 13, 19, and 10 in the recombinant inbred lines (RILs) derived from a cross between susceptible parent ‘Suwonl57’ and resistance parent ‘Danbaekkong’ using 76 SSR markers [14]. Furthermore, a novel QTL/gene responsible for BLP resistance was located at 21.5 cM away from the SSR marker Sat_108 on Chr 10 in P.I. 96,188, a soybean variety that only exhibits pustules without chlorotic haloes following Xag infection [19]. In addition, a few disease resistance genes were reported to be involved in BLP resistance in soybean. For example, the soybean LATERAL ORGAN BOUNDARY1 (GmLob1; Glyma.05g040500) was predicted to be targeted by the virulence factor (tal2b) of Xag as its homolog CsLOB1 in Citrus sinensis has been reported as a resistance gene to citrus canker disease caused by X. citri subsp. Citri (Xcc) [20,21]. A soybean lesion-mimic mutant NT302 containing a defective hydroperoxide lyase (HPL) gene Glyma.12g191400 (GmHPL) exhibited high susceptibility to Xag strain C5, indicating GmHPL’s role in Xag resistance [22].
In the present study, we assessed the BLP resistance level in a soybean RIL population and an association panel of soybean breeding lines in multiple environments. Then, we applied linkage mapping and GWAS for the identification of the BLP resistance QTLs and quantitative trait nucleotides (QTNs) in the soybean genome, leading to the identification of novel QTLs/QTNs. Our linkage mapping and GWAS revealed that BLP resistance is governed by one single major QTL qrxp–17–2 and two minor QTLs qrxp–05–1 and qrxp–17–1 that were identified for the first time in the present study. The relative expression of five potential candidate genes in the resistant soybean cultivar W82 and susceptible cultivar Jack following Xag treatments showed that Glyma.17G086300, which is located in qrxp–17–2, is a candidate gene for rxp.

2. Results

2.1. The BLP Resistance of the Soybean RIL and Association Panel Lines and Their Relationship with Flowering Time

BLP resistance was assessed in the soybean RIL population under the artificial inoculation condition and in the soybean association panel under both the artificial inoculation and natural morbidity conditions. The frequency distributions of the phenotypic data of soybean resistance to BLP disease exhibited a normal distribution pattern (Figure S1, see Supplementary Materials). Under the artificial inoculation condition, the mean infection responses (IRs) of the RIL in 2014–2015 and the association panel lines in 2014–2016 varied from 4.08 ± 2.71 to 5.65 ± 2.62 and from 2.76 ± 1.54 to 3.64 ± 1.76, respectively (Table 1). However, the mean IRs of the association panel lines under the national morbidity condition in 2018 varied from 2.54 ± 1.72 to 4.33 ± 1.88 (Table 1), indicating the severity of the BLP disease under the natural morbidity condition in 2018 (Figure 1). In addition, the BLP resistance levels in both populations showed a continuous variation from 1 to 9 (Tables S1–S3), demonstrating that the BLP resistance in these soybean lines is a quantitative trait and regulated by multiple genes. Analysis of variance (ANOVA) of the BLP resistance in each population under either condition (spray or the natural morbidity) indicated that the effects of genotype (G), environment (E), and genotype × environment (G × E) interactions were significant at the p < 0.001 level of significance (Table 1). The only exception came from the G × E interactions in the RIL lines under the spray condition, which were significant at the p < 0.05 level of significance. Moreover, the broad-sense heritability (h2) for BLP resistance in the two populations under either condition was 79.81% or greater (Table 1), indicating that the majority of phenotypic variation of BLP resistance in these soybean lines was attributed to effects of genotype (G).
Additionally, the flowering time of the soybean association panel was recorded under the natural morbidity condition in 2018 (Table S3) [23]. The correlation analysis showed a significant negative correlation at the p < 0.05 level (r = −0.29) between the BLP resistance level and flowering time, except the correlation was insignificant between the BLP resistance level and flowering time in the 2018DT-natural environment (Table S4).

2.2. Genetic Linkage Map Construction and Linkage Mapping in the Soybean RIL Population

A genetic map used for linkage mapping analysis was constructed in the soybean RILs. A total of 18.77 and 14.78 M reads and 1.58 and 1.24 Gbp bases of raw data were obtained for the two parents of the RIL population (Zhengyang and M8206), respectively. In addition, the mapped reads of two parents were 11.82 and 9.22 M and the mapped bases were 0.99 and 0.77 Gbp, respectively. The genome coverage of these two parents were 8.7 and 7.8%, respectively. For the RIL populations, a total of 66,677 SNPs were identified, and the average SNP density across the soybean 20 chromosomes was 6.85 SNPs per 100 kb (Table S5).
Using the composite interval mapping (CIM) method, we identified three QTLs, i.e., qrxp_5_1, qrxp_17_1, and qrxp_17_2, which were associated with BLP resistance in the RIL population in the 2014JP– and/or 2015JP–spray environments (Table 2). Among them, qrxp_5_1 and qrxp_17_1 were detected in the 2015JP–spray environment and located in the physical intervals of 1–1,169,356 bp on Chr 05 and 5,158,677–5,994,063 bp on Chr 17, respectively. The qrxp_5_1 explained for 7.26% of phenotypic variation of BLP resistance with a negative effect, while qrxp_17_1 accounted for 22.26% of the phenotypic variation of BLP resistance with a positive effect (Table 2). The qrxp_17_2 was detected in both environments and located in the physical interval of 6,777,393–6,883,854 bp on Chr 17, explaining for 74.33% of phenotypic variance in the 2014JP–spray environment, and located in 6,293,843–6,883,854 bp on Chr 17, accounting for 34.68% of the phenotypic variance in the 2015JP–spray environment (Table 2). The qrxp_17_2 showed a positive effect to BLP resistance and was considered as the most stable QTL associated with BLP resistance in soybean (Table 2).

2.3. Population Structure and Linkage Disequilibrium (LD) Analyses in the Soybean Association Panel

The 476 lines of the soybean association panel were genotyped using a high-density soybean array that consisted of 61,166 high-quality SNPs [24]. Clustering analysis using the neighbor joining method grouped all these lines into three groups (Figure 2A). The principal component analysis (PCA) also grouped them into three groups (Figure 2B). The first and second PCs explained for 17.27% and 5.02% of the total variance, respectively. The results of clustering analysis and PCA showed that the soybean lines derived from the same geographical locations and the same parental materials were generally grouped into the same subpopulations. The LD analysis showed that the r2 decreased gradually as the physical distance increased, and the LD decay distance was estimated at 1.39 Mb, where r2 dropped to being half of its maximum value of 0.74428 (Figure 2C).

2.4. Association Mapping in the Soybean Association Panel

BLP resistance in the association panel was evaluated under the artificial inoculation condition by using Xag C5 in Jiangpu from 2014 to 2016. The GWAS analysis detected 38 QTNs that were significantly associated with BLP resistance under the recommended threshold of −log10(p) ≥ 4 and distributed on eight chromosomes (Figure 3; Table S6). These QTNs explained for 3.26–6.04% of the phenotypic variation (Table S6). Among these QTNs, Gm17_7603802 and Gm17_7603992 on Chr 17 explained for the highest amount of phenotypic variation, i.e., 6.04%. A total of eight QTNs, i.e., Gm09_36501019, Gm17_7603802, Gm17_7603992, Gm17_7712768, Gm17_7721556, Gm17_7736150, Gm17_7754016, and Gm17_7754048, were identified in at least two environments (Table S6).
BLP resistance of the association panel was also evaluated under the natural morbidity condition in Jiangpu and Dangtu in 2018. The GWAS analysis revealed that 34 SNPs were associated with BLP assistance at the suggested threshold of −log10(p) ≥ 4 and distributed on nine chromosomes (Figure 3; Table S7). Among them, Gm17_7712768 explained for the phenotypic variation of 3.31–7.30% (Table S7). We found that 11 out of the 34 QTNs were co-localized with the QTNs identified in the same association panel under the artificial inoculation condition (Table 3). These 11 QTNs were Gm05_7667820, Gm05_7668047, Gm17_5628119, Gm17_5628133, Gm17_7603802, Gm17_7604008, Gm17_7712768, Gm17_7721556, Gm17_7736150, Gm17_7754016, and Gm17_7754048. A total of 13 and 11 stable QTNs associated with BLP resistance were identified in the association panel in ≥2 environments under both the artificial inoculation and natural morbidity conditions, respectively (Table 3; Tables S6 and S7). On the basis of the LD distance, we extended the significant associated region to cover 1.39 Mb upstream and downstream of the most significantly associated QTN positions (Table 3).

2.5. Co–Location Regions between Linkage Mapping and GWAS Analysis

The three QTLs identified by linkage mapping and the 11 stable QTNs identified by GWAS were co-localized in three genomic regions (Table 2 and Table 3; Figure 4). QTL qrxp_5_1 and two stable QTNs Gm05_7667820 and Gm05_7668047 were localized in genomic region 1, i.e., the 1–7,668,047 bp region on Chr 05. QTL qrxp_17_1 and QTNs Gm17_5628119 and Gm17_5628133 were localized in genomic region 2, i.e., the 5,158,677–5,994,063 bp region on Chr 17. QTL qrxp_17_2 was co-localized with eight stable QTNs in the 6,777,393–7,754,048 bp region on Chr 17 of genomic region 3. Thus, these genetic regions are closely linked to the causal effects of variations in the BLP resistance in soybean, making them robust regions for the identification of candidate genes.

2.6. Effects of the Most Significant Alleles in Three QTNs Individually or in Combination on BLP Resistance in Multiple Environments

Among the 11 stable QTNs identified by GWAS, Gm05_7667820, Gm17_5628119, and Gm17_7603802 explained for the highest phenotypic variation in the three co-localized genomic regions, respectively (Table 3). Thus, we assessed the effects of the most significant alleles G/A, T/C, and T/C in the QTNs Gm05_7667820, Gm17_5628119, and Gm17_7603802, respectively, on BLP resistance in multiple environments. The disease indexes of soybean cultivars containing Gm05_7667820 (G) and Gm17_7603802 (T) were significantly lower than that of soybean varieties containing Gm05_7667820 (A) and Gm17_7603802 (C) (Figure 5). Moreover, the disease indexes of the resistant soybean cultivars containing the three resistance alleles GTT were significantly lower than that containing the three susceptible alleles ACC (Figure 5). As a result, the cumulative effect of the three resistant alleles was able to increase the resistance for BLP disease in resistant soybean.

2.7. Prediction of Candidate BLP Resistance Gene in Soybean

Among the three BLP resistance QTLs and the 11 stable BLP resistance QTNs co-localized in three genomic regions, the genomic region 3 covers the single major recessive resistance gene rxp. To further analyze the candidate genes of rxp in the genomic region 3, we downloaded all the 120 genes located in the region from the Soybase website (Table S8). Among them, 16 genes are located in qrxp_17_2. Haplotype analysis showed that the SNPs in this genomic region were clustered into five haplotype blocks (Figure 6). The stable QTNs associated with BLP resistance were clustered into the second haplotype block covering 21 genes located in the 170-kb-long genomic region from 7.59 to 7.76 Mb (Figure 6). The remaining 83 genes are located between qrxp_17_2 and the second LD block (Table S8). Genes in the literature that meet one of the following criteria were predicted to be candidate BLP resistance genes: having been identified by gene mapping in soybean populations under Xag treatment, being responsive to the infection of Xag strains in soybean, and the paralogous genes responsive to the infection of Xanthornonas strains in other plant species. As a result, a total of four genes (i.e., Glyma.17G086300, Glyma.17G090100, Glyma.17G090200, and Glyma.17G090400) located between qrxp_17_2 and the second LD block were identified to meet at least one of the three criteria (Table 4). Thus, these four genes together with Glyma.05G040500 (the homolog of Glyma.17G086300, located near qrxp_5_1) were selected as the candidate BLP resistance genes for further analysis (Table 4).

2.8. Differential Expression Analysis of Candidate BLP Resistance Genes in Soybean

In order to quantify the relative gene expression levels of each of the five candidate resistance genes in resistant and susceptible soybean cultivars following Xag (strain EB08) inoculation, we performed real-time RT-PCR (qPCR) in the leaf samples of cv. W82 (Xag resistant) and cv. Jack (Xag susceptible) at 0, 12, 24, 48, 72, and 120 hpi by using Cons4 and Cons6 as the internal control (or reference) genes (Tables S9 and S10) [25]. The average relative expression levels of Glyma.17G090100, Glyma.17G090200, and Glyma.17G090400 in W82 showed no significant difference from that of Jack across the six time points after Xag EB08 treatments (Figure 7A–C). In comparison to Jack, however, the average relative expression levels of Glyma.17G086300 was significantly increased in W82 at 24 and 72 hpi, while that of Glyma.05G040500 was significantly decreased in W82 at 24, 48, and 120 hpi (Figure 7D,E).

3. Discussion

Soybean BLP is a worldwide disease and causes serious soybean yield reduction under high temperature and humidity. To date, only the soybean genotypes containing the unidentified recessive resistance gene rxp have been used in BLP resistance breeding, even though soybean BLP resistance is a quantitative trait that is regulated by multiple genes and affected by the interaction between genotypes and environment in the field. Although several BLP resistance QTLs have been identified previously, little is known about the underlying molecular mechanisms of BLP resistance in soybean. In the present study, we combined linkage mapping and GWAS to identify the BLP resistance QTLs and QTNs in soybean, leading to the identification of a potential candidate gene for rxp.
The linkage mapping and GWAS methods are frequently utilized to identify disease resistance QTLs. Linkage mapping is based on the co-segregation of genetic regions over the genome in bi-parental families [26,27]. A drawback of this method is that the construction of the RIL populations is very time-consuming and laborious. Another drawback of this method is that it is only able to detect allelic diversity between the bi-parents, and its resolution highly depends on the number of recombination events. Considering QTL intervals usually extend over several cM, this limited resolution makes it extremely challenging to identify the target genes. This challenge could be overcome by using GWAS, which studies nature populations composed of numerous varieties [28]. GWAS can be used to detect the loci with multiple alleles over a genome. It can also be used to narrow down the detected QTL regions [28]. This is why GWAS has been used to identify the target genes associated with traits in various plant species [23,29,30]. However, the effectiveness of GWAS was limited by factors such as the false positives, linkage disequilibrium, complex population structures, and the alleles with the substantial effects on trait phenotypes but low frequencies in the populations [31,32]. Thus, linkage mapping and association analysis can be used together to facilitate genetic architecture analysis and the identification of target genes underlying large QTLs [33,34].
Earlier studies have reported four QTLs/marker–trait association (MTA) genomic regions on Chr 01, 10, 11, and 17 in soybean, correspondingly, with the single recessive resistance gene rxp being located on Chr 17 [2,17,19]. In this study, we identified three genomic regions that contain three BLP resistance QTLs and 11 stable BLP resistance QTNs and were significantly associated with BLP resistance by combining linkage mapping and GWAS analysis (Figure 3; Table 2 and Table 3). Moreover, two new minor QTLs, qrxp_5_1 (in genomic region 1) and qrxp_17_1 (in genomic region 2), were identified on Chr 05 and 17, respectively, for the first time (Table 2). These two new QTLs were further confirmed by the co-localization of QTNs Gm05_7667820 and Gm05_7668047 with qrxp_5_1 and QTNs Gm17_5628119 and Gm17_5628133 with qrxp_17_1 (Table 2 and Table 3). Moreover, genomic region 3 containing qrxp_17_2 and eight QTNs was located in the same genomic region as rxp (7.30 Mb) (Figure 4). We also evaluated the effects of the most significant SNPs Gm05_7667820, Gm17_5628119, and Gm17_7603802, which were distributed in the three genomic regions of soybean, on the improvement of BLP resistance. The average resistance of soybean lines containing all the three resistance alleles significantly increased when compared with that containing the three susceptible counterparts (Figure 5). Thus, BLP-resistant soybean cultivars can be developed through polymerization breeding. Furthermore, the QTLs and QTNs identified in this study can be used for marker-assisted selection of BLP-resistant soybean lines.
Using fine mapping and GWAS, Kim et al. [2] and Chang et al. [17] predicted Glyma17g09780 (Glyma.17G090100), Glyma17g09790 (Glyma.17G090200), and Glyma.17g09801 (Glyma.17G090400) as the candidate genes for rxp. Among them, Glyma.17G090100 is a casparian strip membrane domain protein (CASP) gene containing transmembrane regions and similar to that in Mildew Resistance Locus O (MLO) in barley, which confers powdery mildew resistance [35]. Glyma.17G090200 is a C3H4-type zinc finger gene whose homolog in Arabidopsis, AT3G47990, encodes an E3 ubiquitin-protein ligase SIS3-like protein (SUGAR-INSENSITIVE 3), a positive regulator of sugar signaling during early seedling development, and is responsive to cabbage leaf curl virus (CaLCuV) infection [36,37]. Glyma.17G090400 contains a significant SNP, bacterial pustule 1-g3, in the 5′-end untranslated region (5′-UTR) and encodes a calcium-dependent protein kinase 3 (CPK3), a key regulator of both pattern-triggered immunity (PTI) and effector-triggered immunity (ETI) in Arabidopsis [17,38]. However, all of these three genes are not differentially expressed genes (DEGs) between resistant and susceptible soybean varieties under the infection of Xag strain 8ra at 0, 6, and 12 h post-inoculation (hpi) [18].
Instead, we identified four candidate resistance genes for rxp in the present study. We further tested the relative expression levels of these four candidate genes together with Glyma.05G040500 (the homolog of Glyma.17G086300, located near qrxp_5_1) in W82 (resistant) and Jack (susceptible) at 0, 12, 24, 48, 72, and 120 hpi under the infection of virulent Xag strain EB08. In order to overcome the dilution effect, we selected eight locations along the veins of each leaf for pathogen injection. In addition, we designed six sampling time points after treatment to prevent false negative results caused by insufficient sampling time points. According to the qPCR results, no significant difference was found between W82 and Jack at 12 hpi, which is consistent with the result of the reported RNA-Seq analysis [18]. However, we found that the expression of Glyma.17G090400 increased 10 times in W82 and Jack under infection than mock treatment at 72 hpi. Interestingly, the relative expression levels of two Lob genes Glyma.17G086300 and Glyma.05G040500 showed a significant difference between W82 and Jack treated with EB08. When compared with that in Jack, the former significantly increased in relative expression levels in W82 at 24 and 72 hpi, while the latter significantly decreased in relative expression levels in W82 at 24, 48, and 120 hpi (Figure 7). Glyma.17G086300 and its paralog Glyma.05G040500 were predicted to be targeted by virulence factor tal2b, a transcription activator-like effector (TALE) of Xag [20]. Xanthomonas pathogens can secrete TALEs to activate multiple susceptibility genes in many plant spaces. For example, it can secrete TALE PthA to activate the expression of the canker susceptibility gene CsLOB1 in citrus [21]. Taken together, Glyma.17G086300 is a candidate gene for rxp.

4. Material and Methods

4.1. Plant Materials

A soybean RIL population and an association panel of soybean breeding lines were used in this study. The RIL population consisting of 126 F2:9 lines was developed by using the soybean cvs. Meng8206 and Zhengyang, which are resistant and susceptible to Xag strain C5, respectively [39], as the parents, and used for linkage mapping. These RIL lines along with the two parents were planted at Jiangpu Experimental Station, Nanjing, Jiangsu Province (latitude 33°03′ N; longitude 118°63′ E) in 2014 and 2015. The association panel containing 476 soybean breeding lines [24] was used for GWAS. These breeding lines were planted at Jiangpu Experimental Station in 2014, 2015, 2016, and 2018 and at Dangtu Experimental Station, Maanshan, Anhui Province (latitude 31°34′ N; longitude 118°29′ E) in 2018.
Seeds were sowed in a randomized complete blocks design (RCBD) with three replications with 1 × 0.25 m hill plots and 50 cm row spacing. Five soybean lines with five biological replicates per line were planted in each single row plot with 20 cm distance between accessions. Three seedlings of each line were kept and grown to maturity after seed germination. Field management was conducted under normal conditions.

4.2. Pathogen Inoculation

BLP resistance was assessed in these soybean plants under both artificial inoculation and natural morbidity conditions. The artificial inoculation was carried out by using a highly pathogenic Xag strain C5 [1] to evaluate BLP resistance in the soybean RIL and association panel lines at Jiangpu in 2014, 2015, and 2016, which were named as ‘2014JP–spray’, ‘2015JP–spray’, and ‘2016JP–spray’, respectively. The C5 strain was restreaked on nutrient agar (NA) medium (BBL; Becton Diskinson and Co., Cockeysville, MD, USA) from a 30% glycerol stock at −80 °C and incubated at 28 °C for 24–48 h [1]. Then, a single colony was grown overnight in the nutrient broth (NB) liquid medium (BBL; Becton Diskinson and Co. Ltd., Cockeysville, MD, USA) on a rotary shaker (220 rpm) at 28 °C. The bacterial culture was diluted to a final concentration of 3 × 10⁸ CFU/mL using sterilized distilled water and sprayed onto both sides of the soybean leaves at the early flowering stage with a high-pressure atomizer [40]. Ten days later, the inoculated plants were sprayed again with the same strain.
The natural morbidity condition in 2018 was used to evaluate BLP resistance in the association panel at Jiangpu and Dangtu Experimental Stations due to an outbreak of BLP disease in the soybean growing area of Jianghuai River Basin in China in August 2018, which resulted from the stormy weather brought by the tropical storm ‘Rumbia’. These inoculation environments were named as ‘2018JP–natural’ and ‘2018DT–natural’, respectively.

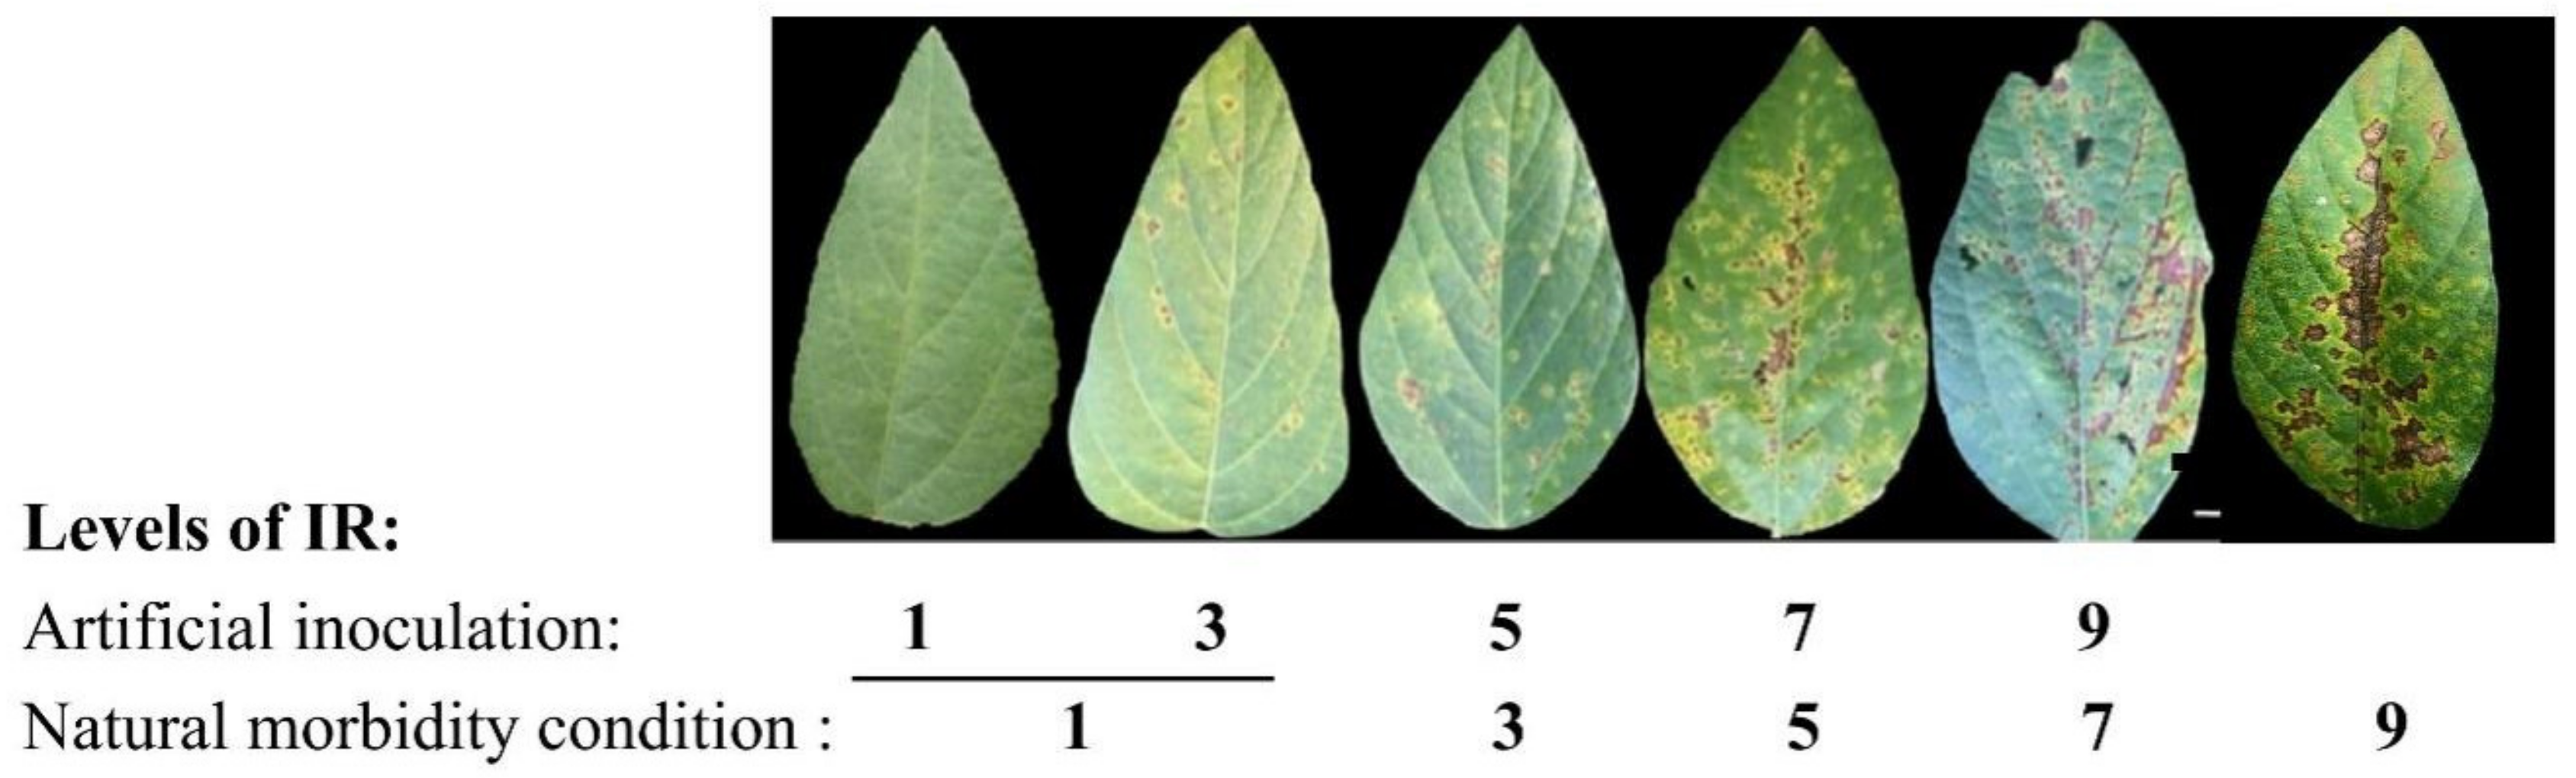
4.3. Disease Assessment

To evaluate the resistance of the soybean RIL and association panel lines under the artificial inoculation condition, we counted the disease spot numbers on the inoculated leaves of soybean plants at 14 days post-inoculation (DPI). The infection responses (IR) in the soybean genotypes under the artificial inoculation condition were grouped at five levels: Level 1, no apparent disease spots; Level 3, the existence of 5–20 localized disease spots; Level 5, the existence of 20–50 irregular spots; Level 7, the existence of >50 irregular disease spots that formed a small lesion covering 10–25% of leaf area; and Level 9, a large lesion covering more than 25% of leaf area (Figure 1).
When we considered the severity of the BLP disease under the natural morbidity condition in 2018, the five levels used to evaluate the susceptibility of soybean lines under the natural morbidity condition were Level 1, 0–20 disease spots; Level 3, 20–50 irregular disease spots; Level 5, >50 irregular disease spots that form a small lesion covering 10–25% of leaf area; Level 7, a large lesion covering 25–50% of leaf area; and Level 9, a large lesion covering more than 50% of leaf area (Figure 1).
Three biological replicates of each line were planted in a randomized complete block design with three blocks per environment. The average resistance levels of the three replicates per block in each environment were used for linkage mapping and association analysis.

4.4. Phenotypic Data Analysis

Descriptive statistics, such as mean, standard deviation (SD), maximum and minimum trait values, coefficients of variation (CV%), and skewness and kurtosis, in both soybean populations for BLP disease response were calculated using the origin pro 2018 software (Origin Lab, Northampton, MA, USA). The analysis of variance (ANOVA) for BLP disease resistance level of both soybean populations was performed to evaluate the effects of genotype (G), environment (E), and genotype × environment interaction (G × E) in the joint environments using the PROC GLM of SAS 9 (SAS Institute, 2010, Inc., Cary, NC, USA). Broad-sense heritability (h2) of BLP resistance of both soybean populations for combined environments was estimated as the following equation: h2 = σ2g/2g + σ2ge/n + σ2e/nr), where σ2g is the genetic variance, σ2ge is the genotype × environment interaction variance, σ2e is the error variance, n is the number of environments, and r valid points is the number of replications within an environment [41].

4.5. Genetic Linkage Map Construction and Linkage Mapping in the Soybean RILs

RAD-seq (restriction-site-association DNA sequencing) [42] was used to genotype the 126 individuals of the RIL population and the two parents. Briefly, the genomic DNA was extracted from approximately 1 g of young leaves of individual plants of the RIL population and the two parents using the cetyltrimethylammonium bromide (CTAB) method [43]. The DNA fragments of 400~700 bp in length obtained by TaqI digestion were sequenced on Illumina HiSeq 2000 instrument following the standard protocol for MSG (multiplexed shotgun genotyping), and 90 mer paired-end reads were generated. The reads from RIL lines were aligned against the Williams 82 reference genome (Glyma.Wm82.a1.v1.1) [44] using the SOAP2 software (version 2.21) [45]. The SNP calling was performed using Real SFS software [46] on the basis of the Bayesian estimation. Finally, the high confidence SNPs were obtained by following the filtering criteria as follows: 50 <  depth <  2500, a probability of site mutation = 95%, and every SNP loci being separated by at least 5 bp. Bin maps were then constructed for the 126 RIL lines. Consecutive SNPs were examined with a slightly modified sliding-window approach (window size: 15 SNPs, step size: one SNP) [47]. Recombination breakpoints were determined as the window sledded along the chromosome. Windows with 11 or more SNPs from either parent and windows with fewer SNPs from a single parent were considered to be homozygous and heterozygous, respectively. The consecutive 30-kb-long intervals with the same genotype in each line were joined into a bin using a PERL script according to the breakpoint information [48]. Finally, the genetic map of bin markers was constructed for the RIL population using JoinMap 4.0 [49].
Composite interval mapping (CIM) model of WINQTLCartographer2.5 [50] was used to detect QTLs for BLP resistance in RILs in each environment. A bin map with 2600 bin markers was constructed, covering 2630.2 cM. The phenotypic variance explained by a single QTL was calculated by using WINQTLCartographer2.5 software with the PVE = (VG/VP) × 100% (PVE: phenotypic variation explanation; VG: genetic variance of QTL; VP: phenotypic variance). The walk speed was set at 1 cM, and the window size was set at 10 cM. A log likelihood of 2.5 was used as the threshold for the presence of QTLs [50]. The QTLs were named according to the normal nomenclature [49].

4.6. Genotyping, Population Structure, and LD Analysis in the Soybean Association Panel

Genotyping was conducted as described in Li et al. [26] and Karikari et al. [24]. Briefly, the genomic DNA of each plant in the association panel was extracted using the CTAB method [43] and genotyped by the restriction site-associated DNA sequencing (RAD-Seq) technology. After Taq I digestion, the DNA fragments of 400–600 bp in length were obtained and then sequenced using Illumina HiSeq 2000 instrument (Illumina, San Diego, CA, USA). After being filtered, the high-quality SNPs with a >5% minor allele frequency (MAF) were used for principal component analysis (PCA), kinship analysis, LD analysis, and GWAS analysis. The genotyping data are available in the NCBI database (PRJNA648781, https://www.ncbi.nlm.nih.gov/bioproject/?term=prjna648781, accessed on 20 May 2020) and the National Center for Soybean Improvement website (http://ncsi.njau.edu.cn/info/1149/2070.htm, accessed on 20 May 2020).
Population structure analysis including the PCA of whole-genome SNPs and the construction of the neighbor-joining tree for the 476 lines in the association panel was performed using the TASSEL software version 5.2 [51] as described in Karikari et al. [24].
The linkage disequilibrium (LD) between pairwise SNPs was analyzed by calculating the LD parameter value, i.e., the squared Pearson correlation coefficient (r2) using the RTM–GWAS V1.1 software [52]. A vcf format genotype file including the 60,315 high-quality filtered SNPs created by the TASSEL software was used as the input file in the RTM–GWAS V1.1 software. For LD analysis, the maximum inter-locus distance was set at 5 Mb, and the minimum r2 threshold was set at 0.05. The calculated r2 against the physical distance between pairs of SNP markers was visualized using the origin pro 2018 software (Origin Lab, Northampton, MA, USA) with scatter plot and polynomial fitting. The LD decay rate was the physical distance where the r2 dropped from its maximum value to the half [51].

4.7. Association Analysis and Haplotype Block Analysis

Association analysis was performed by running mixed linear model (MLM) including the principal component analysis matrix (PCA) and the kinship matrix (K), i.e., MLM (PCA+K) using the TASSEL software version 5.2 [51]. Manhattan and quantile–quantile plots (QQ–plot) were created by using the qqman R package to visualize the GWAS result [53]. The distribution of p-values and the significant loci associated with BLP resistance over the whole genome in the GWAS panel were shown in the Manhattan graph. The significant threshold −log10(p) = 4.0 was used to control the genome-wide type I error rate [53]. The SNPs detected in at least two environments were considered as being relatively stable. A haplotype block analysis was performed using the Haploview software (version 4.2) [54].

4.8. Gene Annotation and Candidate Gene Prediction

The names and physical locations of the identified genes were downloaded from the Soybase database (https://soybase.org, accessed on 20 May 2020). Gene annotations were conducted according to the NCBI database. All the genes that respond to Xag infection were considered as potential candidate genes.

4.9. qPCR

Total RNA extracted from leaf samples of soybean cvs. W82 (resistant) and Jack (susceptible) following the treatment of Xag strain EB08 at 0, 12, 24, 48, 72, and 120 hpi in Zhao et al. [25] was used for cDNA synthesis and qPCR analysis of the relative expression levels of the five candidate genes, i.e., Glyma.17G090100, Glyma.17G090200, Glyma.17G090400, Glyma.17G086300, and Glyma.05G040500 in both cultivars. Three biological replicates were designed for each treatment, and three leaves of each biological replicate were infected as three technical replicates. Primer design and stepwise optimization of qPCR conditions including annealing temperatures, primer concentrations, and cDNA concentration ranges were conducted as described in Zhao et al. [25] so that R2 ≥ 0.99 and E = 100 ± 5% were achieved for the best primer pair for each gene. The relative expression levels were calculated using Cons4 and Cons6 as the two reference genes [25] and the Pfaffl method [55].

Supplementary Materials

The following supporting information can be downloaded at: https://www.mdpi.com/article/10.3390/ijms23042113/s1.

Author Contributions

T.Z. and F.Z. conceived and designed research, collected data, analyzed data, and wrote the manuscript. X.G., W.C., Y.W., W.Y., A.A.-B., L.Z., J.K., F.C., K.K. and M.Z. assisted with the Xag inoculation experiments, flowering time, and BLP resistance data collection and curation. D.H., Y.-Y.L., A.I.H. and W.L. assisted with the Xag inoculation experiments, the qPCR experiments, data collection and analysis, and contributed to the writing. All authors have read and agreed to the published version of the manuscript.

Funding

This work was supported by the National Natural Science Foundation of China (grant nos. 31871646 and 31571691), Science and Technology Innovation Team of Soybean Modern Seed Industry in Hebei (21326313D), and the Jiangsu Collaborative Innovation Center for Modern Crop Production (JCIC-MCP) Program to T.Z., and the USDA National Institute of Food and Agriculture (NIFA) Hatch project 02685 to W.L.

Institutional Review Board Statement

Not applicable.

Informed Consent Statement

Not applicable.

Data Availability Statement

Not applicable.

Acknowledgments

We are grateful for the helpful suggestions and revisions from Javaid Akhter Bhat.

Conflicts of Interest

Authors declare that there are no conflict of interest.

Abbreviations

BLPbacterial leaf pustule
XagXanthornonas axonopodis pv. glycines
GWASgenome-wide association study
QTLs/QTNsquantitative trait loci/nucleotides
MASmarker-assisted selection
PsgPseudomonas syringae pv. Glycinea
RILrecombinant inbred line
YHSBLPYangtze–Huai soybean breeding germplasm population
NA platenutrient agar plate
NBnutrient broth; MSG, multiplexed shotgun genotyping
RAD–seqrestriction site-associated DNA sequencing
SDstandard deviation
CV%coefficient of variation
ANOVAanalysis of variance
MCIMmixed composite interval mapping
Addadditive effects
PVEphenotypic variance explanation
MAFminor allele frequency
MDRmissing data ratio
PCAprincipal component analysis
LDlinkage disequilibrium
MLMmixed linear model
Kkinship control
Q–Qplotquantile–quantile plots
hpihours post-inoculation
SDstandard deviation
MRmoderately resistant
NJZM–RILRIL population consisting of 289 F2:9 lines derived through single seed descent
SSDsingle seed descent; the method from F2 generation of Zhengyanghuangdou x Meng8206 cross
HLPHelix–loop–helix
qPCRreal-time quantitative reverse-transcription PCR

References

  1. Xu, Y.; Cheng, W.; Wu, H.; Zheng, L.; Zhao, T.; Gao, X. Identification of pathogen causing bacterial pustule spot of soybean and resistance evaluation of new soybean germplasm. Soybean Sci. 2015, 3, 463–469. [Google Scholar]
  2. Kim, D.H.; Kim, K.H.; Van, K.; Kim, M.Y.; Lee, S.H. Fine mapping of a resistance gene to bacterial leaf pustule in soybean. Theor. Appl. Genet. 2010, 120, 1443–1450. [Google Scholar] [CrossRef] [PubMed]
  3. Kaewnum, S.; Prathuangwong, S.; Burr, T.J. Aggressiveness of Xanthomonas axonopodis pv. glycines isolates to soybean and hypersensitivity responses by other plants. Plant Pathol. 2005, 54, 409–415. [Google Scholar] [CrossRef]
  4. Kladsuwan, L.; Athinuwat, D.; Prathuangwong, S. Diversity of Xanthomonas axonopodis pv. glycines, the causal agent of bacterial pustule of soybean and specific primer for detection. J. Agric. 2018, 34, 77–87. [Google Scholar]
  5. Narvel, J.M.; Jakkula, L.R.; Phillips, D.V.; Wang, T.; Lee, S.H.; Boerma, H.R. Molecular mapping of Rxp conditioning reaction to bacterial pustule in soybean. J. Hered. 2001, 92, 267–270. [Google Scholar] [CrossRef] [Green Version]
  6. Heitkamp, E.C.; Lamppa, R.S.; Lambrecht, P.A.; Harveson, R.M.; Mathew, F.M.; Markell, S.G. First report of bacterial pustule on soybeans in North Dakota. Plant Health Prog. 2014, 15, 155–156. [Google Scholar] [CrossRef]
  7. Zinsou, V.A.; Afouda, L.A.C.; Zoumarou-Wallis, N.; Pate-Bata, T.; Dossou, L.; Götz, M.; Winter, S. Occurrence and characterisation of Xanthomonas axonopodis pv. glycines, causing bacterial pustules on soybean in Guinea Savanna of Benin. Afr. Crop Sci. J. 2015, 23, 203–210. [Google Scholar]
  8. Hayward, A.C. The hosts of Xanthomonas. In Xanthomonas; Swings, J.G., Civerolo, E.L., Eds.; Chapman & Hall: London, UK, 1993; pp. 1–119. [Google Scholar]
  9. Zou, J.; Zhang, Z.; Yu, S.; Kang, Q.; Shi, Y.; Wang, J.; Zhu, R.; Ma, C.; Chen, L.; Wang, J.; et al. Responses of soybean genes in the substituted segments of segment substitution lines following a Xanthomonas infection. Front. Plant Sci. 2020, 11, 972. [Google Scholar] [CrossRef]
  10. Prathuangwong, S.; Amnuaykit, K. Studies on tolerance and rate–reducing bacterial pustule of soybean cultivars/lines. Agric. Nat. Resour. 1987, 21, 408–426. [Google Scholar]
  11. Jones, S.B.; Fett, W.F. Bacterial pustule disease of soybean: Microscopy of pustule development in a susceptible cultivar. Phytopathology 1987, 77, 266–274. [Google Scholar] [CrossRef]
  12. Mundt, C.C. Durable resistance: A key to sustainable management of pathogens and pests. Infect. Genet. Evol. 2014, 27, 446–455. [Google Scholar] [CrossRef]
  13. Hartwig, E.E.; Lehman, S.G. Inheritance of resistance to the bacterial pustule disease in soybean. Agron. J. 1951, 43, 226–229. [Google Scholar] [CrossRef]
  14. Van, K.J.; Ha, B.K.; Kim, M.Y.; Moon, J.K.; Paek, N.C.; Heu, S.G.; Lee, S.H. SSR mapping of genes conditioning soybean resistance to six isolates of Xanthomonas axonopodis pv. glycines. Genes Genom. 2004, 26, 47–54. [Google Scholar]
  15. Bernard, R.L.; Weiss, M.G. Qualitative Genetics. In Soybeans Improvement, Production, and Uses; Caldwell, B.E., Ed.; American Society of Agronomy Press: Madison, WI, USA, 1973; pp. 117–154. [Google Scholar]
  16. Palmer, R.G.; Lim, S.M.; Hedges, B.R. Testing for linkage between the Rxp locus and nine isozyme loci in soybean. Crop Sci. 1992, 32, 681–683. [Google Scholar] [CrossRef]
  17. Chang, H.X.; Lipka, A.E.; Domier, L.L.; Hartman, G.L. Characterization of disease resistance loci in the USDA soybean germplasm collection using genome–wide association studies. Phytopathology 2016, 106, 1139–1151. [Google Scholar] [CrossRef] [Green Version]
  18. Kim, K.H.; Kang, Y.J.; Kim, D.H.; Yoon, M.Y.; Moon, J.K.; Kim, M.Y.; Van, K.; Lee, S.H. RNA–Seq analysis of a soybean near–isogenic line carrying bacterial leaf pustule-resistant and -susceptible alleles. DNA Res. 2011, 18, 483–497. [Google Scholar] [CrossRef] [Green Version]
  19. Kim, K.H.; Park, J.H.; Kim, M.Y.; Heu, S.; Lee, S.H. Genetic mapping of novel symptom in response to soybean bacterial leaf pustule in PI 96188. J. Crop Sci. Biotechnol. 2011, 14, 119–123. [Google Scholar] [CrossRef]
  20. Kladsuwan, L.; Athinuwat, D.; Bogdanove, A.J.; Prathuangwong, S. AvrBs3-like genes and TAL effectors specific to race structure in Xanthomonas axonopodis pv. glycines. Thai. J. Agric. Sci. 2017, 50, 121–145. [Google Scholar]
  21. Hu, Y.; Zhang, J.; Jia, H.; Sosso, D.; Li, T.; Frommer, W.B.; Yang, B.; White, F.F.; Wang, N.; Jones, J.B. Lateral organ boundaries 1 is a disease susceptibility gene for citrus bacterial canker disease. Proc. Natl. Acad. Sci. USA 2014, 111, E521–E529. [Google Scholar] [CrossRef] [Green Version]
  22. Wang, Y.; Liu, M.; Ge, D.; Akhter Bhat, J.; Li, Y.; Kong, J.; Liu, K.; Zhao, T. Hydroperoxide lyase modulates defense response and confers lesion-mimic leaf phenotype in soybean (Glycine max (L.) Merr.). Plant J. 2020, 104, 1315–1333. [Google Scholar] [CrossRef]
  23. Yan, W.; Karikari, B.; Chang, F.; Zhao, F.; Zhang, Y.; Li, D.; Zhao, T.; Jiang, H. Genome-wide association study to map genomic regions related to the initiation time of four growth stage traits in Soybean. Front. Genet. 2021, 12, 715529. [Google Scholar] [CrossRef]
  24. Karikari, B.; Wang, Z.; Zhou, Y.; Yan, W.; Feng, J.; Zhao, T. Identification of quantitative trait nucleotides and candidate genes for soybean seed weight by multiple models of genome–wide association study. BMC Plant Biol. 2020, 20, 1–14. [Google Scholar] [CrossRef]
  25. Zhao, F.; Maren, N.A.; Kosentka, P.Z.; Liao, Y.Y.; Lu, H.; Duduit, J.R.; Huang, D.; Ashrafi, H.; Zhao, T.; Huerta, A.I.; et al. An optimized protocol for stepwise optimization of real-time RT-PCR analysis. Hort. Res. 2021, 8, 179. [Google Scholar] [CrossRef]
  26. Li, S.; Cao, Y.; He, J.; Zhao, T.; Gai, J. Detecting the QTL-allele system conferring flowering date in a nested association mapping population of soybean using a novel procedure. Theor. Appl. Genet. 2017, 130, 2297–2314. [Google Scholar] [CrossRef]
  27. Yu, X.; Mulkey, S.E.; Zuleta, M.C.; Arellano, C.; Ma, B.; Milla-Lewis, S.R. Quantitative trait loci associated with gray leaf spot resistance in St. Augustinegrass. Plant Dis. 2020, 104, 2799–2806. [Google Scholar] [CrossRef]
  28. Sonah, H.; O’Donoughue, L.; Cober, E.; Rajcan, I.; Belzile, F. Identification of loci governing eight agronomic traits using a GBS–GWAS approach and validation by QTL mapping in soya bean. Plant Biotechnol. J. 2015, 13, 211–221. [Google Scholar] [CrossRef]
  29. Chang, F.; Guo, C.; Sun, F.; Zhang, J.; Wang, Z.; Kong, J.; He, Q.; Sharmin, R.A.; Zhao, T. Genome-wide association studies for dynamic plant height and number of nodes on the main stem in summer sowing soybeans. Front. Plant Sci. 2018, 9, 1184. [Google Scholar] [CrossRef] [Green Version]
  30. Miao, L.; Yang, S.; Zhang, K.; He, J.; Wu, C.; Ren, Y.; Gai, J.; Li, Y. Natural variation and selection in GmSWEET39 affect soybean seed oil content. New Phytol. 2020, 225, 1651–1666. [Google Scholar] [CrossRef]
  31. Stram, D.O. Tag SNP selection for association studies. Genet. Epidemiol. 2004, 27, 365–374. [Google Scholar] [CrossRef]
  32. Hendricks, A.E.; Zhu, Y.; Dupuis, J. Genome–wide association and linkage analysis of quantitative traits: Comparison of likelihood–ratio test and conditional score statistic. BMC Proc. 2009, 3, S100. [Google Scholar] [CrossRef] [Green Version]
  33. Korir, P.C.; Zhang, J.; Wu, K.; Zhao, T.; Gai, J. Association mapping combined with linkage analysis for aluminum tolerance among soybean cultivars released in Yellow and Changjiang River Valleys in China. Theor. Appl. Genet. 2013, 126, 1659–1675. [Google Scholar] [CrossRef] [PubMed]
  34. Cao, Y.; Li, S.; Wang, Z.; Chang, F.; Kong, J.; Gai, J.; Zhao, T. Identification of major quantitative trait loci for seed oil content in soybeans by combining linkage and genome-wide association mapping. Front. Plant Sci. 2017, 8, 1222. [Google Scholar] [CrossRef] [PubMed] [Green Version]
  35. Kim, M.C.; Panstruga, R.; Elliott, C.; Muller, J.; Devoto, A.; Yoon, H.W.; Park, H.C.; Cho, M.J.; Schulze-Lefert, P. Calmodulin interacts with MLO protein to regulate defence against mildew in barley. Nature 2002, 416, 447–451. [Google Scholar] [CrossRef] [PubMed]
  36. Huang, Y.; Li, C.Y.; Pattison, D.L.; Gray, W.M.; Gibson, S.I. Sugar-insensitive3, a ring e3 ligase, is a new player in plant sugar response. Plant Physiol. 2010, 152, 1889–1900. [Google Scholar] [CrossRef]
  37. Ascencio-Ibáñez, J.T.; Sozzani, R.; Lee, T.J.; Chu, T.M.; Wolfinger, R.D.; Cella, R.; Hanley-Bowdoin, L. Global analysis of Arabidopsis gene expression uncovers a complex array of changes impacting pathogen response and cell cycle during geminivirus infection. Plant Physiol. 2008, 148, 436–454. [Google Scholar] [CrossRef] [Green Version]
  38. Lu, Y.J.; Li, P.; Shimono, M.; Corrion, A.; Day, B. Arabidopsis calcium-dependent protein kinase 3 regulates actin cytoskeleton organization and immunity. Nat. Commun. 2020, 11, 6234. [Google Scholar] [CrossRef]
  39. Cheng, W. Germplasm evaluation and QTL Mapping of Resistance to Bacteria Strains of Leaf Pustule and Blight in Soybean Breeding Lines from Yangtze-Huai River Valley. Master’s Thesis, Nanjing Agriculture University, Nanjing, China, 2016. [Google Scholar]
  40. Guo, Y.H.; Xu, Z.G.; Yang, G. Resistance of soybean varieties to bacterial pustule spot. Soybean Sci. 2011, 30, 263–271. [Google Scholar]
  41. Nyquist, W.E.; Baker, R.J. Estimation of heritability and prediction of selection response in plant populations. Crit. Rev. Plant Sci. 1991, 10, 235–322. [Google Scholar] [CrossRef]
  42. Miller, M.R.; Dunham, J.P.; Amores, A.; Cresko, W.A.; Johnson, E.A. Rapid and cost-effective polymorphism identification and genotyping using restriction site associated DNA (RAD) markers. Genome Res. 2007, 17, 240–248. [Google Scholar] [CrossRef] [Green Version]
  43. Murray, M.G.; Thompson, W.F. Rapid isolation of high molecular weight plant DNA. Nucleic Acids Res. 1980, 8, 4321–4325. [Google Scholar] [CrossRef] [Green Version]
  44. Schmutz, J.; Cannon, S.B.; Schlueter, J.; Ma, J.; Mitros, T.; Nelson, W.; Hyten, D.L.; Song, Q.; Thelen, J.J.; Cheng, J.; et al. Genome sequence of the palaeopolyploid soybean. Nature 2010, 463, 178–183. [Google Scholar] [CrossRef] [Green Version]
  45. Li, R.; Yu, C.; Li, Y.; Lam, T.W.; Yiu, S.M.; Kristiansen, K.; Wang, J. SOAP2: An improved ultrafast tool for short read alignment. Bioinformatics 2009, 25, 1966–1967. [Google Scholar] [CrossRef] [Green Version]
  46. Yi, X.; Liang, Y.; Huerta-Sanchez, E.; Jin, X.; Cuo, Z.X.; Pool, J.E.; Xu, X.; Jiang, H.; Vinckenbosch, N.; Korneliussen, T.S. Sequencing of 50 human exomes reveals adaptation to high altitude. Science 2010, 329, 75–78. [Google Scholar] [CrossRef] [Green Version]
  47. Huang, X.; Feng, Q.; Qian, Q.; Zhao, Q.; Wang, L.; Wang, A.; Guan, J.; Fan, D.; Weng, Q.; Huang, T. High-throughput genotyping by whole-genome resequencing. Genome Res. 2009, 19, 1068–1076. [Google Scholar] [CrossRef] [Green Version]
  48. Peng, Y.; Hu, Y.; Mao, B.; Xiang, H.; Shao, Y.; Pan, Y.; Sheng, X.; Li, Y.; Ni, X.; Xia, Y. Genetic analysis for rice grain quality traits in the YVB stable variant line using RAD-seq. Mol. Genet. Genom. 2016, 291, 297–307. [Google Scholar] [CrossRef]
  49. Van Oijen, J.M. JoinMap, Version 4.0. Software for the Calculation of Genetic Linkage Maps in Experimental Populations. Kyazma BV: Wageningen, The Netherlands, 2006.
  50. Wang, S.; Basten, C.J.; Zeng, Z.B. Windows QTL Cartographer; Version 2.5; Department of Statistics, North Carolina State University: Raleigh, NC, USA, 2012. [Google Scholar]
  51. Bradbury, P.J.; Zhang, Z.; Kroon, D.E.; Casstevens, T.M.; Ramdoss, Y.; Buckler, E.S. TASSEL: Software for association mapping of complex traits in diverse samples. Bioinformatics 2007, 23, 2633–2635. [Google Scholar] [CrossRef]
  52. He, J.; Meng, S.; Zhao, T.; Xing, G.; Yang, S.; Li, Y.; Guan, R.; Lu, J.; Wang, Y.; Xia, Q.; et al. An innovative procedure of genome-wide association analysis fits studies on germplasm population and plant breeding. Theor. Appl. Genet. 2017, 130, 2327–2343. [Google Scholar] [CrossRef]
  53. Turner, S.D. qqman: An R package for visualizing GWAS results using Q-Q and manhattan plots. JOSS 2018, 3, 731. [Google Scholar] [CrossRef] [Green Version]
  54. Barrett, J.C.; Fry, B.; Maller, J.; Daly, M.J. Haploview: Analysis and visualization of LD and haplotype maps. Bioinformatics 2005, 21, 263–265. [Google Scholar] [CrossRef] [Green Version]
  55. Livak, K.J.; Schmittgen, T.D. Analysis of relative gene expression data using real-time quantitative PCR and the 2-ΔΔCt Method. Methods 2001, 25, 402–408. [Google Scholar] [CrossRef]
Figure 1. Bacterial leaf pustule disease symptoms scaled by the disease spot numbers. The BLP resistance performance of soybean plants were assessed as five levels, i.e., 1, 3, 5, 7, and 9. Scale bar of 1 cm was used.
Ijms 23 02113 g001
Figure 2. Population structure (A), principal component analysis (PCA; B), and linkage disequilibrium (LD) decay (C) of the 476 lines of the soybean association panel according to the high-density 61,166 soybean array. The LD parameters, viz., “D’” and “r2” were calculated. The LD decay rate of the population was measured as the chromosomal distance when the average r2 decreased to be half of its maximum value.
Ijms 23 02113 g002
Figure 3. Manhattan and quantile–quantile (Q–Q) plots of genome-wide association study (GWAS) for BLP resistance in 476 soybean accessions in Jiangpu 2014 (A), 2015 (B), and 2016 (C) under artificial inoculation with C5 strain and in Dangtu (D) and Jiangpu (E) under natural morbidity condition. The y-axis indicates −log10 of p-values with significant association at 4.0 (dotted line).
Ijms 23 02113 g003
Figure 4. Distribution of the quantitative trait loci (QTLs) for BLP resistance and quantitative trait nucleotides (QTNs) related with BLP resistance in a physical map identified in previous and present studies. Red color indicates the QTLs and QTNs that have been previously reported; green color represents the QTLs and QTNs identified in the present study.
Ijms 23 02113 g004
Figure 5. Effects of the alleles individually or in combination on BLP resistance over multiple environments. The bar graph shows the mean disease index. The x-axis indicates the QTNs. The red color indicates the resistant alleles, and the green color indicates the susceptible alleles. Genotypes with resistant alleles at each locus had the lowest mean disease index, while genotypes with susceptible alleles at each locus had the highest mean disease index. The p-values obtained from the t-test are indicated above each bar: * p ≤ 0.05, ** p ≤ 0.01.
Ijms 23 02113 g005
Figure 6. Haplotype–block analysis of the significant SNPs. (A) Association mapping results of the 6.88–9.01 Mb genomic region on chromosome 17. (B) Linkage disequilibrium (r2) values and haplotype blocks of the SNP markers observed in that region on chromosome 17. All the stable QTNs significantly associated with BLP resistance were located in the second LD block from 7.49 to 7.76 Mb containing 37 genes. Dark red, light red, and white color represent the strong, weak, and no LD between pairs of SNPs, respectively.
Ijms 23 02113 g006
Figure 7. Relative expression levels of candidate BLP resistance genes Glyma.17G090100 (A), Glyma.17G090200 (B), Glyma.17G090400 (C), Glyma.17G086300 (D), and Glyma.05G040500 (E) in BLP-resistant (W82) and -susceptible (Jack) soybean cultivars following Xag infection. The Xag strain EB08 was resuspended in 10 mM MgCl2 buffer to a final concentration of 1 × 10⁸ CFU/mL. Then, the bacterial suspension was injected on the leaves of W82 and Jack with 10 mM MgCl2 buffer being used as the mock treatment. The inoculated soybean leaves were sampled at 0, 12, 24, 48, 72, and 120 hpi, representing different stages of Xag infection. The relative expression levels were measured using qRT-PCR with the ATP-binding cassette transporter gene Cons4 and an F-box protein family gene Cons6 being used as the reference genes. The relative expression levels were calculated using the comparative threshold Pfaffl method. Values are the mean ± the standard error of three independent biological repetitions. Asterisks denote statistically significant difference (* p ≤ 0.05, ** p ≤ 0.01) between W82 and Jack by Student’s t-test.
Ijms 23 02113 g007
Table 1. Descriptive statistics and ANOVA for BLP disease resistance in soybean RIL and association panel populations.
PopulationEnvironmentInfection Response aRangeCV (%) bFG cFE dFG × E eh2 (%) f
RIL2014JP-spray5.65 ± 2.621–946.537.97 **116 **1.62 *79.81
2015JP-spray4.08 ± 2.711–966.49
Association panel2014JP-spray3.64 ± 1.761–948.41104.51 **7.79 **1.27 **91.63
2015JP-spray3.62 ± 2.331–964.58
2016JP-spray2.76 ± 1.541–855.98
Association panel2018JP-natural4.33 ± 1.881–943.391425.04 **9.60 **2.56 **87.43
2018DT-natural2.54 ± 1.721–868.00
a Mean ± standard deviation; b CV, coefficient of variation; c FG, the F-value of genotype; d FE, the F-value of environment; e FG × E, the F-value of genotype × environment; f h2, heritability. * Significance at p ≤ 0.005; ** significance at p ≤ 0.001.
Table 2. BLP-resistant QTLs identified by linkage mapping in the soybean RIL population under the artificial inoculation condition.
QTLChromosomeGenetic Position (cM)LODAdditiveR2 (%) aConfidence Interval (cM)Physical Position (bp)Environment
qrxp_5_150.014.17−0.747.260.00~0.501~1,169,3562015JP-spray
qrxp_17_11726.919.081.3222.2624.60~27.905,158,677~5,994,0632015JP-spray
qrxp_17_21734.8133.012.2974.3333.50~36.606,777,393~6,883,8542014JP-spray
32.8115.991.6734.6831.60~34.806,293,843~6,883,8542015JP-spray
a Phenotypic variance (%) explained by the peak markers.
Table 3. QTNs associated with BLP resistance identified by GWAS in the soybean association panel under artificial and natural morbidity conditions.
QTNsChromosomePhysical Position (bp)−log10p ar2 (%) bEnvironmentSignificant Associated Region
Gm05_766782057,667,8204.063.302016JP-spray6,277,820–9,057,820
4.213.422018DT-natural
Gm05_766804757,668,0474.063.302016JP-spray
4.213.422018DT-natural
Gm09_36501019936,501,0194.653.872014JP-spray35,111,019–37,891,019
4.243.482015JP-spray
Gm17_5628119175,628,1194.643.862016JP-spray4,238,119–7,018,119
4.453.652018DT-natural
Gm17_5628133175,628,1334.643.862016JP-spray
4.453.652018DT-natural
Gm17_7603802177,603,8024.143.392014JP-spray6,213,802–8,993,802
4.994.202015JP-spray
6.876.042016JP-spray
8.747.882018DT-natural
Gm17_7604008177,604,0085.044.242016JP-spray
6.765.892018DT-natural
Gm17_7603992177,603,9924.143.392014JP-spray
4.994.202015JP-spray
6.876.042016JP-spray
Gm17_7712768177,712,7685.134.352015JP-spray
6.775.942018DT-natural
8.177.302018JP-natural
4.133.312015JP-spray
Gm17_7721556177,721,5564.954.172016JP-spray
6.465.642018DT-natural
8.327.452015JP-spray
Gm17_7736150177,736,1504.333.582016JP-spray
5.194.392018DT-natural
6.685.812014JP-spray
Gm17_7754016177,754,0164.053.302015JP-spray
5.114.322016JP-spray
6.665.832018DT-natural
8.147.262014JP-spray
Gm17_7754048177,754,0484.053.302015JP-spray
5.114.322016JP-spray
6.665.832018DT-natural
8.147.26
a p, the statistical p-value for the significance of the odds ratio in the GWAS. b r2 (%), phenotypic variance (%) explained by the peak markers. Bold QTNs indicate that the markers can be located by GWAS under both artificial inoculation and natural morbidity conditions. The significant associated region was 1.39 Mb upstream and downstream of the most significantly associated QTN positions.
Table 4. Candidate resistance genes of rxp on chromosome 17 selected for further analysis.
Wm82.a2.1Homolog in A. thalianaGene NameReference
Glyma.17G086300AT5G63090Lateral organ boundaries (LOB) domain-containing protein 25Kladsuwan et al., 2017
Glyma.17G090100AT2G36330CASP-like protein 4A3Kim et al., 2010; Chang et al., 2016
Glyma.17G090200AT3G47990E3 ubiquitin-protein ligase SIS3-likeKim et al., 2010; Chang et al., 2016
Glyma.17G090400AT4G23650N.A.Chang et al., 2016
Publisher’s Note: MDPI stays neutral with regard to jurisdictional claims in published maps and institutional affiliations.

