
Early Alterations of Intra-Mural Elastic Lamellae Revealed by Synchrotron X-ray Micro-CT Exploration of Diabetic Aortas


 , , ,
, , ,  ,
,
Abstract
:
1. Introduction
2. Results
2.1. Typical Result of Synchrotron X-Ray Micro-Computed Tomography of a Mouse Artery
2.2. Comparison to Diabetes Mouse Model
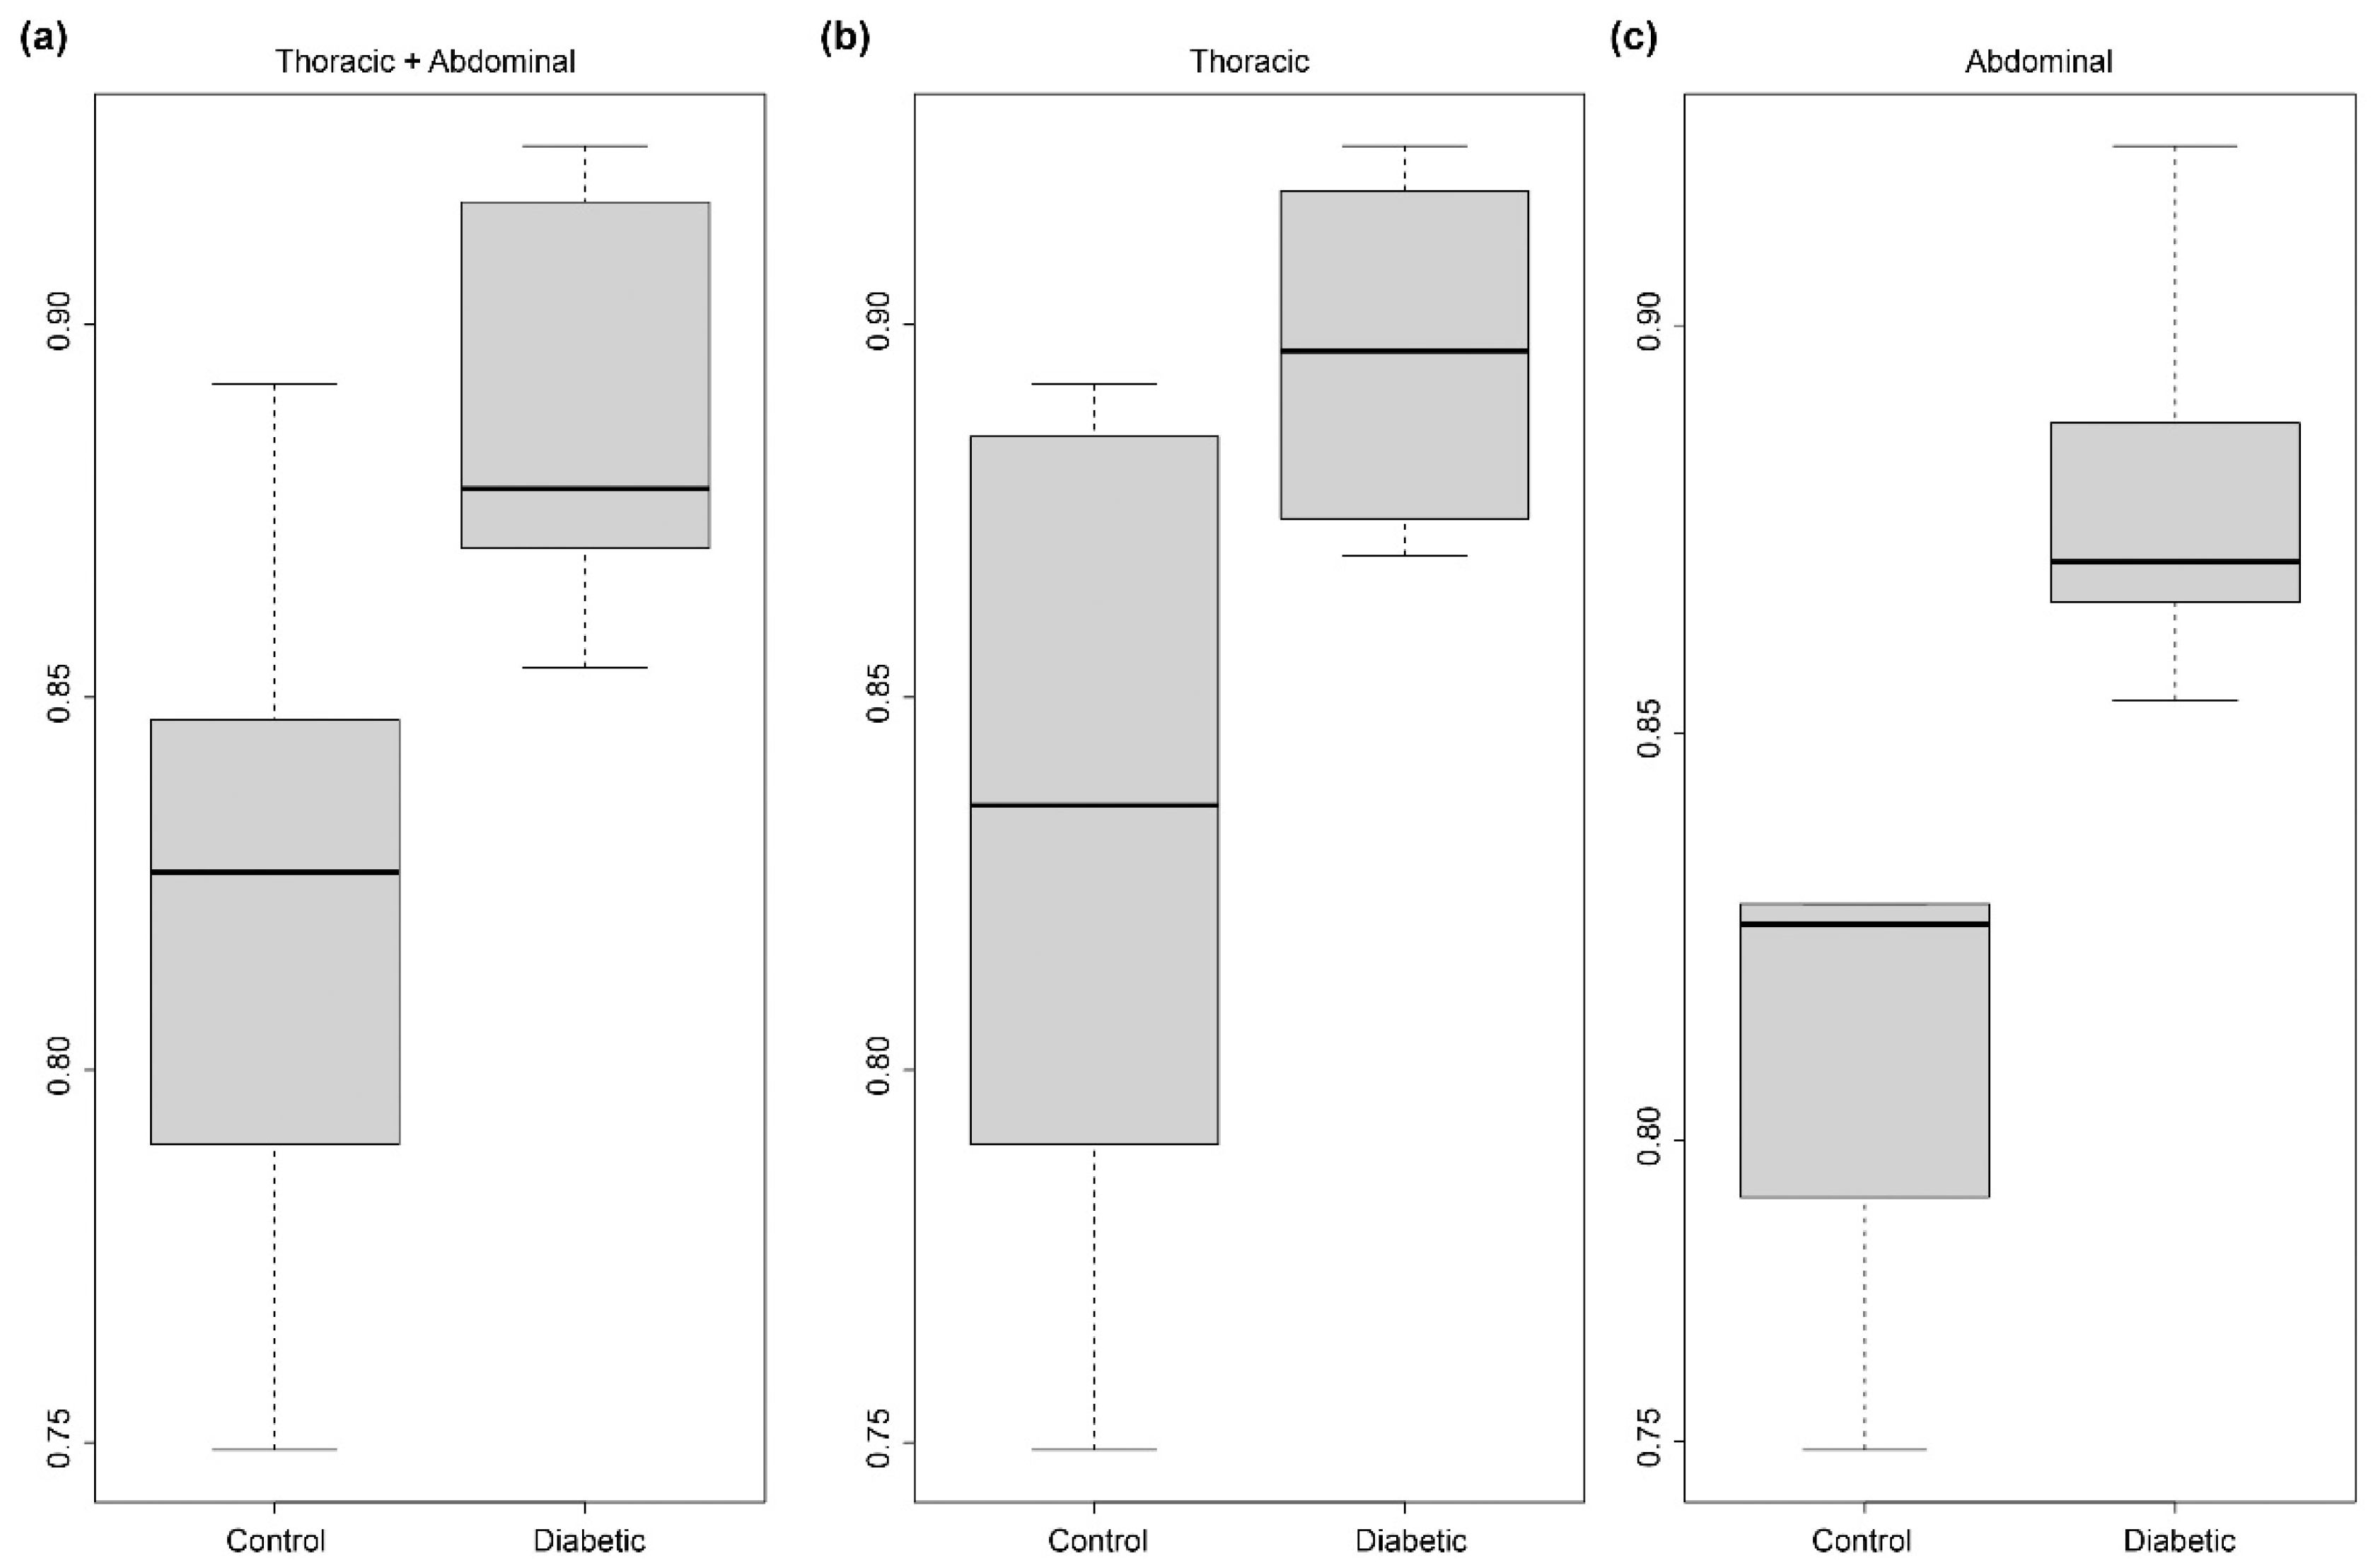
2.3. Quantification of the Wavy/Smooth Aspect of the Elastic Lamellae of the Arterial Wall
2.4. Origin of the Loss of the Wavy Aspect of Elastic Lamellae
3. Discussion
4. Materials and Methods
4.1. Animals
4.2. Sample Preparations
4.3. Imaging Procedures
4.4. Software Used for Visualization and Analysis
4.5. Arterial Structure Segmentation
4.6. Measurements of the Reserve Length of Elastic Lamellae
4.6.1. Creation of The Image Database of Elastic Lamellae Fragments
4.6.2. Deducing the Reserve Length from Each Image
4.7. Statistical Analysis
Supplementary Materials
Author Contributions
Funding
Institutional Review Board Statement
Informed Consent Statement
Data Availability Statement
Conflicts of Interest
References
- Cameron, J.D.; Cruickshank, J.K. Glucose, Insulin, Diabetes and Mechanisms of Arterial Dysfunction. Clin. Exp. Pharm. Physiol. 2007, 34, 677–682. [Google Scholar] [CrossRef] [PubMed]
- Loehr, L.R.; Meyer, M.L.; Poon, A.K.; Selvin, E.; Palta, P.; Tanaka, H.; Pankow, J.S.; Wright, J.D.; Griswold, M.E.; Wagenknecht, L.E.; et al. Prediabetes and Diabetes Are Associated With Arterial Stiffness in Older Adults: The ARIC Study. Am. J. Hypertens. 2016, 29, 1038–1045. [Google Scholar] [CrossRef] [Green Version]
- Goldin, A.; Beckman, J.A.; Schmidt, A.M.; Creager, M.A. Advanced Glycation End Products: Sparking the Development of Diabetic Vascular Injury. Circulation 2006, 114, 597–605. [Google Scholar] [CrossRef] [PubMed] [Green Version]
- Pasupuleti, V.R.; Arigela, C.S.; Gan, S.H.; Salam, S.K.N.; Krishnan, K.T.; Rahman, N.A.; Jeffree, M.S. A Review on Oxidative Stress, Diabetic Complications, and the Roles of Honey Polyphenols. Oxid. Med. Cell Longev. 2020, 2020, 8878172. [Google Scholar] [CrossRef] [PubMed]
- Vatner, S.F.; Zhang, J.; Vyzas, C.; Mishra, K.; Graham, R.M.; Vatner, D.E. Vascular Stiffness in Aging and Disease. Front. Physiol. 2021, 12, 2068. [Google Scholar] [CrossRef] [PubMed]
- Shapiro, S.D.; Endicott, S.K.; Province, M.A.; Pierce, J.A.; Campbell, E.J. Marked Longevity of Human Lung Parenchymal Elastic Fibers Deduced from Prevalence of D-Aspartate and Nuclear Weapons-Related Radiocarbon. J. Clin. Investig. 1991, 87, 1828–1834. [Google Scholar] [CrossRef] [Green Version]
- Mantella, L.E.; Liblik, K.; Johri, A.M. Vascular Imaging of Atherosclerosis: Strengths and Weaknesses. Atherosclerosis 2021, 319, 42–50. [Google Scholar] [CrossRef]
- Aumann, S.; Donner, S.; Fischer, J.; Müller, F. Optical Coherence Tomography (OCT): Principle and Technical Realization. In High Resolution Imaging in Microscopy and Ophthalmology: New Frontiers in Biomedical Optics; Bille, J.F., Ed.; Springer International Publishing: Cham, Switzerland, 2019; pp. 59–85. ISBN 978-3-030-16638-0. [Google Scholar]
- Cheng, X.; Sadegh, S.; Zilpelwar, S.; Devor, A.; Tian, L.; Boas, D.A. Comparing the Fundamental Imaging Depth Limit of Two-Photon, Three-Photon, and Non-Degenerate Two-Photon Microscopy. Opt. Lett. 2020, 45, 2934–2937. [Google Scholar] [CrossRef] [PubMed]
- Kozel, B.A.; Mecham, R.P. Elastic Fiber Ultrastructure and Assembly. Matrix Biol. 2019, 84, 31–40. [Google Scholar] [CrossRef]
- Walton, L.A.; Bradley, R.S.; Withers, P.J.; Newton, V.L.; Watson, R.E.B.; Austin, C.; Sherratt, M.J. Morphological Characterisation of Unstained and Intact Tissue Micro-Architecture by X-Ray Computed Micro- and Nano-Tomography. Sci. Rep. 2015, 5, 10074. [Google Scholar] [CrossRef] [Green Version]
- López-Guimet, J.; Peña-Pérez, L.; Bradley, R.S.; García-Canadilla, P.; Disney, C.; Geng, H.; Bodey, A.J.; Withers, P.J.; Bijnens, B.; Sherratt, M.J.; et al. MicroCT Imaging Reveals Differential 3D Micro-Scale Remodelling of the Murine Aorta in Ageing and Marfan Syndrome. Theranostics 2018, 8, 6038–6052. [Google Scholar] [CrossRef]
- Ben Zemzem, A.; Genevaux, A.; Wahart, A.; Bodey, A.J.; Blaise, S.; Romier-Crouzet, B.; Jonquet, J.; Bour, C.; Cogranne, R.; Beauseroy, P.; et al. X-Ray Microtomography Reveals a Lattice-like Network within Aortic Elastic Lamellae. FASEB J. 2021, 35, e21844. [Google Scholar] [CrossRef]
- Weitkamp, T.; Scheel, M.; Giorgetta, J.; Joyet, V.; Le Roux, V.; Cauchon, G.; Moreno, T.; Polack, F.; Thompson, A.; Samama, J. The Tomography Beamline ANATOMIX at Synchrotron SOLEIL. J. Phys. Conf. Ser. 2017, 849, 012037. [Google Scholar] [CrossRef] [Green Version]
- Otsu, N. A Threshold Selection Method from Gray-Level Histograms. IEEE Trans. Syst. Man Cybern. 1979, 9, 62–66. [Google Scholar] [CrossRef] [Green Version]


Publisher’s Note: MDPI stays neutral with regard to jurisdictional claims in published maps and institutional affiliations. |
© 2022 by the authors. Licensee MDPI, Basel, Switzerland. This article is an open access article distributed under the terms and conditions of the Creative Commons Attribution (CC BY) license (https://creativecommons.org/licenses/by/4.0/).
Share and Cite
Ben Zemzem, A.; Liang, X.; Vanalderwiert, L.; Bour, C.; Romier-Crouzet, B.; Blaise, S.; Sherratt, M.J.; Weitkamp, T.; Dauchez, M.; Baud, S.; et al. Early Alterations of Intra-Mural Elastic Lamellae Revealed by Synchrotron X-ray Micro-CT Exploration of Diabetic Aortas. Int. J. Mol. Sci. 2022, 23, 3250. https://doi.org/10.3390/ijms23063250
Ben Zemzem A, Liang X, Vanalderwiert L, Bour C, Romier-Crouzet B, Blaise S, Sherratt MJ, Weitkamp T, Dauchez M, Baud S, et al. Early Alterations of Intra-Mural Elastic Lamellae Revealed by Synchrotron X-ray Micro-CT Exploration of Diabetic Aortas. International Journal of Molecular Sciences. 2022; 23(6):3250. https://doi.org/10.3390/ijms23063250
Chicago/Turabian StyleBen Zemzem, Aïcha, Xiaowen Liang, Laetitia Vanalderwiert, Camille Bour, Béatrice Romier-Crouzet, Sébastien Blaise, Michael J. Sherratt, Timm Weitkamp, Manuel Dauchez, Stéphanie Baud, and et al. 2022. "Early Alterations of Intra-Mural Elastic Lamellae Revealed by Synchrotron X-ray Micro-CT Exploration of Diabetic Aortas" International Journal of Molecular Sciences 23, no. 6: 3250. https://doi.org/10.3390/ijms23063250
APA StyleBen Zemzem, A., Liang, X., Vanalderwiert, L., Bour, C., Romier-Crouzet, B., Blaise, S., Sherratt, M. J., Weitkamp, T., Dauchez, M., Baud, S., Passat, N., Debelle, L., & Almagro, S. (2022). Early Alterations of Intra-Mural Elastic Lamellae Revealed by Synchrotron X-ray Micro-CT Exploration of Diabetic Aortas. International Journal of Molecular Sciences, 23(6), 3250. https://doi.org/10.3390/ijms23063250