Abstract
The development and promotion of biofortified foods plants are a sustainable strategy for supplying essential micronutrients for human health and nutrition. We set out to identify quantitative trait loci (QTL) associated with carotenoid content in cowpea sprouts. The contents of carotenoids, including lutein, zeaxanthin, and β-carotene in sprouts of 125 accessions were quantified via high-performance liquid chromatography. Significant variation existed in the profiles of the different carotenoids. Lutein was the most abundant (58 ± 12.8 mg/100 g), followed by zeaxanthin (14.7 ± 3.1 mg/100 g) and β-carotene (13.2 ± 2.9 mg/100 g). A strong positive correlation was observed among the carotenoid compounds (r ≥ 0.87), indicating they can be improved concurrently. The accessions were distributed into three groups, following their carotenoid profiles, with accession C044 having the highest sprout carotenoid content in a single cluster. A total of 3120 genome-wide SNPs were tested for association analysis, which revealed that carotenoid biosynthesis in cowpea sprouts is a polygenic trait controlled by genes with additive and dominance effects. Seven loci were significantly associated with the variation in carotenoid content. The evidence of variation in carotenoid content and genomic regions controlling the trait creates an avenue for breeding cowpea varieties with enhanced sprouts carotenoid content.
1. Introduction
A balanced and healthy diet is a global priority, especially in the low-income and developing countries where hunger and malnutrition are more widespread [1,2,3]. Hidden hunger or micronutrient deficiency affects more than two billion people worldwide, causing mental impairment, poor health, low productivity, and death [4,5]. In sub-Saharan Africa, vitamin-A deficiency, for instance, constitutes a serious public health and one of the major causes of blindness and mortality among children under 5 years and pregnant women [6,7,8]. Biofortification as a strategy for increasing nutrients in food plant matrices is advocated to alleviate the high burden of micronutrient deficiency in these regions [9,10].
Gain legumes, including cowpea (Vigna unguiculata L. Walp), are important sources of micronutrients and amino acids, exceeding or complementing the profiles of cereals, making them perfect target crops for addressing the global micronutrients deficiency [11,12]. Carotenoids are among the micronutrients found in legumes, and they have a range of benefits for humans [13]. They contribute to the human antioxidant defense system, and their consumption has been proved to improve cellular differentiation and reproduction and to reduce risks of vision impairment, cancer, cardiovascular diseases, and infant mortality [14,15]. The carotenoids found in legume crops include α-carotene and β-carotene, and their hydroxylated forms (lutein, zeaxanthin, violaxanthin, etc.) [16]. Although carotenoids are all composed of isoprene units [17], they differ in their structural and functional properties. Lutein and zeaxanthin possess hydroxyl group at both ends of the molecule, which distinguishes them from β-carotene [18]. β–carotene has β-ionone groups at the two ends, which represents a distinctive feature but also gives the molecule its ability to be converted to retinol, a precursor of vitamin-A, after consumption [19]. Unlike lutein, β-carotene and zeaxanthin belong to the same branch on the carotenoid biosynthesis pathway, with zeaxanthin being the substrate or derivative of β-carotene [20].
Over the past decades, there have been a lot of efforts invested in the biofortification of carotenoids, especially provitamin-A carotenoids, in maize, cassava, and sweet potato, with limited attention paid to grain legume crops [21,22,23]. Cowpea is an important grain legume on which millions of people depend for their daily nutrients needs in the tropics [24,25,26]. It is a model grain legume for genomic studies [27] because of its relatively small (~640.6 Mb) diploid (2n = 2x = 22 Chromosomes) genome [28], and a large portion of the cowpea germplasm is conserved and easily accessible for research at IITA and USDA GRIN gene banks [27,29,30,31]. Low carotenoid profiles are found in cowpea, dominated (70%) by lutein [32]. However, knowledge about carotenoid biofortification in cowpea is scanty. The level of carotenoid content in cowpea (0–0.1 mg/100 g) [33,34,35,36,37] is lower than the reported values in seeds of other legume grain crops, including chickpeas (0.8–3 mg/100 g) and peas (0.06–2.8 mg/100 g) [38]. Previous research showed the presence of genetic structuration among cowpea germplasm [29,30,39], which constitutes an actionable potential for exploring the natural variation of carotenoid in cowpea. Such information will guide the selection of candidate genotypes and effective methods for increasing carotenoid in cowpea, thereby contributing to the advancement of cowpea biofortification research, which has only focused on zinc and iron [40].
Genome-wide association studies (GWAS) has been proven to be a cost-effective, time-saving, and powerful tool for genetic dissection of complex traits [41]. GWAS involves testing for association between each genotypic marker and a phenotype of interest that has been scored across a large number of individuals [42]. It provides a valuable first insight into trait architecture for subsequent validation, which enables detecting rare variants of large effect or common variants of small effect for complex traits [42]. GWAS has been applied to identify genomic regions or quantitative traits loci (QTLs) controlling carotenoid content in some important food crops, including soybean [43], chickpeas [44], maize [45], and cassava [46]. These studies reported that carotenoid content is a complex trait, influenced by various genes with additive and dominance effects [47,48]. To date, there has been no report of quantitative trait loci (QTL) controlling carotenoids biosynthesis in cowpea. The identification of loci associated with carotenoid content in cowpea will help in deciphering the architecture of the trait.
Sprouts of grain legume or pulses have been shown to increase carotenoid content and overall antioxidant profiles, as well as to minimize the anti-nutritional factors of the dry grains [12,49,50,51]. Recently, we assembled and genotyped a cowpea germplasm collection using the diversity array technology (DArT) sequencing [31]. Here, we assessed the variation of carotenoids, including lutein, zeaxanthin, and β-carotene contents, among sprouts of a set of accessions from the germplasm collection and identified quantitative trait loci (QTLs) associated with carotenoid biosynthesis to boost carotenoid biofortification in cowpea.
2. Results
2.1. Variation among Accessions for Sprouts Carotenoid Content
Carotenoid contents were quantified from sprouts of 125 cowpea accessions (Tables S1 and S2). The variation in sprouts lutein, zeaxanthin, and β-carotene contents among 125 cowpea accessions is summarized in Table 1. Significant differences (p < 0.001) were observed among accessions for the carotenoid compounds. Lutein content varied from 3.7 mg/100 g in sprouts of accession C017 to 182.4 mg/100 g in accession C044, with an average value of 58 mg/100 g (Table 1 and Figure 1). Similarly, sprouts of accessions C017 and C044 recorded, respectively, the lowest (2.2 mg/100 g) and highest (65.2 mg/100 g) values for zeaxanthin content (Table 1 and Table S2). Sprouts of accessions C113 and C017 had the highest (39.3 mg/100 g) and lowest (2.0 mg/100 g) β-carotene content, respectively, with an average value of 13.2 mg/100 g. Lutein content had the highest average (58 mg/100 g) across accessions, contributing to 67.5% of all carotenoids assessed, which is approximately 4-fold of the values of zeaxanthin and β-carotene (Table 1).

Table 1.
Descriptive statistics of the variation of lutein, zeaxanthin, and β-carotene among sprouts of 125 cowpea accessions.
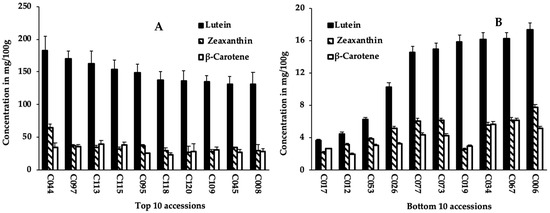
Figure 1.
Lutein, zeaxanthin, and β-carotene content of sprouts of the top 10 (A); and bottom 10 (B) cowpea accessions.
There were variations in carotenoids content among sprouts following the origins of the accessions (Table 2). The largest variation in lutein content was obtained in sprouts of accessions from north Africa (106.5 ± 50.9 mg/100 g), followed by sprouts of accessions from east Africa (70.4 ± 45.5), Asia (53.8 ± 36.7 mg/100 g), and west Africa (51.0 ± 34.4 mg/100 g). Sprouts of accessions from east Africa recorded the highest zeaxanthin content (17.5 ± 12.1 mg/100 g), followed by sprouts of accessions from Asia and west Africa, while accessions from north Africa showed the lowest content. β-carotene content was the highest in sprouts of accessions from east Africa (14.2 ± 9.1 mg/100 g), followed by sprouts of accessions from Asia (13.4 ± 8.5 mg/100 g) and west Africa (13.0 ± 7.1 mg/100 g). Similar variations were also obtained in β-carotene content among accessions from these three regions.
Table 2.
Variation of lutein, zeaxanthin, and β-carotene contents following the regions of origin of the cowpea accessions.
2.2. Segregation of the Cowpea Accessions into Subgroups Based on the Carotenoid Profiles of the Sprouts
A strong significant positive correlation (r ≥ 0.87) was observed among the quantified carotenoid compounds (Figure S2). Hence, we assessed the most appropriate method for grouping the accessions based on the variation observed in the sprout’s carotenoids contents. Among the different combinations of dissimilarities matrices and clustering methods, the combination of Euclidean distance matrix and neighbor-joining algorithm had the highest cophenetic correlation coefficient value (CCC = 0.85) and was used for grouping the accessions (Table 3). The phylogenetic tree built using this combination grouped the accessions into three clusters (Figure 2 and Figure S2A).
Table 3.
Cophenetic correlation coefficient (CCC) between distance matrices and clustering. Algorithms for inferring clusters among cowpea accessions.
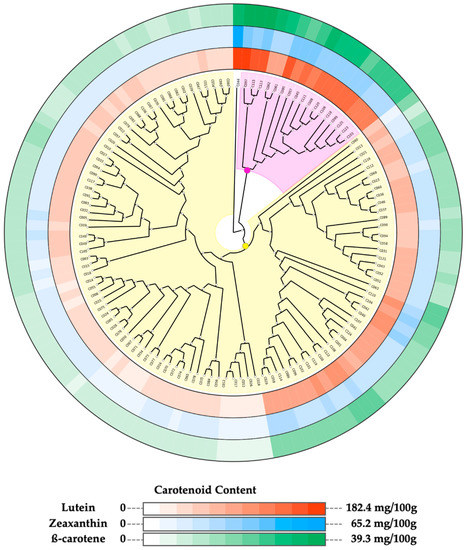
Figure 2.
Phylogenetic three of 125 cowpea accessions constructed based on their carotenoid contents. Neighbor-joining clustering divided the accessions into three clusters. Cluster 1 (C044): no background, Cluster 2: light purple background, Cluster 3: yellow background. Concentrations of carotenoids in sprouts of each accession are displayed in color gradient around the tree. From the outermost track: β-carotene, zeaxanthin, and lutein.
Figure 2 shows the segregation of the accessions into subgroups based on their sprout carotenoid contents, displayed as color gradient around the phylogenetic tree. Cluster 1 comprising accession C044 and Cluster 2 composed of 17 accessions are characterized by accessions with high carotenoid content (Figure 2). Cluster 3, on the other hand, had the largest size (107 accessions), and it was further divided into two sub-groups: one sub-group made up of accessions with moderate carotenoid content (41 accessions) and the second sub-group characterized by accessions with low carotenoid content accessions (66 accessions).
2.3. Genetic Structuration and Linkage Disequilibrium in the Cowpea Germplasm
A total of 3,120 SNPs (Table S3) distributed across the 11 chromosomes of cowpea with higher marker densities on chromosomes 3 and 7 (Figure S3) were used to assess the genetic structuration among the cowpea germplasm. Significant genetic differentiation (Fst = 0.25, Table 4) was observed in the germplasm, suggesting the presence of population structure characterized by extensive gene flow (Nm = 5.1) between subgroups. In line with this, the structure analysis identified three subgroups, or clusters (Figure 3), in the germplasm. Cluster 1 had the highest number of accessions (40 accessions), followed by Cluster 2 (37 accessions) and Cluster 3 (32 accessions), with the rest of the accessions (14 accessions) in admixture (Table S4).
Table 4.
Genetic diversity indices among the cowpea accessions using Nei method.
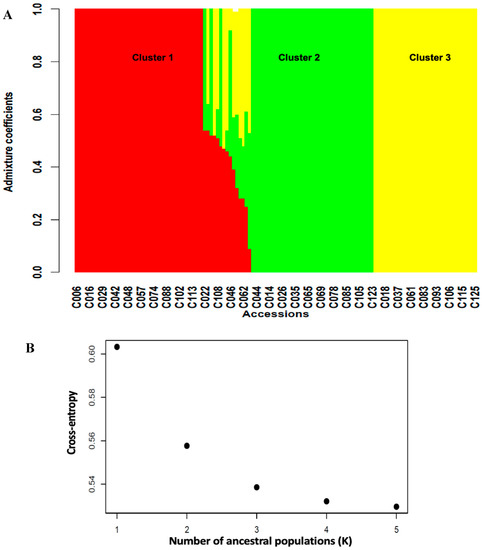
Figure 3.
(A) = barplot of admixture coefficients of the 125 accessions depicting the population structure in the cowpea-mapping panel. (B) = Three clusters were identified based on the curve of cross-entropy versus the number of ancestral populations.
Results of DAPC analysis confirmed the grouping of the 125 accessions into three clusters (Figure 4), as identified by the curve of Bayesian information criterion (BIC) values versus the number of clusters (Figure S2B). The biplot based on the two detected linear discriminant axes (DA) (Figure 4), which explained 86.2% and 13.8% of variation in the data, assigned 33 accessions to Cluster 1, 50 accessions to Cluster 2, and 42 accessions to Cluster 3. Cluster 1 had the largest variation for lutein (69.5 ± 41.0 mg/100 g), zeaxanthin (17.1 ± 8.6 mg/100 g), and β-carotene (14.8 ± 8.7 mg/100 g), followed by Cluster 2 and Cluster 3 (Figure 5).
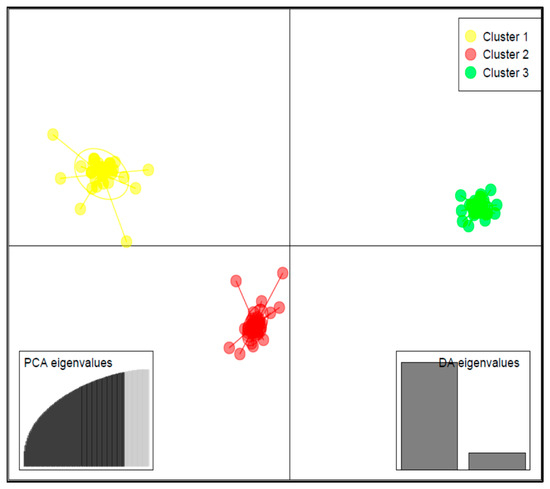
Figure 4.
Discriminant analysis of principal component (DAPC) biplot showing the structuration of the 125 cowpea accessions into three subgroups based on the SNP makers.
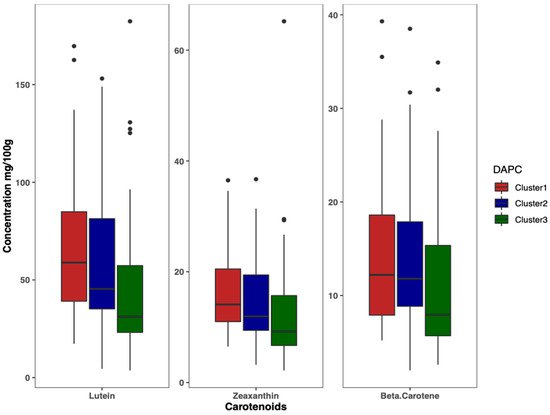
Figure 5.
Boxplot showing the variation of carotenoids content among clusters.
Furthermore, we examined the pattern of linkage disequilibrium (LD) across the genome (Figure S4). LD was measured as the squared allele frequency correlations (r2) between pairs of markers. The results showed that 11.4% (11,032) of pairs of comparisons among 1957 markers with minor allele frequency of less than 0.1 were significantly (p < 0.01) linked. The average r2 value across the genome was 0.47. The plot of LD estimates against the physical distance between markers across the genome depicted a persistent LD, which decayed below the critical r2 = 0.55 at a distance ~1.4 Mbp (Figure S4).
2.4. Analysis of Loci Associated with Carotenoid Biosynthesis
Out of the 3, 120 loci tested, 7 (Figure 6 and Table 5) showed significant association [3.06 ≤ −log10 (p) ≤ 4.09] with the variation in carotenoid content among the cowpea sprouts. These loci were distributed on chromosome 6 (S_Vung_CA1511, S_Vung_CA1513, and S_Vung_CA1519), chromosome 7 (S_Vung_CA1838 and S_Vung_CA1840), chromosome 8 (S_Vung_CA2146), and chromosome 11 (S_Vung_CA3031). The loci explained 10.10 to 13.51% of the variation of carotenoid content, with locus S_Vung_CA1840 showing the largest effect (13.51%) for the variation of β-carotene contents among cowpea sprouts (Table 5).
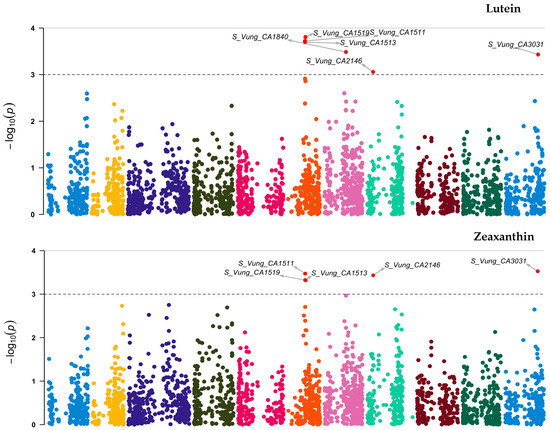
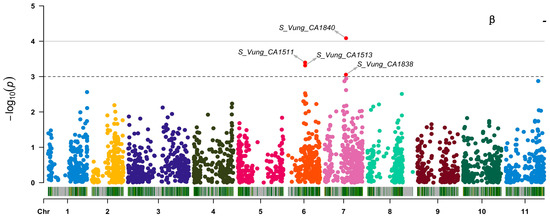
Figure 6.
Manhattan plots of loci associated with lutein, zeaxanthin, and β-carotene. Loci are represented by small dot colors according to their localization on 11 chromosomes (Chr 1:11) of cowpea. The red dots above the cut-off value [–log 10(p) = 3)] indicate the significant loci.
Table 5.
Significant loci associated with carotenoids biosynthesis in cowpea sprouts.
The identified loci showed pleiotropic effects influencing more than one carotenoid compound, except for S_Vung_CA1838, which was solely associated with β-carotene (Table 5 and Figure 7). Loci S_Vung_CA1511 and S_Vung_CA1513 were associated with all assessed carotenoid compounds. Loci S_Vung_CA1519, S_Vung_CA2146, and S_Vung_CA3031 were associated with the variation in lutein and zeaxanthin contents, whereas locus S_Vung_CA1840 was associated with both lutein and β-carotene. Both additive and dominance genetic effects were important; however, the dominance effects were higher than additive effects for all significant loci (Table 4). The favorable alleles of the seven loci were the most common alleles contributing to the increasing accumulation of the screened carotenoid compounds in the cowpea sprouts (Figure S5).
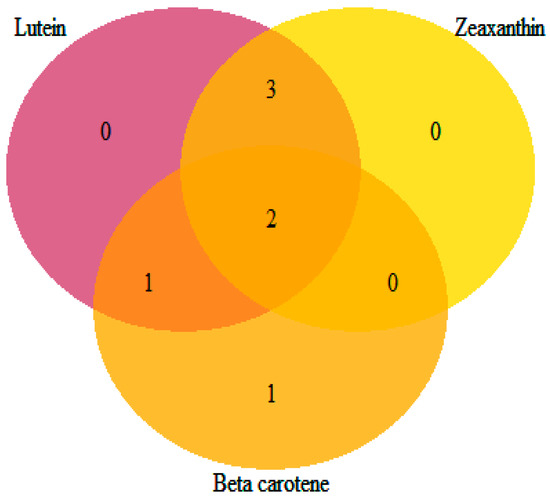
Figure 7.
Venn diagram showing the number of loci shared among the targeted carotenoids.
3. Discussion
3.1. Genetic Diversity among the Cowpea for Sprouts Carotenoids Contents
Genetic diversity in widely consumed food plant species is important to address global food and nutrition security challenges [52]. In this study, we assessed the profiles of carotenoids, including lutein, β-carotene, and zeaxanthin, in sprouts of 125 cowpea accessions. Significant variations were observed among sprouts of the cowpea accessions for the contents of lutein (3.7 to 182.4 mg/100 g), zeaxanthin (2.2 to 65.2 mg/100 g), and β-carotene (2.0 to 39.3 mg/100 g), suggesting that there is genetic variability in the germplasm for enhancing carotenoids biosynthesis. The results, in line with previous findings [32], confirmed that lutein is the most abundant (~70%) carotenoid compound in cowpea. Hence, the biofortification of carotenoids in cowpea can be very beneficial due to the critical role of lutein in human vision, immunity, and anti-inflammatory system [18]. In the present study, we found evidence of variability in carotenoid content following the origins of the cowpea accessions. Sprouts of accessions from major cowpea growing regions, including Africa and Asia, exhibited significant variations in the screened carotenoid compounds, especially in lutein content. This also showed that there is a great potential at the regional level that can be harnessed for carotenoid biofortification, which could be of great interest considering the high consumption of cowpea and the need for food fortification in these regions [10,26]. The average contents of lutein (58.0 mg/100 g), β-carotene (13.2 mg/100 g), and zeaxanthin (14.7 mg/100 g) in the 5-day-old cowpea sprouts were higher than the values reported in cowpea seeds [35], as well as in the 2-day-old average contents of cowpea sprouts [37]. Such changes are expected, since carotenoids, as photosynthetic plants’ pigments, can increase in content upon germination and plant growth as a result of expansion of chloroplast tissues, the main source of carotenoids [53]. These findings strongly suggest that producing and promoting cowpea sprouts, especially five-day-old sprouts-based diets, can help prevent carotenoid deficiency, which is more prevalent in areas where cowpea is a staple food crop [32,54]. Some of the accessions used in this study, including C044, C113, C115, C097, and C095, showed high profiles of carotenoid content and could be used for the purpose.
There has been limited research on carotenoid biofortification in cowpea. The current study is very promising because it established carotenoid profiles of sprouts in a wide range of cowpea germplasm. The analysis of the relationship among accessions based on the carotenoid content in their sprouts showed the presence of subgroups, indicating there are possibilities of hybridization between accessions for increased carotenoid biosynthesis. Furthermore, the high positive correlation among the profiles of the screened carotenoid compounds suggests that they can be improved concurrently. The level of zeaxanthin was, in general, higher than β-carotene content. This can be attributed to the conversion of β-carotene into zeaxanthin. The correlation between these compounds (β-carotene and zeaxanthin), although positive, was the lowest among the three pairs of comparisons among compounds (Figure S1), confirming the possible oxygenation of β-carotene to form zeaxanthin.
3.2. Prospects of Marker-Assisted Selection for Nutrient Enhanced Cowpea Sprouts
Carotenoid content in plants is an important trait for human health and nutrition [47,55]. The discovery of markers associated with this trait can help in fast tracking, selection, and breeding of cowpea varieties with high carotenoid content in the sprouts. The results showed that the 125 accessions can be distributed into three groups, which corroborates our previous findings in the population of origin of the accessions [31]. Although the presence of population structure within the germplasm is a positive indication of genetic potential for improvement, it can be a confounding factor in testing the associations between markers and phenotypic variation [56,57]. This was considered in the GWAS model used.
The analysis of association between loci revealed a strong LD pattern in the germplasm, as reflected by the high mean of correlations between (r2 = 0.47) pairs of markers across the genome. Notably, high LD decay distance (1.4 Mbp) was obtained in the germplasm, which is within the range of ~500 kb to 1.88 Mb, previously reported in V. unguiculata subspecies [58,59]. This further suggests that there is a possibility of detecting genetic markers associated with carotenoid biosynthesis in the germplasm [60]. In line with that, the genome-wide association analysis identified seven major loci (R2 > 10%) [61] that significantly explained the variation in carotenoid content among the cowpea sprouts. These results suggest that carotenoid content in cowpea is a polygenic trait [62], and the identified markers can support marker-assisted selection. These markers showed pleiotropic effects, suggesting their usefulness in selection of parental lines with high sprouts carotenoids content. The pleiotropic effect also substantiated that screened carotenoid compounds belong to the same pathway and may be under the influence of a similar genes network. Furthermore, both dominance and additive gene effects were important in explaining the observed variation in the content of the specific carotenoid compounds among sprouts of the cowpea germplasm, with a high influence of the dominance effects over the additive effects. High influence of dominance gene effects in carotenoid biosynthesis was also reported in the African marigold [63]. Similarly, Kandianis, et al. [64] showed that the variation of β-carotene content in maize was fully explained by additive and dominance gene effects, rather than additive genes effects only. These results demonstrate that carotenoid content is a quantitative trait, and there are chances of heterosis and/or transgressive segregation, resulting in increased content in sprouts of progenies of crosses among superior individuals [63,65].
Sprouts of grain legume crops can be improved through varietal selection [66]. There has been extensive research conducted on soybean sprouts improvement, including breeding and genetic improvement [66,67,68]. To our knowledge, this is the first study reporting on genomic regions associated with carotenoid content in cowpea sprouts. Hence, the identified markers will be very useful and can be validated in a biparental population for effective use in a breeding program. Since low genetic diversity was observed in the germplasm, the use of recombinant inbred lines (RILs) population may be more appropriate for validation [69]. The use of RILs population can also help to broaden the genetic variation of the trait amenable for the discovery of more quantitative trait loci [70]. Additionally, testing the effectiveness of these loci in sprouts of cowpea seeds from replicated trials in time and space can be more informative to account for the interaction effects of quantitative trait loci and environments on carotenoid content, as well as other characteristics, such as seed size, seed coat, and color, that can influence sprouts yield and quality [66,71].
4. Materials and Methods
4.1. Plant Materials
The cowpea diversity panel comprises 125 accessions from Africa (93 accessions), Asia (29 accessions), America (2 accessions), and 1 Oceania (1 accession) (Table S1). Seeds of the accessions were obtained from a cowpea collection of the Laboratory of Applied Ecology (LEA) of the University of Abomey-Calavi (UAC; Abomey-Calavi, Benin). Ethanol analytical grade and sodium hypochlorite were purchased from Sigma Aldrich, Seoul, Korea. The seeds were surface sterilized with 70% Ethanol (v/v) for 30s and 0.5% sodium hypochlorite (NaOCl) solution for 2 min and washed twice with distilled water. Seeds were soaked in distilled water for 12 h and germinated in sprouts plastic trays (Figure S1) in a growth chamber, 16h of light and 8 h of dark cycle. The temperature and relative humidity (RH) in the growth chamber was kept at 24 ± 1 °C and 80%, respectively. The seeds were moistened with distilled water every 8 h for 5 days. Sprouts were harvested 5 days after germination. Sprouts samples were frozen in liquid nitrogen and freeze dried overnight for carotenoid analysis.
4.2. Carotenoids Profiling
4.2.1. Sample Extraction
Profiles of carotenoids, including lutein, zeaxanthin, and β-carotene in the sprouts of each cowpea accession, were assessed. Standards of lutein, zeaxanthin, and β-carotene and reagents/solvents, including acetone, hexane, ethanol (ETOH), methanol (MeOH), potassium hydroxide (KOH), and Methyl tert-butyl Ether (MTBE), were purchased from Sigma Aldrich, Seoul, Korea. Fifty milligrams (50 mg) of finely ground freeze-dried sprouts samples were extracted with 50 μL of 1 N potassium hydroxide in 1 mL mixture solution of Acetone/Ethanol/Hexane (1:1:2, v/v/v). The mixture was vortexed for 20 s, sonicated (Vibra-cell™, Sonics, Newtown, CT, USA) at 40 °C for 30 min, and centrifuged (Labogene 1248 R, Seoul, Korea) for 5 min, 1200 rpm at 4 °C. The upper hexane layer of each sample was collected and passed through a membrane filter (PVDF syringe filter, hydrophobic, 13 mm diameter, 0.22 μm pore size, Whatman International, Maidstone, UK). The extraction process was repeated twice, and the resulting extracts were mixed and passed through a stream of nitrogen gas for removal of the hexane using nitrogen evaporator (Allsheng MD 200, Hangzhou Allsheng Instrument Co., LTD, Hangzhou, China). The extracts were dissolved in acetone for high-performance liquid chromatography (HPLC) analysis.
4.2.2. HPLC Analysis of Carotenoids
Carotenoids were analyzed in a Dionex ultimate 3000 LC machine equipped with a standard auto-sampler, a binary gradient pump, and a variable wavelength detector (VAD). Specific carotenoid compounds were separated on a reverse phase C30 YMC carotenoid column, (5 µm, 250 × 4.6 mmL.D.mm) using mobile phases consisting of MTBE: MeOH (90:10 v/v, solvent A) and MeOH: H2O (95:5 v/v, solvent B) in a linear gradient. The gradient elution was 20% A and 80% B from 0 to 7 min, followed by 25% A and 75% B to 15–25 min, 100% A to 40 min, and 20% A and 80% B to 45–50 min. The flow rate was 0.7 mL/min, and the column temperature was maintained at 35 °C. The eluting peaks were monitored at 450 nm wavelength (Figure S2). Lutein, β-carotene, and zeaxanthin contents were estimated based on the calibration curve of lutein standard (Y = 48.9X + 2.2, R2 = 0.997), β-carotene standard (Y = 30.3X − 0.7, R2 = 0.999), and zeaxanthin (Y = 12.2X − 0.4; R2 = 0.999), respectively.
4.2.3. Data Analysis
All measurements were performed in triplicates. Analysis of variance of the performance of the cowpea accessions for sprouts carotenoids contents was computed in the agricolae R package [72]. Means were separated using the Tukey’s honestly significant difference (α = 0.05) in the car R package [73]. Correlation analysis among the parameters was performed in factoextra R package [74].
Clustering analysis was performed to assess the relationship among accessions based on the carotenoid content in their sprouts. For this purpose, we computed the cophenetic correlation coefficient (CCC) of different combinations of dissimilarities matrices (Euclidean and Manhattan) and clustering methods (Ward. D, neighbor-joining, and the unweighted pair group method with arithmetic mean method). The combination with the highest CCC value was used to perform the hierarchical clustering analysis, and the optimal number of clusters was inferred in the NbClust R package [75]. The resulting phylogenetic tree was exported using the ape R package [76] for graphical annotation and annotation, with the contents of lutein, zeaxanthin, and β-carotene in the sprouts of each accession depicted around the phylogenetic tree using the graphical phylogenetic analysis (GraPhlAn v1.1.4) [77].
4.3. Genome-Wide Association Studies (GWAS)
The genomic data used in this study consisted of 3,120 SNPs markers (Table S3), previously reported among a diversity panel of cowpea [31], which includes the 125 accessions used in the present study. The genetic diversity parameters of the germplasm were estimated in GenAlex [78]. To control false positives association, the population structure of the germplasm was assessed.
4.3.1. Population Structure
A genetic population structure analysis was performed in LEA R package [79]. In this method, the optimal number of clusters (K) is determined using the cross-entropy criterion, which is based on the prediction of a fraction of masked genotypes and cross-validation approach [79]. Ten repetitions were performed for each value of K (K = 1:5) and the optimal K value selected. The membership of the accessions in a specific cluster was depicted using the barplot function, with the critical coancestry coefficient set at 0.55. To confirm the optimal number of clusters in the germplasm, we performed a discriminant analysis of principal components (DAPC) in the adgenet R package [80].
4.3.2. Linkage Disequilibrium (LD) Analysis
LD within the cowpea germplasm was estimated in Tassel v5.2.60 [81]. SNPs markers with minor allele frequency above 0.1 were included in the LD analysis. LD was measured as the squared allele frequency correlations (r2) between pairs of markers across the genome [58]. LD decay pattern was depicted as a function of r2 along physical distance (kb) in ggplot2 R package [82], where only r2 with p < 0.01 were included. The critical r2 for LD decay was estimated as the 95th percentile of distribution of the square root transformed of the correlations values between unlinked markers [83].
4.3.3. GWAS Analysis
GWAS was performed using Tassel v5.2.60 [81] and rMPV R package [84]. The phenotypic variation represented herein by the carotenoid content of the accessions was subjected to a rank-based transformation, a method reported to give the best and consistent performance in identifying the causal polymorphism among other transformation approaches [85] in the bestNormalize R package [86]. A general linear model (GLM) approach [57] was used for the association analysis, and the coefficients of coancestry of the accessions were incorporated in the model as covariates (Q matrix) to correct for false positives. Manhattan plots were used for the visualization of the GWAS results. Markers that passed the significance threshold p < 0.001 [i.e., −log10 (p) > 3] were defined as genomic regions or loci associated with carotenoid biosynthesis in cowpea sprouts [87,88].
5. Conclusions
This study revealed that the level of carotenoid content varied among sprouts of cowpea accessions. The accessions were grouped into three clusters based on their carotenoid contents, with some of them exhibiting high profiles of carotenoids, and they can be recommended for production and promotion of high integration of cowpea sprouts in the daily diet consumption in food-insecure regions. The presence of subgroups in the population was also confirmed by analysis of the genetic structure. However, the germplasm had low genetic diversity, which calls for more research efforts to broaden the genetic basis of cowpea for high carotenoids content, as well as other important characteristics of cowpea sprouting varieties. Seven candidate loci, S_Vung_CA1511, S_Vung_CA1513, S_Vung_CA1519, S_Vung_CA1838, S_Vung_CA1840, S_Vung_CA2146, and S_Vung_CA3031, were identified to support molecular breeding for sprouting cowpea varieties with enhanced carotenoids contents.
Supplementary Materials
The following are available online at https://www.mdpi.com/article/10.3390/ijms23073696/s1.
Author Contributions
Conceptualization, F.A.K.S., A.E.A., S.-P.A.N. and H.-Y.K.; methodology, F.A.K.S., D.R., A.E.A., S.-P.A.N. and H.-Y.K.; formal analysis, F.A.K.S. and J.C.; investigation, F.A.K.S.; resources, H.-Y.K. and A.E.A. data curation, F.A.K.S. and J.C.; writing—original draft preparation, F.A.K.S.; writing—review and editing, S.A., J.C., J.H.J., C.W.N. and H.-Y.K.; supervision, A.E.A., S.-P.A.N. and H.-Y.K.; funding acquisition, F.A.K.S., A.E.A. and H.-Y.K. All authors have read and agreed to the published version of the manuscript.
Funding
This research was funded by the Korea Institute of Science and Technology (KIST) intramural grant [2Z06670 and 2Z0672], and the genotyping of the accessions was funded by the World Academy of Sciences (TWAS) grant 18-238 RG/BIO/AF/AC_G-FR3240303667. The APC was funded by Korea Institute of Science and Technology (KIST) intramural grant [2Z06670 and 2Z0672].
Institutional Review Board Statement
Not applicable.
Informed Consent Statement
Not Applicable.
Data Availability Statement
The data presented in this study are available in the Supplementary Tables (Tables S2 and S3).
Acknowledgments
The first author acknowledges the support from the Partnership for Skills in Applied Sciences, Engineering, and Technology—Regional Scholarship and Innovation Fund (PASET-RSIF). We are grateful to the different institutions that provided the seeds of the germplasm IITA (Nigeria), INERA (Burkina-Faso), LEA (UAC, Benin), the University Naguia Abrogoua (Côte d’Ivoire), MaRCCI (Uganda), and USDA-ARS. We are grateful to Mathieu A. T. Ayenan for the valuable discussions and revision of the first draft of the manuscript.
Conflicts of Interest
The authors declare no conflict of interest. The funders had no role in the design of the study; in the collection, analyses, or interpretation of data; in the writing of the manuscript, or in the decision to publish the results.
References
- Alemu, E.A. Malnutrition and Its Implications on Food Security. In Zero Hunger; Encyclopedia of the UN Sustainable Development Goals; United Nations: Geneva, Switzerland, 2020; pp. 1–10. [Google Scholar]
- Lockyer, S.; White, A.; Buttriss, J.L. Biofortified crops for tackling micronutrient deficiencies—What impact are these having in developing countries and could they be of relevance within Europe? Nutr. Bull. 2018, 43, 319–357. [Google Scholar] [CrossRef]
- FAO; IFAD; UNICEF; WFP; WHO. The State of Food Security and Nutrition in the World 2020: Transforming Food Systems for Affordable Healthy Diets; Food and Agriculture Orgnaization of the United Nations: Geneva, Switzerland, 2020. [Google Scholar]
- Gödecke, T.; Stein, A.J.; Qaim, M. The global burden of chronic and hidden hunger: Trends and determinants. Glob. Food Secur. 2018, 17, 21–29. [Google Scholar] [CrossRef]
- von Grebmer, K.; Saltzman, A.; Birol, E.; Wiesman, D.; Prasai, N.; Yin, S.; Yohannes, Y.; Menon, P.; Thompson, J.; Sonntag, A. 2014 Global Hunger Index: The Challenge of Hidden Hunger; IFPRI: Washington, DC, USA, 2014. [Google Scholar]
- WHO. Vitamin A Deficiency; WHO: Geneva, Switzerland, 2019.
- Hamdy, A.M.; Abdel Aleem, M.M.; El-Shazly, A.A. Maternal Vitamin A Deficiency during Pregnancy and Its Relation with Maternal and Neonatal Hemoglobin Concentrations among Poor Egyptian Families. ISRN Pediatr. 2013, 2013, 652148. [Google Scholar] [CrossRef] [PubMed]
- Black, R.E.; Victora, C.G.; Walker, S.P.; Bhutta, Z.A.; Christian, P.; de Onis, M.; Ezzati, M.; Grantham-McGregor, S.; Katz, J.; Martorell, R.; et al. Maternal and child undernutrition and overweight in low-income and middle-income countries. Lancet 2013, 382, 427–451. [Google Scholar] [CrossRef]
- Poniedziałek, B.; Perkowska, K.; Rzymski, P. Food Fortification: What’s in It for the Malnourished World? In Vitamins and Minerals Biofortification of Edible Plants, 1st ed.; Benkeblia, N., Ed.; Wiley: London, UK, 2020. [Google Scholar]
- Mkambula, P.; Mbuya, M.N.N.; Rowe, L.A.; Sablah, M.; Friesen, V.M.; Chadha, M.; Osei, A.K.; Ringholz, C.; Vasta, F.C.; Gorstein, J. The Unfinished Agenda for Food Fortification in Low- and Middle-Income Countries: Quantifying Progress, Gaps and Potential Opportunities. Nutrients 2020, 12, 354. [Google Scholar] [CrossRef] [PubMed]
- Rehman, H.M.; Cooper, J.W.; Lam, H.M.; Yang, S.H. Legume biofortification is an underexploited strategy for combatting hidden hunger. Plant Cell Environ. 2019, 42, 52–70. [Google Scholar] [CrossRef] [PubMed]
- Jayathilake, C.; Visvanathan, R.; Deen, A.; Bangamuwage, R.; Jayawardana, B.C.; Nammi, S.; Liyanage, R. Cowpea: An overview on its nutritional facts and health benefits. J. Sci. Food Agric. 2018, 98, 4793–4806. [Google Scholar] [CrossRef]
- Khoo, H.-E.; Prasad, K.N.; Kong, K.-W.; Jiang, Y.; Ismail, A. Carotenoids and their isomers: Color pigments in fruits and vegetables. Molecules 2011, 16, 1710–1738. [Google Scholar] [CrossRef]
- Stahl, W.; Sies, H. Antioxidant activity of carotenoids. Mol. Asp. Med. 2003, 24, 345–351. [Google Scholar] [CrossRef]
- Ross, A.C. Vitamin A. In Bioactive Compounds and Cancer; Springer: Berlin/Heidelberg, Germany, 2010; pp. 335–356. [Google Scholar]
- Nisar, N.; Li, L.; Lu, S.; Khin, N.C.; Pogson, B.J. Carotenoid metabolism in plants. Mol. Plant 2015, 8, 68–82. [Google Scholar] [CrossRef]
- Gupta, P.; Sreelakshmi, Y.; Sharma, R. A rapid and sensitive method for determination of carotenoids in plant tissues by high performance liquid chromatography. Plant Methods 2015, 11, 5. [Google Scholar] [CrossRef] [PubMed]
- Kijlstra, A.; Tian, Y.; Kelly, E.R.; Berendschot, T.T. Lutein: More than just a filter for blue light. Prog. Retin. Eye Res. 2012, 31, 303–315. [Google Scholar] [CrossRef] [PubMed]
- Cuttriss, A.J.; Cazzonelli, C.I.; Wurtzel, E.T.; Pogson, B.J. Carotenoids. Adv. Bot. Res. 2011, 58, 1–36. [Google Scholar]
- Khalid, M.; Saeed, R.; Bilal, M.; Iqbal, H.M.N.; Huang, D. Biosynthesis and biomedical perspectives of carotenoids with special reference to human health-related applications. Biocatal. Agric. Biotechnol. 2019, 17, 399–407. [Google Scholar] [CrossRef]
- Nkhata, S.G.; Chilungo, S.; Memba, A.; Mponela, P. Biofortification of maize and sweetpotatoes with provitamin A carotenoids and implication on eradicating vitamin A deficiency in developing countries. J. Agric. Food Res. 2020, 2, 100068. [Google Scholar] [CrossRef]
- Govender, L.; Pillay, K.; Siwela, M.; Modi, A.T.; Mabhaudhi, T. Improving the Dietary Vitamin A Content of Rural Communities in South Africa by Replacing Non-Biofortified white Maize and Sweet Potato with Biofortified Maize and Sweet Potato in Traditional Dishes. Nutrients 2019, 11, 1198. [Google Scholar] [CrossRef]
- Talsma, E.F.; Melse-Boonstra, A.; de Kok, B.P.; Mbera, G.N.; Mwangi, A.M.; Brouwer, I.D. Biofortified cassava with pro-vitamin A is sensory and culturally acceptable for consumption by primary school children in Kenya. PLoS ONE 2013, 8, e73433. [Google Scholar] [CrossRef]
- Ehlers, J.D.; Hall, A.E. Vigna unguiculata. Field Crops Res. 1997, 53, 187–204. [Google Scholar] [CrossRef]
- Carvalho, M.; Lino-Neto, T.; Rosa, E.; Carnide, V. Cowpea: A legume crop for a challenging environment. J. Sci. Food Agric. 2017, 97, 4273–4284. [Google Scholar] [CrossRef]
- Boukar, O.; Belko, N.; Chamarthi, S.; Togola, A.; Batieno, J.; Owusu, E.; Haruna, M.; Diallo, S.; Umar, M.L.; Olufajo, O.; et al. Cowpea (Vigna unguiculata): Genetics, genomics and breeding. Plant Breed. 2019, 138, 415–424. [Google Scholar] [CrossRef]
- Gomes, A.M.F.; Draper, D.; Nhantumbo, N.; Massinga, R.; Ramalho, J.C.; Marques, I.; Ribeiro-Barros, A.I. Diversity of Cowpea [Vigna unguiculata (L.) Walp] Landraces in Mozambique: New Opportunities for Crop Improvement and Future Breeding Programs. Agronomy 2021, 11, 50991. [Google Scholar] [CrossRef]
- Lonardi, S.; Muñoz-Amatriaín, M.; Liang, Q.; Shu, S.; Wanamaker, S.I.; Lo, S.; Tanskanen, J.; Schulman, A.H.; Zhu, T.; Luo, M.C.; et al. The genome of cowpea (Vigna unguiculata [L.] Walp.). Plant J. 2019, 98, 767–782. [Google Scholar] [CrossRef] [PubMed]
- Fatokun, C.; Girma, G.; Abberton, M.; Gedil, M.; Unachukwu, N.; Oyatomi, O.; Yusuf, M.; Rabbi, I.; Boukar, O. Genetic diversity and population structure of a mini-core subset from the world cowpea (Vigna unguiculata (L.) Walp.) germplasm collection. Sci. Rep. 2018, 8, 16035. [Google Scholar] [CrossRef]
- Xiong, H.; Shi, A.; Mou, B.; Qin, J.; Motes, D.; Lu, W.; Ma, J.; Weng, Y.; Yang, W.; Wu, D. Genetic Diversity and Population Structure of Cowpea (Vigna unguiculata L. Walp). PLoS ONE 2016, 11, e0160941. [Google Scholar] [CrossRef] [PubMed]
- Sodedji, F.A.K.; Agbahoungba, S.; Agoyi, E.E.; Kafoutchoni, M.K.; Choi, J.; Nguetta, S.P.A.; Assogbadjo, A.E.; Kim, H.Y. Diversity, population structure, and linkage disequilibrium among cowpea accessions. Plant Genome 2021, 14, e20113. [Google Scholar] [CrossRef] [PubMed]
- Gonçalves, A.; Goufo, P.; Barros, A.; Domínguez-Perles, R.; Trindade, H.; Rosa, E.A.S.; Ferreira, L.; Rodrigues, M. Cowpea (Vigna unguiculata L. Walp), a renewed multipurpose crop for a more sustainable agri-food system: Nutritional advantages and constraints. J. Sci. Food Agric. 2016, 96, 2941–2951. [Google Scholar] [CrossRef] [PubMed]
- Fernández-Marín, B.; Milla, R.; Martín-Robles, N.; Arc, E.; Kranner, I.; Becerril, J.M.; García-Plazaola, J.I. Side-effects of domestication: Cultivated legume seeds contain similar tocopherols and fatty acids but less carotenoids than their wild counterparts. BMC Plant Biol. 2014, 14, 1599. [Google Scholar] [CrossRef]
- Mamatha, B.S.; Sangeetha, R.K.; Baskaran, V. Provitamin-A and xanthophyll carotenoids in vegetables and food grains of nutritional and medicinal importance. Int. J. Food Sci. Technol. 2011, 46, 315–323. [Google Scholar] [CrossRef]
- Kan, L.; Nie, S.; Hu, J.; Wang, S.; Bai, Z.; Wang, J.; Zhou, Y.; Jiang, J.; Zeng, Q.; Song, K. Comparative study on the chemical composition, anthocyanins, tocopherols and carotenoids of selected legumes. Food Chem. 2018, 260, 317–326. [Google Scholar] [CrossRef]
- Natabirwa, H.; Mukiibi, J.; Zziwa, E.; Kabirizi, J. Nutritional and physicochemical properties of stored solar-dried cowpea leafy vegetables. Uganda J. Agric. Sci. 2017, 17, i11. [Google Scholar] [CrossRef][Green Version]
- Jirapa, P.; Normah, H.; Zamaliah, M.M.; Asmah, R.; Mohamad, K. Nutritional quality of germinated cowpea flour (Vigna unguiculata) and its application in home prepared powdered weaning foods. Plant Foods Hum. Nutr. 2001, 3, 203–216. [Google Scholar] [CrossRef] [PubMed]
- Ashokkumar, K.; Diapari, M.; Jha, A.B.; Tar’an, B.; Arganosa, G.; Warkentin, T.D. Genetic diversity of nutritionally important carotenoids in 94 pea and 121 chickpea accessions. J. Food Compos. Anal. 2015, 43, 49–60. [Google Scholar] [CrossRef]
- Huynh, B.L.; Close, T.J.; Roberts, P.A.; Hu, Z.; Wanamaker, S.; Lucas, M.R.; Chiulele, R.; Cissé, N.; David, A.; Hearne, S.; et al. Gene Pools and the Genetic Architecture of Domesticated Cowpea. Plant Genome 2013, 6, 3. [Google Scholar] [CrossRef]
- HarvestPlus. Biofortification Progress Briefs; HarvestPlus: Washington, DC, USA, 2014. [Google Scholar]
- Iquira, E.; Humira, S.; François, B. Association mapping of QTLs for sclerotinia stem rot resistance in a collection of soybean plant introductions using a genotyping by sequencing (GBS) approach. BMC Plant Biol. 2015, 15, 408. [Google Scholar] [CrossRef]
- Korte, A.; Farlow, A. The advantages and limitations of trait analysis with GWAS: A review. Plant Methods 2013, 9, 929. [Google Scholar] [CrossRef]
- Dhanapal, A.P.; Ray, J.D.; Singh, S.K.; Hoyos-Villegas, V.; Smith, J.R.; Purcell, L.C.; King, C.A.; Fritschi, F.B. Association mapping of total carotenoids in diverse soybean genotypes based on leaf extracts and high-throughput canopy spectral reflectance measurements. PLoS ONE 2015, 10, 7213. [Google Scholar] [CrossRef]
- Rezaei, M.K.; Deokar, A.; Tar’an, B. Identification and expression analysis of candidate genes involved in carotenoid biosynthesis in chickpea seeds. Front. Plant Sci. 2016, 7, 1867. [Google Scholar] [CrossRef]
- Azmach, G.; Gedil, M.; Menkir, A.; Spillane, C. Marker-trait association analysis of functional gene markers for provitamin A levels across diverse tropical yellow maize inbred lines. BMC Plant Biol. 2013, 13, 227. [Google Scholar] [CrossRef]
- Zhang, S.; Chen, X.; Lu, C.; Ye, J.; Zou, M.; Lu, K.; Feng, S.; Pei, J.; Liu, C.; Zhou, X.; et al. Genome-Wide Association Studies of 11 Agronomic Traits in Cassava (Manihot esculenta Crantz). Front. Plant Sci. 2018, 9, 503. [Google Scholar] [CrossRef]
- Colasuonno, P.; Marcotuli, I.; Blanco, A.; Maccaferri, M.; Condorelli, G.E.; Tuberosa, R.; Parada, R.; de Camargo, A.C.; Schwember, A.R.; Gadaleta, A. Carotenoid Pigment Content in Durum Wheat (Triticum turgidum L. var durum): An Overview of Quantitative Trait Loci and Candidate Genes. Front Plant Sci. 2019, 10, 1347. [Google Scholar] [CrossRef]
- Halilu, A.D.; Ado, S.G.; Aba, D.A.; Usman, I.S. Genetics of carotenoids for provitamin A biofortification in tropical-adapted maize. Crop J. 2016, 4, 313–322. [Google Scholar] [CrossRef]
- Zhang, X.; Bian, Z.; Yuan, X.; Chen, X.; Lu, C. A review on the effects of light-emitting diode (LED) light on the nutrients of sprouts and microgreens. Trends Food Sci. Technol. 2020, 99, 203–216. [Google Scholar] [CrossRef]
- Zhao, K.; Zhao, C.; Yang, M.; Yin, D. ZnCl2 treatment improves nutrient quality and Zn accumulation in peanut seeds and sprouts. Sci. Rep. 2020, 10, 340. [Google Scholar] [CrossRef] [PubMed]
- Khyade, V.B.; Jagtap, S.G. Sprouting Exert Significant Influence on the Antioxidant Activity in Selected Pulses (Black Gram, Cowpea, Desi Chickpea and Yellow Mustard ). World Sci. News 2016, 35, 73–86. [Google Scholar]
- Govindaraj, M.; Vetriventhan, M.; Srinivasan, M. Importance of Genetic Diversity Assessment in Crop Plants and Its Recent Advances: An Overview of Its Analytical Perspectives. Genet. Res. Int. 2015, 2015, 1487. [Google Scholar] [CrossRef]
- Souza, P.F.N.; Silva, F.D.A.; Carvalho, F.E.L.; Silveira, J.A.G.; Vasconcelos, I.M.; Oliveira, J.T.A. Photosynthetic and biochemical mechanisms of an EMS-mutagenized cowpea associated with its resistance to cowpea severe mosaic virus. Plant Cell Rep. 2017, 36, 219–234. [Google Scholar] [CrossRef]
- Stevens, G.A.; Bennett, J.E.; Hennocq, Q.; Lu, Y.; De-Regil, L.M.; Rogers, L.; Danaei, G.; Li, G.; White, R.A.; Flaxman, S.R.; et al. Trends and mortality effects of vitamin A deficiency in children in 138 low-income and middle-income countries between 1991 and 2013: A pooled analysis of population-based surveys. Lancet Global Health 2015, 3, e528–e536. [Google Scholar] [CrossRef]
- Ashokkumar, K.; Govindaraj, M.; Karthikeyan, A.; Shobhana, V.G.; Warkentin, T.D. Genomics-Integrated Breeding for Carotenoids and Folates in Staple Cereal Grains to Reduce Malnutrition. Front. Genet. 2020, 11, 414. [Google Scholar] [CrossRef]
- Eltaher, S.; Sallam, A.; Belamkar, V.; Emara, H.A.; Nower, A.A.; Salem, K.F.M.; Poland, J.; Baenziger, P.S. Genetic Diversity and Population Structure of F3:6 Nebraska Winter Wheat Genotypes Using Genotyping-By-Sequencing. Front. Genet. 2018, 9, 76. [Google Scholar] [CrossRef]
- Yu, J.; Pressoir, G.; Briggs, W.H.; Vroh Bi, I.; Yamasaki, M.; Doebley, J.F.; McMullen, M.D.; Gaut, B.S.; Nielsen, D.M.; Holland, J.B.; et al. A unified mixed-model method for association mapping that accounts for multiple levels of relatedness. Nat. Genet. 2006, 38, 203–208. [Google Scholar] [CrossRef]
- Xu, P.; Wu, X.; Wang, B.; Luo, J.; Liu, Y.; Ehlers, J.D.; Close, T.J.; Roberts, P.A.; Lu, Z.; Wang, S.; et al. Genome wide linkage disequilibrium in Chinese asparagus bean (Vigna. unguiculata ssp. sesquipedialis) germplasm: Implications for domestication history and genome wide association studies. Heredity 2012, 109, 34–40. [Google Scholar] [CrossRef] [PubMed]
- Xu, P.; Wu, X.; Muñoz-Amatriaín, M.; Wang, B.; Wu, X.; Hu, Y.; Huynh, B.L.; Close, T.J.; Roberts, P.A.; Zhou, W.; et al. Genomic regions, cellular components and gene regulatory basis underlying pod length variations in cowpea (V. unguiculata L. Walp). Plant. Biotechnol. J. 2017, 15, 547–557. [Google Scholar] [CrossRef] [PubMed]
- Joiret, M.; Mahachie John, J.M.; Gusareva, E.S.; Van Steen, K. Confounding of linkage disequilibrium patterns in large scale DNA based gene-gene interaction studies. BioData Min. 2019, 12, 11. [Google Scholar] [CrossRef] [PubMed]
- Elattar, M.A.; Karikari, B.; Li, S.; Song, S.; Cao, Y.; Aslam, M.; Hina, A.; Abou-Elwafa, S.F.; Zhao, T. Identification and Validation of Major QTLs, Epistatic Interactions, and Candidate Genes for Soybean Seed Shape and Weight Using Two Related RIL Populations. Front. Genet. 2021, 12, 666440. [Google Scholar] [CrossRef]
- Ravelombola, W.; Qin, J.; Shi, A.; Weng, Y.; Bhattarai, G.; Dong, L.; Morris, J.B. A SNP-based association analysis for plant growth habit in worldwide cowpea (Vigna unguiculata (L.) Walp) Germplasm. Euphytica 2017, 213, 284. [Google Scholar] [CrossRef]
- Sreekala, C.; Raghava, S.P. Exploitation of heterosis for carotenoid content in African marigold (Tagetes erecta L.) and its correlation with esterase polymorphism. Theor Appl Genet. 2003, 106, 771–776. [Google Scholar] [CrossRef]
- Kandianis, C.B.; Stevens, R.; Liu, W.; Palacios, N.; Montgomery, K.; Pixley, K.; White, W.S.; Rocheford, T. Genetic architecture controlling variation in grain carotenoid composition and concentrations in two maize populations. Theor. Appl. Genet. 2013, 126, 2879–2895. [Google Scholar] [CrossRef]
- Burt, A.J.; Grainger, C.M.; Shelp, B.J.; Lee, E.A. Heterosis for carotenoid concentration and profile in maize hybrids. Genome 2011, 54, 993–1004. [Google Scholar] [CrossRef]
- Lee, S.H.; Park, K.Y.; Lee, H.S.; Park, E.H.; Boerma, H.R. Genetic mapping of QTLs conditioning soybean sprout yield and quality. Theor. Appl. Genet. 2001, 103, 702–709. [Google Scholar] [CrossRef]
- Eum, H.L.; Park, Y.; Yi, T.G.; Lee, J.W.; Ha, K.S.; Choi, I.Y.; Park, N.I. Effect of germination environment on the biochemical compounds and anti-inflammatory properties of soybean cultivars. PLoS ONE 2020, 15, 2159. [Google Scholar] [CrossRef]
- Gu, E.J.; Kim, D.W.; Jang, G.J.; Song, S.H.; Lee, J.I.; Lee, S.B.; Kim, B.M.; Cho, Y.; Lee, H.J.; Kim, H.J. Mass-based metabolomic analysis of soybean sprouts during germination. Food Chem. 2017, 217, 311–319. [Google Scholar] [CrossRef] [PubMed]
- Takuno, S.; Terauchi, R.; Innan, H. The power of QTL mapping with RILs. PLoS ONE 2012, 7, e46545. [Google Scholar] [CrossRef] [PubMed]
- Rezaei, M.K.; Deokar, A.A.; Arganosa, G.; Roorkiwal, M.; Pandey, S.K.; Warkentin, T.D.; Varshney, R.K.; Tar An, B. Mapping Quantitative Trait Loci for Carotenoid Concentration in Three F2 Populations of Chickpea. Plant. Genome 2019, 12, 67. [Google Scholar] [CrossRef] [PubMed]
- He, J.; Zhang, D.; Chen, X.; Li, Y.; Hu, M.; Sun, S.; Su, Q.; Su, Y.; Li, S. Identification of QTLs and a Candidate Gene for Reducing Pre-Harvest Sprouting in Aegilops tauschii-Triticum aestivum Chromosome Segment Substitution Lines. Int J. Mol. Sci 2021, 22, 3729. [Google Scholar] [CrossRef]
- De Mendiburu, F. Package ‘Agricolae’. 2019. Available online: https://CRAN.R-project.org/package=agricolae (accessed on 3 March 2022).
- Fox, J.; Weisberg, S. An R Companion to Applied Regression; Sage Publications: London, UK, 2018. [Google Scholar]
- Kassambara, A.; Mundt, F. Package ‘Factoextra’. 2017. Available online: http://www.sthda.com/english/rpkgs/factoextra (accessed on 3 March 2022).
- Charrad, M.; Ghazzali, N.; Boiteau, V.; Niknafs, A. NbClust: AnRPackage for Determining the Relevant Number of Clusters in a Data Set. J. Stat. Softw. 2014, 61, i06. [Google Scholar] [CrossRef]
- Paradis, E.; Schliep, K. ape 5.0: An environment for modern phylogenetics and evolutionary analyses in R. Bioinformatics 2019, 35, 526–528. [Google Scholar] [CrossRef]
- Asnicar, F.; Weingart, G.; Tickle, T.L.; Huttenhower, C.; Segata, N. Compact graphical representation of phylogenetic data and metadata with GraPhlAn. PeerJ 2015, 3, e1029. [Google Scholar] [CrossRef]
- Blyton, M.D.J.; Flanagan, N.S. A Comprehensive Guide to GenAlEx 6.5; Australian National University: Canberra, Australia, 2006; p. 131. [Google Scholar]
- Frichot, E.; François, O.; O’Meara, B. LEA: An R package for landscape and ecological association studies. Methods Ecol. Evol. 2015, 6, 925–929. [Google Scholar] [CrossRef]
- Jombart, T.; Devillard, S.; Balloux, F. Discriminant analysis of principal components: A new method for the analysis of genetically structured populations. BMC Genet. 2010, 11, 94. [Google Scholar] [CrossRef]
- Bradbury, P.J.; Zhang, Z.; Kroon, D.E.; Casstevens, T.M.; Ramdoss, Y.; Buckler, E.S. TASSEL: Software for association mapping of complex traits in diverse samples. Bioinformatics 2007, 23, 2633–2635. [Google Scholar] [CrossRef]
- Wickham, H. ggplot2. Wiley Interdisciplinary Reviews: Computational Statistics; Wiley: London, UK, 2011; Volume 3, pp. 180–185. [Google Scholar] [CrossRef]
- Breseghello, F.; Sorrells, M.E. Association mapping of kernel size and milling quality in wheat (Triticum aestivum L.) cultivars. Genetics 2006, 172, 1165–1177. [Google Scholar] [CrossRef] [PubMed]
- Yin, L.; Zhang, H.; Tang, Z.; Xu, J.; Yin, D.; Zhang, Z.; Yuan, X.; Zhu, M.; Zhao, S.; Li, X.; et al. rMVP: A Memory-efficient, Visualization-enhanced, and Parallel-accelerated tool for Genome-Wide Association Study. Genom. Proteom. Bioinf. 2021, 135, 709–721. [Google Scholar] [CrossRef] [PubMed]
- Goh, L.; Yap, V.B. Effects of normalization on quantitative traits in association test. BMC Bioinf. 2009, 10, 415. [Google Scholar] [CrossRef]
- Peterson, R.A.; Cavanaugh, J.E. Ordered quantile normalization: A semiparametric transformation built for the cross-validation era. J. Appl. Stat. 2019, 47, 2312–2327. [Google Scholar] [CrossRef]
- Li, J.; Liu, J.; Wen, W.e.; Zhang, P.; Wan, Y.; Xia, X.; Zhang, Y.; He, Z. Genome-wide association mapping of vitamins B1 and B2 in common wheat. Crop J. 2018, 6, 263–270. [Google Scholar] [CrossRef]
- Morales, K.Y.; Singh, N.; Perez, F.A.; Ignacio, J.C.; Thapa, R.; Arbelaez, J.D.; Tabien, R.E.; Famoso, A.; Wang, D.R.; Septiningsih, E.M.; et al. An improved 7K SNP array, the C7AIR, provides a wealth of validated SNP markers for rice breeding and genetics studies. PLoS ONE 2020, 15, e0232479. [Google Scholar] [CrossRef]


Publisher’s Note: MDPI stays neutral with regard to jurisdictional claims in published maps and institutional affiliations. |
© 2022 by the authors. Licensee MDPI, Basel, Switzerland. This article is an open access article distributed under the terms and conditions of the Creative Commons Attribution (CC BY) license (https://creativecommons.org/licenses/by/4.0/).