
Chromosome Number and Genome Size Evolution in Brasolia and Sobralia (Sobralieae, Orchidaceae)

 , , , , , and
Abstract
:1. Introduction
2. Results
2.1. Phylogenetic Analysis Suggested Brasolia as Paraphyletic
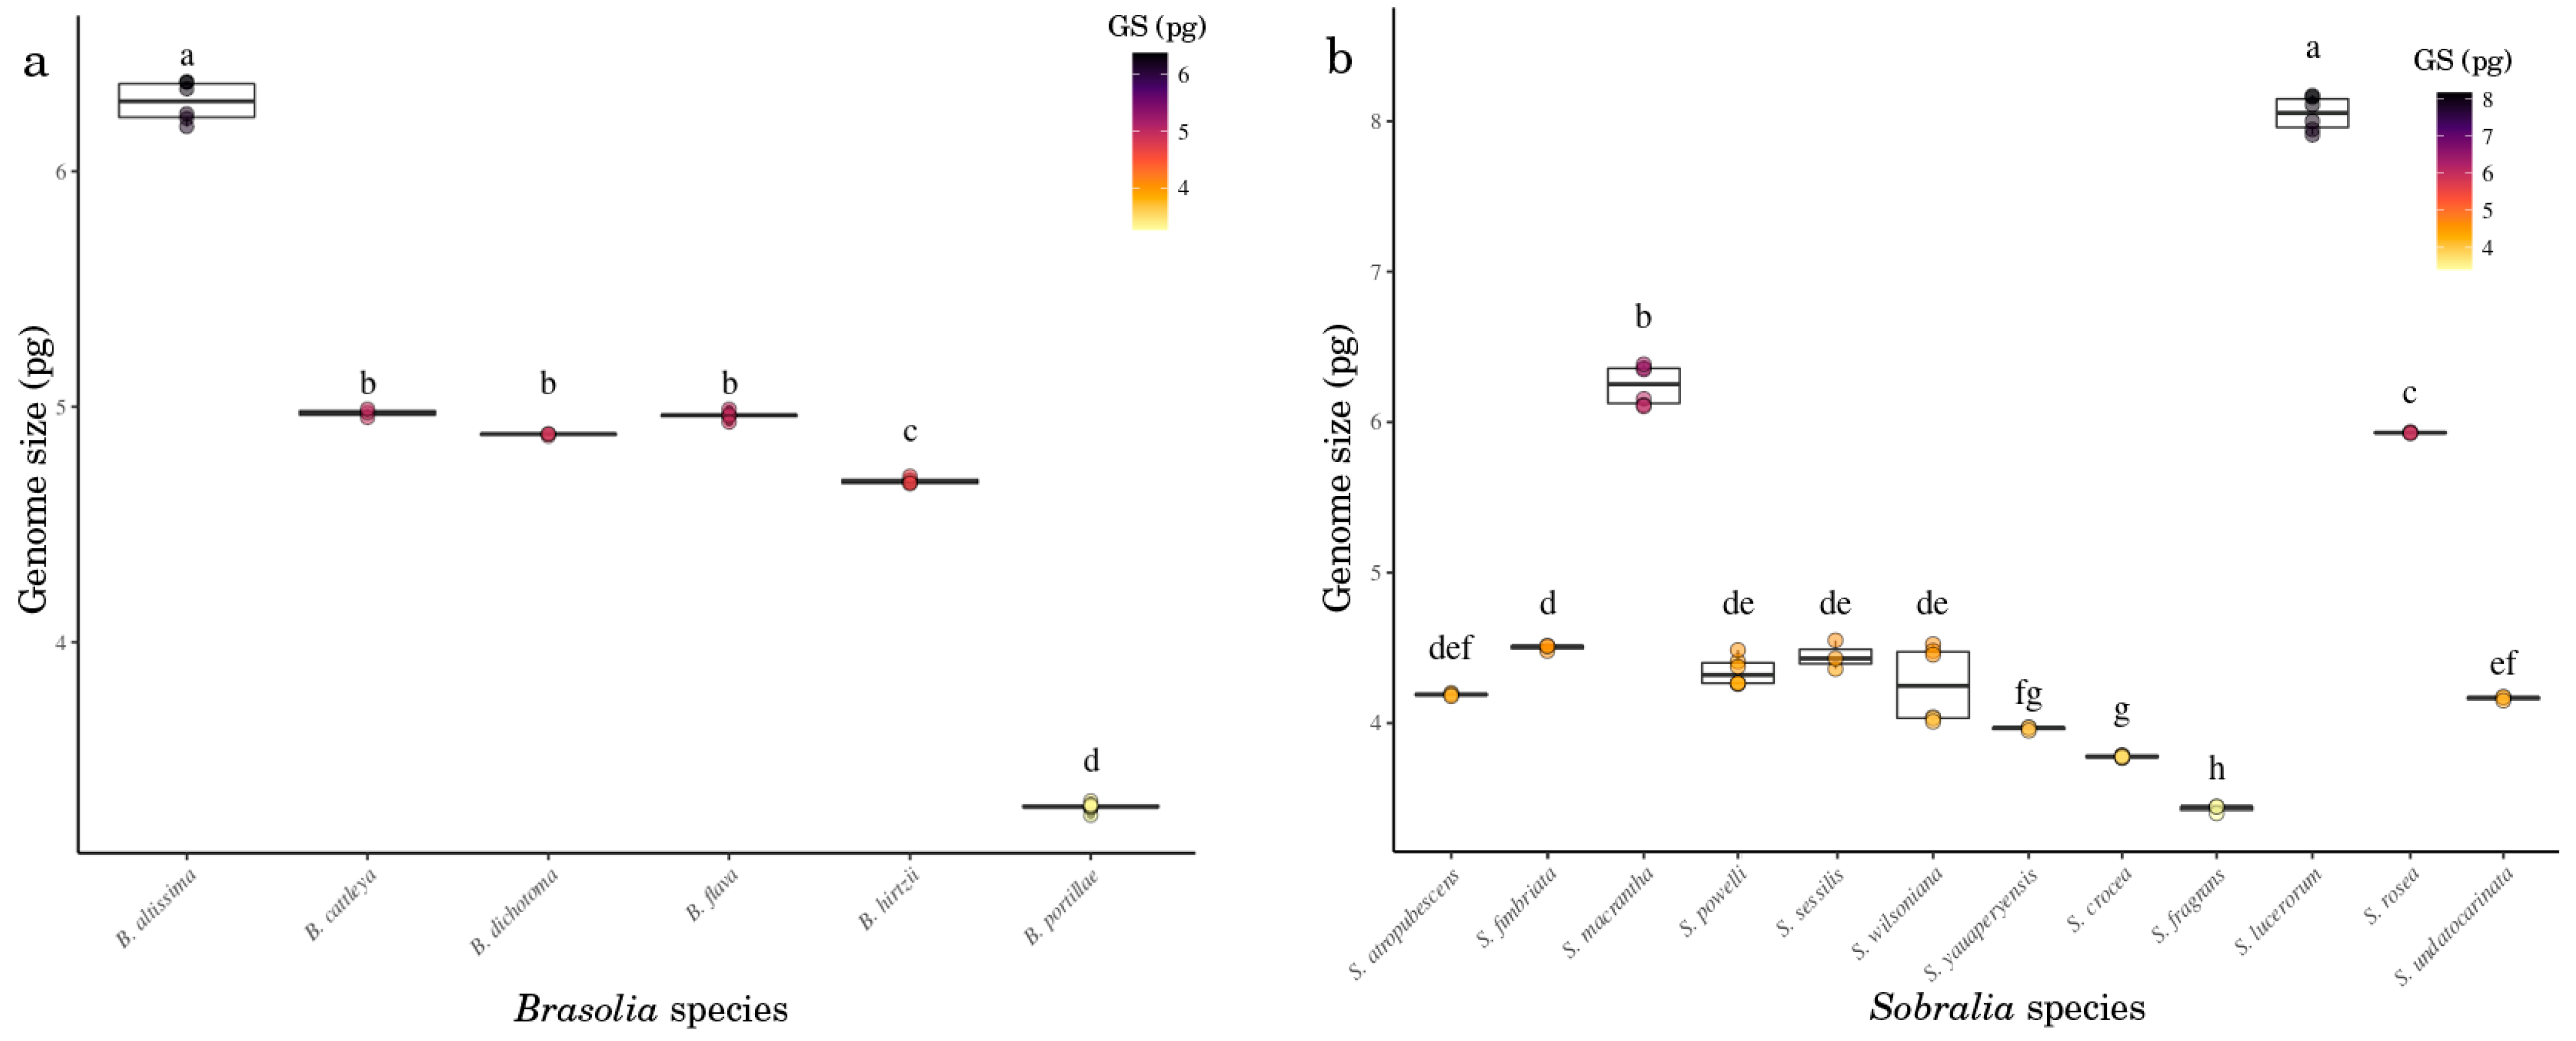
2.2. Chromosome Number and Genome Size Varies in Sobralieae
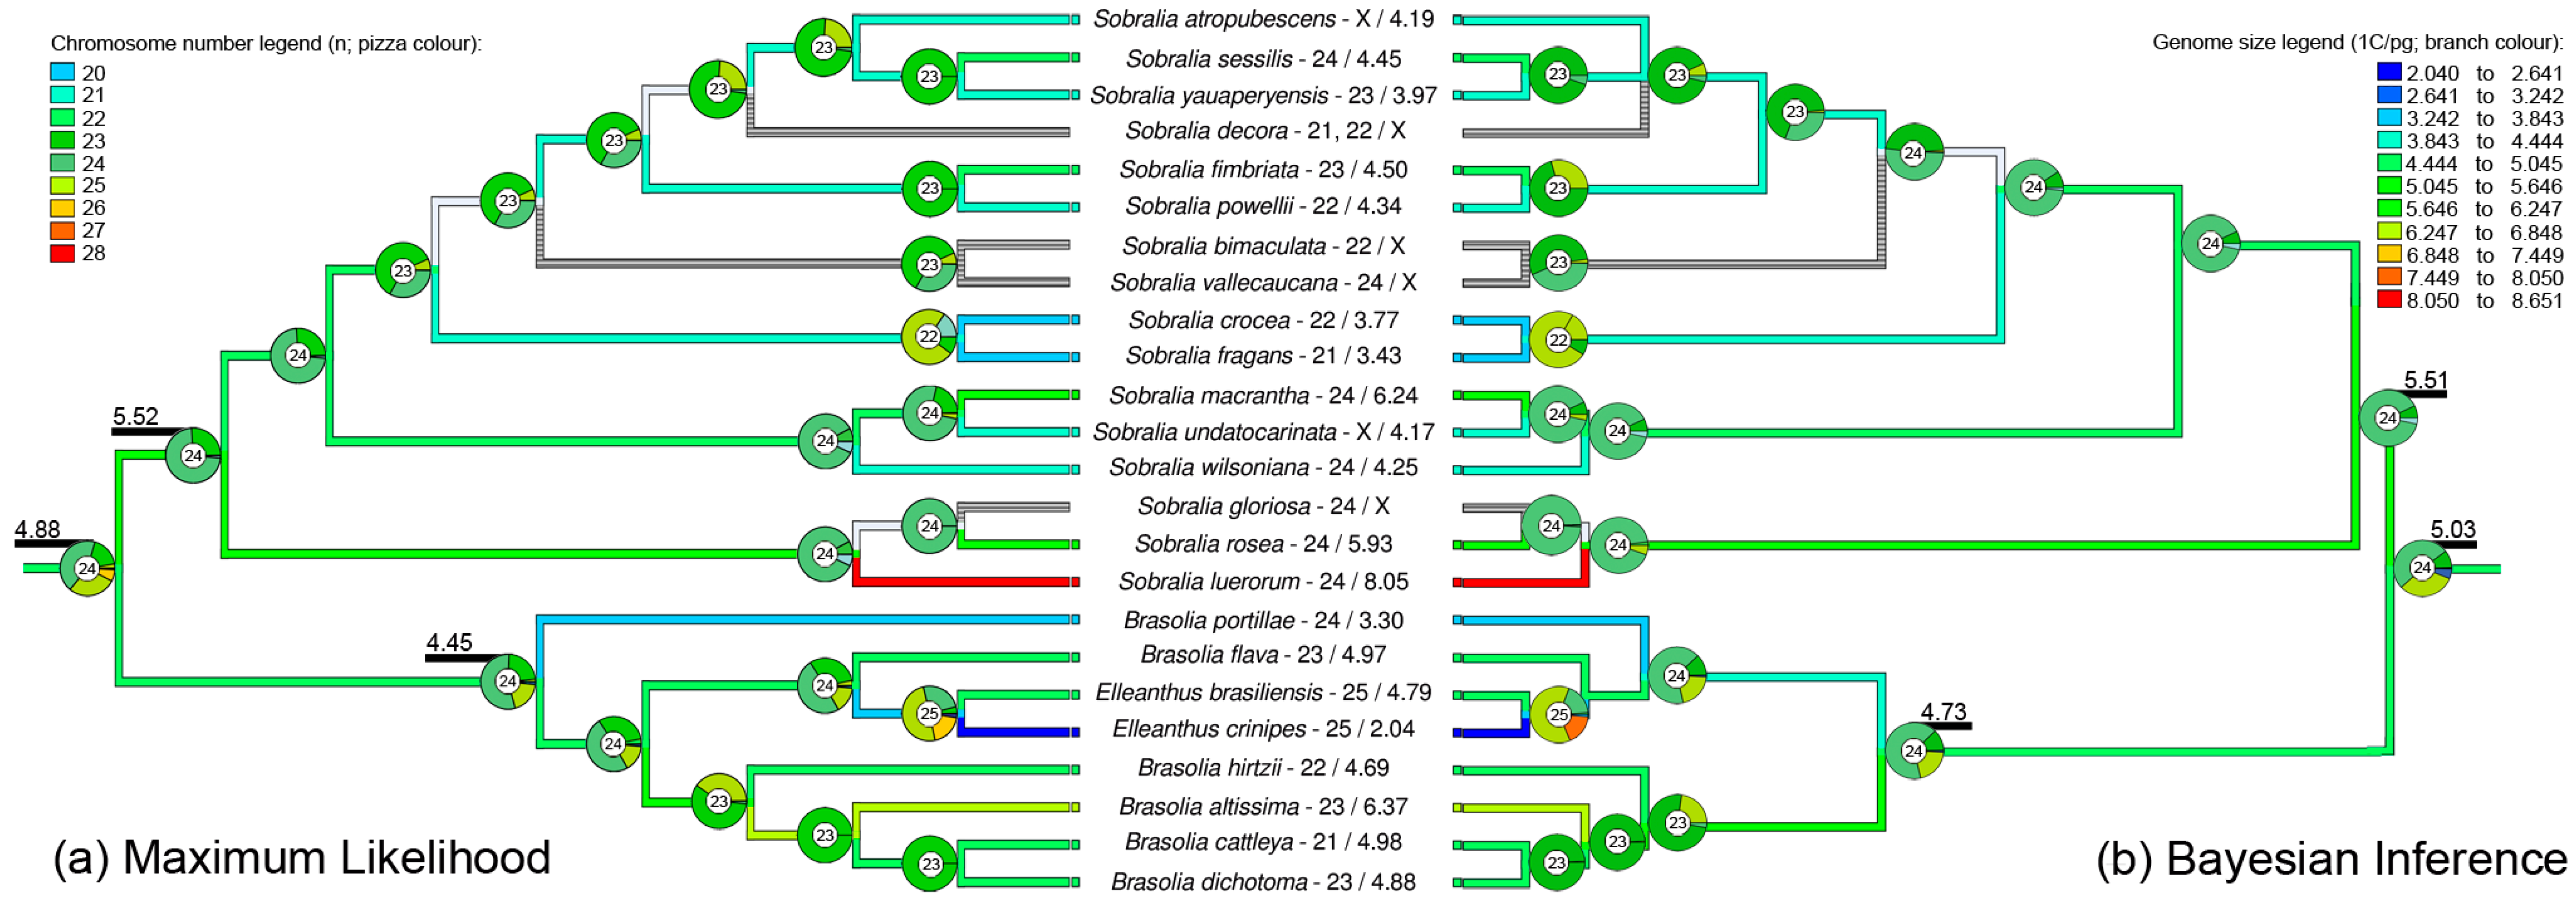
2.3. Ancestral Reconstruction of Chromosome Number and Genome Size Indicate x = 25 and Small Genome Size for the Common Ancestor of Brasolia-Elleanthus-Sobralia
3. Discussion
3.1. Phylogenetic Reconstruction
3.2. Ancestral Base Chromosome Number Reconstruction Indicates Dysploidy as the Main Mechanism of Karyotype Evolution
3.3. Genome Size Reconstruction: The Role of Genome Size in Species Evolution
3.4. Genus Delimitation in Sobralieae: Future Perspectives
4. Materials and Methods
4.1. Plant Material
4.2. Phylogenetic Analysis
4.3. Cytogenetics Analysis
4.4. Chromosome Number and Genome Size Evolution
Supplementary Materials
Author Contributions
Funding
Institutional Review Board Statement
Informed Consent Statement
Data Availability Statement
Acknowledgments
Conflicts of Interest
References
- Ruiz, H.J.; Pavón, J. Flora Peruvianae et Chilensis Prodromus; Ruiz, H.J., Pavón, J., Eds.; G. de Sancha: Madrid, Spain, 1794. [Google Scholar]
- Brieger, F.G. Subtribus Sobraliinae. In Die Orchideen; Brieger, F.G., Maatsch, R., Senghas, K., Eds.; Lieferung, VerlagPaul Parey: Berlin/Hamburg, Germany, 1983; Volume 13, pp. 780–800. [Google Scholar]
- Dressler, R.L. The major sections or groups within Sobralia, with four new species from Panama and Costa Rica, S. crispissima, S. gloriana, S. mariannae and S. nutans. Lankasteriana 2002, 5, 9–15. [Google Scholar] [CrossRef] [Green Version]
- Baranow, P.; Dudek, M.; Szlachetko, D.L. Brasolia, a new genus highlighted from Sobralia (Orchidaceae). Plant Syst. Evol. 2017, 303, 853–871. [Google Scholar] [CrossRef] [Green Version]
- Neubig, K.M.; Whitten, W.M.; Blanco, M.; Endara, L.; Williams, N.H.; Koehler, S. Preliminary molecular phylogenetics of Sobralia and relatives (Orchidaceae: Sobralieae). Lankesteriana 2011, 11, 307–317. [Google Scholar] [CrossRef] [Green Version]
- Dressler, R.L.; Blanco, M.A.; Pupulin, F.; Neubig, K.M. Proposal to conserve the name Sobralia (Orchidaceae) with a conserved type. Taxon 2011, 60, 907–908. [Google Scholar] [CrossRef]
- de Resende, K.F.M. Karyotype Evolution: Concepts and Applications. In Chromosome Structure and Aberrations; Bhat, T., Wani, A., Eds.; Springer: New Delhi, India, 2017; pp. 181–200. [Google Scholar] [CrossRef]
- Felix, L.P.; Guerra, M. Variation in chromosome number and the basic number of subfamily Epidendroideae (Orchidaceae). Bot. J. Linn. Soc. 2010, 163, 234–278. [Google Scholar] [CrossRef]
- Guerra, M. Cytotaxonomy: The end of childhood. Plant Biosyst. 2012, 146, 703–710. [Google Scholar] [CrossRef]
- Mayrose, I.; Lysak, M.A. The Evolution of Chromosome Numbers: Mechanistic Models and Experimental Approaches. Genome Biol. Evol. 2021, 13, evaa220. [Google Scholar] [CrossRef]
- Felix, L.P.; Guerra, M. Cytogenetics and cytotaxonomy of some Brazilian species of Cymbidioid orchids. Genet. Mol. Biol. 2000, 23, 957–978. [Google Scholar] [CrossRef]
- Yeh, H.Y.; Lin, C.S.; de Jong, H.; Chang, S.B. Two reported cytotypes of the emergent orchid model species Erycina pusilla are two different species. Euphytica 2017, 213, 957–978. [Google Scholar] [CrossRef] [Green Version]
- Leitch, I.J.; Kahandawala, I.M.; Suda, J.; Hanson, L.; Ingrouille, M.J.; Chase, M.W.; Fay, M.F. Genome size diversity in orchids: Consequences and evolution. Ann. Bot. 2009, 104, 469–481. [Google Scholar] [CrossRef]
- Moraes, A.P.; Souza-Chies, T.T.; Stiehl-Alves, E.M.; Burchardt, P.; Eggers, L.; Siljak-Yakovlev, S.; Brown, S.C.; Chauveau, O.; Nadot, S.; Bourge, M.; et al. Evolutionary trends in Iridaceae: New cytogenetic findings from the New World. Bot. J. Linn. Soc. 2015, 177, 27–49. [Google Scholar] [CrossRef] [Green Version]
- Moraes, A.P.; Simões, A.O.; Alayon, D.I.O.; De Barros, F.; Forni-Martins, E.R. Detecting mechanisms of karyotype evolution in Heterotaxis (Orchidaceae). PLoS ONE 2016, 11, e0165960. [Google Scholar] [CrossRef] [PubMed]
- Soltis, D.; Soltis, P.; Bennett, M.; Leitch, I. Evolution of genome size in the angiosperms. Am. J. Bot. 2003, 90, 1596–1603. [Google Scholar] [CrossRef] [PubMed]
- Guerra, M. Chromosome numbers in plant cytotaxonomy: Concepts and implications. Cytogenet. Genome Res. 2008, 120, 339–350. [Google Scholar] [CrossRef] [PubMed]
- De Oliveira, I.G.; Moraes, A.P.; De Almeida, E.M.; de Assis, F.N.M.; Cabral, J.S.; De Barros, F.; Felix, L.P. Chromosomal evolution in Pleurothallidinae (Orchidaceae: Epidendroideae) with an emphasis on the genus Acianthera: Chromosome numbers and heterochromatin. Bot. J. Linn. Soc. 2015, 178, 102–120. [Google Scholar] [CrossRef] [Green Version]
- Koehler, S.; Cabral, J.S.; Whitten, W.M.; Williams, N.H.; Singer, R.B.; Neubig, K.M.; Guerra, M.; Souza, A.P.; Amaral, M.D.C.E. Molecular Phylogeny of the Neotropical Genus Christensonella (Orchidaceae, Maxillariinae): Species Delimitation and Insights into Chromosome Evolution. Ann. Bot. 2008, 102, 491–507. [Google Scholar] [CrossRef] [Green Version]
- Moraes, A.P.; Koehler, S.; Cabral, J.S.; Gomes, S.S.L.; Viccini, L.F.; Barros, F.; Felix, L.P.; Guerra, M.; Forni-Martins, E.R. Karyotype diversity and genome size variation in Neotropical Maxillariinae orchids. Plant Biol. 2017, 19, 298–308. [Google Scholar] [CrossRef]
- Jiao, Y. Double the Genome, Double the Fun: Genome Duplications in Angiosperms. Mol. Plant 2018, 11, 357–358. [Google Scholar] [CrossRef] [Green Version]
- Magallón, S.; Sánchez-reyes, L.L.; Gómez-acevedo, S.L. Thirty clues to the exceptional diversification of flowering plants. Ann. Bot. 2019, 123, 491–503. [Google Scholar] [CrossRef]
- Levin, D.A. Did dysploid waves follow the pulses of whole genome duplications? Plant Syst. Evol. 2020, 306, 75. [Google Scholar] [CrossRef]
- Van de Peer, Y.; Ashman, T.L.; Soltis, P.S.; Soltis, D.E. Polyploidy: An evolutionary and ecological force in stressful times. Plant Cell 2021, 33, 11–26. [Google Scholar] [CrossRef] [PubMed]
- Vanneste, K.; Baele, G.; Maere, S.; Van De Peer, Y. Analysis of 41 plant genomes supports a wave of successful genome duplications in association with the Cretaceous-Paleogene boundary. Genome Res. 2014, 24, 1334–1347. [Google Scholar] [CrossRef] [PubMed] [Green Version]
- Soltis, P.S.; Marchant, D.B.; Van de Peer, Y.; Soltis, D.E. Polyploidy and genome evolution in plants. Curr. Opin. Genet. Dev. 2015, 35, 119–125. [Google Scholar] [CrossRef] [PubMed] [Green Version]
- Givnish, T.J.; Spalink, D.; Ames, M.; Lyon, S.; Hunter, S.J.; Zuluaga, A.; Iles, W.J.D.; Clements, M.A.; Arroyo, M.T.K.; Leebens-Mack, J.; et al. Orchid phylogenomics and multiple drivers of their extraordinary diversification. Proc. R. Soc. B 2015, 282, 20151553. [Google Scholar] [CrossRef] [PubMed]
- Givnish, T.J.; Spalink, D.; Ames, M.; Lyon, S.P.; Hunter, S.J.; Zuluaga, A.; Doucette, A.; Caro, G.G.; McDaniel, J.; Clements, M.A.; et al. Orchid historical biogeography, diversification, Antarctica and the paradox of orchid dispersal. J. Biogeogr. 2016, 43, 1905–1916. [Google Scholar] [CrossRef]
- Li, Y.-X.; Li, Z.-H.; Schuiteman, A.; Chase, M.W.; Li, J.-W.; Huang, W.-C.; Hidayat, A.; Wu, S.-S.; Jin, X.-H. Phylogenomics of Orchidaceae based on plastid and mitochondrial genomes. Mol. Phylogenet. Evol. 2019, 139, 106540. [Google Scholar] [CrossRef]
- Serna-Sánchez, M.A.; Pérez-Escobar, O.A.; Bogarín, D.; Torres-Jimenez, M.F.; Alvarez-Yela, A.C.; Arcila-Galvis, J.E.; Hall, C.F.; de Barros, F.; Pinheiro, F.; Dodsworth, S.; et al. Plastid phylogenomics resolves ambiguous relationships within the orchid family and provides a solid timeframe for biogeography and macroevolution. Sci. Rep. 2021, 11, 6858. [Google Scholar] [CrossRef]
- Carta, A.; Bedini, G.; Peruzzi, L. A deep dive into the ancestral chromosome number and genome size of flowering plants. New Phytol. 2020, 228, 1097–1106. [Google Scholar] [CrossRef]
- Pérez-Escobar, O.A.; Dodsworth, S.; Bogarín, D.; Bellot, S.; Balbuena, J.A.; Schley, R.J.; Kikuchi, I.A.; Morris, S.K.; Epitawalage, N.; Cowan, R.; et al. Hundreds of nuclear and plastid loci yield novel insights into orchid relationships. Am. J. Bot. 2021, 108, 1166–1180. [Google Scholar] [CrossRef]
- Baduel, P.; Bray, S.; Vallejo-Marin, M.; Kolář, F.; Yant, L. The ‘Polyploid Hop’: Shifting challenges and opportunities over the evolutionary lifespan of genome duplications. Front. Ecol. Evol. 2018, 6, 117. [Google Scholar] [CrossRef] [Green Version]
- Mandáková, T.; Lysak, M.A. Post-polyploid diploidization and diversification through dysploid changes. Curr. Opin. Plant Biol. 2018, 42, 55–65. [Google Scholar] [CrossRef] [PubMed]
- Garrido-Ramos, M.A. Satellite DNA: An Evolving Topic. Genes 2017, 8, 230. [Google Scholar] [CrossRef] [PubMed]
- Pellicer, J.; Hidalgo, O.; Dodsworth, S.; Leitch, I.J. Genome size diversity and its impact on the evolution of land plants. Genes 2018, 9, 88. [Google Scholar] [CrossRef] [PubMed] [Green Version]
- Rezende, L.; Suzigan, J.; Amorim, F.W.; Moraes, A.P. Can plant hybridization and polyploidy lead to pollinator shift? Acta Bot. Bras. 2020, 34, 229–242. [Google Scholar] [CrossRef]
- Nunes, C.E.; Amorim, F.W.; Mayer, J.L.; Sazima, M. Pollination ecology of two species of Elleanthus (Orchidaceae): Novel mechanisms and underlying adaptations to hummingbird pollination. Plant Biol. 2016, 18, 15–25. [Google Scholar] [CrossRef]
- Udulutsch, R.G. Elleanthus in Flora do Brasil. Jardim Botânico do Rio de Janeiro. 2020. Available online: http://floradobrasil.jbrj.gov.br/reflora/floradobrasil/FB86254 (accessed on 12 October 2021).
- Freudenstein, J.V.; Chase, M.W. Phylogenetic relationships in Epidendroideae (Orchidaceae), one of the great flowering plant radiations: Progressive specialization and diversification. Ann. Bot. 2015, 115, 665–681. [Google Scholar] [CrossRef] [Green Version]
- Doyle, J.J.; Doyle, J.L. A rapid DNA isolation procedure for small quantities of fresh leaf tissue. Phytochem. Bull. 1987, 19, 11–15. [Google Scholar]
- Douzery, E.J.P.; Pridgeon, A.M.; Kores, P.; Linder, H.P.; Kurzweil, H.; Chase, M.W. Molecular Phylogenetics of Disae (Orchidaceae): A contribution from nuclear ribosomal ITS sequences. Am. J. Bot. 1999, 86, 887–899. [Google Scholar] [CrossRef]
- Sun, Y.; Skinner, D.Z.; Liang, G.H.; Hulbert, S.H. Phylogenetic analysis of Sorghum and related taxa using internal transcribed spacers of nuclear ribosomal DNA. Theoret. Appl. Genet. 1994, 89, 26–32. [Google Scholar] [CrossRef]
- Molvary, M.; Kores, P.J.; Chase, M.W. Polyphyly of mycoheterotrophic orchids and functional influences on floral and molecular characters. In Monocots: Systematic and Evolution; Morrison, D.A., Wilson, K.L., Eds.; CSIRO Publishing: Collingwood, Australia, 2000; pp. 441–448. [Google Scholar]
- Cuénoud, P.; Savolainen, V.; Chatrou, L.W.; Powell, M.; Grayer, R.J.; Chase, M.W. Molecular phylogenetics of Caryophyllales based on nuclear 18S rDNA and plastid rbcL, atpB and matK DNA sequences. Am. J. Bot. 2002, 89, 132–144. [Google Scholar] [CrossRef]
- Katoh, K.; Standley, D.M. MAFFT Multiple sequence alignment software version 7: Improvements in performance and usability. Mol. Biol. Evol. 2013, 30, 772–780. [Google Scholar] [CrossRef] [PubMed] [Green Version]
- Hall, T.A. BioEdit: A User-Friendly Biological Sequence Alignment Editor and Analysis Program for Windows 95/98/NT. Nucleic Acids Symp. Ser. 1999, 41, 95–98. [Google Scholar]
- Maddison, W.P.; Maddison, D.R. Mesquite: A Modular System for Evolutionary Analysis. Version 3.61. 2019. Available online: http://www.mesquiteproject.org (accessed on 12 October 2021).
- Minh, B.Q.; Schmidt, H.A.; Chernomor, O.; Schrempf, D.; Woodhams, M.D.; von Haeseler, A.; Lanfear, R. IQ-TREE 2: New models and efficient methodes for phylogenetic inference in the genomic era. Mol. Biol. Evol. 2020, 37, 1530–1534. [Google Scholar] [CrossRef] [PubMed] [Green Version]
- Kalyaanamoorthy, S.; Quang, M.B.; Wong, T.; von Haeseler, A.; Jermiin, L.S. ModelFinder: Fast model selection for accurate phylogenetic estimates. Nat. Methods 2017, 14, 587–589. [Google Scholar] [CrossRef] [PubMed] [Green Version]
- Ronquist, F.; Teslenko, M.; van der Mark, P.; Huelsenbeck, J. MrBayes 3.2: Efficient Bayesian phylogenetic inference and model choice across a large model space. Syst. Biol. 2012, 61, 539–542. [Google Scholar] [CrossRef] [PubMed] [Green Version]
- Rambaut, A.; Drummond, A.; Xie, D.; Baele, G.; Suchard, M.A. Posterior summarization in Bayesian Phylogenetics using Tracer 1.7. Syst. Biol. 2018, 67, 901–904. [Google Scholar] [CrossRef] [Green Version]
- Cummings, M.P.; Handley, S.A.; Myers, D.S.; Reed, D.L.; Rokas, A.; Winka, K. Comparing Bootstrap and Posterior Probability Values in the Four-Taxon Case. Syst. Biol. 2003, 52, 477–487. [Google Scholar] [CrossRef]
- Simmons, M.P.; Pickett, K.M.; Miya, M. How Meaningful Are Bayesian Support Values? Mol. Biol. Evol. 2004, 21, 188–199. [Google Scholar] [CrossRef] [Green Version]
- Jensen, W.A. Botanical Histochemistry: Principles and Practice; Jensen, W.A., Ed.; W.H. Freeman & Co.: San Francisco, CA, USA, 1962; pp. 1–408. [Google Scholar]
- Fukui, K.; Nakayama, S. Plant Chromosomes: Laboratory Methods; Fukui, K., Nakayama, S., Eds.; CRC Press: Boca Raton, FL, USA, 1996; pp. 1–288. [Google Scholar]
- Jedrzejczyk, I.; Sliwinska, E. Leaves and seeds as materials for flow cytometric estimation of the genome size of 11 Rosaceae woody species containing DNA-staining inhibitors. J. Bot. 2010, 2010, 930895. [Google Scholar] [CrossRef] [Green Version]
- Rewicz, A.; Rewers, M.; Jędrzejczyk, I.; Rewicz, T.; Kołodziejek, J.; Jakubska-Busse, A. Morphology and genome size of Epipactis helleborine (L.) Crantz (Orchidaceae) growing in anthropogenic and natural habitats. PeerJ 2018, 6, e5992. [Google Scholar] [CrossRef] [Green Version]
- Ebihara, A.; Ishikawa, H.; Matsumoto, S.; Lin, S.J.; Iwatsuki, K.; Takamiya, M.; Watano, Y.; Ito, M. Nuclear DNA, chloroplast DNA, and ploidy analysis clarified biological complexity of the Vandenboschia radicans complex (Hymenophyllaceae) in Japan and adjacent areas. Am. J. Bot. 2005, 92, 1535–1547. [Google Scholar] [CrossRef] [PubMed]
- Doležel, J.; Greilhuber, J.; Lucretti, S.; Meister, A.; Lysák, M.A.; Nardi, L.; Obermayer, R. Plant genome size estimation by flow cytometry: Inter-laboratory comparison. Ann. Bot. 1998, 82, 17–26. [Google Scholar] [CrossRef] [Green Version]
- Doležel, J.; Bartos, J. Plant DNA flow cytometry and estimation of nuclear genome size. Ann. Bot. 2005, 95, 99–110. [Google Scholar] [CrossRef] [PubMed] [Green Version]
- Pellicer, J.; Powell, R.F.; Leitch, I.J. The application of flow cytometry for estimating genome size, ploidy level, endopolyploidy, and reproductive modes in plants. In Molecular Plant Taxonomy; Besse, P., Ed.; Springer: New York, NY, USA, 2021. [Google Scholar]
- R Core Team. R: A Language and Environment for Statistical Computing; R Foundation for Statistical Computing: Vienna, Austria, 2021; Available online: https://www.R-project.org/ (accessed on 12 October 2021).
- Paradis, E.; Schliep, K. Ape 5.0: An environment for modern phylogenetics and evolutionary analyses in R. Bioinformatics 2019, 35, 526–528. [Google Scholar] [CrossRef]
- Mayrose, I.; Barker, M.S.; Otto, S. Probabilistic models of chromosome number evolution and the inference of polyploidy. Syst. Biol. 2010, 59, 132–144. [Google Scholar] [CrossRef] [Green Version]
- Glick, L.; Mayrose, I. ChromEvol: Assessing the pattern of chromosome number evolution and the inference of polyploidy along a phylogeny. Mol. Biol. Evol. 2014, 31, 1914–1922. [Google Scholar] [CrossRef]
- Burnham, K.P.; Anderson, D.R. (Eds.) Model Selection and Multimodel Inference; Springer: New York, NY, USA, 2002; pp. 49–97. [Google Scholar] [CrossRef]
- Burnham, K.P.; Anderson, D.R. Multimodel Inference: Understanding AIC and BIC in Model Selection. Sociol. Methods Res. 2004, 33, 261–304. [Google Scholar] [CrossRef]
- Rice, A.; Mayrose, I. Model adequacy tests for probabilistic models of chromosome number evolution. New Phytol. 2021, 229, 3602–3613. [Google Scholar] [CrossRef]
- Blomberg, S.P.; Garland, T. Tempo and mode in evolution: Phylogenetic inertia, adaptation and comparative methods. J. Evol. Biol. 2002, 15, 899–910. [Google Scholar] [CrossRef]
- Münkemüller, T.; Lavergne, S.; Bzeznik, B.; Dray, S.; Jombart, T.; Schiffers, K.; Thuiller, W.W. How to measure and test phylogenetic signal. Methods Ecol. Evol. 2012, 3, 743–756. [Google Scholar] [CrossRef]
- Pagel, M. Inferring the historical patterns of biological evolution. Nature 1999, 401, 877–884. [Google Scholar] [CrossRef] [PubMed]
- Revell, L.J.; Mahler, D.L.; Peres-Neto, P.R.; Redelings, B.D. A new phylogenetic method for identifying exceptional phenotypic diversification. Evolution 2012, 66, 135–146. [Google Scholar] [CrossRef] [PubMed]

| No. | Species [n. FCM Analyzed Specimens] | Chromosome Number | Figure/Reference | 1C DNA Content | CV Sample % | Genome Size Category | |
|---|---|---|---|---|---|---|---|
| pg ± SD | Mbp | ||||||
| Brasolia | |||||||
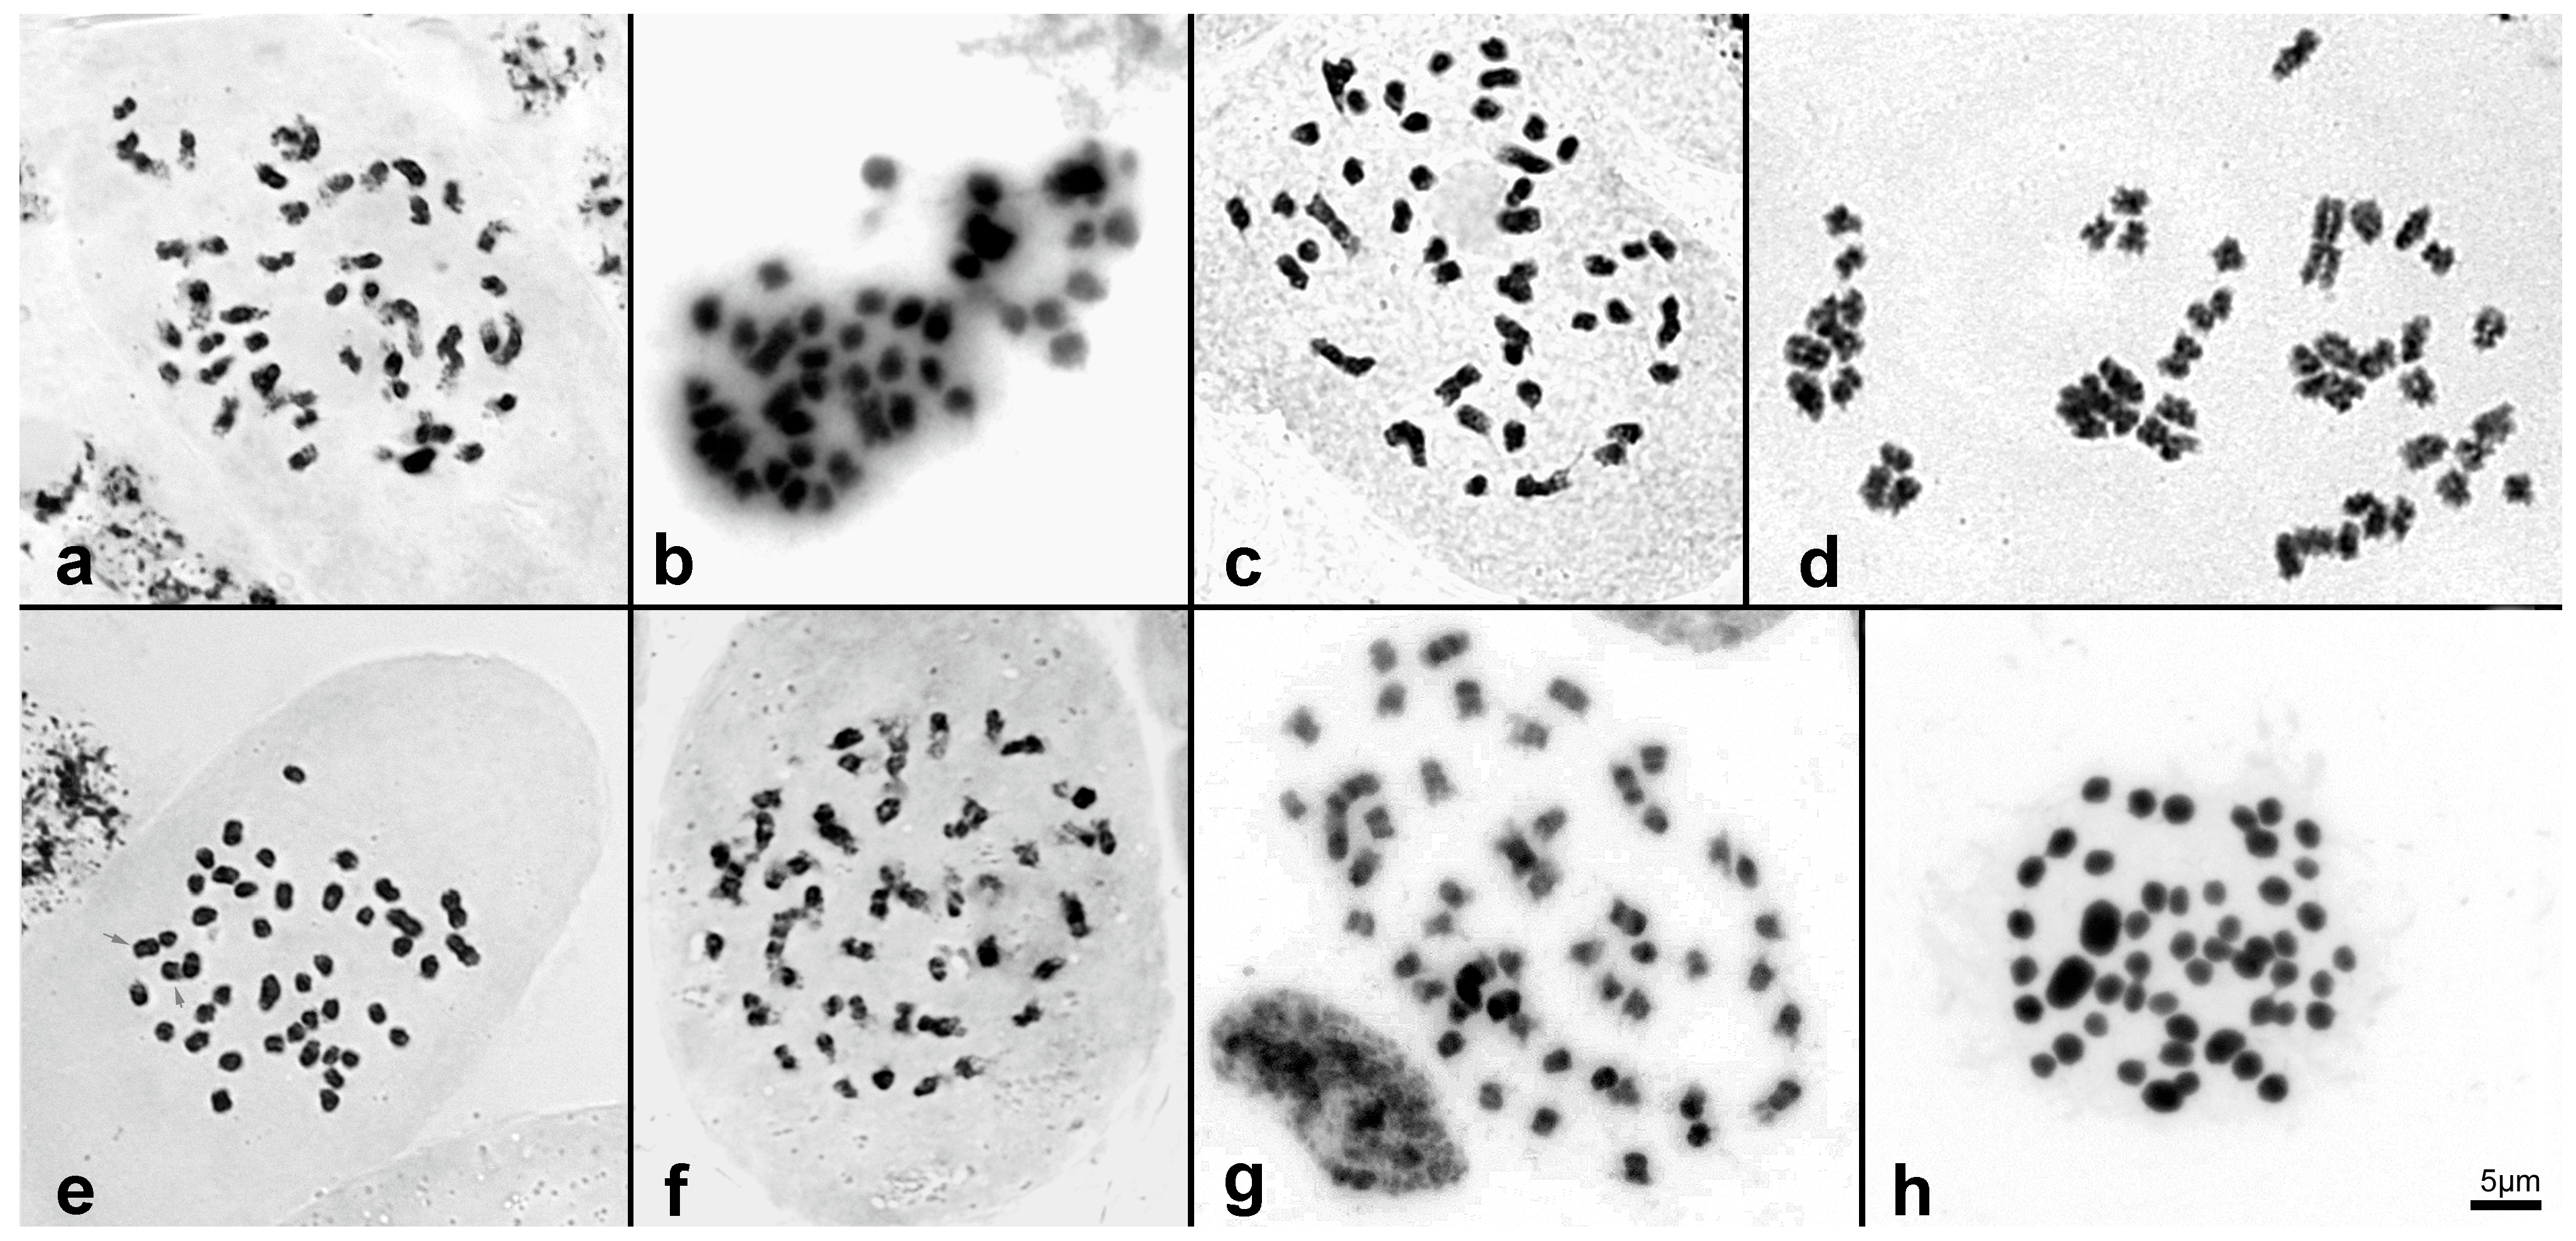
| 01 | B. altissima [2] | 46 | Figure 3a | 6.37 ± 0.075 | 6157 | 3.65 | intermediate |
| 02 | B. cattleya [1] | 42 | Figure 3b | 4.98 ± 0.014 | 4876 | 3.95 | intermediate |
| 03 | B. dichotoma [1] | 46 | Figure 3c | 4.88 ± 0.005 | 4773 | 3.81 | intermediate |
| 04 | B. flava [2] | 46 | Figure 3d | 4.97 ± 0.028 | 4854 | 4.14 | intermediate |
| 05 | B. hirtzii [2] | 44 | Figure 3e | 4.69 ± 0.011 | 4582 | 3.76 | intermediate |
| 06 | B. portillae [3] | 48 | Figure 3f | 3.30 ± 0.016 | 3228 | 4.75 | small |
| Elleanthus | |||||||
| 07 | E. brasiliensis [3] | 50 | Figure 3g/FG10 [8] | 4.79 ± 0.075 | 4687 | 2.84 | intermediate |
| 08 | E. crinipes [3] | 50 | Figure 3h | 2.04 ± 0.078 | 1995 | 3.11 | small |
| Sobralia | |||||||
| Sect. Sobralia | |||||||
| 09 | S. atropubescens [1] | - | - | 4.19 ± 0.010 | 4098 | 5.08 | intermediate |
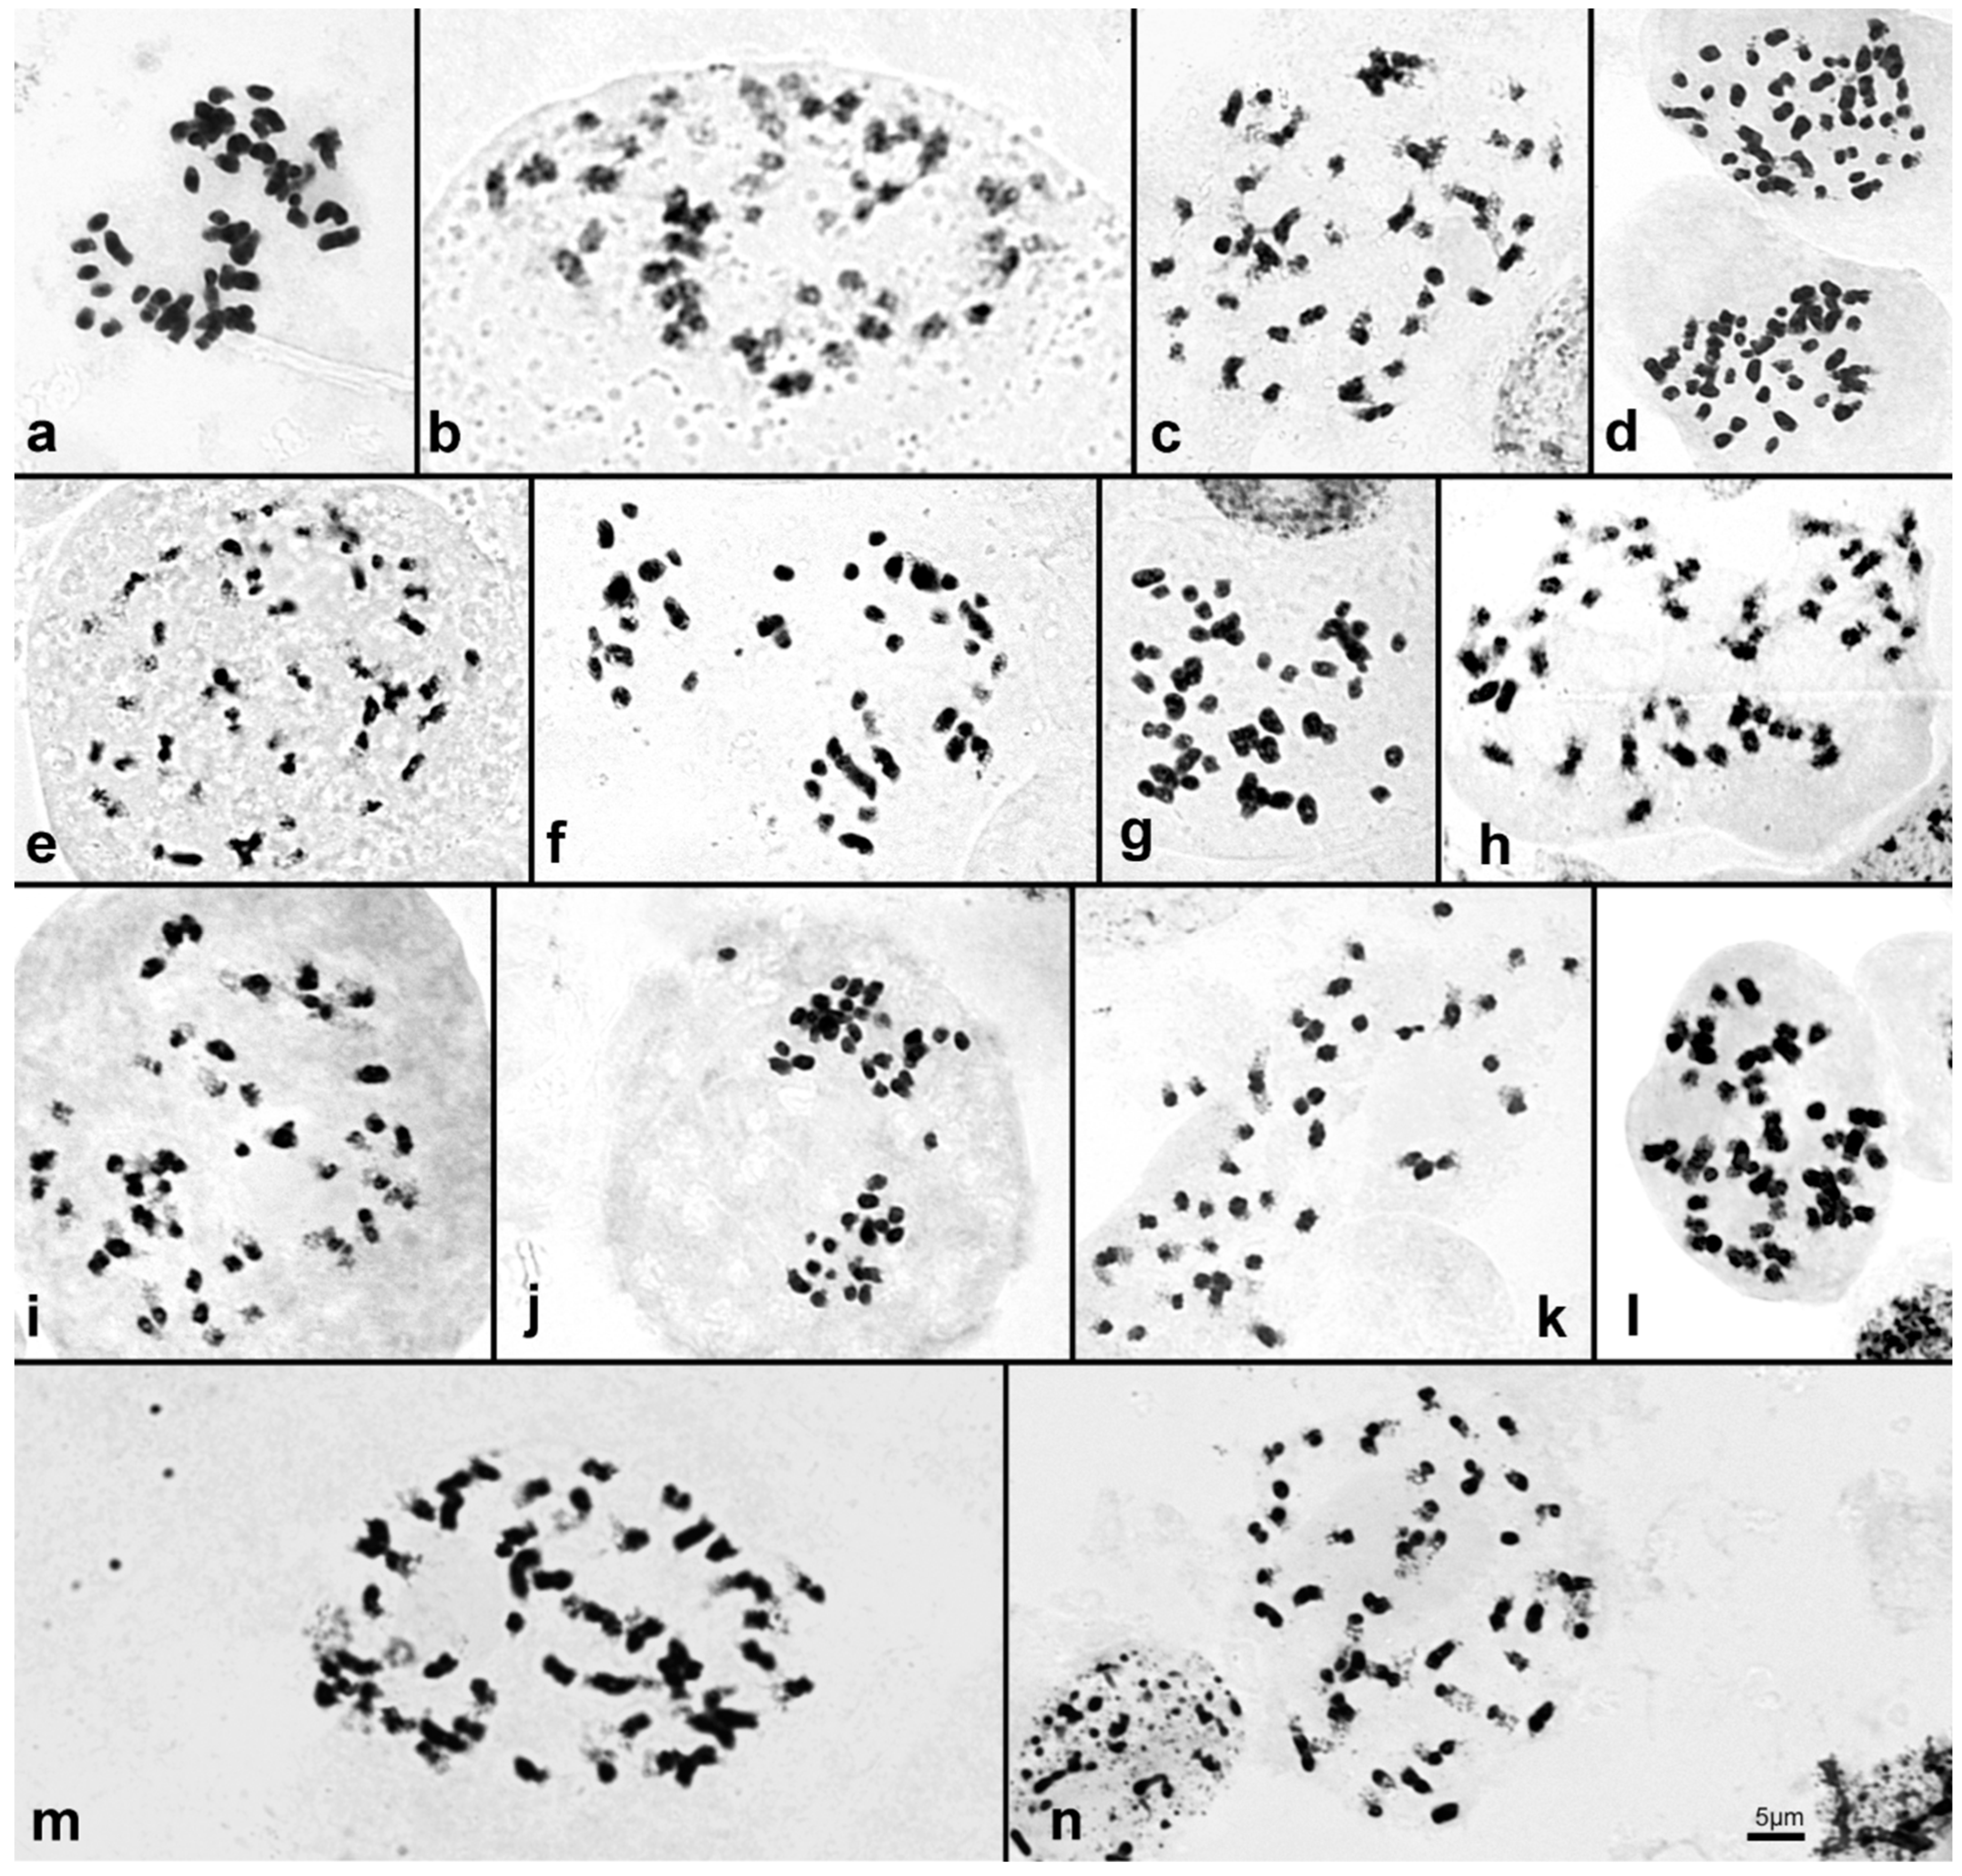
| 10 | S. bimaculata | 44 | Figure 3a | - | - | - | - |
| 11 | S. decora | 42, 44 | Figure 3b,c | - | - | - | - |
| 12 | S. fimbriata [1] | 46 | Figure 3d | 4.50 ± 0.019 | 4401 | 4.37 | intermediate |
| 13 | S. liliastrum | 48 | FG10 [8] | - | - | - | - |
| 14 | S. macrantha [2] | 48 | Figure 3e | 6.24 ± 0.121 | 6108 | 4.15 | intermediate |
| 15 | S. powelli [2] | 44 | Figure 3f | 4.34 ± 0.085 | 4248 | 4.45 | intermediate |
| 16 | S. sessilis [1] | 48 | FG10 [8] | 4.45 ± 0.095 | 4347 | 4.47 | intermediate |
| 17 | S. vallecaucana | 48 | Figure 3g | - | - | - | - |
| 18 | S. wilsoniana [2] | 48 | Figure 3h | 4.25 ± 0.025 | 4163 | 4.95 | intermediate |
| 19 | S. yauaperyensis [1] | 46 | Figure 4i | 3.97 ± 0.012 | 3878 | 4.52 | intermediate |
| Sect. Intermediae | |||||||
| 20 | S. crocea [2] | 44 | Figure 4j | 3.77 ± 0.005 | 3695 | 5.00 | intermediate |
| 21 | S. fragrans [1] | 42 | Figure 4k | 3.43 ± 0.025 | 3355 | 4.52 | small |
| Sect. Racemosae | |||||||
| 22 | S. gloriosa | 48 | Figure 4l | - | - | - | - |
| 23 | S. luerorum [2] | 48 | Figure 4m | 8.05 ± 0.103 | 7872 | 4.14 | intermediate |
| 24 | S. rosea [1] | 48 | Figure 4n | 5.93 ± 0.006 | 5800 | 3.48 | intermediate |
| Complex undatocarinata | |||||||
| 25 | S. undatocarinata [1] | - | - | 4.17 ± 0.013 | 4074 | 4.45 | intermediate |
| MODELS | Maximum Likelihood | Bayesian Inference | ||
|---|---|---|---|---|
| Log-Likelihood | AIC | Log-Likelihood | AIC | |
| Constante Rate | −51.76 | 109.5 * | −47.99 | 102 * |
| Constante Rate with demi-polyploid | −51.76 | 109.5 * | −47.99 | 102 * |
| Constante Rate with demi-polyploidy est | −51.76 | 111.5 | −47.99 | 104 |
| Constante Rate without polyploid (null model) | −51.76 | 107.5 | −47.99 | 99.99 |
| Linear rate | −50.92 | 111.8 | −47.71 | 105.4 |
| Linear rate with demi-polyploid | −50.92 | 111.8 | −47.71 | 105.4 |
| Linear rate with demi-polyploid est | −50.92 | 113.8 | −47.69 | 107.4 |
| Linear rate without polyploid (null model) | −50.92 | 109.8 | −47.71 | 103.4 |
| Index/Phylogenetic Reconstruction | Chromosome Number | Genome Size | ||
|---|---|---|---|---|
| Maximum Likelihood | Bayesian Inference | Maximum Likelihood | Bayesian Inference | |
| Pagel’s λ | 0.891 (p = 0.0003) | 0.885 (p = 0.0002) | 0.9875 (p = 4.83 × 10⁻⁷) | 0.9897 (p = 3.53 × 10⁻⁷) |
| Blomberg’s K | 0.276 (p = 0.003) | 0.523 (p = 0.001) | 1.00 (p = 0.001) | 2.20 (p = 0.001) |
Publisher’s Note: MDPI stays neutral with regard to jurisdictional claims in published maps and institutional affiliations. |
© 2022 by the authors. Licensee MDPI, Basel, Switzerland. This article is an open access article distributed under the terms and conditions of the Creative Commons Attribution (CC BY) license (https://creativecommons.org/licenses/by/4.0/).
Share and Cite
Baranow, P.; Rojek, J.; Dudek, M.; Szlachetko, D.; Bohdanowicz, J.; Kapusta, M.; Jedrzejczyk, I.; Rewers, M.; Moraes, A.P. Chromosome Number and Genome Size Evolution in Brasolia and Sobralia (Sobralieae, Orchidaceae). Int. J. Mol. Sci. 2022, 23, 3948. https://doi.org/10.3390/ijms23073948
Baranow P, Rojek J, Dudek M, Szlachetko D, Bohdanowicz J, Kapusta M, Jedrzejczyk I, Rewers M, Moraes AP. Chromosome Number and Genome Size Evolution in Brasolia and Sobralia (Sobralieae, Orchidaceae). International Journal of Molecular Sciences. 2022; 23(7):3948. https://doi.org/10.3390/ijms23073948
Chicago/Turabian StyleBaranow, Przemysław, Joanna Rojek, Magdalena Dudek, Dariusz Szlachetko, Jerzy Bohdanowicz, Małgorzata Kapusta, Iwona Jedrzejczyk, Monika Rewers, and Ana Paula Moraes. 2022. "Chromosome Number and Genome Size Evolution in Brasolia and Sobralia (Sobralieae, Orchidaceae)" International Journal of Molecular Sciences 23, no. 7: 3948. https://doi.org/10.3390/ijms23073948