Article

Evidence That DDR1 Promotes Oligodendrocyte Differentiation during Development and Myelin Repair after Injury

1
Zhejiang Key Laboratory of Organ Development and Regeneration, College of Life and Environmental Sciences, Hangzhou Normal University, Hangzhou 311121, China
2
Hangzhou Institute of Medicine (HIM), Chinese Academy of Sciences, Hangzhou 310022, China
*
Author to whom correspondence should be addressed.
Int. J. Mol. Sci. 2023, 24(12), 10318; https://doi.org/10.3390/ijms241210318
Submission received: 12 May 2023 / Revised: 16 June 2023 / Accepted: 17 June 2023 / Published: 19 June 2023
(This article belongs to the Section Molecular Biology)

Abstract

:
Oligodendrocytes generate myelin sheaths vital for the formation, health, and function of the central nervous system. Mounting evidence suggests that receptor tyrosine kinases (RTKs) are crucial for oligodendrocyte differentiation and myelination in the CNS. It was recently reported that discoidin domain receptor 1 (Ddr1), a collagen-activated RTK, is expressed in oligodendrocyte lineage. However, its specific expression stage and functional role in oligodendrocyte development in the CNS remain to be determined. In this study, we report that Ddr1 is selectively upregulated in newly differentiated oligodendrocytes in the early postnatal CNS and regulates oligodendrocyte differentiation and myelination. Ddr1 knock-out mice of both sexes displayed compromised axonal myelination and apparent motor dysfunction. Ddr1 deficiency alerted the ERK pathway, but not the AKT pathway in the CNS. In addition, Ddr1 function is important for myelin repair after lysolecithin-induced demyelination. Taken together, the current study described, for the first time, the role of Ddr1 in myelin development and repair in the CNS, providing a novel molecule target for the treatment of demyelinating diseases.

1. Introduction

In the central nervous system (CNS), myelin sheaths, the major component of the white matter, are elaborated by mature oligodendrocytes (OLs). Myelin plays a crucial role in the rapid and precise conduction of action potentials [1,2,3,4]. Increasing evidence has demonstrated that abnormal myelin development contributes to the disease pathogenesis including Alzheimer’s disease, major depression, and schizophrenia [5,6,7].
The progression of OL lineage cells is controlled by both intrinsic mechanisms and environmental factors. Extracellular matrix (ECM) proteins play a critical role in the development and maintenance of the nervous system. A multitude of studies have revealed ECM molecules can regulate neuronal and glial migration, memory storage, myelination, blood−brain barrier formation and maintenance, synaptogenesis, and so on [8]. Collagens, the major components of the ECM in the environment surrounding neurons and glial cells, regulate oligodendrocyte differentiation and myelination [9,10,11]. Collagen IV, one of the most abundant types of collagens in the brain, binds to discoidin domain receptor 1 (Ddr1), a receptor tyrosine kinase (RTK) [12]. Previously, Ddr1 was shown to be enriched in the murine transcriptome of OL lineage cells and post-mortem samples of human cerebral cortex [13,14]. RNA in situ hybridization revealed that expression of Ddr1 follows the progression of myelination [15]. Based on these and other studies, Vilella et al. described that Ddr1 is highly expressed in cells of oligodendrocyte lineage [16]. However, the functional involvement of Ddr1 in oligodendrocyte development and myelinogenesis has not been investigated.
In this study, we report that Ddr1 is selectively upregulated in oligodendrocytes during differentiation and myelin formation stages. Functional studies with Ddr1 knock-out mice demonstrated that Ddr1 deficiency causes a developmental delay of oligodendrocyte differentiation in the CNS, resulting in a reduced number of myelinated axons. Moreover, we demonstrated that Ddr1 deficiency attenuates myelin regeneration after demyelinating injury.

2. Results

2.1. Ddr1 Is Selectively Up-Regulated in Newly Differentiated Oligodendrocytes

To characterize the stage specificity of Ddr1 expression in the CNS in detail, we investigated the expression of Ddr1 in the developing mouse brain. RNA in situ hybridization (ISH) revealed that Ddr1-positive cells started to emerge in the corpus callosum (CC) (black arrowheads) at around postnatal day 7 (P7) (Figure 1A–C), increased progressively (Figure 1D), peaked at around P15 and then declined gradually thereafter (Figure 1E,F). A similar expression pattern was detected in the developing spinal cords (Figure S1). The spatiotemporal pattern of Ddr1 expression suggests its selective up-regulation in newly differentiated oligodendrocytes (Figure 1A–D and Figure S1A–F).
The selective expression of Ddr1 in differentiated OLs was further verified in the spinal cords of Cnpcre/+;Nkx2.2fl/fl mice [17,18]. As previously reported, Cnpcre/+;Nkx2.2fl/fl conditional mutant mice delayed the differentiation of oligodendrocyte precursor cells (OPCs) in the spinal cord [19]. Consistent with the idea that Ddr1 is expressed by differentiatiated OLs, the number of Ddr1+ cells was dramatically reduced in Nkx2.2 conditional knock-out mice as compared to in the control group (Figure S2).
The selective expression of Ddr1 in differentiated Ols was also validated by its co-expression with various well-established oligodendrocyte markers in P15 brain tissues. As shown in Figure 1G–I, the majority of Ddr1-positive cells were co-stained with MYRF, a transcription factor that is specifically transcribed in OL cells at the onset of differentiation [20]. Only a small percentage of Ddr1+ cells were CC1+, but not ASPA+ mature oligodendrocytes in the corpus callosum [21,22,23] (Figure 1G–I). In addition, Ddr1+ cells did not co-express the astrocyte lineage marker GFAP, the microglial marker IBA1, as well as the neuronal marker NeuN in the corpus callosum at P15 (Figure 1J–L). Together, these data manifested that Ddr1 is transiently up-regulated in the newly differentiated OLs in early postnatal CNS, suggestive of its important role in OL maturation and myelination.

2.2. Ddr1 Mutation Results in a Transient Delay of OL Differentiation

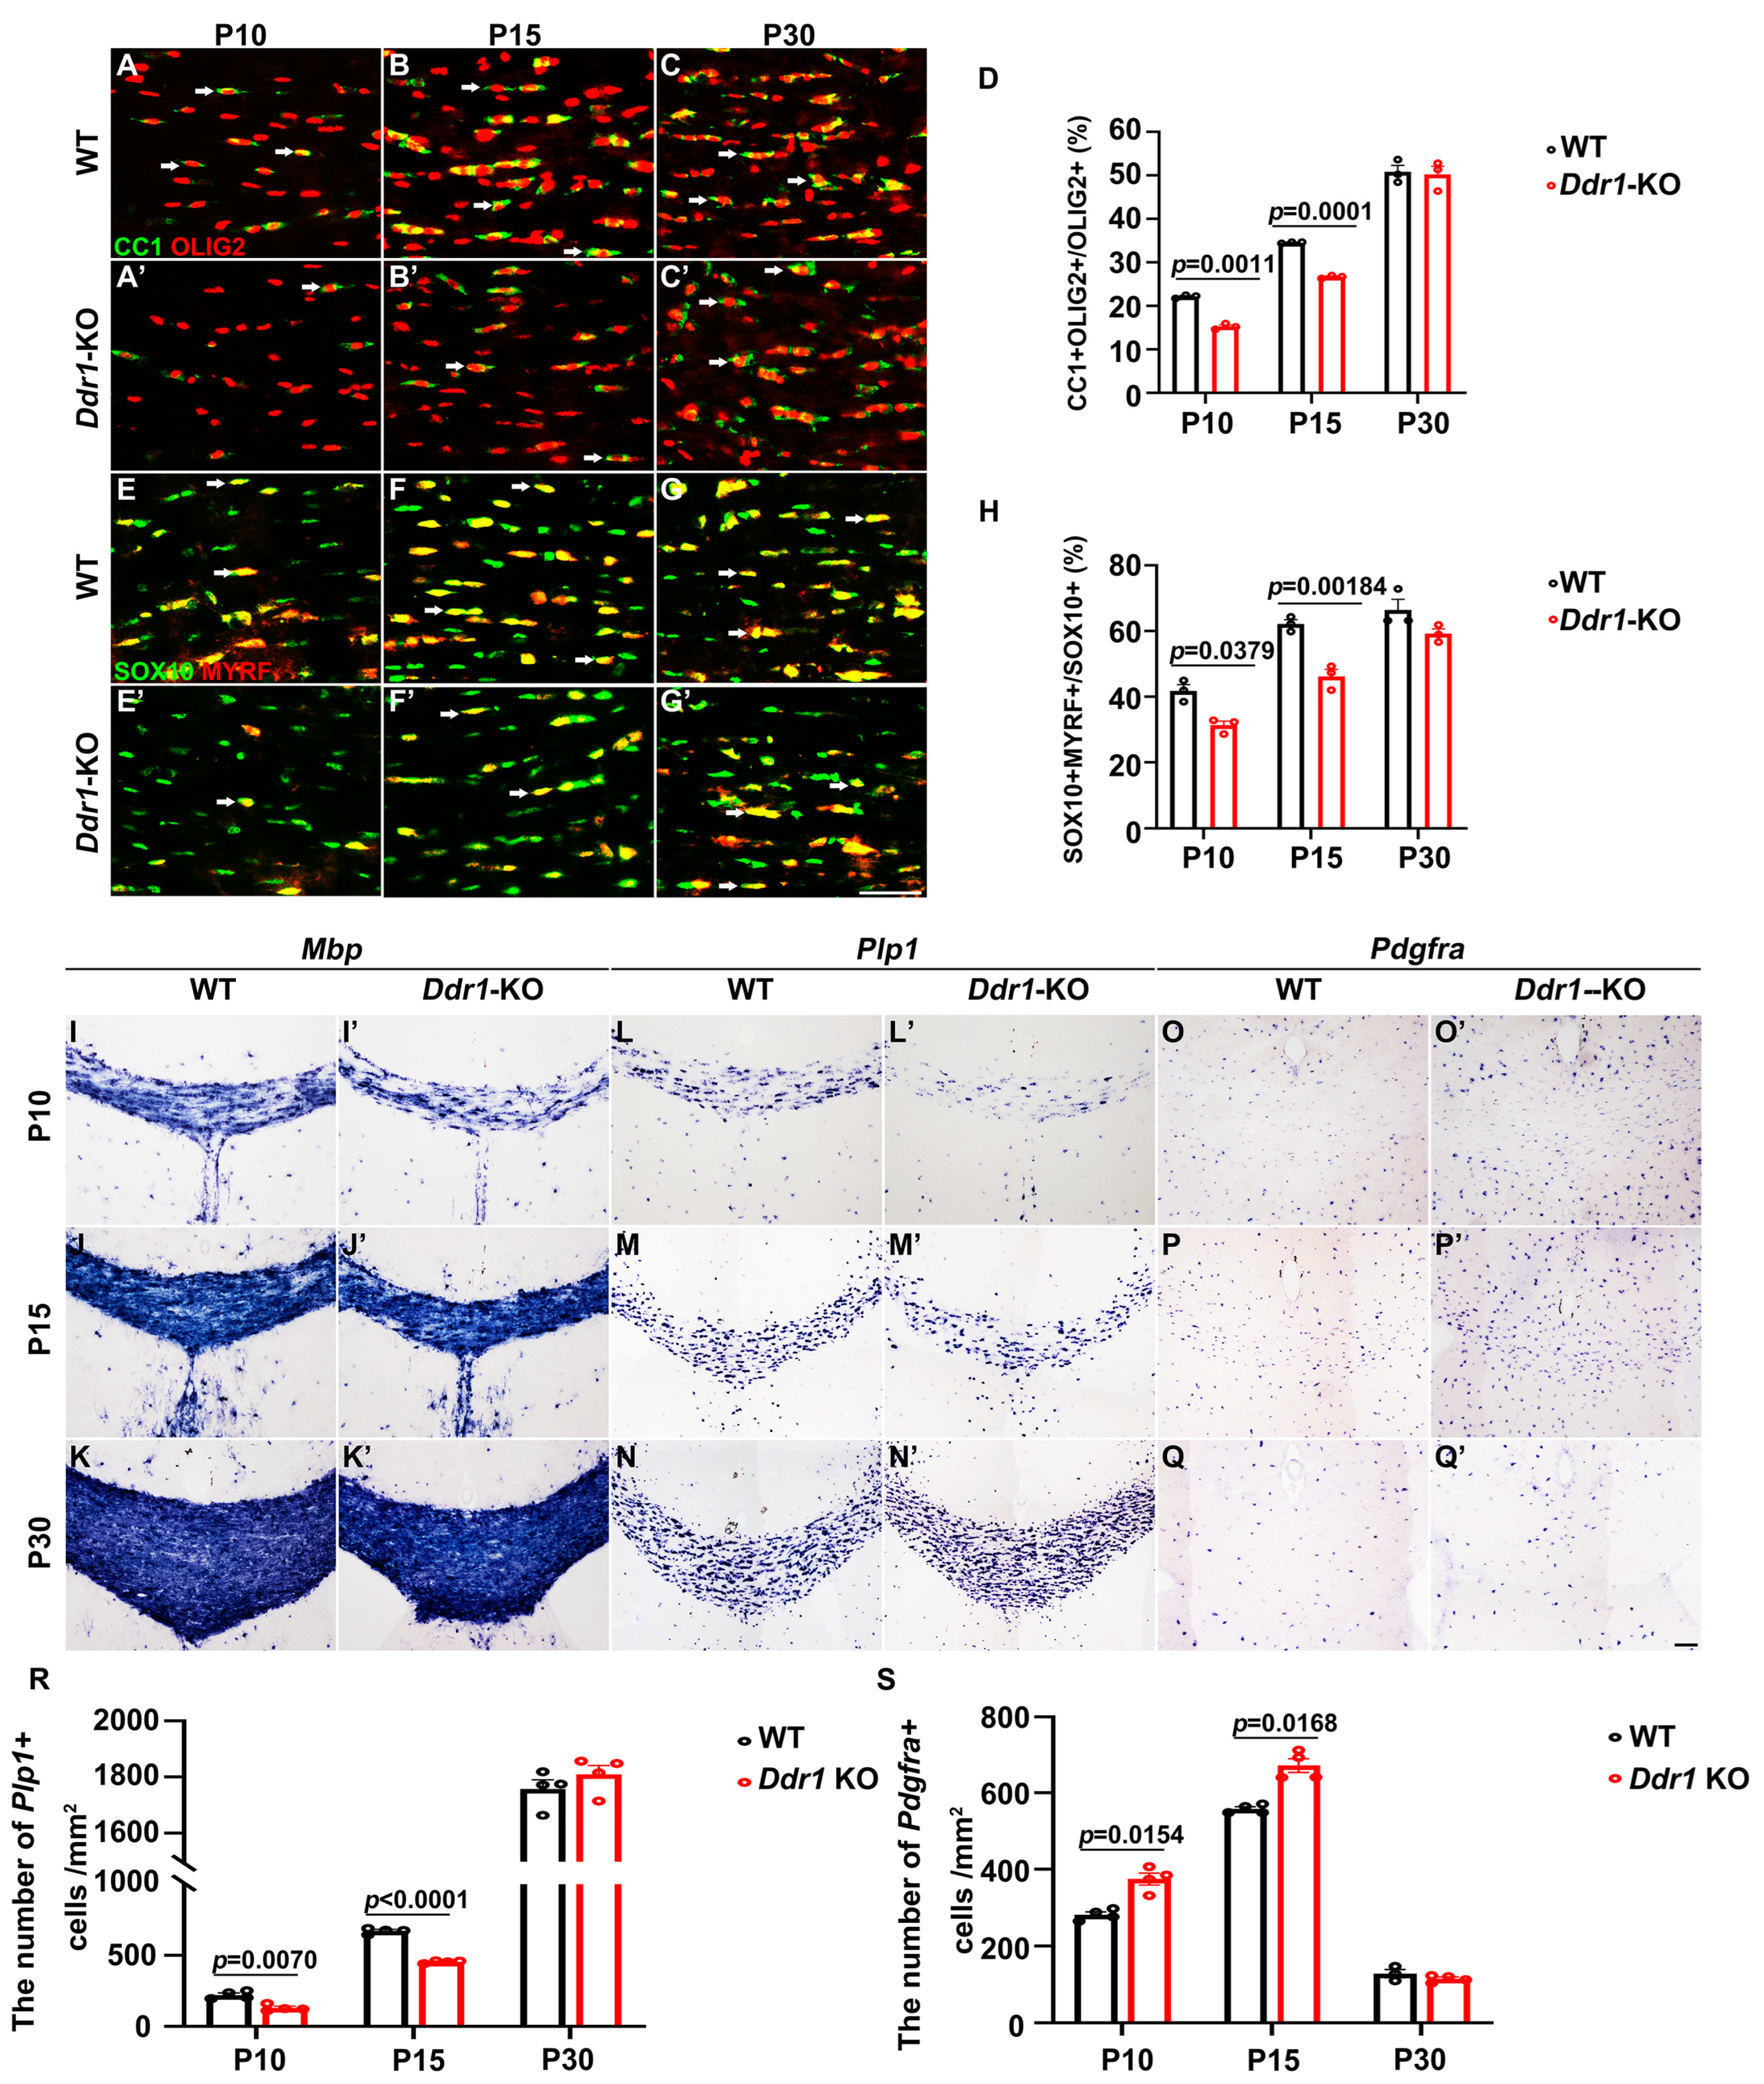
To elucidate the in vivo function of Ddr1 in OL differentiation and myelination, we examined the expression of several well-documented molecular markers for differentiated OLs in Ddr1 knock-out mice (Ddr1-KO). Double immunofluorescent staining revealed that the percentage of CC1+ cells in OLIG2+ OLs was significantly decreased in the corpus callosum from P10 to P15; however, a comparable percentage of CC1+ OLs was observed in the P30 corpus callosum (Figure 2A–D). Similar results were obtained for the expression of MYRF (Figure 2E–H). In parallel, Mbp and Plp1 expression levels in the corpus callosum by ISH were attenuated in Ddr1-KO at P10 and P15, but not at P30 (Figure 2I–N’,R). Consistently, the number of Pdgfrα+ OPCs increased markedly in the mutants at P10 and P15, but no significant difference was observed at P30 (Figure 2O–Q’,S). Together, these results demonstrated that loss of Ddr1 expression significantly delayed OL differentiation and myelin genes expression in the developing central nervous system.

2.3. Deficiency of Ddr1 in OL Impairs Axonal Myelination in the CNS

The early effects of Ddr1 mutation on OL differentiation and myelin genes expression in the CNS have suggested its important role in myelination. To investigate this possibility, we examined the development of myelin tracts by Black Gold II staining, which revealed a thinner corpus callosum in the mutants (Figure 3). Moreover, the density of white matter fiber tracts in the Ddr1-KO corpus callosum was clearly reduced at P15 (Figure 3B,B’).
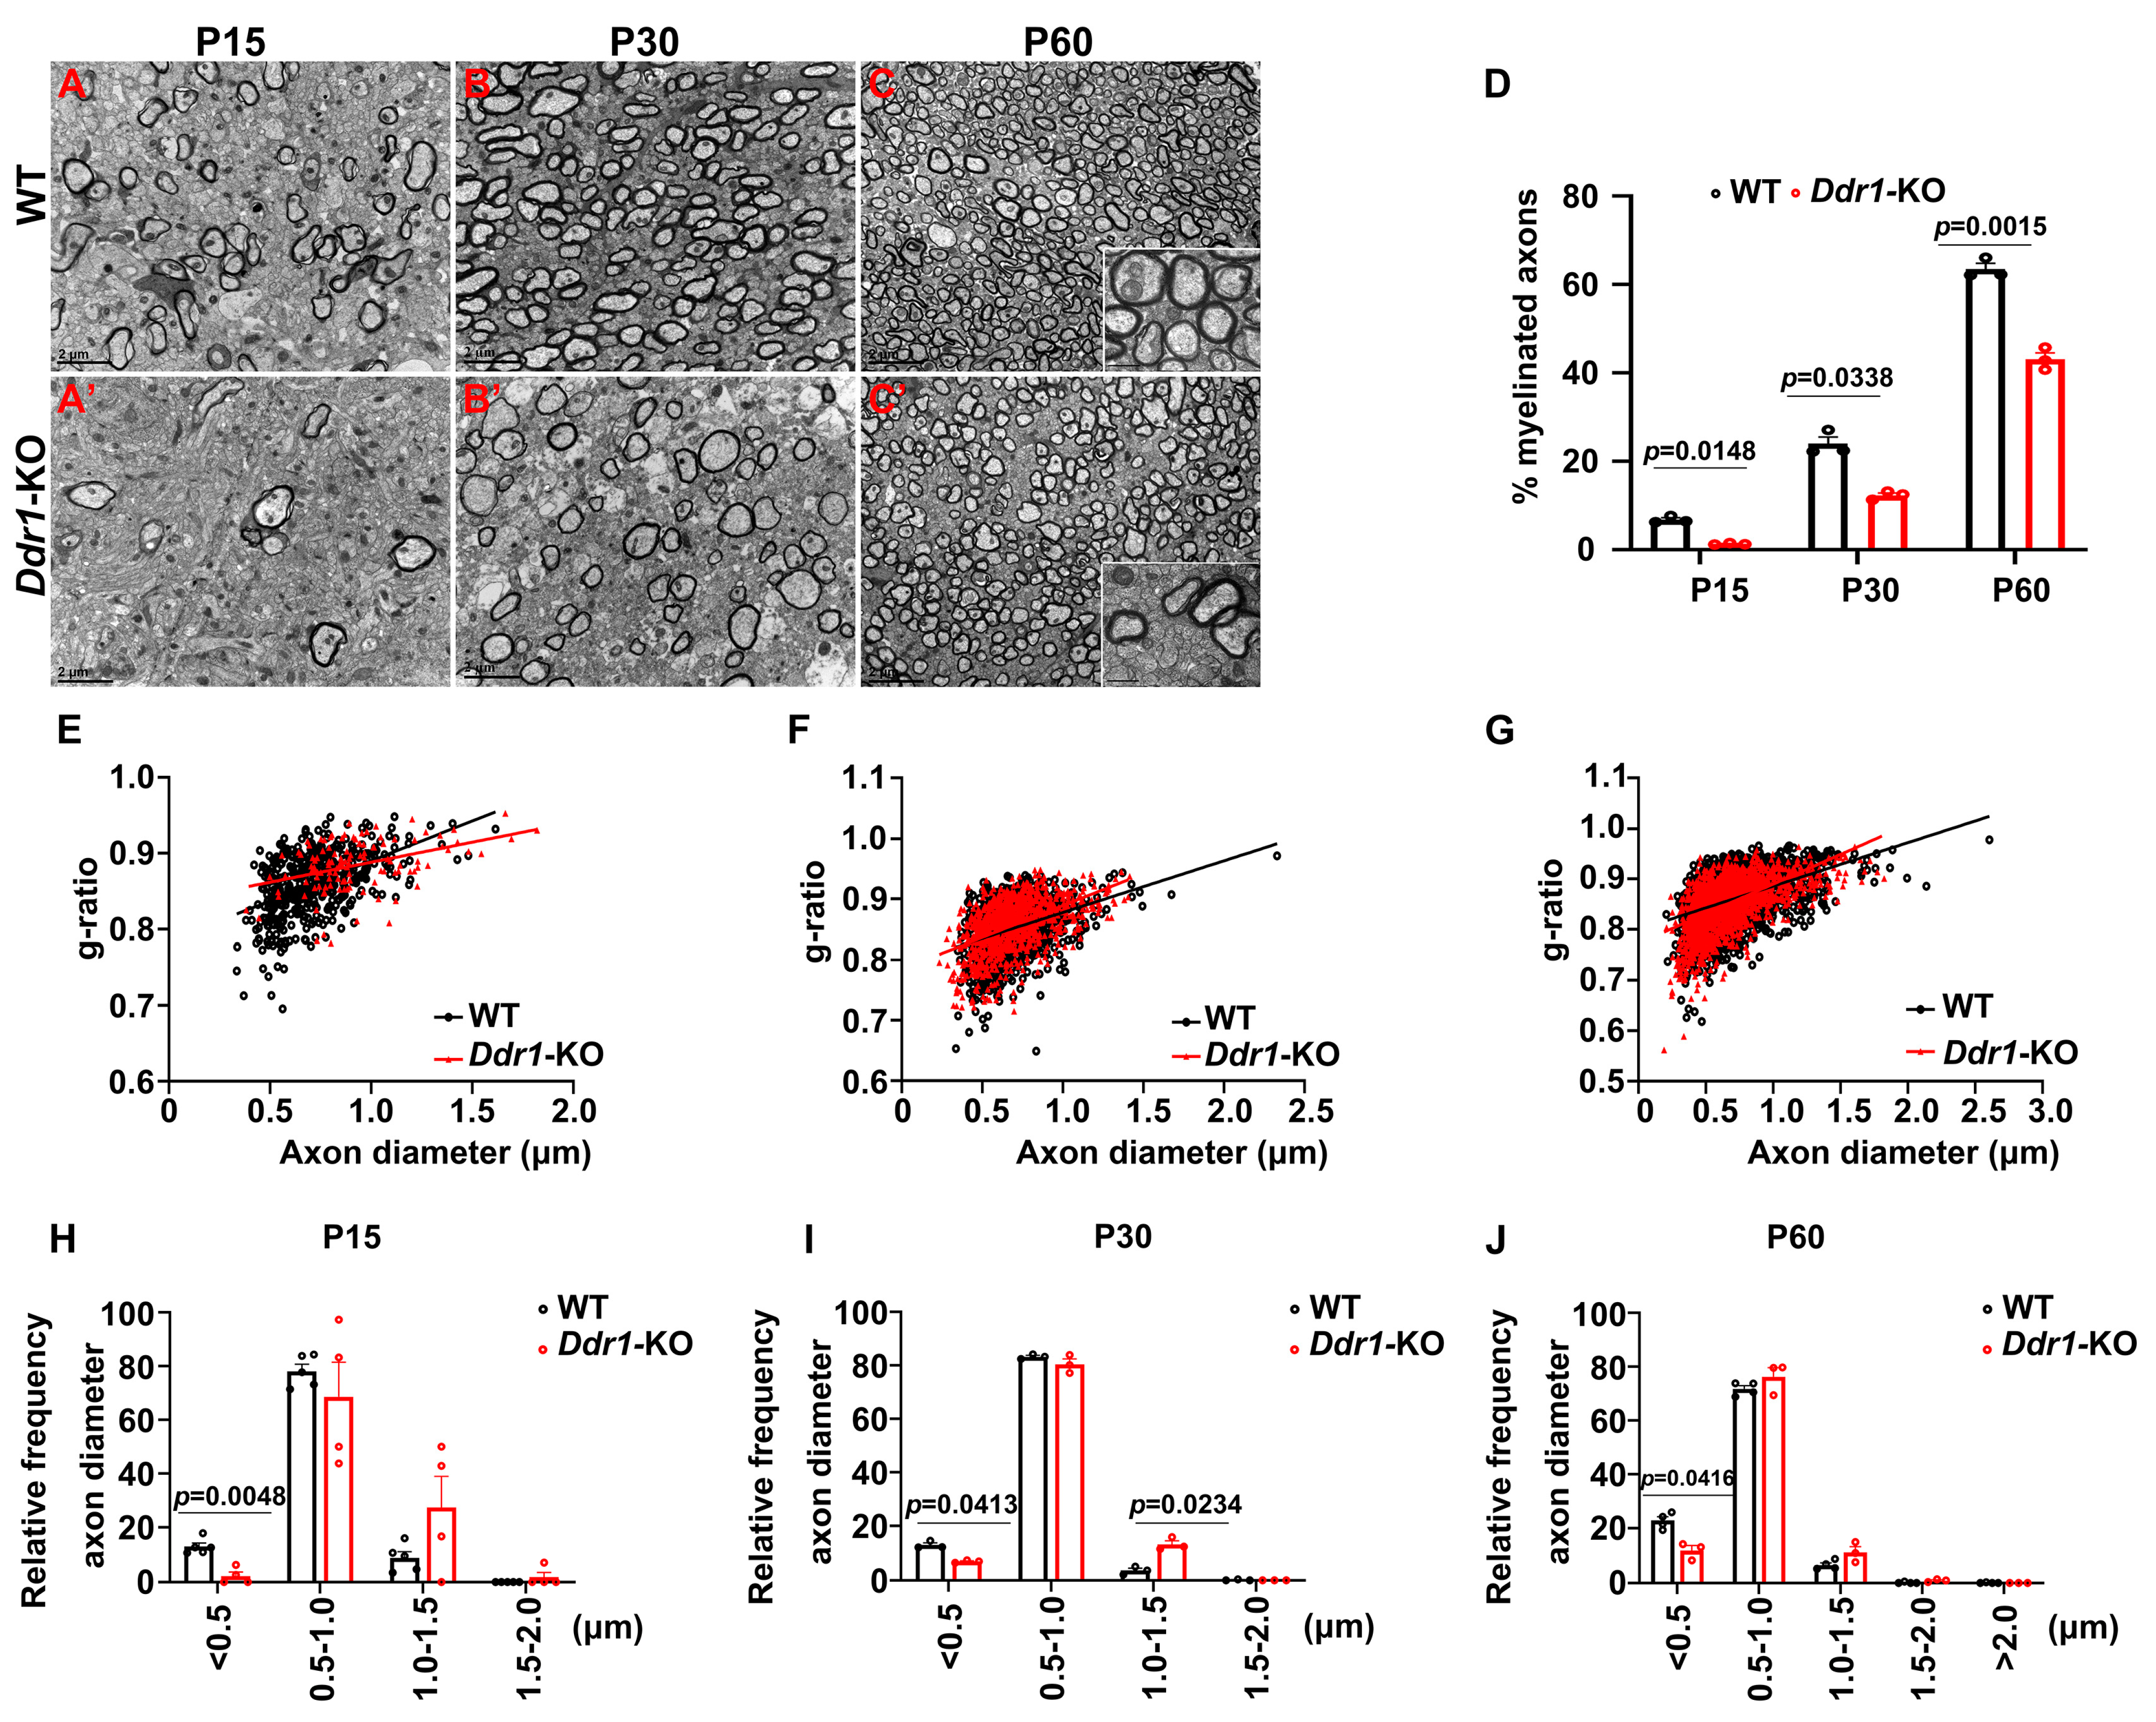
Previous studies demonstrated that the callosal thickness is influenced by varying degrees of axonal myelination, redirection, and pruning [24]. Therefore, we next investigated axonal myelination by TEM in control and Ddr1 mutants at different developmental stages. It was found that the percentage of myelinated axons in Ddr1-KO mice was significantly reduced at P15 and P30 (Figure 4A–B’,D). The proportion of small-diameter axons (<0.5 μm) was smaller in Ddr1-KO mice (Figure 4H,I). Meanwhile, the myelin thickness was thinner in Ddr1-KO littermates, as indicated by the larger average g-ratios of myelin sheaths (Figure 4E,F). Moreover, the reduced percentage of myelinated axons and thinner myelin sheaths were also observed in the two-month-old adult mutant mice (Figure 4C–C’,D,G). At this stage, the proportion of small-diameter axons increased in knock-out mice, while the number of large-diameter axons decreased (Figure 4J). Based on these observations, we concluded that ablation of Ddr1 impairs axonal myelination in the CNS, leading to changes in callosal thickness.

2.4. Ablation Ddr1 Leads to an Abnormal Motor Function

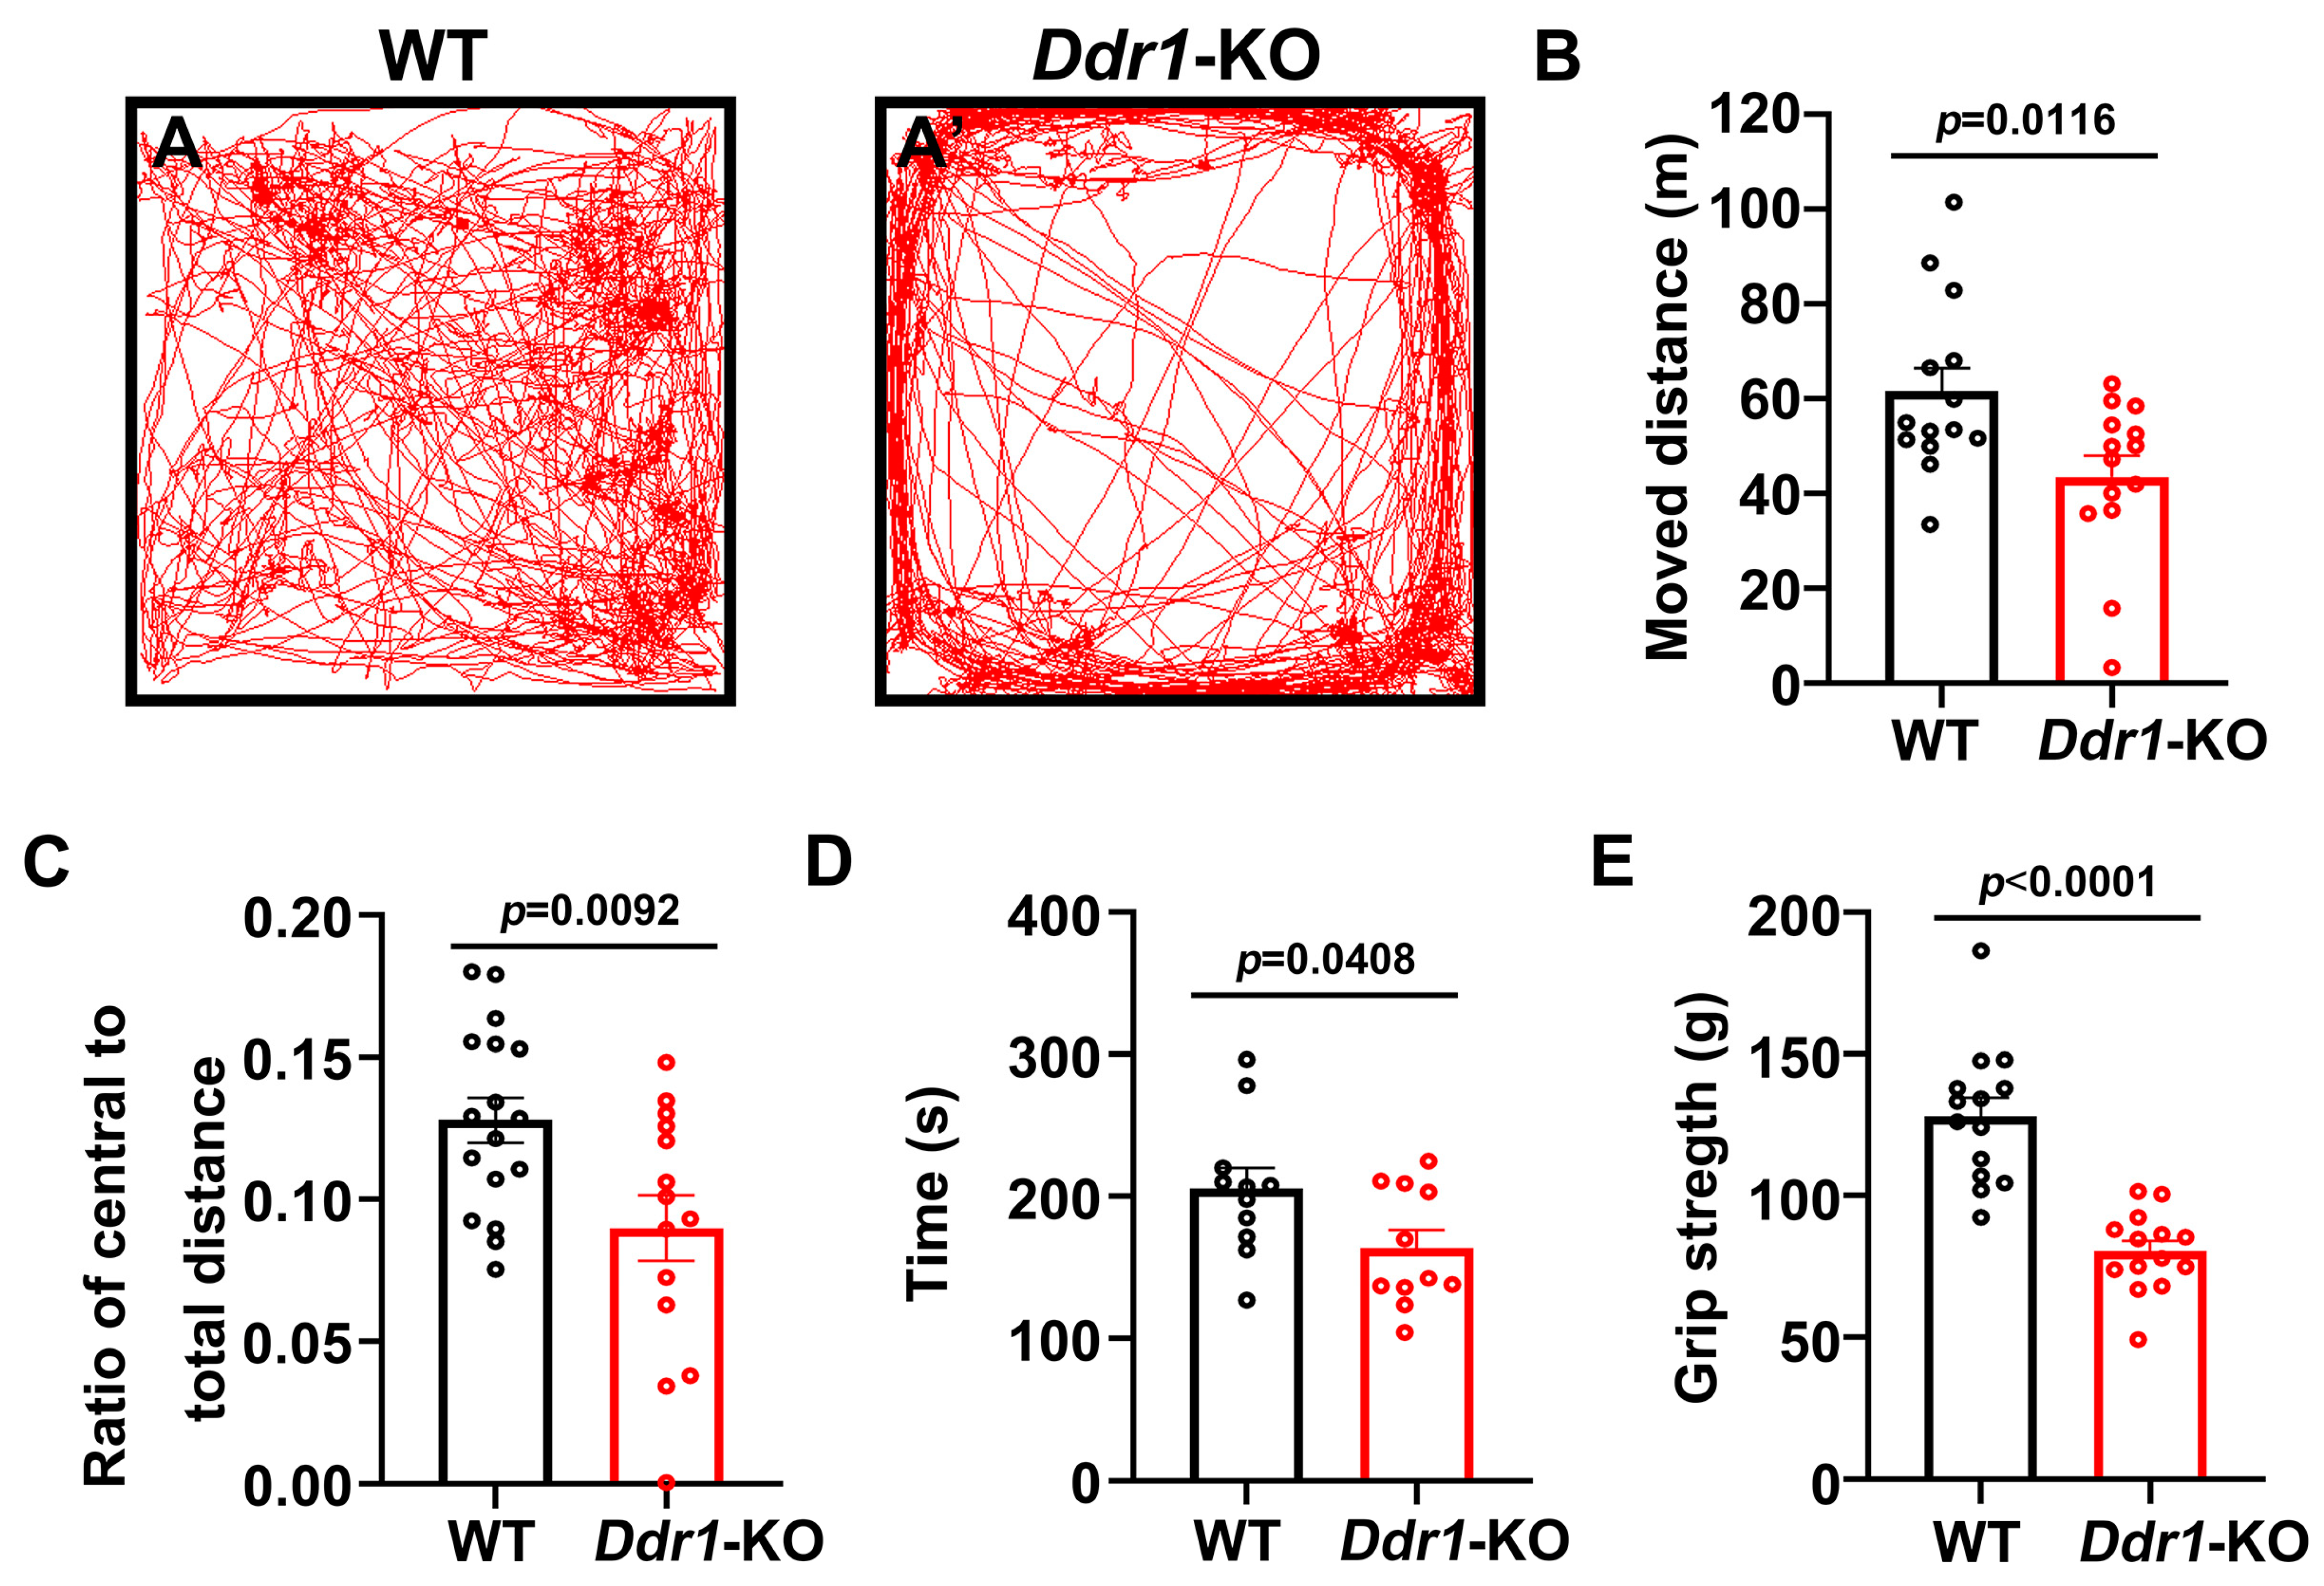
Myelination in the central nervous system is critical for regulating motor functions [25,26]. We next tested whether a de novo myelin deficit could cause maladaptive behaviors in young adult mice. First, we chose the open field test, a non-conditioned procedure commonly used for assessing locomotor activity in rodents (Figure 5A,A’). In this test, Ddr1-KO mice were hypoactive, and the total distance traveled during a 30-minute test was markedly decreased (Figure 5B). In addition, young adult Ddr1-KO mice showed a lower ratio of the travel distance within the central area to the total travel distance than wild-type controls (Figure 5C). To further analyze the motor coordination capabilities of mutants, rotarod testing was performed. Noticeably, Ddr1-KO mice showed apparently shorter latency to fall than wild-type mice (Figure 5D). The significant decline in the ability to sustain movement on a rotating rod indicated a lack of motor coordination in Ddr1-KO mice. Finally, we used the grip strength to measure the forelimb peak force in mutant and control mice, and we found that Ddr1 mutation caused a significant decrease in grip strength (Figure 5E). Collectively, these behavior tests indicated that deletion of the Ddr1 gene leads to the motor dysfunction.

2.5. Ddr1 Is Critical for Remyelination in the CNS

As Ddr1 deletion has a significant impact on oligodendrocyte differentiation and early myelinogenesis, we next investigated the function of Ddr1 in axonal remyelination following demyelinating injury. Axonal demyelination was induced in the mice by injecting lysolecithin (LPC) into the corpus callosum at P60 (Figure 6A). The mice were analyzed at 7, 14, and 21 days post-injection (dpi), corresponding to the stages of OPC recruitment, differentiation, and remyelination, respectively (Figure 6B). Axonal demyelination was confirmed by the marked reduction of myelin basic protein (MBP) staining in the corpus callosa of both wild-type and Ddr1-KO mice at 7 dpi (Figure 6C,C’). Interestingly, the density of differentiated CC1+ OLs in the lesion sites markedly decreased in the Ddr1-KO mice than in the wild-type mice, suggesting the reduced formation of new mature OLs in the demyelinating tissues (Figure 6F–F’,I). Remyelination was severely hampered in Ddr1 mutants, as evidenced by apparent reduction of MBP and CC1 expression in lesions at both 14 dpi and 21 dpi (Figure 6D–E’,G–H’,I). Together, these results indicated that ablation of Ddr1 inhibits myelin repair in demyelinated lesions induced by LPC.

2.6. Ddr1 Might Enhance the Differentiation of Oligodendrocytes by Restraining ERK Signaling

ERK is a crucial signaling molecule for OL differentiation and axonal myelination [27,28]. Ddr1 has been reported to affect intracellular signaling through the AKT and ERK pathways in prostate cancer cells [29,30]. We therefore assessed whether Ddr1 influences ERK and AKT protein phosphorylation in the CNS and therefore OL differentiation and myelination. The Western blot analysis showed that the ratio of phosphorylated ERK to total ERK was dramatically increased in the brainstem of Ddr1-KO mice at P10 and P15, while the level of MBP was significantly reduced (Figure 7A–C,E). Nevertheless, the downstream AKT in the brainstem was not altered (Figure 7A,D,F). These results suggest that Ddr1 may enhance OL differentiation and myelination by attenuating the MAPK/ERK signaling pathway.

3. Discussion

The identification of factors regulating myelination is critical to the development of therapeutic treatment of axonal hypomyelination and demyelination of the CNS. Axonal myelination is a highly complex process that requires coordination of multiple pathways such as Sonic hedgehog, receptor tyrosine kinases (RTKs), or Wnt/β-catenin [31,32,33,34,35]. Although Ddr1 was shown to be enriched in oligodendroglia, little was known about its in vivo role in oligodendrocyte development. In this study, for the first time, we provided the genetic and molecular evidence that Ddr1 regulates the tempo of OL differentiation and myelination and influences the motor function of animals.
It was previously reported that DDR1 is detected in the soma of OLs in human CNS [14]. In the present study, we determined that Ddr1 is predominantly expressed in the newly differential OLs in the early postnatal CNS when oligodendrocytes undergo active differentiation and myelination in mice (Figure 1 and Figure S1). The strong expression of Ddr1 in differentiated OLs appeared to be important for regulating OL differentiation and myelin formation. In support of this idea, Ddr1 deficiency led to a transient developmental delay of OL differentiation and myelin genes expression (Figure 2). Unexpectedly, the callosal thickness became thinner in the mutants (Figure 3), possibly due to the delayed OL differentiation and a reduced degree of axonal myelination in the mutants. TEM analyses revealed fewer myelinated axons and a reduced number of small-diameter (<0.5 μm) myelinated axons (Figure 4). Since myelin is key to axonal signal transduction and related motor function in the CNS [36,37], Ddr1-deficient mice indeed displayed motor dysfunction (Figure 5). Interestingly, in the open field test, the mice not only reduced their total travelled distance, but also avoided the center of the field (Figure 5), which is also associated with thigmotaxis or anxiety-related behaviors in rodents. Considering that Ddr1 mutation resulted in a transient delay of OL differentiation (Figure 2) and impairment oligodendroglia maturation affects glutamatergic neuron function consequently causing anxiety-related behaviors in mice [38], it remains plausible that deficiency of Ddr1 in OLs can also lead to anxiety-like behaviors. Although we have demonstrated that Ddr1 was not expressed in NeuN+ neurons (Figure 1), generation of conditional mutants is necessary for dissecting out the cell-autonomous function of Ddr1 in OL development and myelination in the future.
Previous work suggested that Ddr1 is upregulated in remyelinating oligodendrocytes [39], but its role in the remyelination process was not defined. In this study, we examined the function of Ddr1 in the LPC-induced demyelination and found that the proportion of mature oligodendrocytes (MBP+/CC1+) was significantly decreased in the lesions of Ddr1-KO mice. These results showed that ablation of Ddr1 significantly aggravated the demyelination injury and inhibited axonal remyelination in vivo (Figure 6).
ERK is a key component of the RAS/RAF/MEK/ERK signaling pathway that regulates cell proliferation and differentiation. The complete picture of how the ERK proteins regulate myelination is still unclear, and conflict results have been reported. A number of studies demonstrated increased levels of ERK1/2 activity in mature OLs induced by growth factors, which decrease myelin protein levels and inhibit the OL differentiation [40,41,42], and inhibition of ERK1/2 signaling dramatically promotes OPC differentiation and OL maturation [27]. Conversely, other studies have reported that activation of ERK1/2 significantly increases myelination [43,44]. One possible explanation for the difference between these conflict results might be the different developmental stages of OLs studied. In our study, we demonstrated that Ddr1 was selectively up-regulated in newly differentiated OLs (Figure 1 and Figure S2), and Ddr1 was required to suppress ERK signaling for OL differentiation (Figure 7). A more recently identified negative regulators of oligodendrocyte differentiation is the MAPK/ERK pathway [27,45,46,47]. It was previously demonstrated that Ddr1 could modulate the activity of the AKT/ERK pathway and plays an important role in the migration and adhesion of cancer cells [30,48,49]. The Western blot analysis confirmed that inhibition of Ddr1 upregulates the ratio of p-ERK to total ERK without altering the AKT signaling pathway (Figure 7). Therefore, we proposed that Ddr1 deletion leads to the abnormal CNS myelin malfunctions and motor dysfunction possibly through an ERK-dependent mechanism. As Ddr1 exerts a positive effect on the remyelination process, it could be developed as a potential drug target for promoting myelin repair in neurodegenerative diseases.

4. Materials and Methods

4.1. Animals

Ddr1-KO mice were purchased from Lexicon Pharmaceuticals Incorporated (LEXKO-1928) and have been previously described [50,51,52]. The mice were housed in a regulated temperature environment (22 ± 1 °C) in a 12 h light/dark cycle, with ad libitum access to food and water. The general health status of the experimental mice was analyzed by daily observation. The mice were sacrificed under deep anesthesia induced by Avertin. Nkx2.2flox and Cnp-Cre mouse lines were described previously [17,53]. All animal experiments were conducted in mice of both genders except for behavior tests. In this study, all animal protocols followed ethical guidelines and were approved by the Laboratory Animal Center, Hangzhou Normal University, and the Animal Ethics Committee of Hangzhou Normal University, China (permit number: 2022-1063; approved on 3 March 2022).

4.2. In Situ RNA Hybridization (ISH)

Brain sections were collected consecutively from Bregma 1.1 mm to Bregma 1.34 mm of the mouse brains at various developmental stages. Tissues were fixed with 4% paraformaldehyde (PFA) in PBS (pH 7.4) at 4 °C overnight. Tissues were then cryoprotected in 30% sucrose, embedded in an optimal cutting temperature compound (OCT) medium and sectioned on a cryostat at 18 µm. The procedures for in situ hybridization (ISH) have been described previously [19]. The digoxin-labeled RNA probes used for ISH corresponded to nucleotides 1210-2178 of mouse Plp1 mRNA (NM_011123.4), nucleotides 1485-2453 of mouse Mbp mRNA (NM_010777.3), nucleotides 2870-3678 of mouse Ddr1 mRNA (NM_007584.3), and nucleotides 1613-2463 of mouse Pdgfrα mRNA (NM_01158.3).

4.3. Immunofluorescence Staining

Brain sections were collected consecutively from Bregma 1.1 mm to Bregma 1.34 mm of the mouse brains at the corresponding stages. Animals were fixed by transcardial perfusion with cold 4% PFA, after the animals were deeply anesthetized. Tissues were then isolated and post-fixed overnight, cryoprotected in 30% sucrose, embedded in a frozen section medium (6502; Thermo Scientific, Waltham, MA, USA) and sectioned into 16 µm on a cryostat. Experimental procedures for immunofluorescence were described previously [46,54]. Briefly, the sections were washed with PBS and then incubated in a citrate antigen retrieval solution (pH 6.0). The sections were then rinsed three times in PBS, blocked with 10% goat serum in PBS with 0.2% Triton-X-100 for 1 h and immediately incubated with primary antibodies in a blocking solution at 4 °C overnight. The sections were washed three times in PBS and incubated with secondary antibodies at room temperature for 2 h and then washed and mounted in Mowiol mounting medium (MMM) with 4′,6-diamidino-2-phenylindole (DAPI). Fluorescent images were collected by a Nikon epifluorescence microscope. The primary antibodies used were as follows: anti-OLIG2 (1:500, OB-PRB009, Oasis Biofarm, Hangzhou, China), anti-CC1 (1:200, OB-PGP027, Oasis Biofarm, Hangzhou, China), anti-ASPA (1:100, OB-PRB037,Oasis Biofarm, Hangzhou, China), anti-NeuN (1:500, OB-PRB039, Oasis Biofarm, Hangzhou, China), anti-SOX10 (1:500, OB-PGP001, Oasis Biofarm, Hangzhou, China), anti-MYRF (1:500, OB-PRB007, Oasis Biofarm, Hangzhou, China), anti-IBA1 (1:500, OB-PRB029, Oasis Biofarm, Hangzhou, China), anti-MBP (1:100, MAB382, Millipore, United States), and anti-GFAP (1:500, OB-PRB005, Oasis Biofarm, Hangzhou, China). The secondary antibodies used were Alexa Fluor 488/594-conjugated antibodies (Invitrogen, Carlsbad, CA, USA).

4.4. Transmission Electron Microscopy (TEM)

The brain sections were collected consecutively from Bregma 1.1 mm of the mouse brains from P15 to P60. Mice were perfused with a phosphate buffer solution containing 2.5% glutaraldehyde and 4% PFA. The corpus callosum tissues were isolated and post-fixed in 1% osmium tetroxide for 1 h. The tissues were then washed in a 0.1 M cacodylate buffer, dehydrated in graded ethanol and embedded in epoxy resins. Ultrathin sections (0.5 µm) were stained with toluidine blue and observed under a transmission electronic microscope.

4.5. Black Gold II Staining

The brain sections were collected consecutively from Bregma 1.1 mm to Bregma 1.34 mm of the P60 mouse brains or of the P15 and P30 mouse brains correspondingly. Brain tissues from P15 to P60 were fixed in 4% PFA and cut at 50 μm on a freezing sliding microtome. In addition, experimental procedures for Black Gold II staining were described previously [55,56] Tissue sections were hydrated and incubated in a 0.3% Black Gold II solution (AG105, Millipore, Kenelworth, NJ, USA ) at 60 °C for 12 min. If myelin impregnation was not complete under the microscope, the sections were returned to the staining solution until the finest myelinated fibers turned to black. After be further washed in distilled water, the sections were fixed in 1% sodium thiosulfate for 3 min. The sections were then rinsed in water, dehydrated in alcohols and coverslipped with a mounting medium.

4.6. Induction of White Matter Demyelination

Lysolecithin (LPC, L1381; Sigma, St. Louis, MO, USA) was dissolved in PBS at a final concentration of 1% (g/ml). P60 mice were anesthetized with Avertin by intraperitoneal injection and demyelination was induced by the focal injection of 2 μL 1% lysolecithin into the corpus callosum (1.00 mm posterior to bregma, 1.04 mm lateral to bregma, and 2.2 mm deep). LPC was delivered at a rate of 0.075 μL/min, and the needle remained in position for 10 min after LPC delivery and then was pulled out slowly. The wound was sutured, and the mice were placed on a heating pad until woken up.

4.7. Western Blot

Brainstem tissues were isolated and homogenized. Homogenates in a lysis buffer (R0278, Sigma, St. Louis, MO, USA) with a protease inhibitor cocktail (P8340; Sigma, St. Louis, MO, USA). Lysates were centrifuged at 12,000× g and 4 °C for 15 min to get rid of the unsolved debris. The concentration of the supernatant was measured by a BCA assay (23225, Thermo Scientific, Waltham, MA, USA). Proteins in samples were separated by 6–12% SDS-PAGE, transferred to a Immobilon-P Transfer Membrane (Millipore, Kenelworth, NJ, USA) and then incubated with indicated primary antibodies diluted in a blocking buffer at 4 °C overnight after blocking by a 5% non-fat milk solution in TBST (50 mM Tris, pH 7.4, 150 mM NaCl, and 0.1% Tween 20) for 1 h at RT. The primary antibodies used were as follows: anti-ERK1/2 (1:5000, ab184699; Abcam), anti-Phospho-ERK1/2 (1:5000, ab76299; Abcam), anti-ACTB (1:10,000, AC026; ABclonal, Wuhan, China), anti-MBP (1:2000, MAB382; Millipore, Kenelworth, NJ, USA), anti-AKT1 (1:5000, A17909; Abclona,), and anti-Phospho-AKT1S473 (1:5000, ab81283; Abcam, Cambridge, MA, USA). Protein detection was achieved with an enhanced chemiluminescence system (Amersham Biosciences, NA, UK).

4.8. Behavior Assays

All behavior experiments were performed during the standard light phase, usually between 9:00 a.m. and 2:00 p.m. In all tests, the cages containing mice were moved into the testing room 1 h before the first trial began. The testers used mixed genotype home cages and were blinded to genotype. The apparatus was cleaned and sterilized, before and after each test to prevent bias due to olfactory cues. In order to exclude the influence of hormones, all behavioral tests were conducted on male mice at P60. The data were analyzed, after all the behavior tests were conducted. The open-field test was performed as previously described [57]. A plastic open-field chamber (30 cm × 30 cm × 34.5 cm) was used. The mice were placed in a chamber, and their activity was recorded by the tracking software EthoVision XT 12 (Noldus, PA Wageningen, Netherlands). The total distance traveled, the distance traveled in the center, and the ratio of the distance traveled in the center to the total distance traveled over 30 min were recorded during the testing period. The rotarod test was conducted as follows. To evaluate the sensorimotor coordination, the mice were placed on an accelerating rotarod (Mouse Rota-Rod NG, Harikul Science, UB47650, Ugo basile, Comerio, Italy) and assessed for the ability to maintain balance on the rotating bar that accelerated from 0 to 40 rpm over a 5 min period. The mice were tested for 4 trials on the first day with a 30 min gap between trials. The latency before falling from the rod was recorded. The forelimb grip strength assessment was shown as follows. The forelimb grip strength was measured using a grip strength apparatus (Bioseb, France). The grip strength of each mouse was measured on six trials per day, and the average peak force per animal was computed.

4.9. Statistical Analysis

All data were analyzed using Prism (GraphPad) and presented as mean ± SEM. The two-way analysis of variance (ANOVA) followed by a multiple comparison was used for the quantitative analysis of data over time and between genotypes. The unpaired two-tailed Student’s t test was used for analysis between two groups with one variable. In addition, a p-value of <0.05 was considered as statistically significant. For each analysis, the results from independent animals were treated as biological replicates (n ≥ 3). For Western blotting and staining results, statistical analyses were performed after the subtraction of the background intensity and normalization with controls in each batch of experiments to minimize the influences of batch-to-batch variations. Detailed statistical information for each experiment was included in the figure legends.

Supplementary Materials

The supporting information can be downloaded at: https://www.mdpi.com/article/10.3390/ijms241210318/s1.

Author Contributions

Conceptualization, R.M. and X.Z.; methodology, Y.L. and H.T.; validation, W.Q. and Y.Y.; formal analysis, W.Q., Y.Y., A.Y., H.T., Y.L. and H.H.; investigation, S.X., Y.R. and Q.L.; writing—original draft preparation, R.M., X.Z. and M.Q.; writing—review and editing, R.M. and X.Z.; visualization, X.Z.; supervision, M.Q. and X.Z.; project administration, M.Q.; funding acquisition, M.Q. All authors have read and agreed to the published version of the manuscript.

Funding

This work was supported by the National Natural Sciences Foundation of China (32070965 and 32170969).

Institutional Review Board Statement

In this study, all animal protocols followed ethical guidelines and were approved by the Laboratory Animal Center, Hangzhou Normal University, and were approved by the Animal Ethics Committee of Hangzhou Normal University, China (permit number: 2022-1063; approved on 3 March 2022).

Informed Consent Statement

Not applicable.

Data Availability Statement

Data supporting the findings of this study shall be made available in the article and the Supplementary Information Files or from the corresponding authors upon reasonable request.

Conflicts of Interest

The authors declare no conflict of interest.

References

  1. Chen, J.F.; Liu, K.; Hu, B.; Li, R.R.; Xin, W.; Chen, H.; Wang, F.; Chen, L.; Li, R.X.; Ren, S.Y.; et al. Enhancing myelin renewal reverses cognitive dysfunction in a murine model of Alzheimer’s disease. Neuron 2021, 109, 2292–2307.e2295. [Google Scholar] [CrossRef] [PubMed]
  2. Huang, H.; Wu, H.; He, W.; Zhou, F.; Yu, X.; Yi, M.; Du, J.; Xie, B.; Qiu, M. Id2 and Id4 are not the major negative regulators of oligodendrocyte differentiation during early central nervous system development. Glia 2022, 70, 590–601. [Google Scholar] [CrossRef]
  3. Mei, R.; Fu, J.; Jiang, C.; Yang, J.; Zheng, K.; Yang, A.; Qiu, M.; Zhao, X. TAPP1 Represses the Differentiation of Oligodendrocyte and its Deficiency Accelerates Myelin Regeneration after Demyelinating Injuries. Neurosci. Bull. 2021, 37, 385–388. [Google Scholar] [CrossRef]
  4. Wang, P.S.; Wang, J.; Xiao, Z.C.; Pallen, C.J. Protein-tyrosine phosphatase alpha acts as an upstream regulator of Fyn signaling to promote oligodendrocyte differentiation and myelination. J. Biol. Chem. 2009, 284, 33692–33702. [Google Scholar] [CrossRef] [PubMed] [Green Version]
  5. Mathys, H.; Davila-Velderrain, J.; Peng, Z.; Gao, F.; Mohammadi, S.; Young, J.Z.; Menon, M.; He, L.; Abdurrob, F.; Jiang, X.; et al. Single-cell transcriptomic analysis of Alzheimer’s disease. Nature 2019, 570, 332–337. [Google Scholar] [CrossRef] [PubMed]
  6. Ferrer, I. Oligodendrogliopathy in neurodegenerative diseases with abnormal protein aggregates: The forgotten partner. Prog. Neurobiol. 2018, 169, 24–54. [Google Scholar] [CrossRef] [PubMed] [Green Version]
  7. Mei, R.; Huang, L.; Wu, M.; Jiang, C.; Yang, A.; Tao, H.; Zheng, K.; Yang, J.; Shen, W.; Chen, X.; et al. Evidence That ITPR2-Mediated Intracellular Calcium Release in Oligodendrocytes Regulates the Development of Carbonic Anhydrase II + Type I/II Oligodendrocytes and the Sizes of Myelin Fibers. Front. Cell. Neurosci. 2021, 15, 751439. [Google Scholar] [CrossRef] [PubMed]
  8. Levy, C.; Brooks, J.M.; Chen, J.; Su, J.; Fox, M.A. Cell-specific and developmental expression of lectican-cleaving proteases in mouse hippocampus and neocortex. J. Comp. Neurol. 2015, 523, 629–648. [Google Scholar] [CrossRef] [Green Version]
  9. Hubert, T.; Grimal, S.; Carroll, P.; Fichard-Carroll, A. Collagens in the developing and diseased nervous system. Cell. Mol. Life Sci. 2009, 66, 1223–1238. [Google Scholar] [CrossRef]
  10. Chernousov, M.A.; Yu, W.M.; Chen, Z.L.; Carey, D.J.; Strickland, S. Regulation of Schwann cell function by the extracellular matrix. Glia 2008, 56, 1498–1507. [Google Scholar] [CrossRef]
  11. Mehta, P.; Piao, X. Adhesion G-protein coupled receptors and extracellular matrix proteins: Roles in myelination and glial cell development. Dev. Dyn. 2017, 246, 275–284. [Google Scholar] [CrossRef] [Green Version]
  12. Silva, M.E.; Hernández-Andrade, M.; Abasolo, N.; Espinoza-Cruells, C.; Mansilla, J.B.; Reyes, C.R.; Aranda, S.; Esteban, Y.; Rodriguez-Calvo, R.; Martorell, L.; et al. DDR1 and Its Ligand, Collagen IV, Are Involved in In Vitro Oligodendrocyte Maturation. Int. J. Mol. Sci. 2023, 24, 1742. [Google Scholar] [CrossRef]
  13. Zhang, Y.; Chen, K.; Sloan, S.A.; Bennett, M.L.; Scholze, A.R.; O’Keeffe, S.; Phatnani, H.P.; Guarnieri, P.; Caneda, C.; Ruderisch, N.; et al. An RNA-sequencing transcriptome and splicing database of glia, neurons, and vascular cells of the cerebral cortex. J. Neurosci. 2014, 34, 11929–11947. [Google Scholar] [CrossRef] [PubMed] [Green Version]
  14. Roig, B.; Franco-Pons, N.; Martorell, L.; Tomàs, J.; Vogel, W.F.; Vilella, E. Expression of the tyrosine kinase discoidin domain receptor 1 (DDR1) in human central nervous system myelin. Brain Res. 2010, 1336, 22–29. [Google Scholar] [CrossRef] [PubMed]
  15. Franco-Pons, N.; Virgos, C.; Vogel, W.F.; Ureña, J.M.; Soriano, E.; del Rio, J.A.; Vilella, E. Expression of discoidin domain receptor 1 during mouse brain development follows the progress of myelination. Neuroscience 2006, 140, 463–475. [Google Scholar] [CrossRef]
  16. Vilella, E.; Gas, C.; Garcia-Ruiz, B.; Rivera, F.J. Expression of DDR1 in the CNS and in myelinating oligodendrocytes. Biochim. Biophys. Acta Mol. Cell Res. 2019, 1866, 118483. [Google Scholar] [CrossRef] [PubMed]
  17. Lappe-Siefke, C.; Goebbels, S.; Gravel, M.; Nicksch, E.; Lee, J.; Braun, P.E.; Griffiths, I.R.; Nave, K.A. Disruption of Cnp1 uncouples oligodendroglial functions in axonal support and myelination. Nat. Genet. 2003, 33, 366–374. [Google Scholar] [CrossRef] [PubMed]
  18. Ben Haim, L.; Schirmer, L.; Zulji, A.; Sabeur, K.; Tiret, B.; Ribon, M.; Chang, S.; Lamers, W.H.; Boillée, S.; Chaumeil, M.M.; et al. Evidence for glutamine synthetase function in mouse spinal cord oligodendrocytes. Glia 2021, 69, 2812–2827. [Google Scholar] [CrossRef] [PubMed]
  19. Zhu, Q.; Zhao, X.; Zheng, K.; Li, H.; Huang, H.; Zhang, Z.; Mastracci, T.; Wegner, M.; Chen, Y.; Sussel, L.; et al. Genetic evidence that Nkx2.2 and Pdgfra are major determinants of the timing of oligodendrocyte differentiation in the developing CNS. Development 2014, 141, 548–555. [Google Scholar] [CrossRef] [PubMed] [Green Version]
  20. Huang, H.; Zhou, F.; Zhou, S.; Qiu, M. MYRF: A Mysterious Membrane-Bound Transcription Factor Involved in Myelin Development and Human Diseases. Neurosci. Bull. 2021, 37, 881–884. [Google Scholar] [CrossRef] [PubMed]
  21. Mattan, N.S.; Ghiani, C.A.; Lloyd, M.; Matalon, R.; Bok, D.; Casaccia, P.; de Vellis, J. Aspartoacylase deficiency affects early postnatal development of oligodendrocytes and myelination. Neurobiol. Dis. 2010, 40, 432–443. [Google Scholar] [CrossRef] [Green Version]
  22. Koenning, M.; Jackson, S.; Hay, C.M.; Faux, C.; Kilpatrick, T.J.; Willingham, M.; Emery, B. Myelin gene regulatory factor is required for maintenance of myelin and mature oligodendrocyte identity in the adult CNS. J. Neurosci. 2012, 32, 12528–12542. [Google Scholar] [CrossRef] [Green Version]
  23. Poggi, G.; Albiez, J.; Pryce, C.R. Effects of chronic social stress on oligodendrocyte proliferation-maturation and myelin status in prefrontal cortex and amygdala in adult mice. Neurobiol. Stress 2022, 18, 100451. [Google Scholar] [CrossRef] [PubMed]
  24. Luders, E.; Thompson, P.M.; Toga, A.W. The development of the corpus callosum in the healthy human brain. J. Neurosci. 2010, 30, 10985–10990. [Google Scholar] [CrossRef] [Green Version]
  25. Gibson, E.M.; Purger, D.; Mount, C.W.; Goldstein, A.K.; Lin, G.L.; Wood, L.S.; Inema, I.; Miller, S.E.; Bieri, G.; Zuchero, J.B.; et al. Neuronal activity promotes oligodendrogenesis and adaptive myelination in the mammalian brain. Science 2014, 344, 1252304. [Google Scholar] [CrossRef] [Green Version]
  26. Keogh, C.E.; Kim, D.H.J.; Pusceddu, M.M.; Knotts, T.A.; Rabasa, G.; Sladek, J.A.; Hsieh, M.T.; Honeycutt, M.; Brust-Mascher, I.; Barboza, M.; et al. Myelin as a regulator of development of the microbiota-gut-brain axis. Brain Behav. Immun. 2021, 91, 437–450. [Google Scholar] [CrossRef]
  27. Suo, N.; Guo, Y.E.; He, B.; Gu, H.; Xie, X. Inhibition of MAPK/ERK pathway promotes oligodendrocytes generation and recovery of demyelinating diseases. Glia 2019, 67, 1320–1332. [Google Scholar] [CrossRef] [Green Version]
  28. Allan, K.C.; Hu, L.R.; Scavuzzo, M.A.; Morton, A.R.; Gevorgyan, A.S.; Cohn, E.F.; Clayton, B.L.L.; Bederman, I.R.; Hung, S.; Bartels, C.F.; et al. Non-canonical Targets of HIF1a Impair Oligodendrocyte Progenitor Cell Function. Cell Stem Cell 2021, 28, 257–272.e211. [Google Scholar] [CrossRef] [PubMed]
  29. Chappell, W.H.; Candido, S.; Abrams, S.L.; Akula, S.M.; Steelman, L.S.; Martelli, A.M.; Ratti, S.; Cocco, L.; Cervello, M.; Montalto, G.; et al. Influences of TP53 and the anti-aging DDR1 receptor in controlling Raf/MEK/ERK and PI3K/Akt expression and chemotherapeutic drug sensitivity in prostate cancer cell lines. Aging 2020, 12, 10194–10210. [Google Scholar] [CrossRef]
  30. Zhao, Z.; Zhao, S.; Luo, L.; Xiang, Q.; Zhu, Z.; Wang, J.; Liu, Y.; Luo, J. miR-199b-5p-DDR1-ERK signalling axis suppresses prostate cancer metastasis via inhibiting epithelial-mesenchymal transition. Br. J. Cancer 2021, 124, 982–994. [Google Scholar] [CrossRef] [PubMed]
  31. Garcia-Martin, G.; Alcover-Sanchez, B.; Wandosell, F.; Cubelos, B. Pathways Involved in Remyelination after Cerebral Ischemia. Curr. Neuropharmacol. 2022, 20, 751–765. [Google Scholar] [CrossRef] [PubMed]
  32. Shafit-Zagardo, B.; Gruber, R.C.; DuBois, J.C. The role of TAM family receptors and ligands in the nervous system: From development to pathobiology. Pharmacol. Ther. 2018, 188, 97–117. [Google Scholar] [CrossRef] [PubMed]
  33. Krämer-Albers, E.M.; White, R. From axon-glial signalling to myelination: The integrating role of oligodendroglial Fyn kinase. Cell. Mol. Life Sci. 2011, 68, 2003–2012. [Google Scholar] [CrossRef] [PubMed]
  34. Ranjan, M.; Hudson, L.D. Regulation of tyrosine phosphorylation and protein tyrosine phosphatases during oligodendrocyte differentiation. Mol. Cell. Neurosci. 1996, 7, 404–418. [Google Scholar] [CrossRef] [PubMed]
  35. Park, S.K.; Miller, R.; Krane, I.; Vartanian, T. The erbB2 gene is required for the development of terminally differentiated spinal cord oligodendrocytes. J. Cell Biol. 2001, 154, 1245–1258. [Google Scholar] [CrossRef] [Green Version]
  36. Bercury, K.K.; Macklin, W.B. Dynamics and mechanisms of CNS myelination. Dev. Cell 2015, 32, 447–458. [Google Scholar] [CrossRef] [Green Version]
  37. Choi, C.I.; Yoo, K.H.; Hussaini, S.M.; Jeon, B.T.; Welby, J.; Gan, H.; Scarisbrick, I.A.; Zhang, Z.; Baker, D.J.; van Deursen, J.M.; et al. The progeroid gene BubR1 regulates axon myelination and motor function. Aging 2016, 8, 2667–2688. [Google Scholar] [CrossRef] [Green Version]
  38. Chen, X.; Zhang, W.; Li, T.; Guo, Y.; Tian, Y.; Wang, F.; Liu, S.; Shen, H.Y.; Feng, Y.; Xiao, L. Impairment of Oligodendroglia Maturation Leads to Aberrantly Increased Cortical Glutamate and Anxiety-Like Behaviors in Juvenile Mice. Front. Cell. Neurosci. 2015, 9, 467. [Google Scholar] [CrossRef] [Green Version]
  39. Franco-Pons, N.; Tomàs, J.; Roig, B.; Auladell, C.; Martorell, L.; Vilella, E. Discoidin domain receptor 1, a tyrosine kinase receptor, is upregulated in an experimental model of remyelination and during oligodendrocyte differentiation in vitro. J. Mol. Neurosci. 2009, 38, 2–11. [Google Scholar] [CrossRef]
  40. Canoll, P.D.; Kraemer, R.; Teng, K.K.; Marchionni, M.A.; Salzer, J.L. GGF/neuregulin induces a phenotypic reversion of oligodendrocytes. Mol. Cell. Neurosci. 1999, 13, 79–94. [Google Scholar] [CrossRef] [PubMed]
  41. Fressinaud, C.; Vallat, J.M.; Labourdette, G. Basic fibroblast growth factor down-regulates myelin basic protein gene expression and alters myelin compaction of mature oligodendrocytes in vitro. J. Neurosci. Res. 1995, 40, 285–293. [Google Scholar] [CrossRef] [PubMed]
  42. Bansal, R.; Pfeiffer, S.E. FGF-2 converts mature oligodendrocytes to a novel phenotype. J. Neurosci. Res. 1997, 50, 215–228. [Google Scholar] [CrossRef]
  43. Xiao, J.; Ferner, A.H.; Wong, A.W.; Denham, M.; Kilpatrick, T.J.; Murray, S.S. Extracellular signal-regulated kinase 1/2 signaling promotes oligodendrocyte myelination in vitro. J. Neurochem. 2012, 122, 1167–1180. [Google Scholar] [CrossRef]
  44. Ishii, A.; Furusho, M.; Dupree, J.L.; Bansal, R. Strength of ERK1/2 MAPK Activation Determines Its Effect on Myelin and Axonal Integrity in the Adult CNS. J. Neurosci. 2016, 36, 6471–6487. [Google Scholar] [CrossRef] [PubMed] [Green Version]
  45. Chen, C.D.; Sloane, J.A.; Li, H.; Aytan, N.; Giannaris, E.L.; Zeldich, E.; Hinman, J.D.; Dedeoglu, A.; Rosene, D.L.; Bansal, R.; et al. The antiaging protein Klotho enhances oligodendrocyte maturation and myelination of the CNS. J. Neurosci. 2013, 33, 1927–1939. [Google Scholar] [CrossRef] [PubMed] [Green Version]
  46. Hu, X.; Xiao, G.; He, L.; Niu, X.; Li, H.; Lou, T.; Hu, Q.; Yang, Y.; Xu, Q.; Wei, Z.; et al. Sustained ErbB Activation Causes Demyelination and Hypomyelination by Driving Necroptosis of Mature Oligodendrocytes and Apoptosis of Oligodendrocyte Precursor Cells. J. Neurosci. 2021, 41, 9872–9890. [Google Scholar] [CrossRef]
  47. Joerger-Messerli, M.S.; Thomi, G.; Haesler, V.; Keller, I.; Renz, P.; Surbek, D.V.; Schoeberlein, A. Human Wharton’s Jelly Mesenchymal Stromal Cell-Derived Small Extracellular Vesicles Drive Oligodendroglial Maturation by Restraining MAPK/ERK and Notch Signaling Pathways. Front. Cell Dev. Biol. 2021, 9, 622539. [Google Scholar] [CrossRef]
  48. Nam, H.; Kundu, A.; Brinkley, G.J.; Chandrashekar, D.S.; Kirkman, R.L.; Chakravarthi, B.; Orlandella, R.M.; Norian, L.A.; Sonpavde, G.; Ghatalia, P.; et al. PGC1α suppresses kidney cancer progression by inhibiting collagen-induced SNAIL expression. Matrix Biol. 2020, 89, 43–58. [Google Scholar] [CrossRef]
  49. Lyon, A.; Tripathi, R.; Meeks, C.; He, D.; Wu, Y.; Liu, J.; Wang, C.; Chen, J.; Zhu, H.; Mukherjee, S.; et al. ABL1/2 and DDR1 Drive MEKi Resistance in NRAS-Mutant Melanomas by Stabilizing RAF/MYC/ETS1 and Promoting RAF Homodimerization. Cancers 2023, 15, 954. [Google Scholar] [CrossRef] [PubMed]
  50. Vogel, W.F.; Aszódi, A.; Alves, F.; Pawson, T. Discoidin domain receptor 1 tyrosine kinase has an essential role in mammary gland development. Mol. Cell. Biol. 2001, 21, 2906–2917. [Google Scholar] [CrossRef] [Green Version]
  51. Tonniges, J.R.; Albert, B.; Calomeni, E.P.; Roy, S.; Lee, J.; Mo, X.; Cole, S.E.; Agarwal, G. Collagen Fibril Ultrastructure in Mice Lacking Discoidin Domain Receptor 1. Microsc. Microanal. 2016, 22, 599–611. [Google Scholar] [CrossRef] [Green Version]
  52. Chavez, M.B.; Kolli, T.N.; Tan, M.H.; Zachariadou, C.; Wang, C.; Embree, M.C.; Lira Dos Santos, E.J.; Nociti, F.H., Jr.; Wang, Y.; Tatakis, D.N.; et al. Loss of Discoidin Domain Receptor 1 Predisposes Mice to Periodontal Breakdown. J. Dent. Res. 2019, 98, 1521–1531. [Google Scholar] [CrossRef] [PubMed]
  53. Mastracci, T.L.; Lin, C.S.; Sussel, L. Generation of mice encoding a conditional allele of Nkx2.2. Transgenic Res. 2013, 22, 965–972. [Google Scholar] [CrossRef] [PubMed] [Green Version]
  54. Xu, X.; Yu, Q.; Fang, M.; Yi, M.; Yang, A.; Xie, B.; Yang, J.; Zhang, Z.; Dai, Z.; Qiu, M. Stage-specific regulation of oligodendrocyte development by Hedgehog signaling in the spinal cord. Glia 2020, 68, 422–434. [Google Scholar] [CrossRef] [PubMed]
  55. Holleran, L.; Kim, J.H.; Gangolli, M.; Stein, T.; Alvarez, V.; McKee, A.; Brody, D.L. Axonal disruption in white matter underlying cortical sulcus tau pathology in chronic traumatic encephalopathy. Acta Neuropathol. 2017, 133, 367–380. [Google Scholar] [CrossRef] [PubMed]
  56. Sui, R.X.; Miao, Q.; Wang, J.; Wang, Q.; Song, L.J.; Yu, J.W.; Cao, L.; Xiao, W.; Xiao, B.G.; Ma, C.G. Protective and therapeutic role of Bilobalide in cuprizone-induced demyelination. Int. Immunopharmacol. 2019, 66, 69–81. [Google Scholar] [CrossRef]
  57. Chen, X.; Wang, F.; Gan, J.; Zhang, Z.; Liang, X.; Li, T.; Huang, N.; Zhao, X.; Mei, F.; Xiao, L. Myelin Deficits Caused by Olig2 Deficiency Lead to Cognitive Dysfunction and Increase Vulnerability to Social Withdrawal in Adult Mice. Neurosci. Bull. 2020, 36, 419–426. [Google Scholar] [CrossRef]
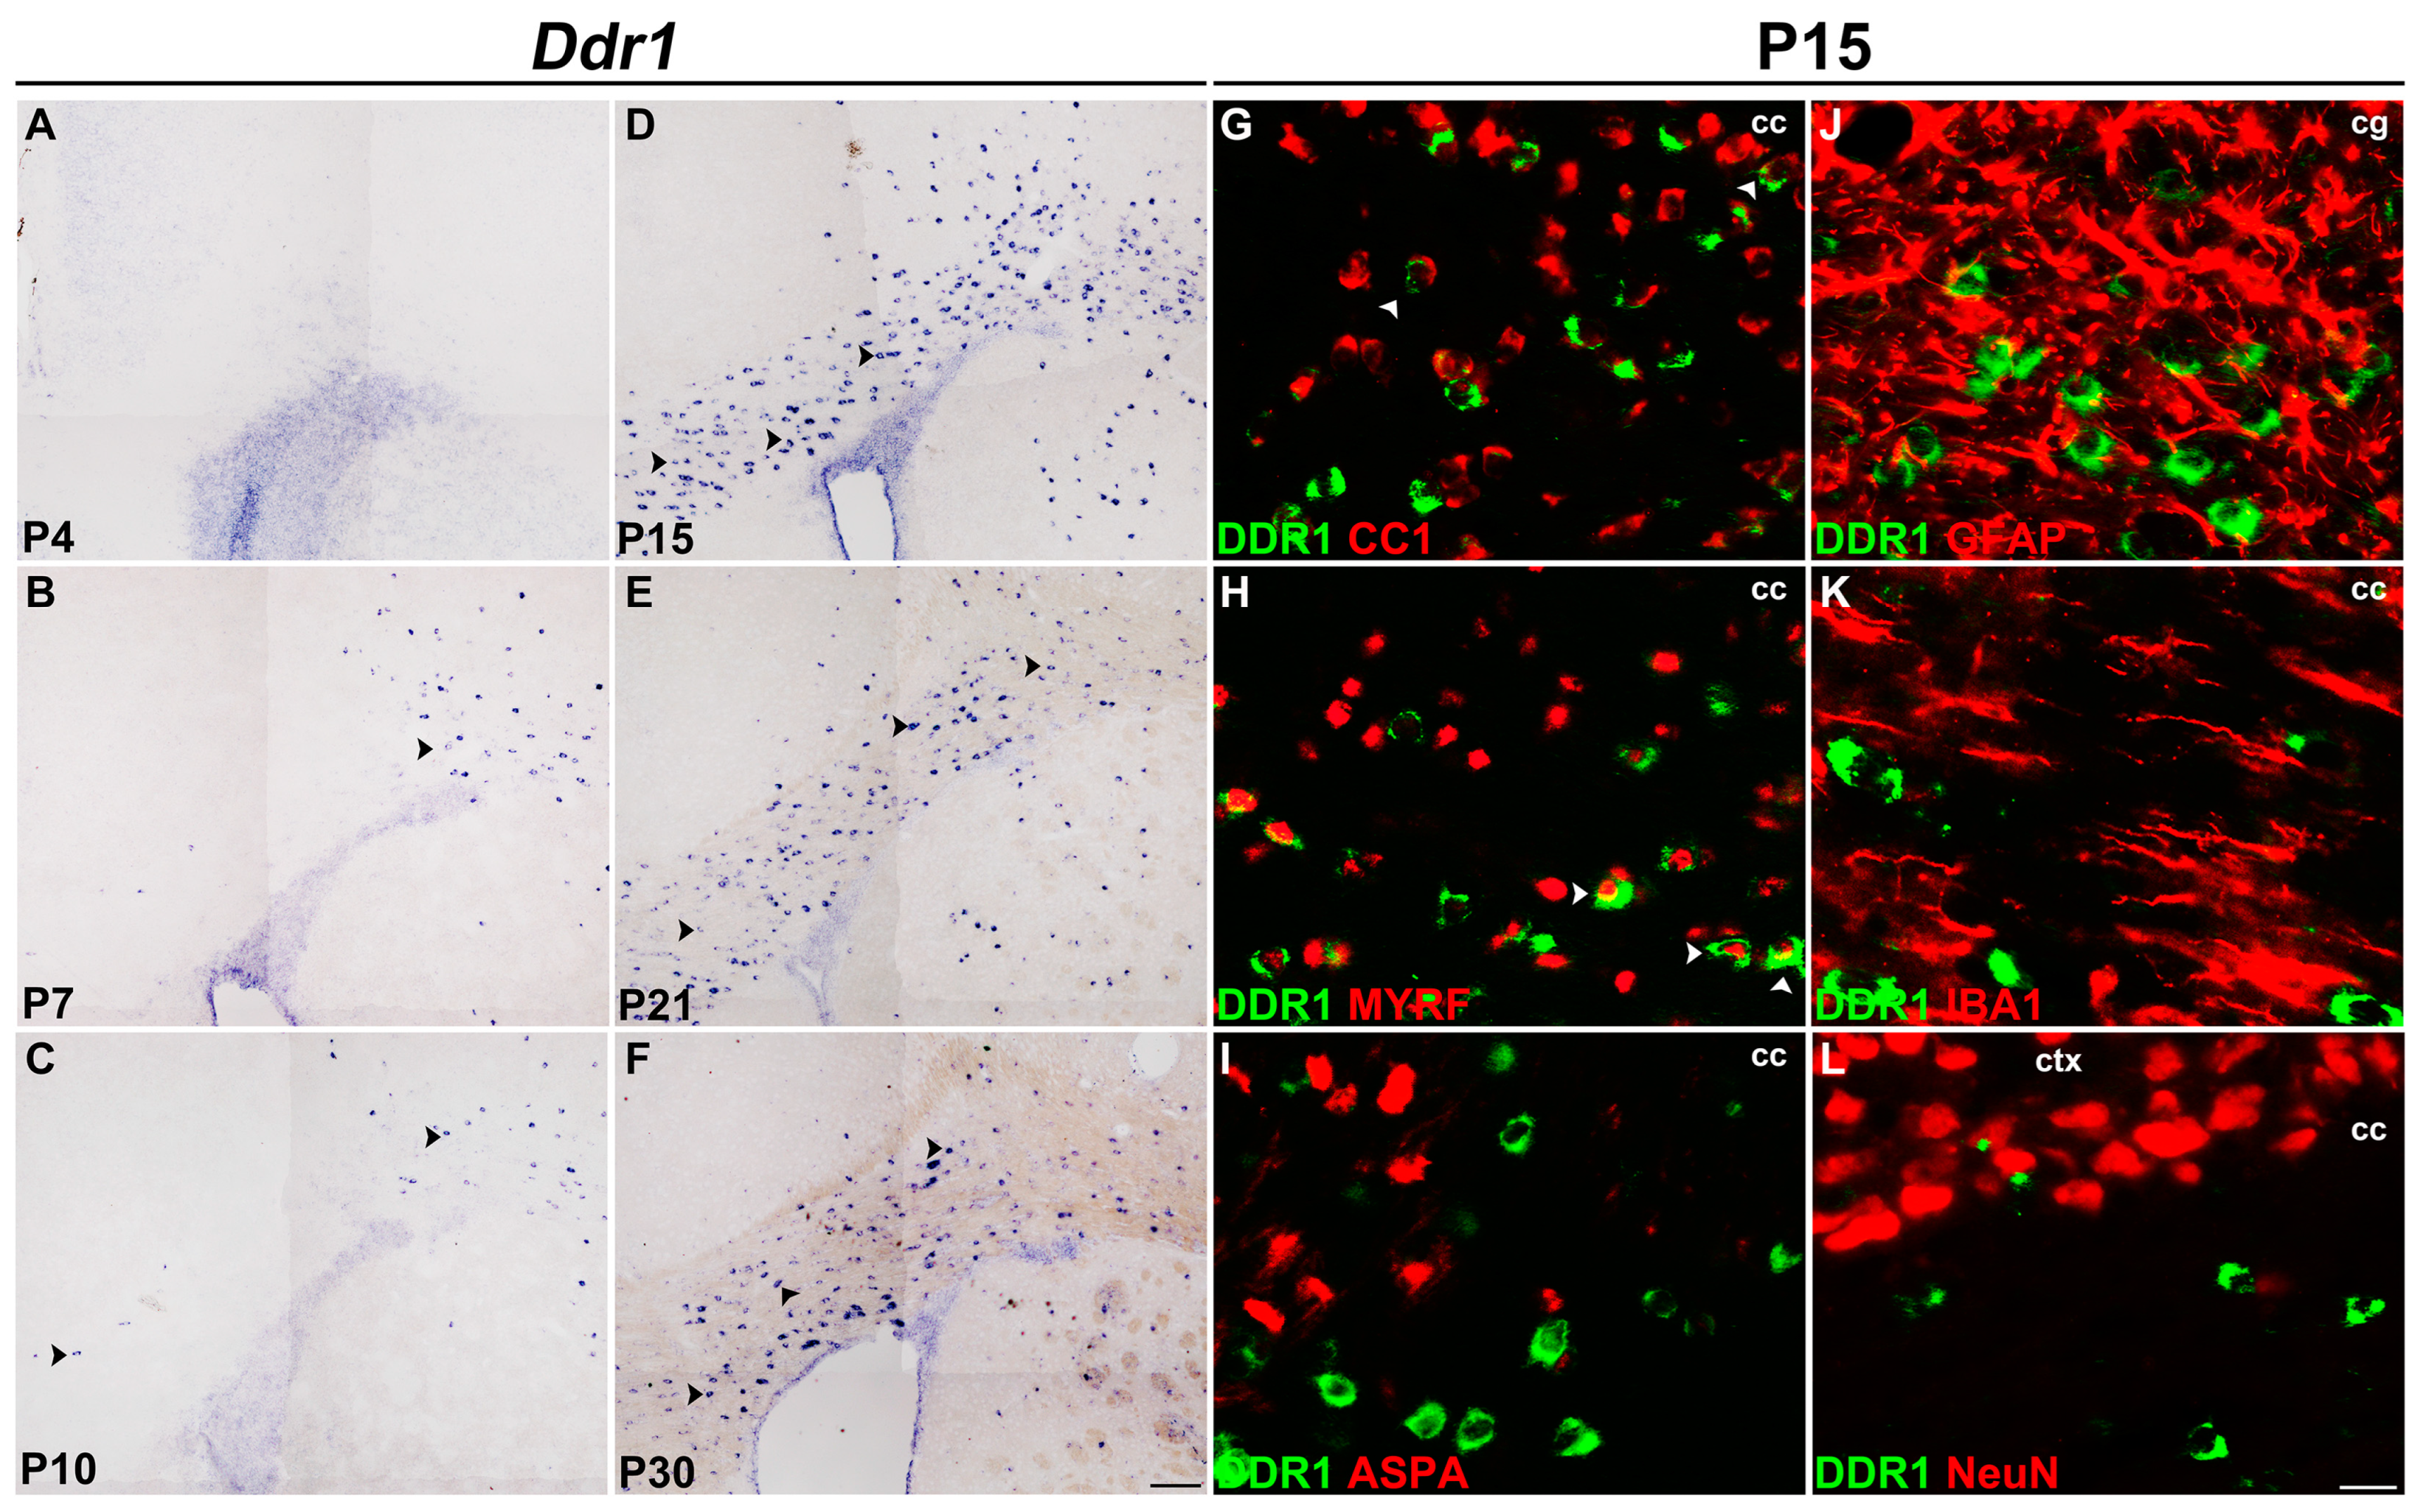
Figure 1. Ddr1 was selectively up-regulated in newly differentiated OLs in the CNS. (AF) Expression of Ddr1 in the forebrain tissues as detected by RNA in situ hybridization (ISH). Black arrowheads highlight Ddr1+ cells. The number of Ddr1-positive cells in the corpus callosum drastically increased at P15 and then declined thereafter. The scale bar represents 100 µm. (GL) Immunostaining with indicated antibodies combined with Ddr1 mRNA ISH was performed in the corpus callosum from P15 wild-type mice. Double-positive cells are represented by white arrowheads. Ddr1+ cells were co-expressed with oligodendrocyte marker CC1 and MYRF, but they were not detected in ASPA+ mature oligodendrocytes, GFAP+ astrocytes, IBA1+ microglia, and NeuN+ neurons. cc—corpus callosum; cg—cingulum; ctx—cortex; the scale bar represents 25 µm.
Ijms 24 10318 g001
Figure 2. Ablation of the Ddr1 gene delayed the differentiation and maturation of oligodendrocytes. (AC’) Brain sections from wild-type (WT) and Ddr1-KO mice were subjected to anti-OLIG2 (red) and anti-CC1 (green) double immunostaining. Arrows pointed to CC1/OLIG2 double-positive cells. The scale bar represents 25 µm. (D) Quantitative analysis of the ratio of CC1+ cells in OLIG2+ oligodendrocytes at indicated stages. (EG’) Double labeling of SOX10 and MYRF in P10, P15, and P30 WT and Ddr1-KO mice. The scale bar represents 25 µm. (H) Quantification of MYRF/SOX10 double-positive cells per section in the WT and Ddr1-KO mouse corpus callosa at indicated stages. (IQ’) Mbp, Plp1, and Pdgfrα mRNA expression in coronal forebrain sections of wild-type (IQ) and Ddr1-KO (I’Q’) mice at indicated stages. (R,S) Quantification of the number of Plp1+ cells per mm2 and the number of Pdgfrα+ cells per mm2 (n = 3) in the corpus callosum from wild-type and Ddr1-KO mice at indicated stages. The scale bar represents 100 µm. Error bars indicate means ± SEM.
Ijms 24 10318 g002
Figure 3. Deficiency of Ddr1 altered the callosal thickness. (AC’) Detection of myelin tracts within the corpus callosum at P10, P15, and P30 for wild-type mice (AC) and Ddr1-KO mice (A’C’) by Black Gold II staining. Dashed lines delineate the region of interest (ROI). The scale bar represents 100 µm. (D) Quantification of the corpus callosal thicknesses of wild-type and Ddr1-KO mice at indicated stages. Error bars indicate means ± SEM. n > 3.
Ijms 24 10318 g003
Figure 4. Knockout Ddr1 altered the myelin structure and myelinated axon constitution in the corpus callosum. (AC’) Electron microscopic images of the corpus callosum (CC) from wild-type and Ddr1-KO mice at indicated stages. Scale bars represent 2 µm. The insets show both typical myelinated axons and unmyelinated axons from two groups. The scale bar represents 0.5 µm. (D) Quantification of the percentage of myelinated axons in the corpus callosa from wild-type and Ddr1 mutants at indicated stages. Error bars indicate means ± SEM. n ≥ 3. (E) The relationship between diameters and g-ratios of axons from the corpus callosa of wild-type and Ddr1-KO mice at P15. The averaged g-ratios were 0.8638 ± 0.001796 for wild-type mice (523 axons from 3 animals; indicated by black squares) and 0.8843 ± 0.002994 for Ddr1-KO mice (121 axons from 3 animals; indicated by red triangles); p < 0.0001. (F) The relationship between diameters and g-ratios of axons from the corpus callosa of wild-type and Ddr1-KO mice at P30. The averaged g-ratios were 0.8503± 0.001297 for wild-type mice (1096 axons from 3 animals; indicated by black squares) and 0.8567 ± 0.001406 for Ddr1-KO mice (936 axons from 3 animals; indicated by red triangles); p = 0.0008. (G) The relationship between diameters and g-ratios of axons from the corpus callosa of wild-type and Ddr1-KO mice at P60. The averaged g-ratios were 0.8522± 0.001174 for wild-type mice (1517 axons from 3 animals; indicated by black squares) and 0.8589 ± 0.001381 for Ddr1-KO mice (882 axons from 3 animals; indicated by red triangles); p = 0.0003. (H) Quantification of the percentage of myelinated axons by size in the corpus callosa of wild-type and mutant mice at P15. A decreased number of myelinated small-diameter axons (<0.5 µm) were observed in Ddr1 mutants. (I) Quantification of the percentage of myelinated axons by sizes in the corpus callosa of wild-type and mutant mice at P30. (J) Quantification of the percentage of myelinated axons by sizes in the corpus callosa of wild-type and mutant mice at P60. A decreased number of myelinated small-diameter axons (<0.5 µm) were also observed in Ddr1 mutants. Error bars indicate means ± SEM.
Ijms 24 10318 g004
Figure 5. Deficiency of Ddr1 impaired the motor function in mice. (A,A’) Locomotor activity of P60 wild-type mice (n = 14) (A) and Ddr1-KO mice (n = 14) (A’) in the open field test; (B) moved distance; (C) ratio of the central to total distances; (D) The latency time before falling from the rod of each mouse for wild-type mice (n = 14) or mutant mice (n = 14) at P60. Rotarod analysis showed a worse motor performance in Ddr1-KO mice; (E) forelimb grip strengths in wild-type mice (n = 11) and Ddr1-KO mice (n = 11) at P60, showing significantly reduced forelimb grip strength in the Ddr1-KO mice (n = 11) compare to in the wild-type mice (n = 11) at P60. Error bars indicate means ± SEM. Black or red dot represents individual data point.
Ijms 24 10318 g005
Figure 6. Ddr1 mutation attenuated remyelination in LPC-induced demyelinated lesions. (A) LPC injection site in the corpus callosum of P60 adult mice brains. (B) Schedule of histological analyses in the LPC lesion paradigm. (CH’) LPC lesions of wild-type and Ddr1-KO mice stained for MBP indicated in red (CE’) or CC1 indicated in read (FH’) at 7, 14, and 21 days post-injection and counterstained with DAPI (indicated in blue). Dashed lines delineate lesion areas. The scale bar represents 25 µm. (I) The numbers of CC1+ cells per mm2 in wild-type and Ddr1-KO mouse lesion regions at 7, 14, and 21 dpi. Error bars indicate means ± SEM.
Ijms 24 10318 g006
Figure 7. Ddr1 deletion enhanced ERK activation. (A) The expression of phosphorylation of ERK, MBP, total ERK, total AKT, and phosphorylation of AKT in brainstem tissues from wild-type and Ddr1-KO mice at P10, P15, and P30. β-Actin was used as the internal control. (B) Quantification of MBP protein levels in the brainstem of Ddr1-KO mice which were normalized to those in the brainstem of the wild-type group. (C) Quantification of total ERK protein levels in the brainstem of Ddr1-KO mice which was normalized to those in the brainstem of the wild-type group. (D) Quantification of total AKT protein levels in the brainstems of Ddr1-KO and wild-type mice. (E) Quantification of ERK phosphorylation levels in total ERK in the brainstem tissues of Ddr1-KO and wild-type group. (F) Quantification of AKT phosphorylation levels in the total AKT in the brainstem tissues of Ddr1-KO and control group. Error bar indicates means ± SEM. n = 3.
Ijms 24 10318 g007
Disclaimer/Publisher’s Note: The statements, opinions and data contained in all publications are solely those of the individual author(s) and contributor(s) and not of MDPI and/or the editor(s). MDPI and/or the editor(s) disclaim responsibility for any injury to people or property resulting from any ideas, methods, instructions or products referred to in the content.