Article

Spin Crossover and Thermochromism in Iron(II) Complexes with 2,6-Bis(1H-imidazol-2-yl)-4-methoxypyridine

by
Olga G. Shakirova
1,2,
Irina A. Os’kina
3,
Evgeniy V. Korotaev
1,
Sergey A. Petrov
4,
Natalia V. Kuratieva
1,
Alexsei Ya. Tikhonov
3 and
Lyudmila G. Lavrenova
1,*
1
Nikolaev Institute of Inorganic Chemistry, Siberian Branch, Russian Academy of Sciences, 630090 Novosibirsk, Russia
2
Department of Chemistry and Chemical Technologies, Faculty of Machinery and Chemical Technologies, Federal State Budget Institution of Higher Education, Komsomolsk-na-Amure State University, 681013 Komsomolsk-on-Amur, Russia
3
N.N. Vorozhtsov Novosibirsk Institute of Organic Chemistry, Siberian Branch, Russian Academy of Sciences, 630090 Novosibirsk, Russia
4
Institute of Solid State Chemistry, Siberian Branch, Russian Academy of Sciences, 630128 Novosibirsk, Russia
*
Author to whom correspondence should be addressed.
Int. J. Mol. Sci. 2023, 24(12), 9853; https://doi.org/10.3390/ijms24129853
Submission received: 17 May 2023 / Revised: 24 May 2023 / Accepted: 4 June 2023 / Published: 7 June 2023
(This article belongs to the Special Issue The Design, Synthesis and Study of Metal Complexes)

Abstract

:
New iron(II) complexes with 2,6-bis(1H-imidazol-2-yl)-4-methoxypyridine (L) of the composition [FeL2]An∙mH2O (A = SO42−, n = 1, m = 2 (I); A = ReO4, n = 2, m = 1 (II); A = Br, n = 2, m = 2 (III)) have been synthesized and investigated. To determine the coordination ability of the ligand, a single crystal of a copper(II) complex of the composition [CuLCl2] (IV) was obtained and studied by X-ray technique. Compounds IIII were studied using methods of X-ray phase analysis, electron (diffuse reflection spectra), infrared and Mössbauer spectroscopy, static magnetic susceptibility. The study of the µeff(T) dependence showed that the 1A15T2 spin crossover manifests itself in the compounds. The spin crossover is accompanied by thermochromism: there is a distinct color change orange ↔ red-violet.

Graphical Abstract

1. Introduction

In coordination compounds of metals with the electronic configuration d4-d7, at a certain strength of the ligand field, the phenomenon of spin crossover (SCO) manifests itself, is a change in spin multiplicity under the influence of external conditions, such as temperature, pressure, irradiation with light of a certain wavelength, external magnetic or electric fields, light-controlled ligand isomerization and solvation/desolvation [1,2,3,4,5]. Coordination compounds of iron(II) with poly-nitrogen-containing ligands are of particular interest due to the fact that in many of them SCO is accompanied by thermochromism, is a reversible color change at the spin transition temperature. Bistable molecular sensors can be in demand for a wide range of applications, including in the field of nanotechnology, such as display and memory devices, sensors [6], MRI contrast agents [7], thermoelectrochemical cells [8], etc.
Spin crossover in iron(II) complexes, in terms 1A1 (S = 0, low-spin, LS) 5T2 (S = 2, high-spin, HS), is always unique for each iron(II) complex. The transition can be abrupt or gradual, complete or incomplete, may have hysteresis or not on the eff(T) dependence curve, have one or two stages. The temperatures of the direct transition (when heated, Tc) and the reverse ones (when cooled, Tc) depend on the composition of the compounds and vary widely. The fact that the low-spin state is diamagnetic makes it possible to estimate the temperature-independent paramagnetism of John Hasbrouck van Vleck.
At present, our research team synthesizes and investigates a number of iron(II) complexes with derivatives of 2,6-bis(1H-imidazol-2-yl)pyridine (L*) and various external anions of the composition [FeL*2]An∙mH2O (n = 1, 2; m = 0–2). Both the literature data [9], and the results of X-ray and EXAFS spectroscopy obtained by us show that ligands of this class are coordinated to iron(II) in a tridentate-cyclic (pincer) type by an N atom of pyridine and two N(3) atoms of imidazole cycles. For most of the studied iron(II) complexes with 2,6-bis(1H-imidazol-2-yl)pyridine derivatives, a high-temperature one- or two-stage SCO 1A1 5T2 is observed [10,11,12,13,14,15]. In contrast to the iron(II) complexes with 1,2,4-triazoles and tris(pyrazol-1-yl)methanes previously studied by us [5,16,17], we have not observed the phenomenon of thermochromism in a series of Fe(II) compounds with 2,6-bis(1H-imidazol-2-yl)pyridine. It can be assumed that the reason for this is the intense violet color of the low-spin form, which even with its low content masks the white color of the high-spin form of complexes at high temperatures. In order to study the effect of the substituent position in the ligand on the characteristics of the SCO system, it seemed advisable to continue studying iron(II) complexes with a new derivative of this class, in which the substituent is not in the imidazole, but in the pyridine cycle. For this purpose, we synthesized a new functionalized ligand with an auxochromic group 2,6-bis(1H-imidazol-2-yl)-4-methoxypyridine (L, Scheme 1).
This work is devoted to the development of a method for the synthesis of a new organic compound 2,6-bis(1H-imidazol-2-yl)-4-methoxypyridine, the production of iron(II) complexes based on it and the study of their physicochemical and, in particular, magnetic properties.

2. Results

2.1. Synthesis and Characterization

We used a convenient synthetic route to obtain 2,6-bis(1H-imidazol-2-yl)-4-methoxypyridine L. Chelidamic acid was successively converted into the corresponding methyl ester 2, amide 3 and nitrile 4 using the following reactions [18,19] (Scheme 1). Dimethyl 4-hydroxypyridine-2,6-dicarboxylate 1 and dimethyl 4-methoxypyridine-2,6-dicarboxylate 2 were synthesized by the reflux of chelidamic acid hydrate in MeOH with conc. H2SO4. However, the incomplete conversion of chelidamic acid to dimethyl 4-methoxypyridine-2,6-dicarboxylate 2 as observed under these conditions. Additional amount of dimethyl 4-methoxypyridine-2,6-dicarboxylate 2 was prepared by the alkylation of dimethyl 4-hydroxypyridine-2,6-dicarboxylate 1 with CH3I in the presence of K2CO3 under heating at 50 °C in DMF. 4-Methoxypyridine-2,6-dicarboxamide 3 was isolated in the reaction of dimethyl 4-methoxypyridine-2,6-dicarboxylate 2 with NH4OH in refluxing methanol. The treatment of 4-methoxypyridine-2,6-dicarboxamide 3 with trifluoroacetic anhydride in THF at 0 °C in the presence of Et3N produced of 4-methoxypyridine-2,6-dicarbonitrile 4. For the construction of the 1H-imidazole, moiety the nitrile 4 was reacted with amino acetaldehyde diethyl acetal [20] leading to the isolation of 2,6-bis(1H-imidazol-2-yl)-4-methoxypyridine L (Scheme 1). The compounds 1-4 and the ligand L NMR spectra data are given in the Supplementary Materials, Figures S1–S10.
Complexes [FeL2]SO4∙2H2O (I), [FeL2](ReO4)2∙H2O (II), [FeL2]Br2∙2H2O (III) and [CuLCl2] (IV) were obtained from acidified aqueous–ethanol solutions at a molar ratio M:L = 1:2. Elemental analysis of the obtained phases IIII showed that the phases have the appropriate composition. The resulting iron(II) complexes are slightly soluble in water and ethanol. Elemental analysis of the bright green complex IV showed that the crystals have a composition of Cu:L = 1:1. This complex is highly soluble in water, ethanol and acetone. All compounds are stable for a long time when stored in the air at room temperature. The thermal behavior of both the ligand and the complexes was studied using TG/DSC measurements. The compounds lose crystallization water in the temperature range of 70–120 °C, remaining stable in an anhydrous state up to 350 °C (Figures S11–S14).

2.2. X-ray Structure Determination

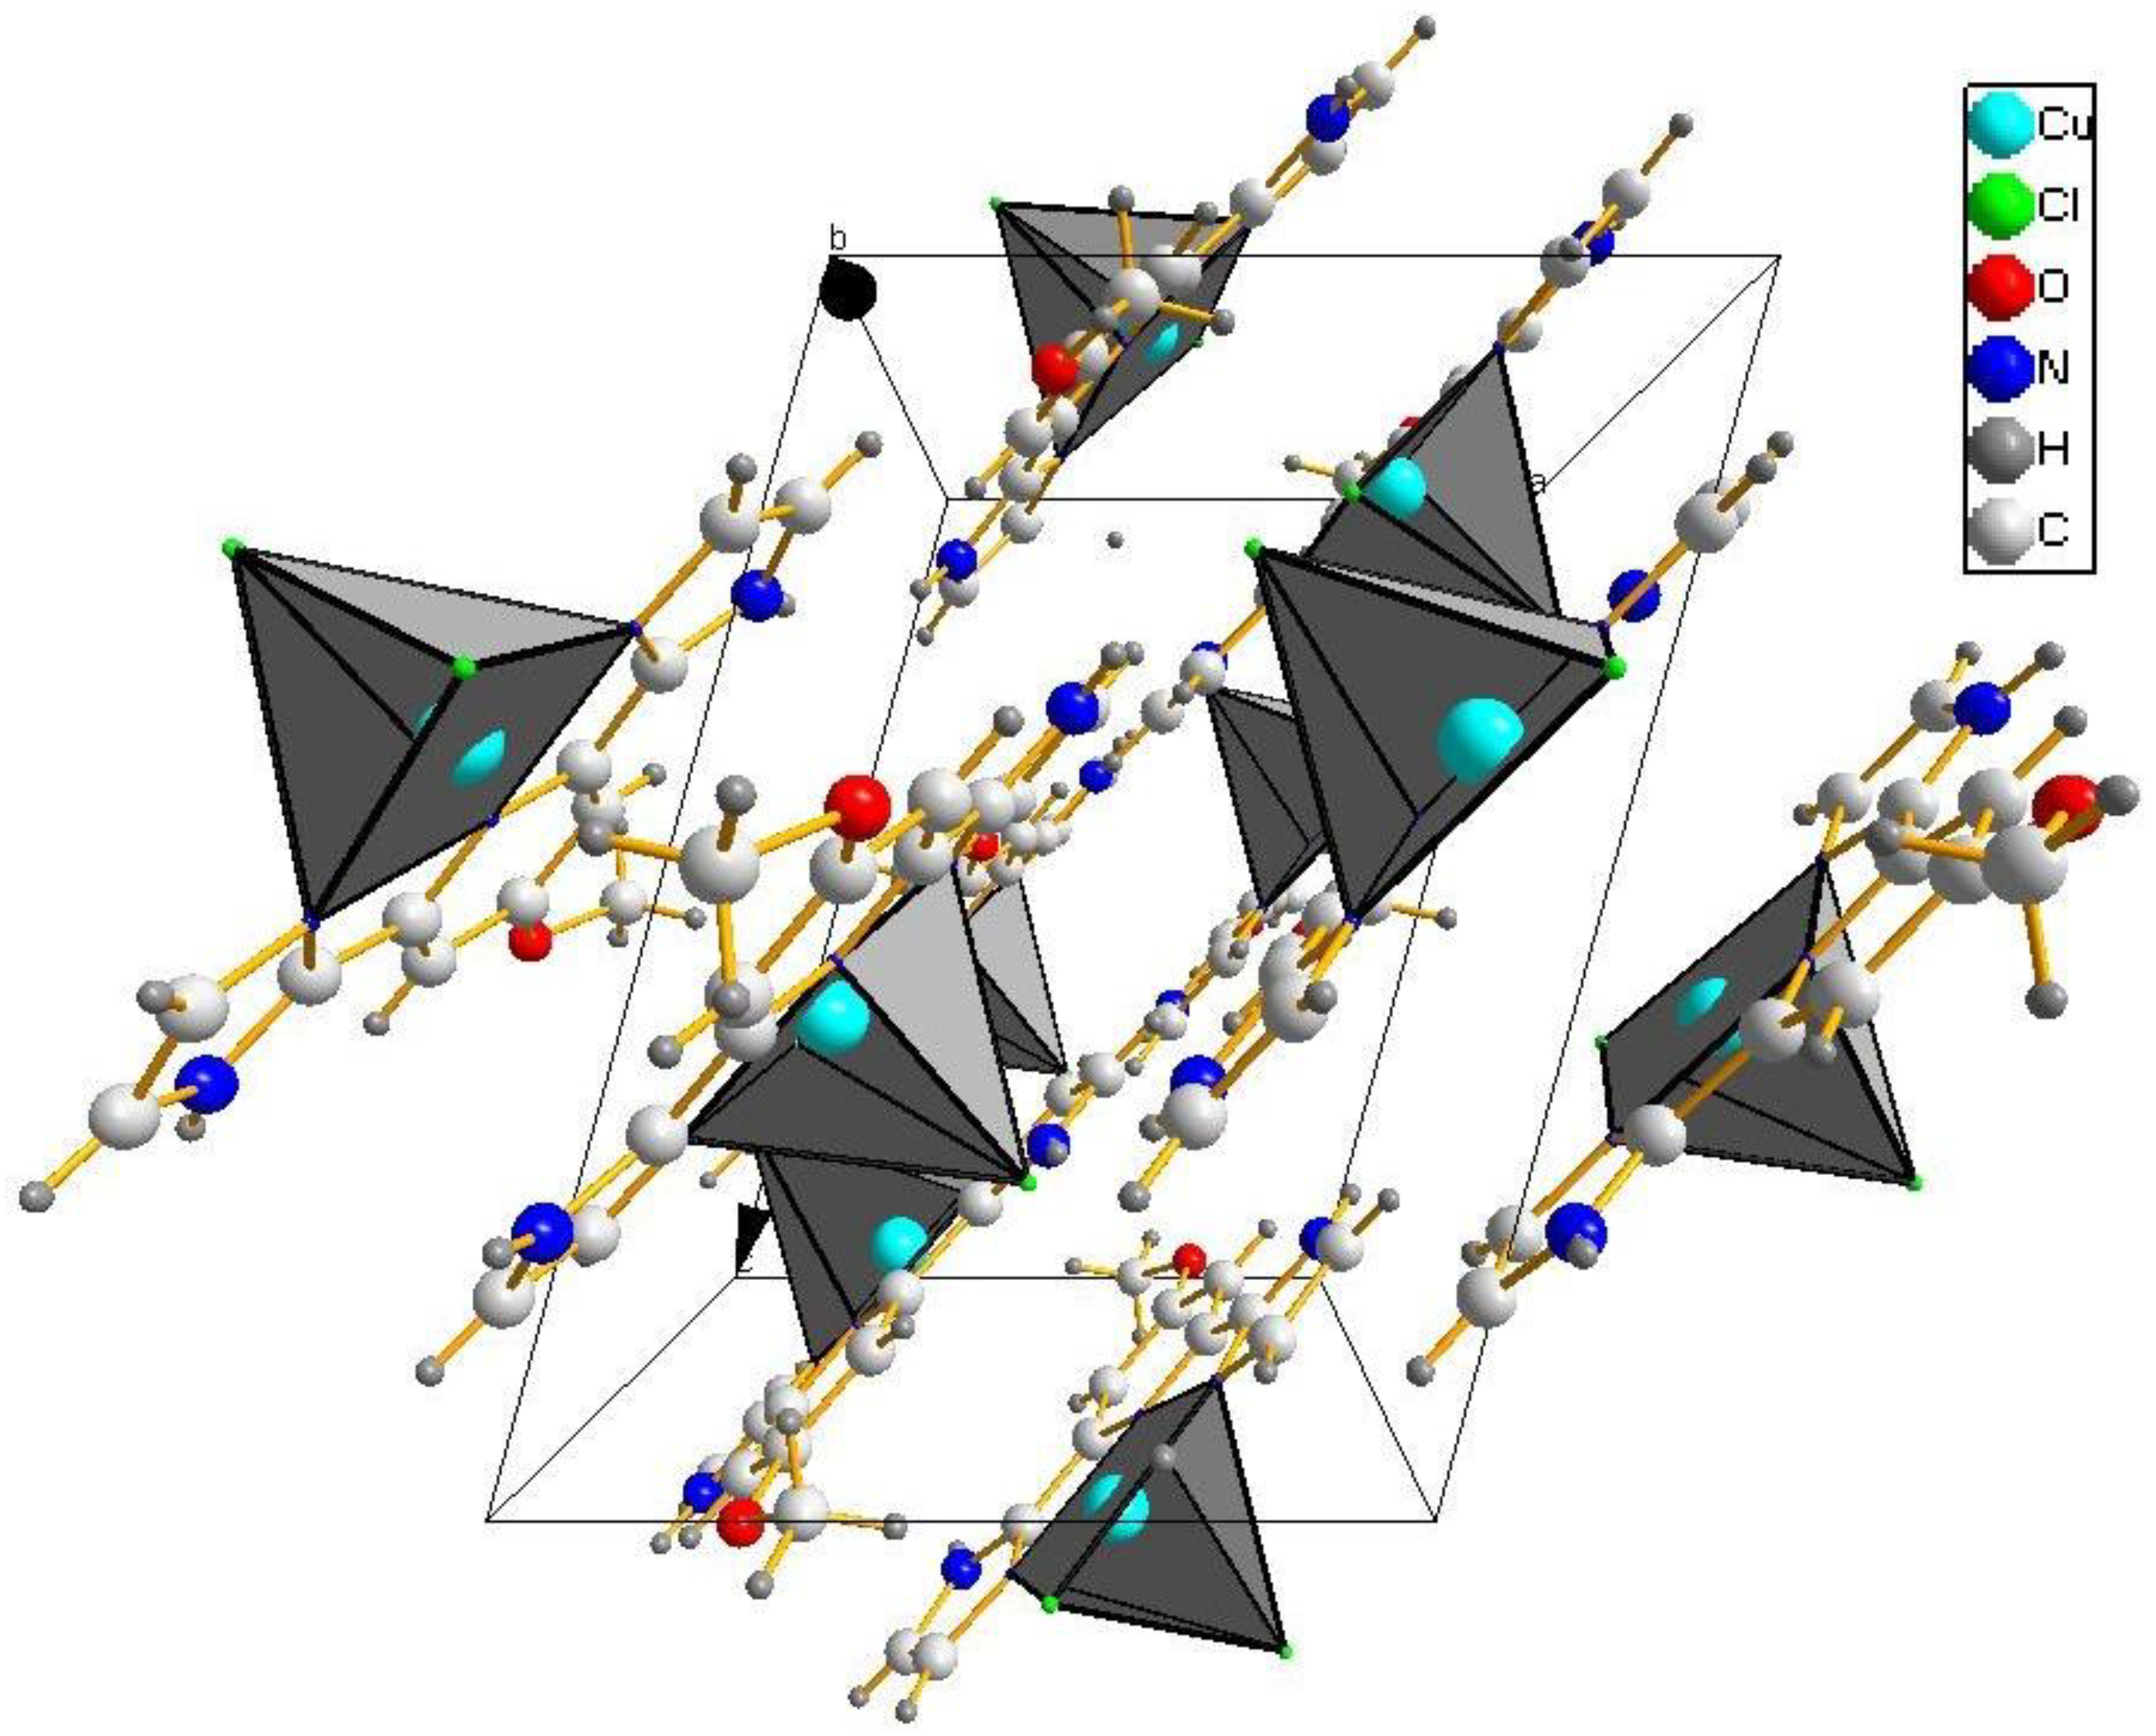
X-ray phase analysis data indicate the crystallinity of powdered samples (Figure S15). However, we were unable to grow single crystals of iron(II) complexes suitable for analysis. In order to determine the coordination ability of the new ligand, we obtained and studied a single crystal of a copper(II) chloride complex with L of composition [CuLCl2].
X-ray diffraction analysis of complex IV (Table 1 and Table 2) indicates that the [CuLCl2] phase crystallizes in a monoclinic crystal system. The crystal packing is molecular (Figure 1). The coordination environment of the central Cu(II) ions is a slightly distorted square pyramid. L is coordinated to copper(II) in a tridentate-cyclic type by the N1 atom of the pyridine and the N2 and N3 atoms of the imidazole cycles. Due to the steric rigidity of chelate cycles, the “central” Cu–N1 distance is 0.05–0.07 Å shorter than the “lateral” ones (thus, 1.983(3) Å and 2.032(3), 2.054(3) Å); the chelate angles N1–Cu–N2 and N1–Cu–N3 are within 78.78(13)–78.94(13)° (Table 1). The ligand molecule L has only a slight deviation from planarity: the angle of inclination of the root-mean-square planes of the imidazole fragments with respect to the plane of the pyramidal fragment does not exceed 1°, and the methyl group is deviated by only 4°. The coordination polyhedron of copper(II) is completed into a tetragonal pyramid due to two chloride ions (dCu–Cl is equal to 2.2137(11) Å in the equatorial plane and 2.6761(11) Å in the axial position). Additionally, the structure is stabilized by stacking interactions between the two nearly planar organic ligands of adjacent molecules with the shift in the equatorial plane and the mean-square distance between the square pyramidal bases of about 3.42(8) Å. Neighboring molecules are located with an offset in the equatorial plane (Figure 2). The centroids of such pseudo-dimers form a two layered close packing motive in the (1 0 1) plane system.

2.3. Infrared Spectroscopy

Table 3 shows the main vibrational frequencies (cm−1) in the IR spectra of L (Figure S16) and complexes IIII (Figures S17–S19). In the low-frequency region of spectra IIII (Figure S20) bands appear that can be attributed to FeHS–N valence vibrations.

2.4. Diffuse Reflectance Spectroscopy

In the DRS of complexes (Figures S21–S23) in the region of 1000–900 nm, one wide absorption band is observed. Bands with maxima at 936 nm (I and III) and 923 nm (II) can be attributed to the d-d transition 5T25E in a weak distorted octahedral field of ligands. The position of these bands is characteristic of the spectra of high-spin octahedral iron(II) complexes with nitrogen-containing ligands.
In addition, intense metal-ligand charge transfer bands are observed in the 450–650 nm region ν1 (eg π L * ) (λmax = 433 nm (I); 407 nm (II and III)) and ν2 (t2g π L * ) (λmax = 639 nm (IIII)).

2.5. Mössbauer Spectra

The Mössbauer spectra of complexes IIII are quadrupole doublets (Figure 3, Table 4), their parameters correspond to the HS state of Fe (II).

2.6. Study of the Complexes Magnetic Properties

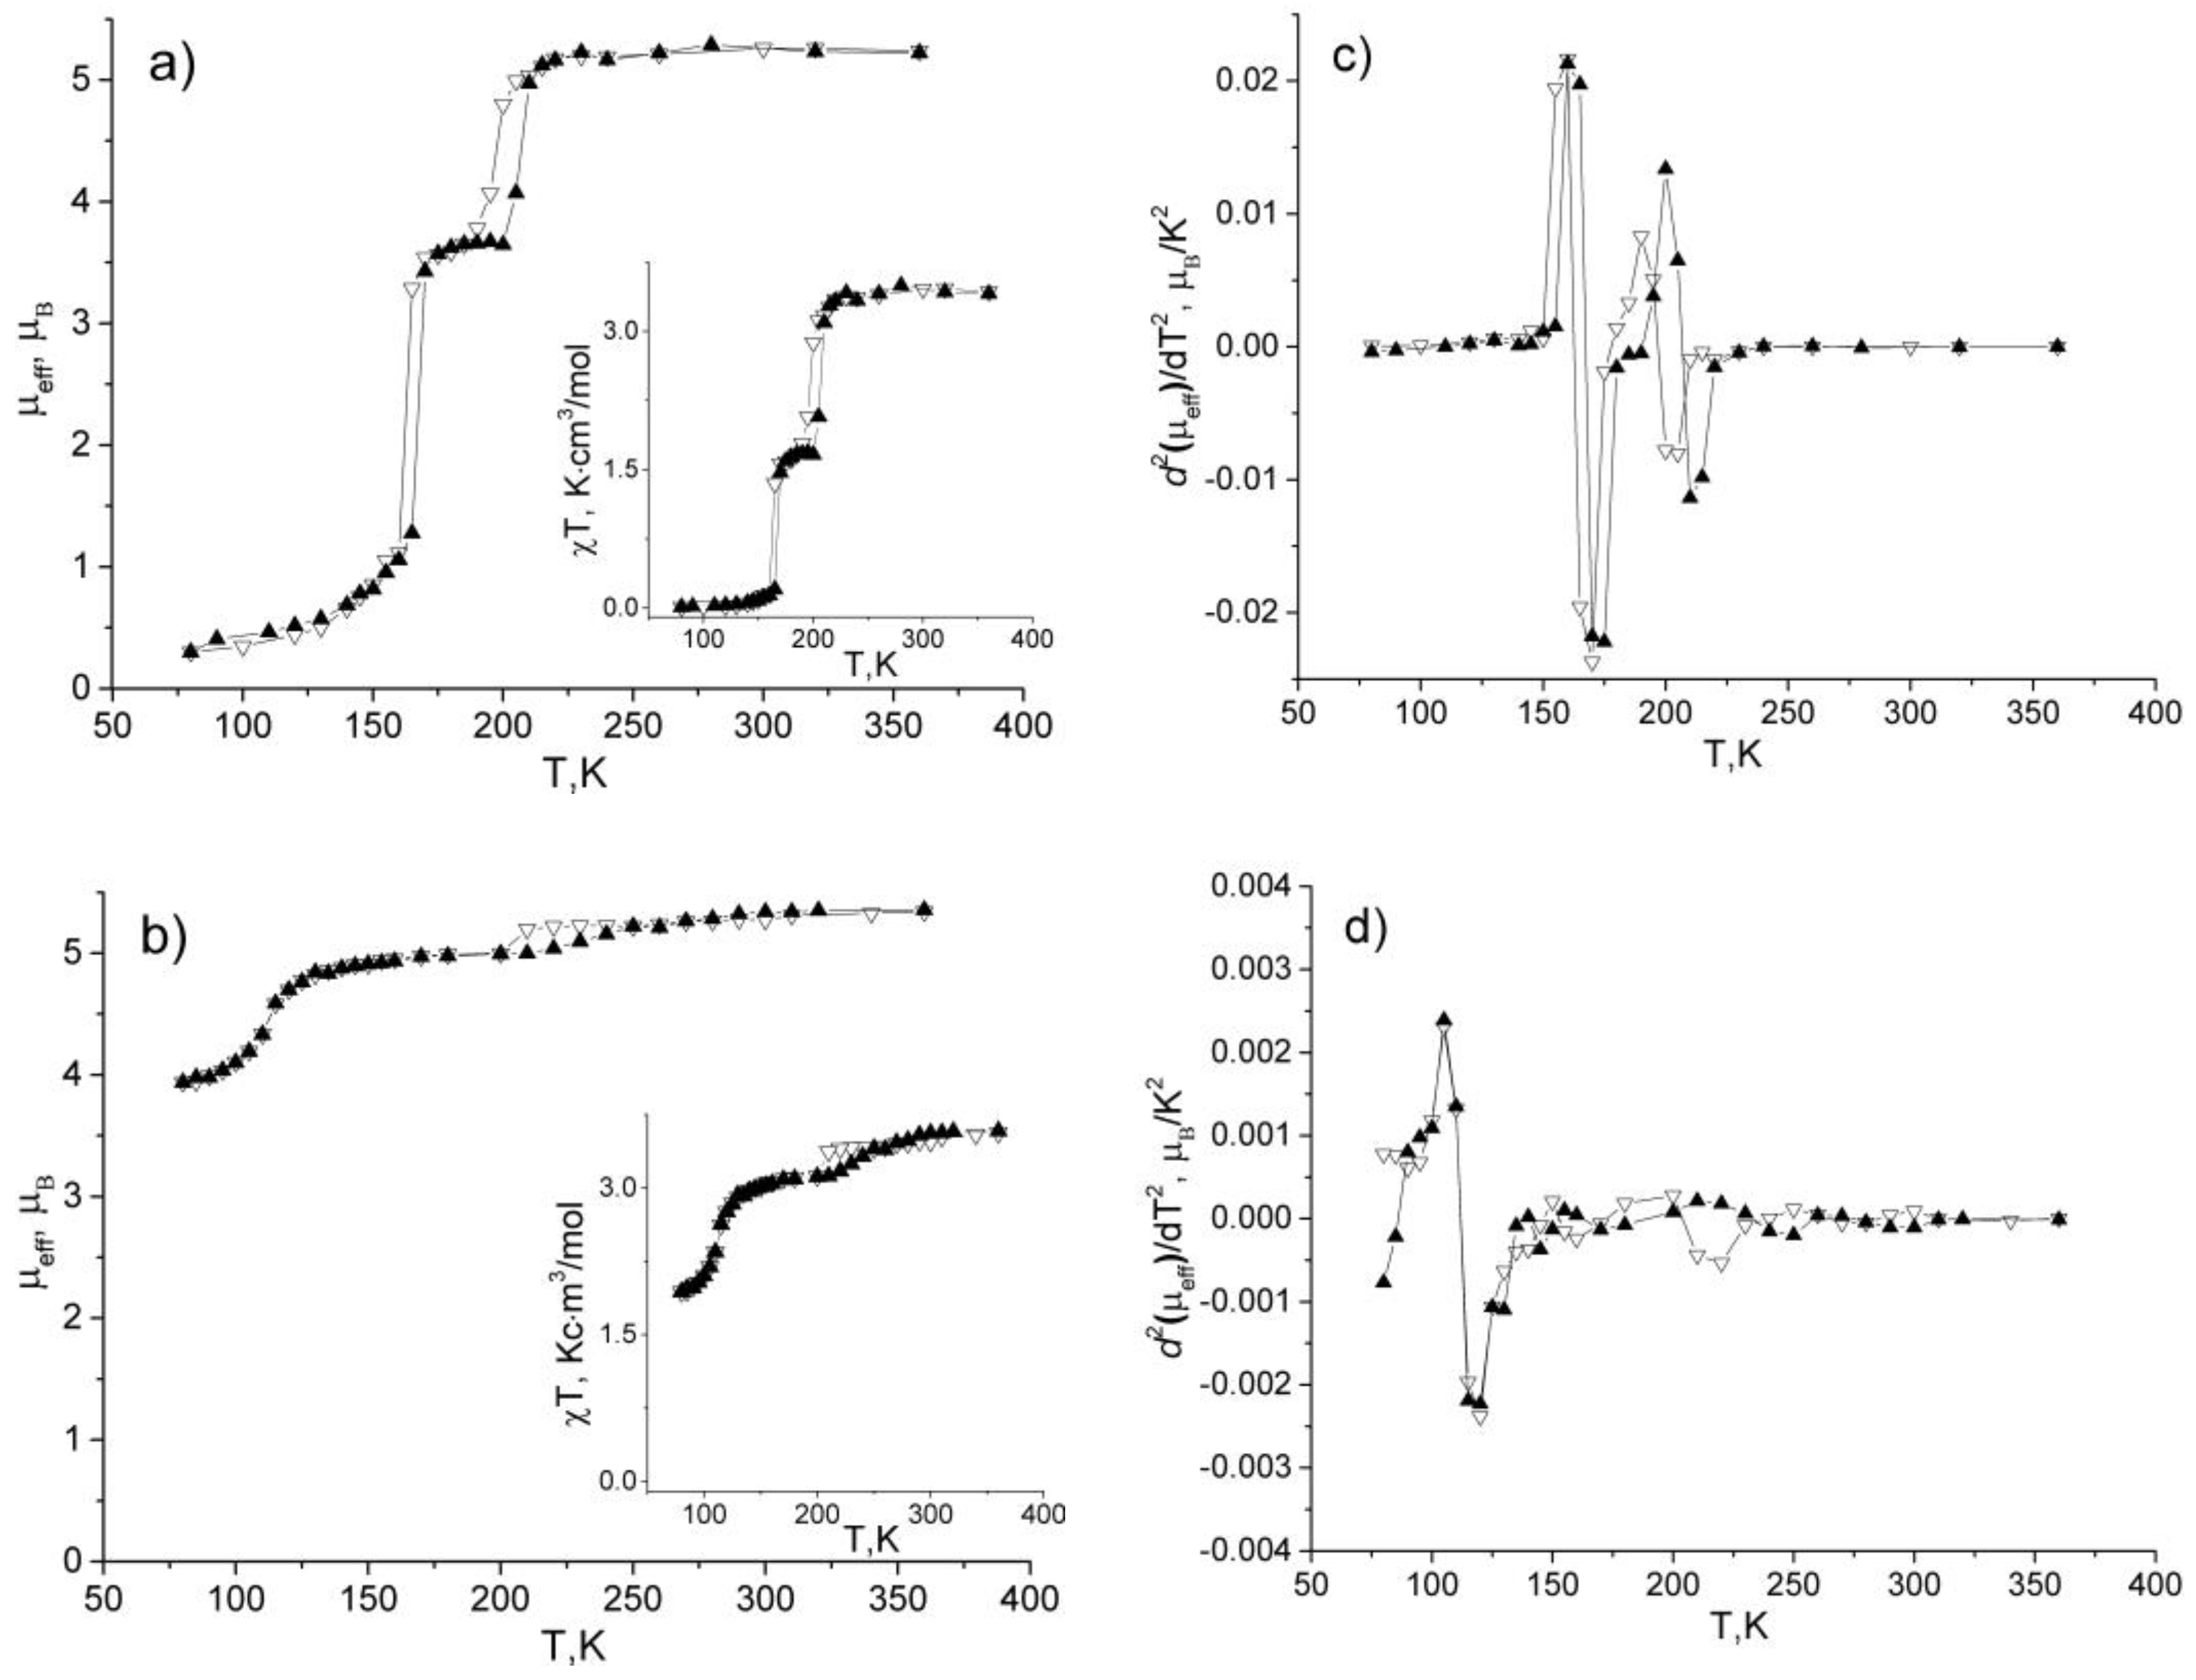
The temperature dependences of the effective magnetic moment for complexes I, II and III, as well as their dehydrated derivatives Ia, IIa, IIIa (measurements were carried out in a helium atmosphere after removal of crystallization water) are shown in Figure 4, Figure 5 and Figure 6.
All the studied compounds are in a high-spin state at room temperature and, with the exception of complex III (measurements on an air-sealed sample), pass into a low-spin state at T < 250–120 K. It should be noted that the most complete transition is observed for complexes I and Ia. In this case, the transitions are accompanied by a reversible color change from orange to various shades of red-violet (an example of a color change for complex Ia is shown in the box in Figure 4a). The values of the effective magnetic moments of dehydrated complexes Ia, IIa and IIIa in the high-spin state at maximum temperature is 5.14, 5.28 and 4.61 μβ, respectively. For the initial complexes IIII, the values 5.26, 5.35 and 4.73 μβ, are observed. The obtained values of µeff differ from the spin only value of 4.9 μβ, however, they range within the experimental values of 4.6–5.7 μβ for Fe (II) [21,22]. For complexes I and Ia in the LS form, there is a small residual effective magnetic moment, which may be due to van Vleck temperature-independent paramagnetism. For compound I, the residual magnetic moment is 0.3 μβ; for Ia it is 0.6 μβ. In the cases of IIa and IIIa, as well as complex II, the lowest values at the temperature of liquid nitrogen are 3.92, 3.43 and 3.94 μβ, respectively.
Complex III is in HS form throughout the studied temperature range (Figure 6). The linear dependence of the inverse magnetic susceptibility 1/(χ′) on temperature made it possible to make an approximation in the form of the Curie-Weiss law (Figure 6 shows it as a solid line):
χ′(T) = NA·µβ2·µeff2/(3k·(T−θ)),
here T is the temperature, k is the Boltzmann constant, NA is the Avogadro constant, µβ is the Bohr Magneton, µeff is the effective magnetic moment and θ is the Weiss constant [21,22].
It should be noted that in Figure 4 and Figure 5, the effective magnetic moment as a function of temperature was calculated using the formula μeff = (8χ′MT)1/2; and it is a macroscopic quantity, generally indicating the interaction between paramagnetic centers. In the form of the Curie-Weiss law, the µeff is a microscopic quantity corresponding to the effective magnetic moment of the paramagnetic center. In case of the absence of interaction between paramagnetic centers (an ideal paramagnetic) or at temperatures at which this interaction can be neglected (T >> θ), these values are the same. Approximation of experimental data in the form of the Curie-Weiss law made it possible to establish the antiferromagnetic nature of the exchange interaction (θ = −15 K) for complex IIIa and to obtain the value of μeff = 4.80 μβ for the Fe(II) ion.
The study of the temperature dependences of the second μeff(T) derivative (Figure 4 and Figure 5) allowed us to determine the temperatures of the direct (Tc↑) and reverse (Tc↓) transitions for the studied compounds (Table 5). For complex Ia, a one-stage transition with a small hysteresis is observed (Tc↓ = 213 K, Tc↑ = 217 K, ΔTc = 4 K). In the case of the initial compound I, the nature of the μeff(T) dependence is more intricate and the transition is two-stage. It should be noted that the hysteresis value for the low-temperature stage is the same as for the dehydrated complex (Tc1↓ = 163 K, Tc1↑ = 167 K, ΔTc1 = 4 K). At the same time, the hysteresis value for the second stage is 2.5 times greater (Tc2↓ = 197 K, Tc2↑ = 207 K, ΔTc2 = 10 K) than for the low-temperature stage. A similar nature of the effect of crystallization water can be observed in the cases of complexes II and IIa, for which hysteresis for the low-temperature stage is not observed. (Tc1↓ = Tc1↑ = 112 K, ΔTc1 = 0 K). The second stages for complexes II and IIa demonstrate significant hysteresis (II: Tc2↓ = 204 K, Tc2↑ = 234 K, ΔTc2 = 30 K; IIa: Tc2↓ = 201 K, Tc2↑ = 222 K, ΔTc2 = 21 K). In the presence of crystallization water, the hysteresis value is 1.4 times greater than in the dehydrated state. In the case of complexes III and IIIa in the studied temperature range, SCO is observed only for IIIa, and the transition is one-stage (Tc↓ = Tc↑ = 121 K, ΔTc = 0 K).

3. Discussion

3.1. Structure of the [CuLCl2]

Pentacoordinated Cu(II) complex IV was isolated with one tridentate chelate ligand and two chloro ligands, demonstrating square pyramidal geometry with CuN3Cl2. The lengths of the N–Cu(II) bonds vary depending on the coordinated heterocycle; the shortest ones are observed for N atoms of the pyridine moiety, while two Cu–N(imidazole) bonds are noticeably longer (Table 2). This trend is observed for the compounds featuring similar coordination nodes [23]. According to the authors of the article [24], the bond lengths of N(4R-pyridine)–Cu(II) vary depending on the fragment in the 4th position of the ring, and the introduction of an electron-donating group into the 4-position of pyridine led to a decrease in the Cu–N bond length.
Neighboring molecules are located with an offset in the equatorial plane, so, the structure is stabilized by stacking interactions between the two nearly planar organic ligands and pseudo-dimerization is observed. It should be noted that the possibility of formation such stacking interactions between ligand parts is very characteristic of five-coordinated copper(II) complexes. Usually, this coordinate in the complex is supplemented by long-distance contacts with small ligands, but in this case we can see the organic ligand, which is sufficiently large and rigid, and apparently stacking additional benefits in energy.

3.2. IR Spectra of the Complexes IIII

In the high-frequency region of IR spectra IIII, bands with a maximum at 3500–3365 cm−1, associated with ν(OH) vibrations are observed; they indicate the presence of crystallization water in the composition of complexes. In the IR spectra of both the ligand and all complexes in the region of 3160–3110 cm−1, there are bands associated with ν(NH) vibrations, and for the complexes the bands are slightly shifted to the high frequency range, thus they indicate the formation of hydrogen bonds of the network. Within the range of 3090–2830 cm−1 of the L and IIII spectra, there are bands of ν(CH) vibrations of pyridine and imidazole rings and methyl group of L, whose positions in all spectra coincide well with each other. In the spectra of both the ligand and all complexes in the region of 2815–2800 cm−1, bands associated with ν(O–CH3) oscillations are observed, and for complexes they are slightly shifted to the low-frequency range.
Bands of valence and deformation oscillations of heterocycles are observed in the IR spectrum L in the region of 1610–1430 cm−1, which are very sensitive to coordination. In spectra IIII, these bands appear within the range of 1680–1400 cm−1. A significant change in the range indicates coordination of N atoms of imidazole and pyridine to Fe(II) [25].
It should be noted that the spectra of complexes IIII practically coincide not only in the region of ν(C–H), but also in the region of skeletal oscillations within the range of 1400–700 cm−1. This confirms the conclusion about the isotype of the cations of the studied compounds.
In spectra I, II, there are bands of valence vibrations of the corresponding anions that are not split and are not displaced in comparison with the bands positions in the IR spectra of the potassium salts of these anions, which indicate their external position.

3.3. DRS of the Complexes IIII

From the DRS data, it is easy to calculate the values of the ligand field splitting parameter in the crystal of high-spin Fe(II) complexes ΔHS = ν(5T25E) and Racah parameters B = ΔHS/19; C = 4.41 B (Table 6). The average electron pairing energy (P) for high-spin iron(II) ions was approximately calculated based on the spectral data obtained by the formula: P = ν1 + ΔHS − ν2 [26]. The resulting values are slightly higher than the value P = 17,600 cm−1 for [Fe(H2O)6]2+ [27].
The reviews [28,29,30] define the conditions for the SCO’s existence as follows: H S = 10 D q H S < P < 10 D q L S = L S . If 10DqHS < 10,000 cm−1, the complex remains high-spin at all temperatures; if 10DqHS ≅ 11,000–12,500 cm−1, the complex undergoes SCO when cooled. The implementation of the first inequality and the approximation to a non-strict equality for the value of the splitting parameters indicate that the SCO manifestation in complexes IIII is very likely.

3.4. Mössbauer Spectra of the Complexes IIII

Mössbauer spectra of previously studied iron(II) complexes with 2,6-bis(1H-imidazol-2-yl)pyridine derivatives [10,13,15] with the same anions as in this work show that in all these compounds Fe(II) is only in the LS state at room temperature, with the exception of the iron complex with 2,6-bis(4,5-dimethylimidazol-2-yl)pyridine (L*) of the composition [Fe(L*)2]SO4·0.5H2O [13]. On the contrary, the spectra of the samples studied in this work indicate the presence of Fe(II) only in the HS state. A comparison of the spectra of the complexes [FeL2]SO4∙2H2O (I) and [Fe(L*)2]SO4·0.5H2O shows that they have almost the same isomeric shift, but significantly different values of quadrupole splitting (1.88 mm/s compared to 2.25 mm/s). This distinction may be due to a difference in the structure of ligands and/or the content of hydrated water molecules, as well as to a different distortion of the coordination polyhedron FeN6; these factors can lead to a different arrangement of ions in the crystal lattice, which in turn will lead to a change in the gradient of the electric field on the iron core.

3.5. Magnetic Properties of the Complexes

As shown above, the studied compounds exhibit spin crossover at temperatures below room temperature. It should be noted that when the auxochromic methoxy group was introduced into the composition of 2,6-bis(1H-imidazol-2-yl)pyridine, for complexes with 2,6-bis(1H-imidazol-2-yl)-4-methoxypyridine, the spin crossover temperatures significantly shifted to the low temperature region [14,15].
It should also be noted that the nature of the spin crossover is significantly influenced by crystallization water. First of all, for complex I, the presence of crystallization water complicates the form of μeff(T) dependence; thus, the transition for I is two–stage, while for Ia is one-stage. For the studied compounds, the presence of crystallization water leads to an increase in the μeff in the high-spin state and may cause a decrease in the residual μeff in the low-spin state. It is important to note that in these compounds, SCO is observed in the cryogenic region close to the lower limit of the temperature range of the Faraday balance (boiling point of liquid nitrogen). In this regard, it is impossible to reliably conclude whether the observed low-temperature values of µeff for complexes II, IIa and IIIa are due to the residual magnetic moment or that the SCO continues at temperatures below the temperature range of the device. As shown earlier [10,11,12,13,14,15,16,17], crystallization water has a significant effect on the transition temperature. For the pair I and Ia, the presence of crystallization water lowers the transition temperature of the first stage. In the case of II and IIa, the temperature of the first stage does not change, but there is a trend to decrease the temperatures of the direct and reverse transitions for the second stage. For III and IIIa, it was shown that the crossover is not observed for the initial complex in the studied temperature range. At the same time, it cannot be reliably stated that for the III complex the crossover is not observed in the temperature range below the boiling point of liquid nitrogen. Thus, it can be concluded that for the studied compounds, the presence of crystallization water may cause a decrease in the temperatures of the direct and reverse SCO for at least one of the crossover stages. Crystallization water also has a significant effect on the hysteresis value (Table 5). So, in the case of the pair I and Ia, the crystallization water causes the appearance of the second stage of the transition, the hysteresis for which is 2.5 times greater than for the first stage. For a pair II and IIa, the presence of crystallization water causes a hysteresis increase by 1.4 times.
Thus, the crystallization water for the studied compounds influences both the values of the effective magnetic moments and the SCO temperature as well as the hysteresis values.

4. Materials and Methods

All commercially available solvents and reagents were analytical grade and used without further purification.
FeSO4·7H2O from Acros Organics, KReO4 and BaBr2 from Sigma-Aldrich, ascorbic acid of the “medical” qualification, and ethanol “rectificate” were used for the synthesis of complexes.
Dimethyl 4-hydroxypyridine-2,6-dicarboxylate (1) and dimethyl 4-methoxypyridine-2,6-dicarboxylate (2). Chelidamic acid hydrate (20 g, 99.5 mmol) was dissolved in a solution of MeOH (150 mL) and concentrated H2SO4 (17 mL). The mixture was refluxed for 24 h and then allowed to cool down to room temperature. A saturated NaHCO3 solution was added up to pH 2.0, the residue was filtered off, washed with H2O and dried to give 1 as a white solid (7.4 g, 35%). The filtrate was extracted with CH2Cl2, the combined organic extracts were dried over MgSO4 and the solvent was removed under vacuum to give 2 as a white solid (7.5 g, 34%).
(1): m.p. 110 °C (decomp.). IR spectrum (KBr), ν, cm−1: 3433, 1741. 1H NMR spectrum (400 MHz), δ, ppm: 3.84 s (6H, 2CH3OC(O)), 7.52 s (2H, H-3, H-5). 13C NMR spectrum, (100 MHz), δC, ppm: 166.4, 165.2, 149.6, 115.7, 53.1. Mass spectrum: m/z calcd. for C9H9NO5 [M]+ 211.0475; found 211.0478.
Dimethyl 4-methoxypyridine-2,6-dicarboxylate (2). Dimethyl 4-hydroxypyridine-2,6-dicarboxylate 1 (6.8 g, 32.2 mmol) was heated with CH3I (5.5 g, 2.4 mL, 38.7 mmol) and K2CO3 (6.7 g, 48.5 mmol) in DMF (50 mL) under stirring at 50 °C for 8.5 h. Then the mixture was allowed to cool down to room temperature and H2O (100 mL) was added. The residue was filtered off, washed with H2O and dried to give 2 as a white solid (5.1 g, 70%).
(2): m.p. 127.8–128.2 °C. IR spectrum (KBr), ν, cm−1: 1716, 1726. 1H NMR spectrum (300 MHz), δ, ppm: 3.90 s (6H, 2CH3OC(O)), 3.97 s (3H, CH3O), 7.72 s (2H, H-3, H-5). 13C NMR spectrum, (125 MHz), δC, ppm: 167.0, 164.6, 149.4, 113.8, 56.2, 52.6. Mass spectrum: m/z calcd. for C10H11NO5 [M]+ 225.0632; found 225.0635.
4-Methoxypyridine-2,6-dicarboxamide (3). Dimethyl 4-methoxypyridine-2,6-dicarboxylate 2 (5.1 g, 22.7 mmol) was dissolved in MeOH (190 mL) and NH4OH (25%, 50 mL) was added. The mixture was refluxed for 48 h. After cooling down to room temperature, the residue was filtered off, washed with Et2O and dried to give 3 as a white solid (4.2 g, 95%).
(3): m.p. 299.7–300.0 °C. IR spectrum (KBr), ν, cm−1: 3317, 3288, 1672. 1H NMR spectrum (300 MHz), δ, ppm: 4.01 s (3H, CH3O), 7.80 s (2H, H-3, H-5). 13C NMR spectrum, (125 MHz), δC, ppm: 168.5, 167.9, 150.0, 111.3, 56.1. Mass spectrum: m/z calcd. for C8H9N3O3 [M]+ 195.0638; found 195.0634.
4-Methoxypyridine-2,6-dicarbonitrile (4). 4-Methoxypyridine-2,6-dicarboxamide 3 (3.5 g, 17.95 mmol) was suspended in THF (25 mL) under stirring at 0 °C and Et3N (9.1 g, 90.0 mmol) was added. Trifluoroacetic anhydride (9.4 g, 44.76 mmol) was slowly added by dropwise for 1 h. Then the mixture warmed to room temperature and stirred overnight. A saturated NaHCO3 solution was slowly added to pH 8.0, the residue was filtered off, washed with H2O, dried and washed with hexane, dried in vacuo to give 4 as a white solid (1.88 g, 66%).
(4): m.p. 137–139 °C. IR spectrum (KBr), ν, cm−1: 2243, 1591. 1H NMR spectrum (400 MHz), δ, ppm: 3.97 s (3H, CH3O), 7.37 s (2H, H-3, H-5). 13C NMR spectrum, (125 MHz), δC, ppm: 166.8, 136.2, 117.5, 115.4, 56.5. Mass spectrum: m/z calcd. for C8H5N3O [M]+ 159.0427; found 159.0429.
2,6-Bis(1H-imidazol-2-yl)-4-methoxypyridine (L). 4-Methoxypyridine-2,6-dicarbonitrile 4 (1.08 g, 6.79 mmol) was dissolved in MeOH (6.8 mL) and sodium methoxide (0.3 mL of 30% solution in MeOH) was added. The mixture was stirred for 2.5 h at rt and then aminoacetaldehyde diethyl acetal (1.8 g, 13.5 mmol) was added. The reaction mixture was acidified with acetic acid (0.8 mL), heated to 50 °C for 1 h and then cooled to rt. Then MeOH (14 mL) and 6 N HCl in H2O (3.4 mL) were added, and the reaction mixture was heated to reflux for 5 h. After cooling down to room temperature, the obtained solid was diluted with MeOH (5 mL), filtered off, and washed with MeOH (5 mL). The residue was washed with a solution of NaOH (1 g) in H2O (12 mL) and H2O adjusted to pH 8.0, then dried under vacuum to give L∙1.2H2O as a white solid (1.2 g, 67%).
(L∙1.2H2O): m.p. 268°C (decomp.). IR spectrum (KBr), ν, cm−1: 3383, 3138, 3113, 1606, 1570, 1551, 1477, 1437. 1H NMR spectrum (400 MHz), δ, ppm: 3.95 s (3H, CH3O), 7.13 s (2H, HAr), 7.39 s (2H, HAr). 7.47 s (2H, HAr), 12.65 s (2H, NH). 13C NMR spectrum, (100 MHz), δC, ppm: 167.6, 149.9, 146.0, 130.22, 130.18, 119.0, 118.9, 103.6, 56.1. Mass spectrum: m/z calcd. for C12H11N5O [M]+ 241.0958; found 241.0959.
Found: % C = 54,7; % H = 4.9; % N = 26.4.
Anal. Calc. for C12H11N5O∙1.2H2O (262.87 g/mol): % C = 54.8; % H = 5.1; % N = 26.6.
Synthesis of [FeL2]SO4∙2H2O (I). A weighted portion of FeSO4·7H2O (0.14 g, 0.5 mmol) was dissolved in 3 mL of distilled water acidified with 0.05 g ascorbic acid. A solution of L∙1.2H2O (0.26 g, 1 mmol) in 10 mL of ethanol was slowly added to the resulting solution. After mixing the solutions, a bright orange solution was formed, from which a fine orange precipitate fell out within a few minutes. The precipitate was kept in solution while being stirred on a magnetic stirrer for 3 h. Precipitate I was filtered out, washed several times with water and ethanol, and dried in the air (0.22 g, 73%).
Found for I: % C = 44.4; % H = 4.1; % N = 20.1; % S = 4.5. Anal. Calc. for C24H26N10O8FeS (670.44 g/mol): % C = 43,0; % H = 3.9; % N = 20.9; % S = 4.8.
Synthesis of [FeL2](ReO4)2∙H2O (II). Synthesis was carried out similarly to I, but at the stage of formation of a bright orange solution, without waiting for I precipitation, a hot KReO4 solution (0.29 g, 1 mmol in 10 mL H2O) was added. A fine orange precipitate instantly fell out, which was kept in solution while being stirred on a magnetic stirrer for 1 h. Precipitate II was filtered out, washed several times with water and ethanol, and dried in the air (0.45 g, 95%).
Found for II: % C = 29.0; % H = 2.5; % N = 13.9. Anal. Calc. for C24H23FeN10O10.5Re2 (1056.78 g/mol): % C = 27.5; % H = 2.2; % N = 13.4.
Synthesis of [FeL2]Br2∙2H2O (III). A weighted portion of FeSO4·7H2O (0.14 g, 0.5 mmol) was dissolved in 3 mL of distilled water acidified with 0.05 g ascorbic acid. A warm solution of BaBr2 (0.15 g, 0.5 mmol in 3 mL H2O) was slowly added to the resulting solution, and 3 h after the complete sedimentation of BaSO4, the solution was filtered out. A solution of L∙1.2H2O (0.26 g, 1 mmol in 10 mL of ethanol) was added to the mother liquor. After mixing, a dark orange solution was formed, from which a fine orange precipitate fell out within an hour. Precipitate III was filtered out, and washed several times with water and ethanol, dried in air (0.30 g, 91%).
Found for III: % C = 39.7; % H = 3.9; % N = 19.2. Anal. Calc. for C24H26FeN10O4Br2 (734.19 g/mol): % C = 39.3; % H = 3.6; % N = 19.1.
Synthesis of [CuLCl2] (IV). CuCl2·2H2O (0.0085 g, 0.05 mmol) was dissolved in 2 mL of distilled water acidified with 0.005 g ascorbic acid. A solution of L∙1.2H2O (0.026 g, 0.1 mol in 5 mL of ethanol) was slowly added to the resulting solution. After mixing, a green solution was formed, from which green crystals fell out within a week. Crystals IV were filtered out, washed several times with water and ethanol, and dried in the air (0.015 g, 79%).
Found for IV: % C = 37.8; % H = 3.1; % N = 18.1. Anal. Calc. for C12H11N5OCuCl2 (375.70 g/mol): % C = 38.4; % H = 3.0; % N = 18.6.
The IR spectra of organic compounds were recorded in KBr on a Bruker Vector-22 spectrometer.
The 1H and 13C NMR spectra were recorded on Bruker AV-300 (300.13 and 75.5 MHz, respectively), Bruker AV-400 (400.13 and 100.61 MHz), Bruker DRX-500 (500.13 and 125.76 MHz) spectrometers (Germany) at room temperature using as solvents CDCl3, DMSO-d6, D2O (purity 99.8%); the chemical shifts were measured relative to the residual proton and carbon signals of the deuterated solvent with respect to TMS as the internal standard.
The melting points were measured with a Mettler Toledo FD-900 melting point apparatus. The high-resolution mass spectra (electron impact, 70 eV) were run on a Thermo Electron DFS instrument.
The progress of reactions and the purity of the isolated compounds were monitored by TLC on Sorbfil PTLC-AF-A-UV plates using chemically pure grade chloroform as eluent.
The CHNS elemental analyses of complexes were performed on a EuroVector EA3000 Elemental Analyser.
Thermal analysis of the samples was performed on an STA 409 PC Luxx simulta-neous thermal analyzer manufactured by NETZSCH-Gerätebau GmbH. Thermogravimetric (TG) and differential scanning calorimetric (DSC) data were recorded during the experiment. The analysis was carried out in corundum ceramic crucibles. The heating was carried out at a rate of 10 K/min in the air.
X-ray powder diffraction data were collected on a Shimadzu XRD 7000 diffractometer (CuKα radiation (λ = 1.5406 Å), Ni filter, scintillation detector) at room temperature.
Single-crystal X-ray diffraction data were collected using the graphite monochromatized MoKα-radiation (λ = 0.71073 Å) at 150(2) K on the X8APEX Bruker Nonius diffractometer equipped with a 4K CCD area detector. The ϕ-scan technique was employed to measure intensities. Absorption corrections were applied empirically using the SADABS program [31]. Structure was solved by the direct methods of the difference Fourier synthesis and further refined by the full-matrix least squares method using the SHELXTL package [32]. Atomic thermal parameters for non-hydrogen atoms were refined anisotropically. The positions of hydrogen atoms were calculated corresponding to their geometrical conditions and refined using the riding model. The main parameters of structural experiments are listed in Table 1. The coordinates of atoms and other parameters for structure IV were deposited with the Cambridge Crystallographic Data Centre (CCDC 2252412www.ccdc.cam.ac.uk/data_request.cif accessed on 29 March 2023). Selected bond lengths and angles are listed in Table 2.
IR absorption spectra were registered on IRAffinity-1S (Shimadzu) and Scimitar FTS 2000 spectrometers within the range of 4000 to 400 cm−1, and Vertex 80 spectrometers within the range of 400 to 200 cm−1. The samples were prepared in the form of suspensions in KBr, vaseline and fluorinated oils as well as in polyethylene.
The diffuse reflectance spectra (DRS) were recorded on a Shimadzu UV-3101 PC scanning spectrometer at room temperature.
The Mössbauer spectra of iron(II) complexes were measured at a room temperature using an NP-610 spectrometer with a 57Co (Rh) radiation source. The spectra were processed to determine the values of isomer shift δ (with respect to α-Fe) and quadrupole splitting ΔEQ.
Static magnetic susceptibility was measured by the Faraday method using torsion quartz microbalance with electromagnetic compensation. The temperature stabilization of the samples (~1 K) in the temperature range 80–360 K was carried out with the Delta DTB9696 temperature controller (Delta Electronics, China). The heating or cooling mean rate was ~2–3 K/min. The fluctuations in magnetic field strength (7300 Oe) were less than 1%. The study of dehydrated complexes (IaIIIa) was carried out after the vacuum drying of the samples in the measurements chamber. The samples (~20 mg) placed in the open quartz cellules were vacuumed at a pressure 10−2 torr. After that, the chamber was filled up with the helium at the pressure 5 torr. The investigated compounds IIII were placed in sealed quartz cellules with the air atmosphere at 760 Torr. The values of the effective magnetic moment were calculated after correction for the diamagnetic contribution according to the Pascal scheme as μeff = (8χ′MT)1/2, where χ′M is corrected molar magnetic susceptibility. The temperatures of the direct (Tc↑) and reverse (Tc↓) transitions were determined using the condition d2eff)/dT2 = 0.

5. Conclusions

In this work, we synthesized new compounds of iron(II) with 2,6-bis(1H-imidazol-2-yl)-4-methoxypyridine (L) of the compositions [FeL2]SO4∙2H2O, [FeL2](ReO4)2∙H2O and [FeL2]Br2∙2H2O, as well as the copper(II) complex [CuLCl2]. To do this, we have presented a convenient synthetic pathway for the synthesis of an imidazole-pyridine-based ligand with an auxochromic group in the central moiety. The study of the temperature dependence of μeff of the obtained complexes showed that they exhibit the 1A15T2 spin-crossover, the nature and temperature of which depend on the composition of the compound. The synthesized complexes are bifunctional, the spin-crossover in them is accompanied by thermochromism (reversible color change from orange to red-violet), which is of independent interest.

Supplementary Materials

The supporting information can be downloaded at: https://www.mdpi.com/article/10.3390/ijms24129853/s1.

Author Contributions

Manuscript conception, writing and original draft preparation, data analysis and interpretation, L.G.L.; synthesis of the studied complexes, diffuse reflectance and IR spectroscopy, writing and original draft preparation, O.G.S.; X-ray analysis, N.V.K.; studies of magnetic properties, E.V.K.; methodology and investigation of the ligand synthesis, A.Y.T. and I.A.O.; Mössbauer spectroscopy methods, S.A.P. All authors have read and agreed to the published version of the manuscript.

Funding

This research work was supported by the Ministry of Science and Higher Education of the Russian Federation (projects No. 121031700313-8, 122040400035-3).

Institutional Review Board Statement

Not applicable.

Informed Consent Statement

Not applicable.

Data Availability Statement

The data presented in this study are available on request from the corresponding authors.

Acknowledgments

The authors express their gratitude to M.A. Matveeva for recording the diffraction patterns, S.A. Martynova and A.A. Shapovalova for obtaining IR spectra, and I.V. Yushina for shooting diffuse reflection spectra.

Conflicts of Interest

The authors declare no conflict of interest.

References

  1. Gütlich, P.; Goodwin, H. Spin Crossover in Transition Metal Compounds I–III. In Topics in Current Chemistry; Springer: Berlin/Heidelberg, Germany, 2004; pp. 233–235. [Google Scholar]
  2. Halcrow, M.A. Spin-Crossover Materials Properties and Applications; John Wiley & Sons Ltd.: London, UK, 2013; 562p. [Google Scholar]
  3. Halcrow, M.A. The effect of ligand design on metal ion spin state—Lessons from spin crossover complexes. Crystals 2016, 6, 58. [Google Scholar] [CrossRef] [Green Version]
  4. Boillot, M.-L.; Zarembowitch, J.; Sour, A. Ligand-Driven Light-Induced Spin Change (LD-LISC): A Promising Photomagnetic Effect. In Spin Crossover in Transition Metal Compounds II; Springer: Berlin/Heidelberg, Germany, 2004; pp. 261–276. [Google Scholar] [CrossRef]
  5. Shakirova, O.G.; Lavrenova, L.G. Spin crossover in new iron(II) coordination compounds with tris(pyrazol-1-yl)methane. Crystals 2020, 10, 843. [Google Scholar] [CrossRef]
  6. Bousseksou, A.; Molnár, G.; Salmon, L.; Nicolazzi, W. Molecular spin crossover phenomenon: Recent achievements and prospects. Chem. Soc. Rev. 2011, 40, 3313–3335. [Google Scholar] [CrossRef] [PubMed]
  7. Molnár, G.; Rat, S.; Salmon, L.; Nicolazzi, W.; Bousseksou, A. Spin Crossover Nanomaterials: From Fundamental Concepts to Devices. Adv. Mater. 2018, 30, 1703862. [Google Scholar] [CrossRef] [PubMed]
  8. Ibrahim, N.M.J.N.; Said, S.M.; Mainal, A.; Sabri, M.F.M.; Abdullah, N.; Hasnan, M.M.I.; Hassan, H.C.; Salleh, M.F.M.; Mahiyiddin, W.W.M. Molecular design strategies for spin crossover (SCO) metal complexes (Fe(II) and Co(II)) for thermoelectricity. Mater. Res. Bull. 2020, 126, 110828. [Google Scholar] [CrossRef]
  9. Boča, M.; Jameson, R.F.; Linert, W. Fascinating variability in the chemistry and properties of 2,6-bis-(benzimidazol-2-yl)-pyridine and 2,6-bis-(benzthiazol-2-yl)-pyridine and their complexes. Coord. Chem. Rev. 2011, 255, 290–317. [Google Scholar] [CrossRef]
  10. Lavrenova, L.G.; Dyukova, I.I.; Korotaev, E.V.; Sheludyakova, L.A.; Varnek, V.A. Spin Crossover in New Iron(II) Complexes with 2,6-bis(1H-benzimidazol-2-yl)pyridine. Rus. J. Inorg. Chem. 2020, 65, 30–35. [Google Scholar] [CrossRef]
  11. Ivanova, A.D.; Korotaev, E.V.; Komarov, V.Y.; Sheludyakova, L.A.; Varnek, V.A.; Lavrenova, L.G. Spin crossover in iron(II) coordination compounds with 2,6-bis(1H-benzimidazol-2-yl)pyridine. New J. Chem. 2020, 44, 5834–5840. [Google Scholar] [CrossRef]
  12. Ivanova, A.D.; Lavrenova, L.G.; Korotaev, E.V.; Trubina, S.V.; Sheludyakova, L.A.; Petrov, S.A.; Zhizhin, K.Y.; Kuznetsov, N.T. High-Temperature Spin Crossover in Complexes of Iron(II) closo-Borates with 2,6-bis(1H-benzimidazol-2-yl)pyridine. Russ. J. Inorg. Chem. 2020, 65, 1687–1694. [Google Scholar] [CrossRef]
  13. Ivanova, A.D.; Korotaev, E.V.; Komarov, V.Y.; Sukhikh, T.S.; Trubina, S.V.; Sheludyakova, L.A.; Petrov, S.A.; Tikhonov, A.Y.; Lavrenova, L.G. Spin Crossover in iron(II) complexes with new ligand 2,6-bis(4,5-dimethyl-1H-imidazol-2-yl)pyridine. Inorg. Chim. Acta 2022, 532, 120746. [Google Scholar] [CrossRef]
  14. Ivanova, A.D.; Lavrenova, L.G.; Korotaev, E.V.; Trubina, S.V.; Tikhonov, A.Y.; Kriventsov, V.V.; Petrov, S.A.; Zhizhin, K.Y.; Kuznetsov, N.T. Study Spin Crossover in Iron(II) Complexes with 2,6-Bis(4,5-Dimethyl-1H-Imidazol-2-yl)Pyridine and closo-Borate Anions. Russ. J. Inorg. Chem. 2022, 67, 1158–1168. [Google Scholar] [CrossRef]
  15. Lavrenova, L.G.; Shakirova, O.G.; Korotaev, E.V.; Trubina, S.V.; Tikhonov, A.Y.; Os’kina, I.N.; Petrov, S.A.; Zhizhin, K.Y.; Kuznetsov, N.T. High-temperature spin crossover in iron(II) complexes with 2,6-bis(1H-imidazol-2-yl)pyridine. Molecules 2022, 27, 5093. [Google Scholar] [CrossRef] [PubMed]
  16. Lavrenova, L.G.; Shakirova, O.G. Spin Crossover and Thermochromism of Iron(II) Coordination Compounds with 1,2,4-Triazoles and Tris(pyrazol-1-yl)methanes. Eur. J. Inorg. Chem. 2013, 5–6, 670–682. [Google Scholar] [CrossRef]
  17. Lavrenova, L.G. Spin crossover in homo-and heteroligand iron (II) complexes with tris(pyrazol-1-yl)methane derivatives. Russ. Chem. Bull. 2018, 67, 1142–1152. [Google Scholar] [CrossRef]
  18. Sanning, J.; Ewen, P.R.; Stegemann, L.; Schmidt, J.; Daniliuc, C.G.; Koch, T.; Doltsinis, N.L.; Wegner, D.; Strassert, C.A. Scanning-Tunneling-Spectroscopy-Directed Design of Tailored Deep-Blue Emitters. Angew. Chem. Int. Ed. 2015, 54, 786–791. [Google Scholar] [CrossRef] [PubMed]
  19. Wagenen, B.V.; Stormann, T.M.; Moe, S.T.; Sheehan, S.M.; McLeod, D.A.; Smith, D.L.; Isaac, M.B.; Slassi, A. Heteropolycyclic Compounds and Their Use As Metabotropic Glutamate Receptor Antagonists. U.S. Patent 20030055085A1, 9 December 2003. [Google Scholar]
  20. Voss, M.E.; Beer, C.M.; Mitchell, S.A.; Blomgren, P.A.; Zhichkin, P.E. A simple and convenient one-pot method for the preparation of heteroaryl-2-imidazoles from nitriles. Tetrahedron 2008, 64, 645–651. [Google Scholar] [CrossRef]
  21. Carlin, R.L. Magnetochemistry; Springer: Berlin/Heidelberg, Germany, 1986. [Google Scholar]
  22. Rakitin, Y.V.; Kalinnikov, V.T. Modern Magnetochemistry; Nauka: St. Petersburg, Russia, 1994. [Google Scholar]
  23. Crowley, J.D.; Bandeen, P.H.; Hanton, L.R. A one pot multi-component CuAAC “click” approach to bidentate and tridentate pyridyl-1,2,3-triazole ligands: Synthesis, X-ray structures and copper(II) and silver(I) complexes. Polyhedron 2010, 29, 70–83. [Google Scholar] [CrossRef]
  24. Schwartz, T.M.; Burnett, M.E.; Green, K.N. Electronic influence of substitution on the pyridine ring within NNN pincer-type molecules. Dalton Trans. 2020, 49, 2356–2363. [Google Scholar] [CrossRef] [PubMed]
  25. Nakamoto, K. Infrared and Raman Spectra of Inorganic and Coordination Compounds, Part B: Applications in Coordination, Organometallic, and Bioinorganic Chemistry; John Wiley & Sons: Hoboken, NJ, USA, 2009. [Google Scholar]
  26. Lever, A.B.P. Inorganic Electronic Spectroscopy, 2nd ed.; Elsevier: Amsterdam, The Netherlands, 1985. [Google Scholar]
  27. Cotton, F.A.; Wilkinson, G. Advanced Inorganic Chemistry, 6th ed.; John Wiley & Sons: New York, NY, USA, 1999. [Google Scholar]
  28. Sugano, S.; Tanabe, Y.; Kamimura, H. Multiplets of Transition—Metal ions in Crystals; Academic Press Pure and Applied Physics: London, UK, 1970. [Google Scholar]
  29. Figgis, B.N.; Hitchman, M.A. Ligand Field Theory and Its Application; Wiley-VCH: New York, NY, USA, 2000. [Google Scholar]
  30. Hauser, A. Ligand field theoretical considerations. Top. Curr. Chem. 2004, 233, 49–58. [Google Scholar] [CrossRef]
  31. Bruker AXS Inc. APEX2 (version 2012.2-0), SAINT (version 8.18c), and SADABS (version 2008/1). In Bruker Advanced X-ray Solutions; Bruker AXS Inc.: Madison, WI, USA, 2000–2012. [Google Scholar]
  32. Sheldrick, G.M. Crystal structure refinement with SHELXL. Acta Crystallogr. Sect. C Struct. Chem. 2015, 71, 3–8. [Google Scholar] [CrossRef] [PubMed] [Green Version]
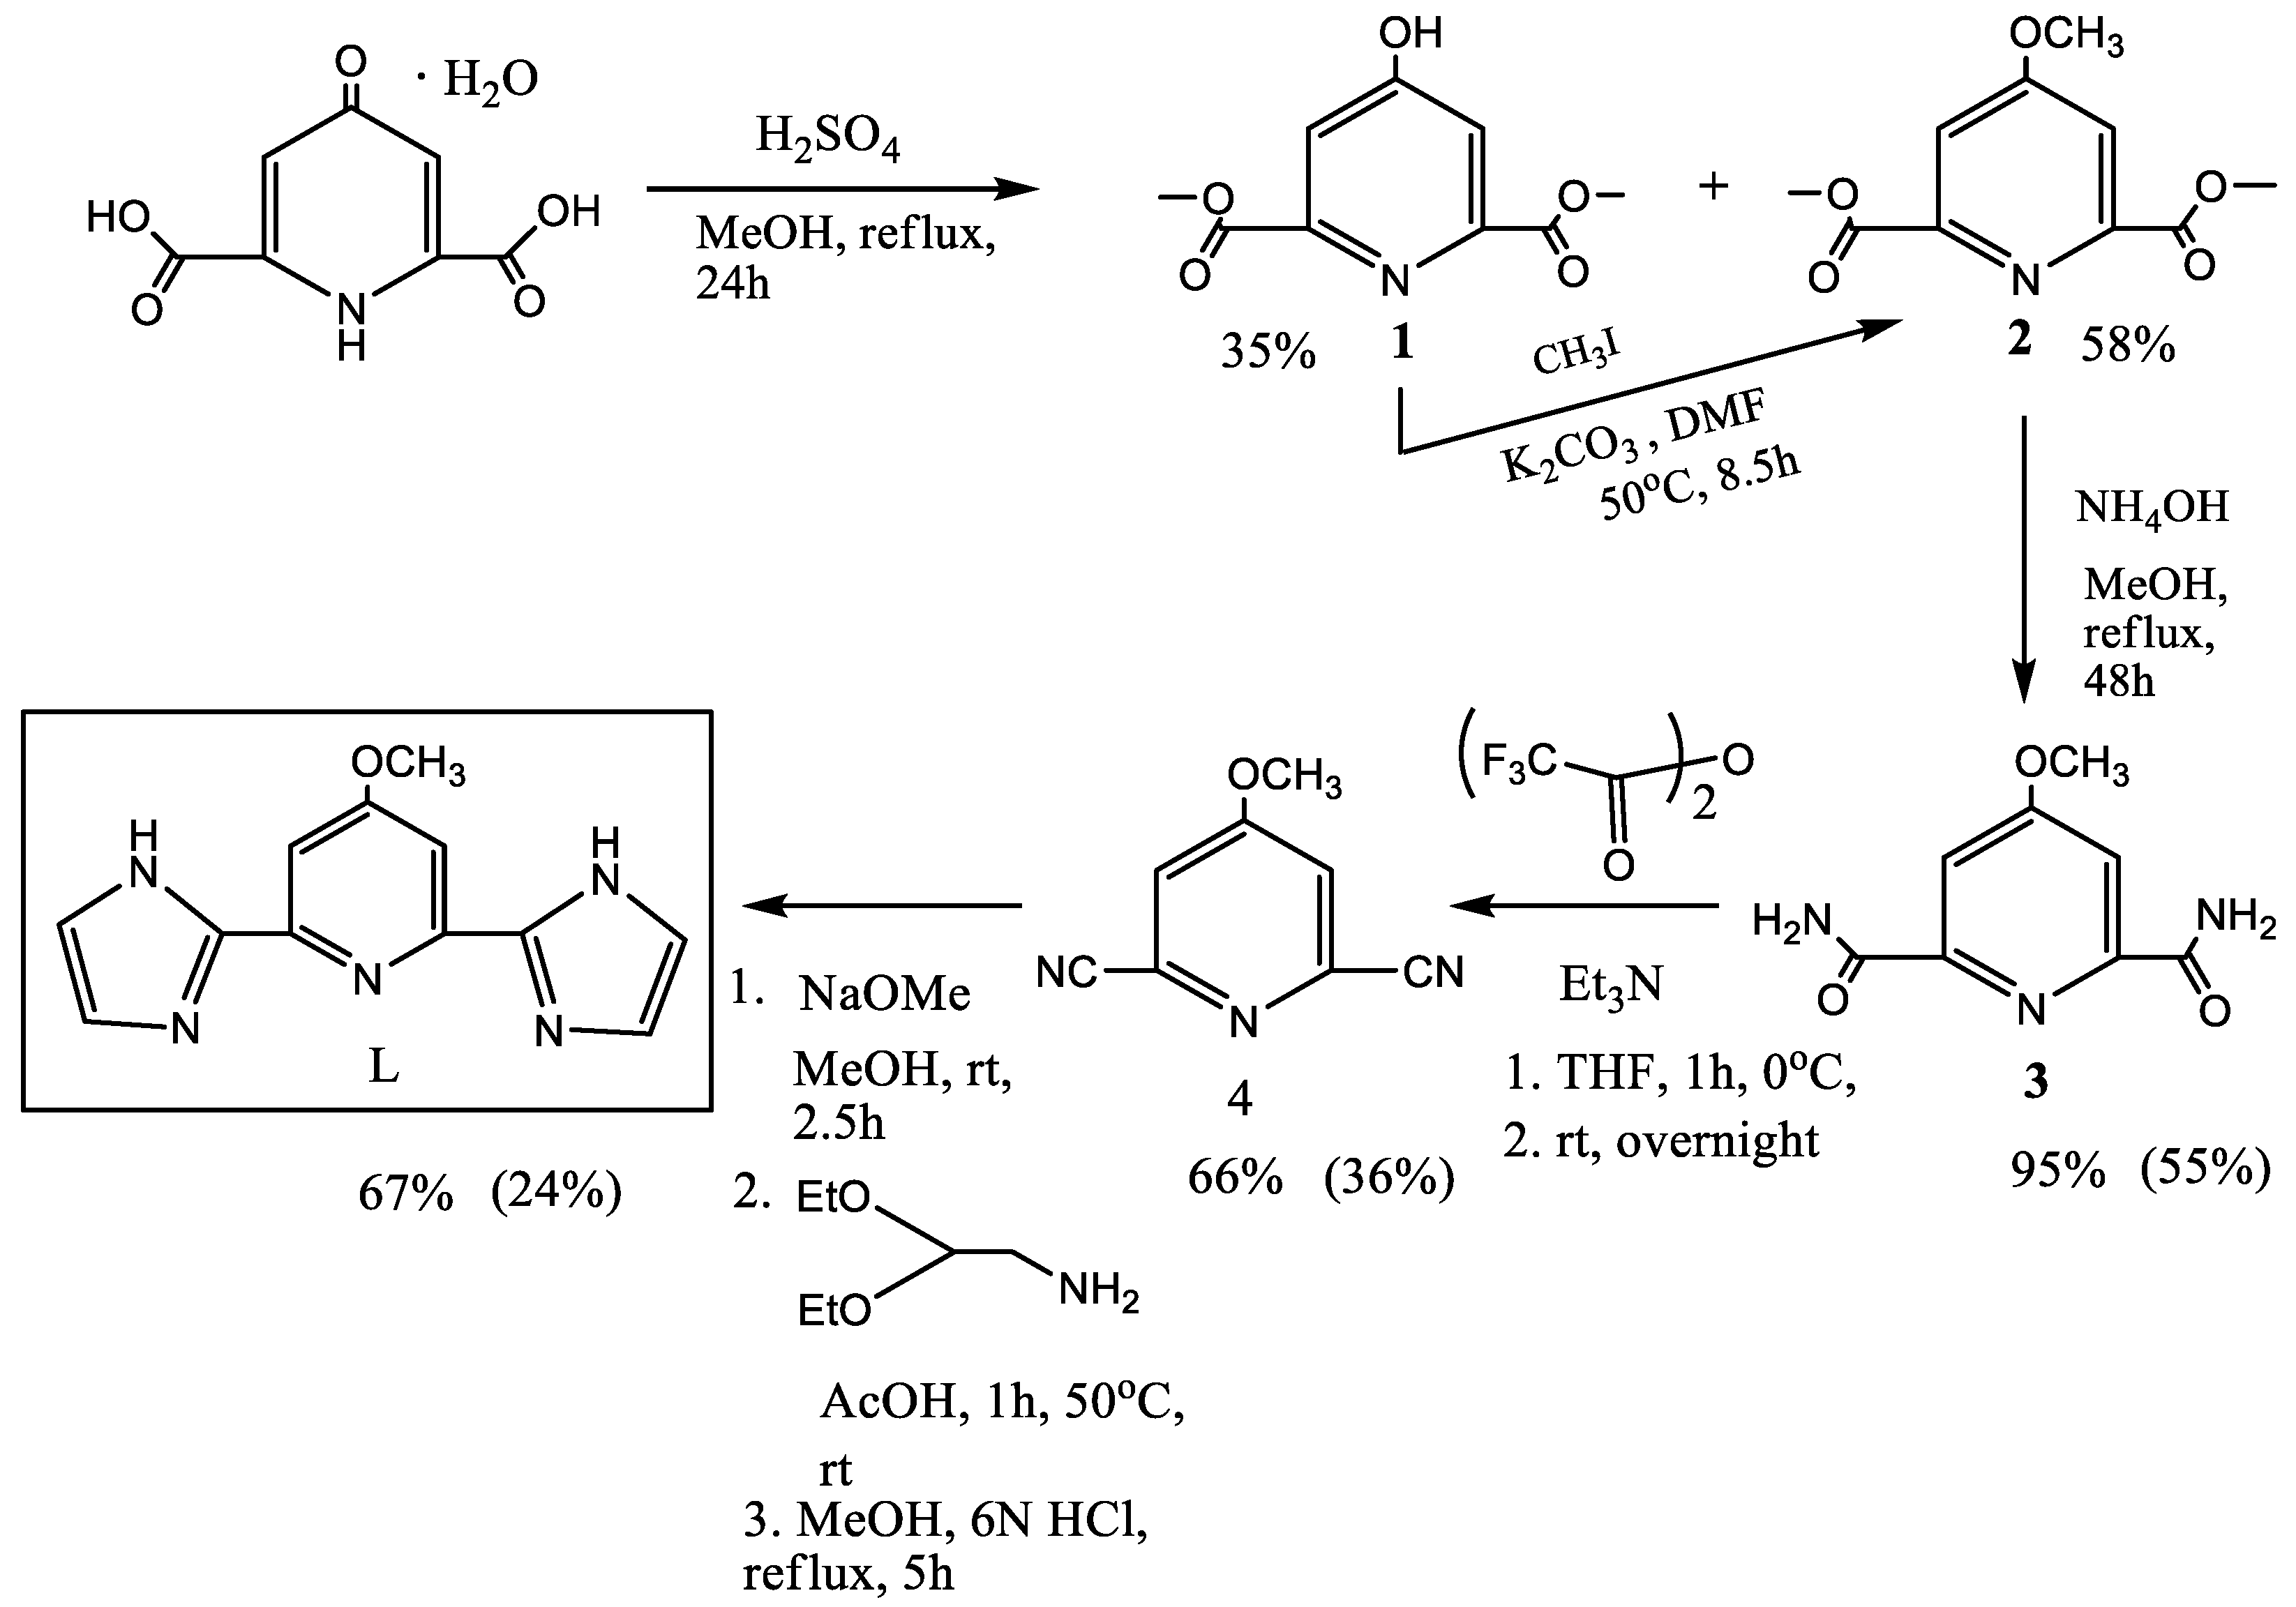
Scheme 1. Synthetic route towards the ligand 2,6-bis(1H-imidazol-2-yl)-4-methoxypyridine (L). The reaction yields in comparison with the original amount of chelidamic acid hydrate given in brackets.
Ijms 24 09853 sch001
Figure 1. Molecular structure of the [CuLCl2] complex.
Ijms 24 09853 g001
Figure 2. Crystal structure of the [CuLCl2] complex.
Ijms 24 09853 g002
Figure 3. The Mössbauer spectra of complexes IIII.
Ijms 24 09853 g003
Figure 4. Temperature dependences of µeff for complexes Ia, IIa and IIIa ((ac), respectively; insets exhibit the χT temperature dependencies) and d2µeff/dT2 (df). The black triangle is for the heating process, the white triangle is for the cooling process.
Ijms 24 09853 g004
Figure 5. Temperature dependences of µeff for complexes I and II (a,b, respectively; insets exhibit the χT temperature dependencies) and d2µeff/dT2 (c,d). The black triangle is for the heating process, the white triangle is for the cooling process.
Ijms 24 09853 g005
Figure 6. Dependences of eff(T) (a) (inset exhibits the χT(T)) and 1/χ′(T) (b) for complex III. The black triangle is for the heating process, the white triangle is for the cooling process.
Ijms 24 09853 g006
Table 1. Crystallographic data and diffraction experiment conditions for [CuLCl2].
Empirical FormulaC12H11Cl2CuN5O
Formula weight (g/mol)375.70
Space groupP 21/n
Cell Parametersa = 9.2008(7) Å = 90°
b = 12.3775(7) Å = 105.219(2)°
c = 12.7209(9) Å = 90°
V (Å3)1397.89(17)
Z4
ρ calc (g/cm−3)1.785
μ (mm−1)1.949
F(000)756
Crystal size, mm0.22 × 0.10 × 0.06
Scan range, θ, degree2.34–26.38
Range h, k, l−11 ≤ h ≤ 11, −10 ≤ k ≤ 15, −15 ≤ l ≤ 15
Number of measured reflections9505
Number of independent reflections2860 [R(int) = 0.0688]
Number of reflexes/constraints/parameters2860/0/191
Goodness-of-fit on F21.050
R-factor, [I > 2σ(I)] R1/wR2R1 = 0.0472, wR2 = 0.0988
R-factor (for all Ihkl) R1/wR2R1 = 0.0682, wR2 = 0.1062
Residual electron density (max/min) e/Å30.520/−0.720
Table 2. Basic interatomic distances (Å) and angles (°) for [CuLCl2].
BondDistance (Å)AngleDegree (°)AngleDegree (°)
Cu1-N11.983 (3)N1-Cu1-N278.78 (13)N3-Cu1-Cl197.49 (9)
Cu1-N22.054 (3)N1-Cu1-N378.94 (13)N3-Cu1-Cl298.67 (9)
Cu1-N32.032 (3)N3-Cu1-N2155.84 (13)N1-Cu1-Cl2168.16 (10)
Cu1-Cl12.6761 (11)N1-Cu1-Cl194.93 (10)N2-Cu1-Cl2101.21 (9)
Cu1-Cl22.2137 (11)N2-Cu1-Cl193.61 (9)Cl2-Cu1-Cl196.89 (4)
Table 3. The main vibrational frequencies (cm−1) in the spectra L and complexes IIII.
L[FeL2]SO4∙2H2O[FeL2](ReO4)2∙H2O[FeL2]Br2∙2H2OAssignments
3600–33003415–34033450–34003500–3365ν (O–H)
3138, 3113 3156, 31183156, 3124 3146, 3116ν (N–H) associated
3074306930893076ν (Cring–H)
2981, 293929372985, 29482979, 2937νas (CH3)
2850 28702879, 2833 2879, 2833 νs (CH3)
2815280828022810ν (O–CH3)
1606, 1570, 15511676, 1625, 1596, 15641660, 1622, 15581660, 1624, 1600, 1563R(py)
1477, 14371504, 1475, 1460, 14121489, 1480, 14051482, 1435, 1400R(im)
1356, 1315, 1286, 12601340, 1320, 12951370, 1340, 13001370, 1340, 1300δ (C–H) scissoring
1240125312561258ν (Cring–O)
1130, 1103 1137, 1120, 11091133, 1115δ (C–H) twisting
1115 ν3 (SO4)
1043104310531053δ (O–CH3)
990, 960, 924987, 959, 906990, 960990, 960, 910δ (C–H) out-of-plane
926, 912, 895 ν3 (ReO4)
877, 864862855880, 860δ (C–N)
766, 746, 714 767, 745, 703 786, 770, 751, 705 795, 750, 703 δ (C–H) rocking
615618618615δ (N–H)
332334335ν (FeHS–N)
Table 4. Parameters of the Mössbauer spectra of complexes IIII.
Complexδ, mm/sΔEQ, mm/sГ, mm/s
I0.950 (1)1.881 (2)0.29 (1)
II0.971 (4)2.378 (7)0.29 (2)
III0.970 (3)1.956 (5)0.28 (1)
Table 5. The temperatures of the direct (Tc↑) and reverse (Tc↓) transitions for the studied complexes.
CompoundTc↑, KTc↓, KΔTc, K
I1671634
20719710
II1121120
23420430
Ia2172134
IIa1121120
22220121
IIIa1211210
Table 6. DRS parameters and calculated values HS, B, C and P (cm−1).
Complex ν 1 ( e g π L * ) ν 2 ( t 2 g π L * ) ν (   5 T 2 g   5 E g ) = Δ HS BCP
I23,09515,65010,685562247818,130
II24,57015,65010,835570251519,755
III24,57015,65010,685562247819,605
Disclaimer/Publisher’s Note: The statements, opinions and data contained in all publications are solely those of the individual author(s) and contributor(s) and not of MDPI and/or the editor(s). MDPI and/or the editor(s) disclaim responsibility for any injury to people or property resulting from any ideas, methods, instructions or products referred to in the content.