
Role of Mouse Organic Cation Transporter 2 for Nephro- and Peripheral Neurotoxicity Induced by Chemotherapeutic Treatment with Cisplatin
 , ,
, ,  ,
, 
Abstract
:1. Introduction
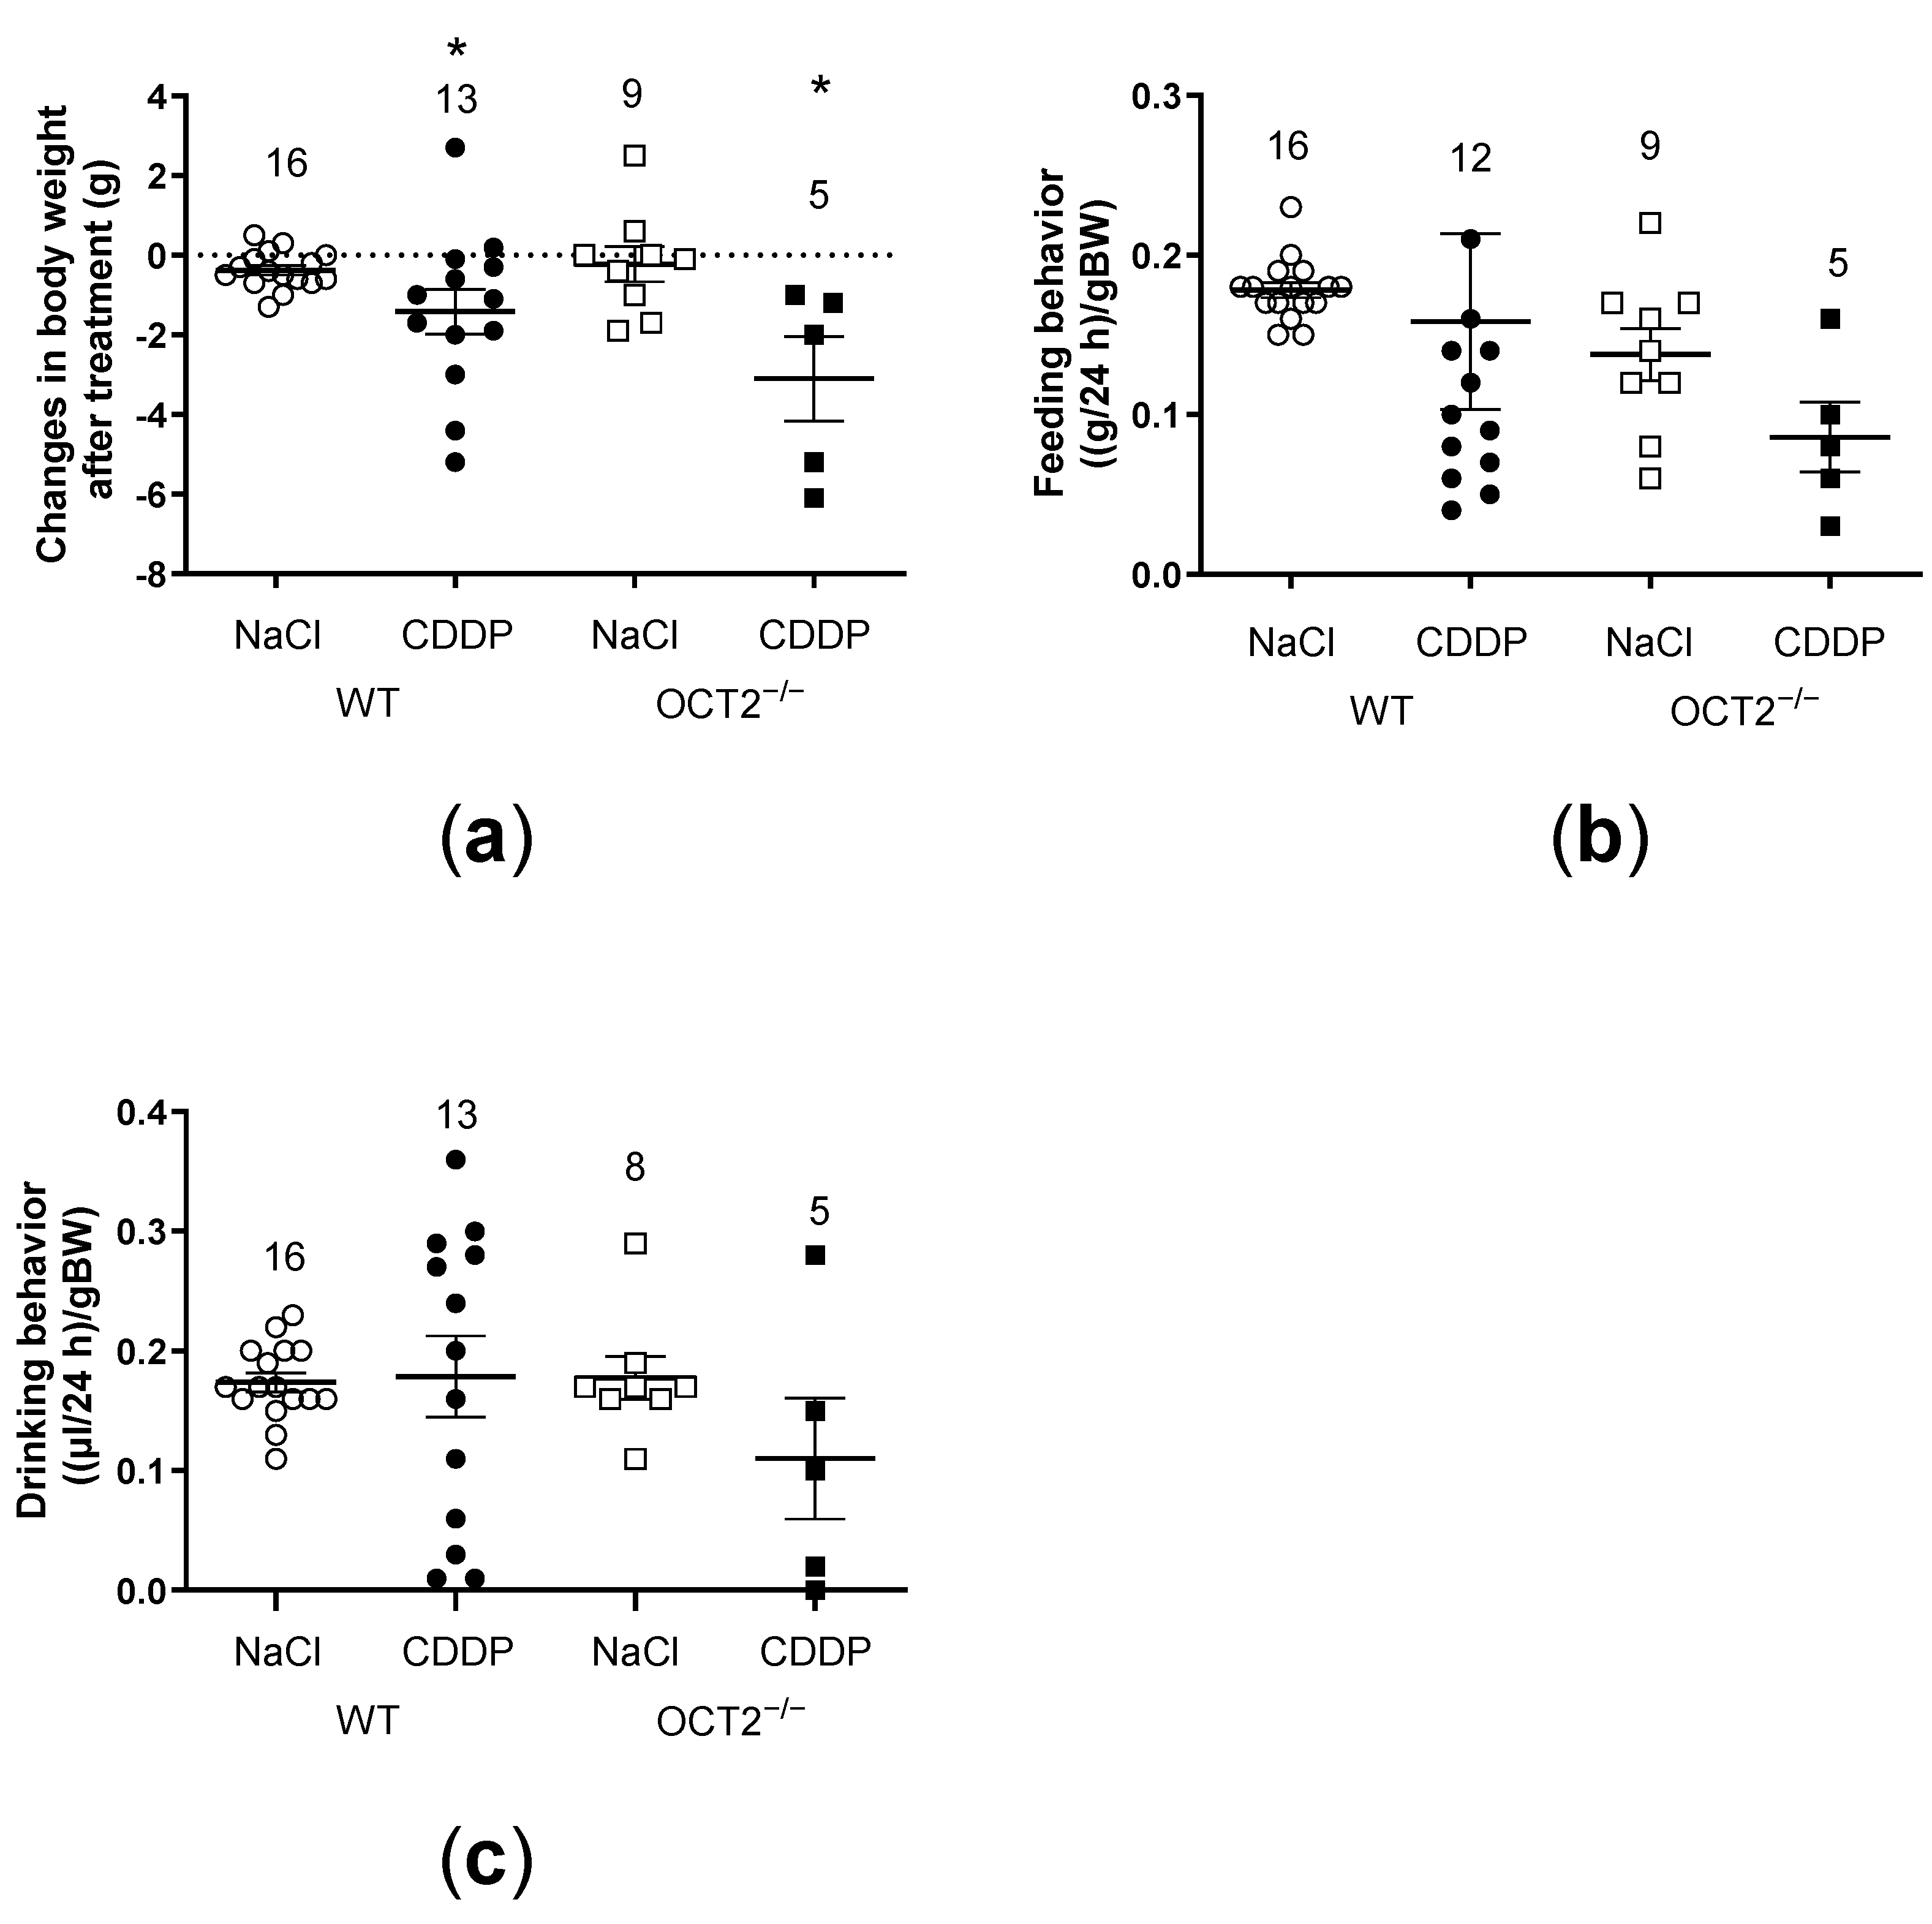
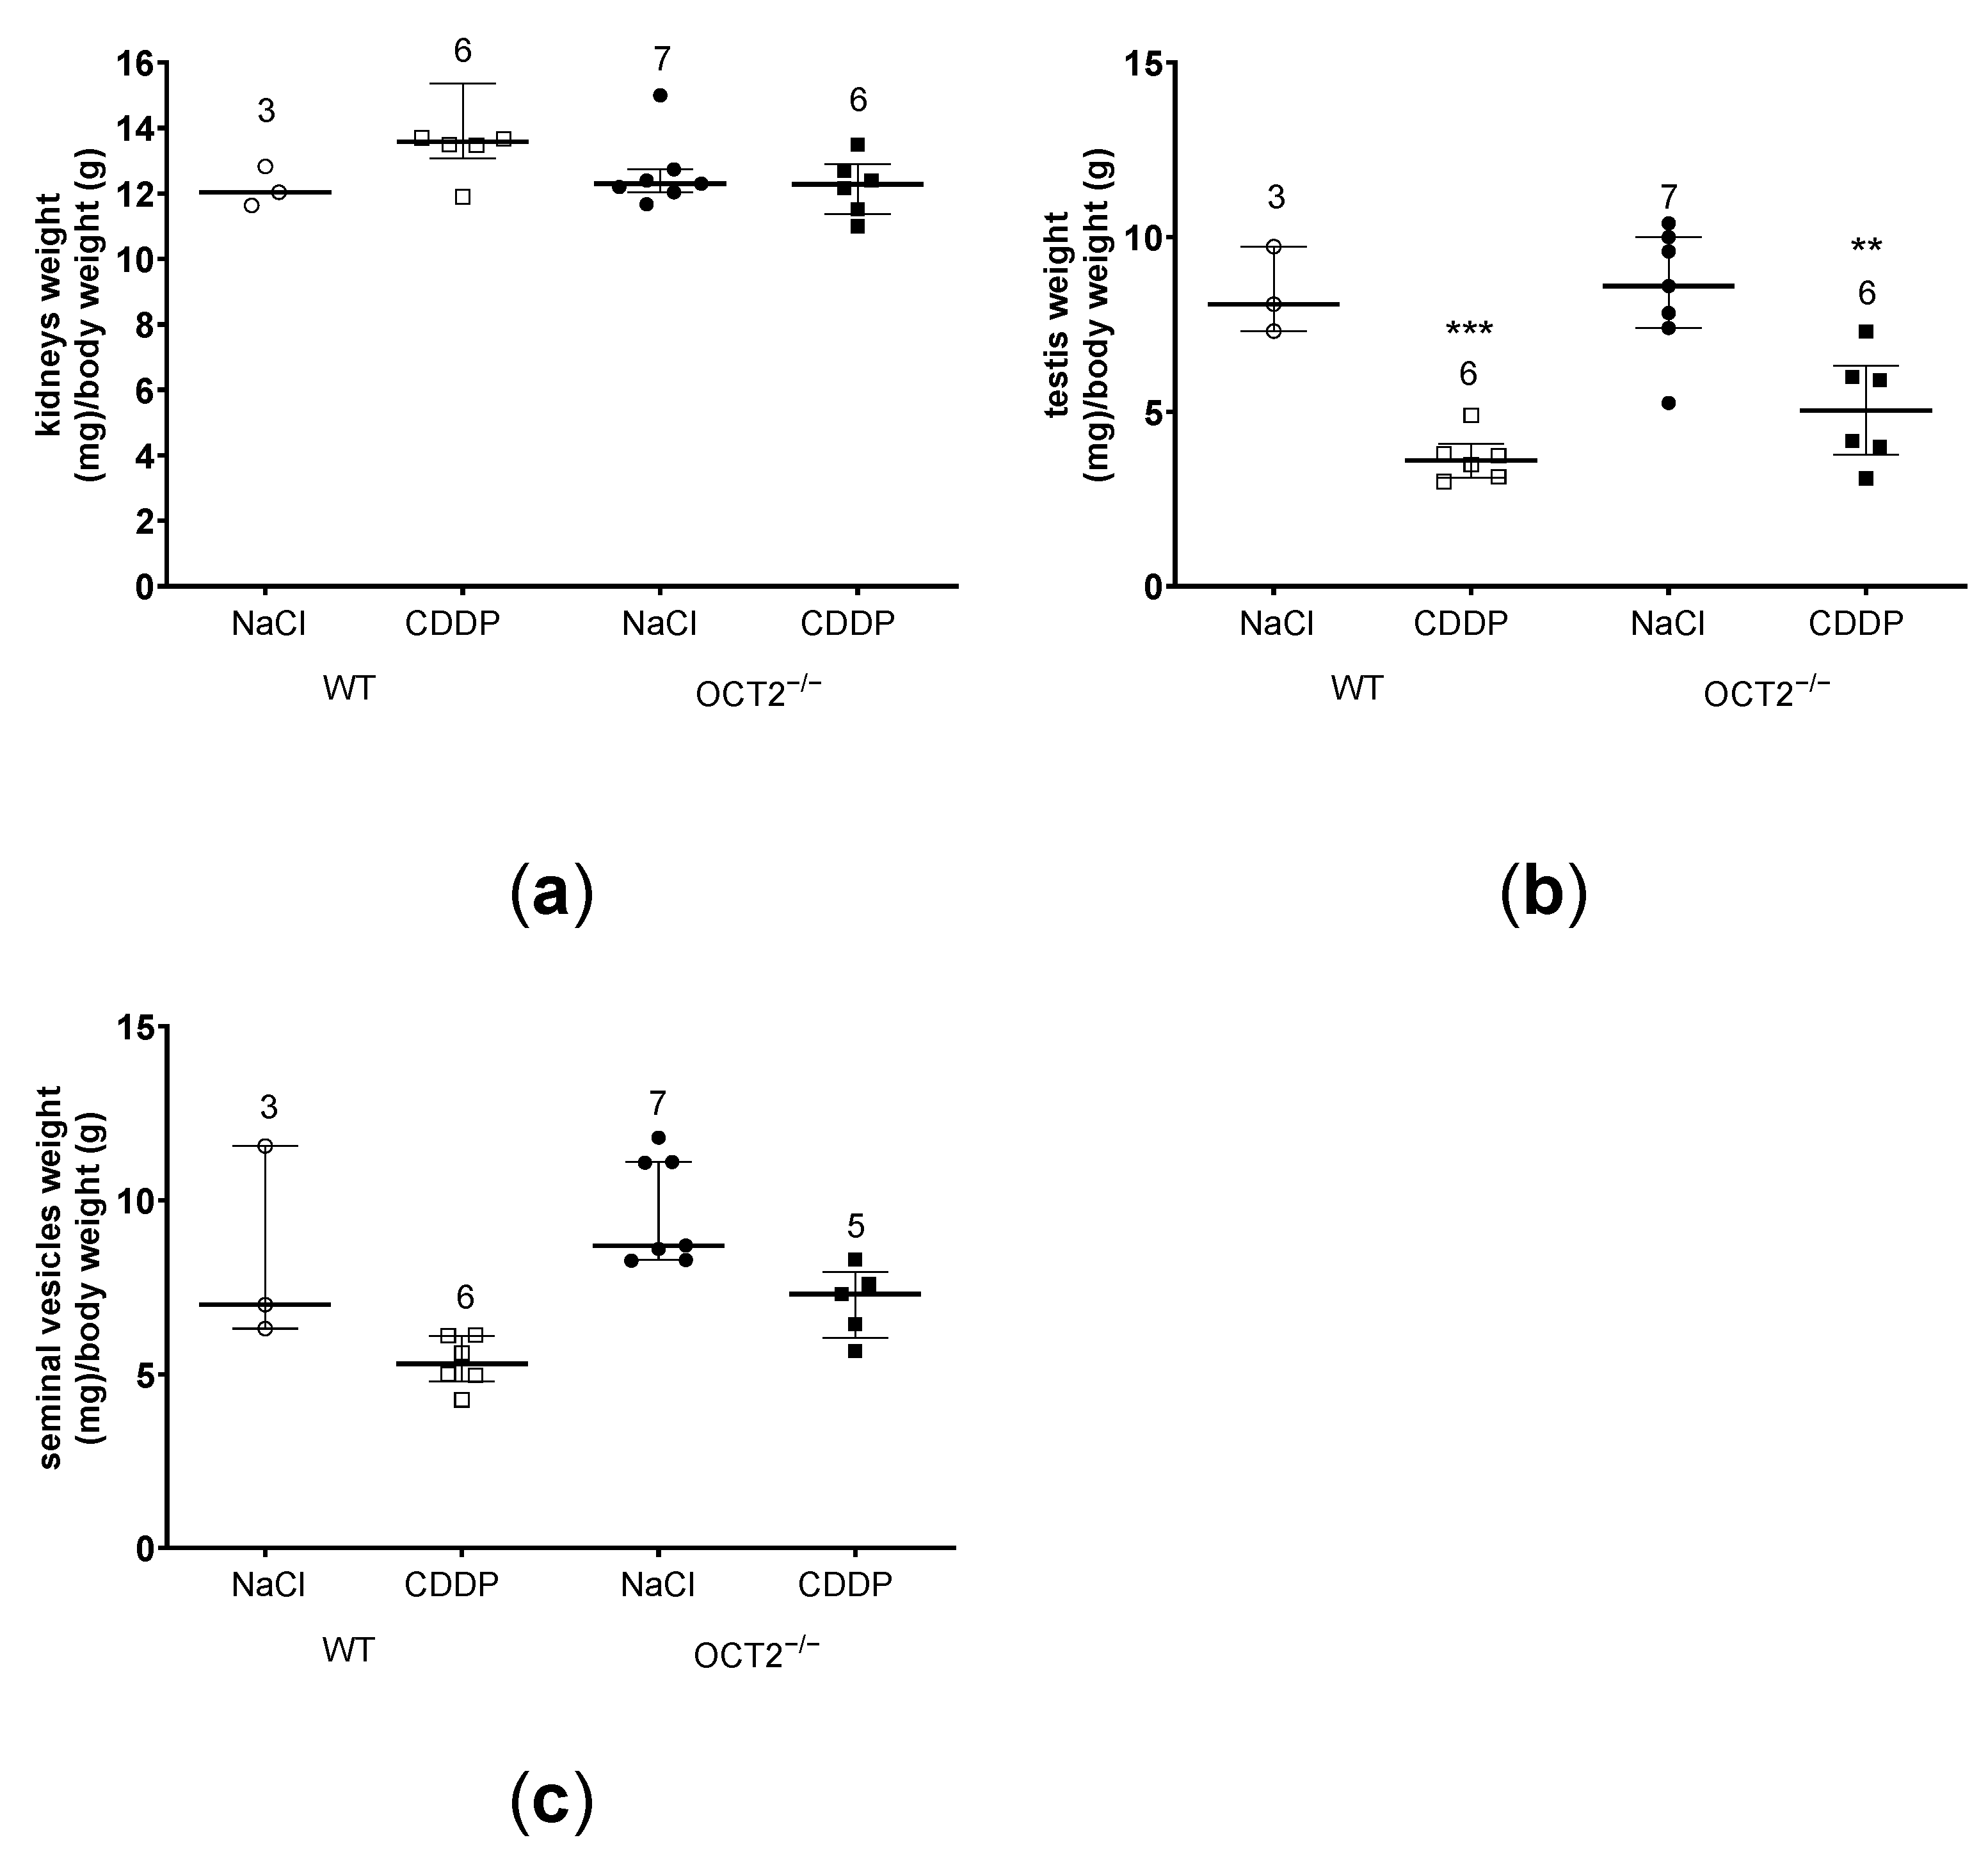
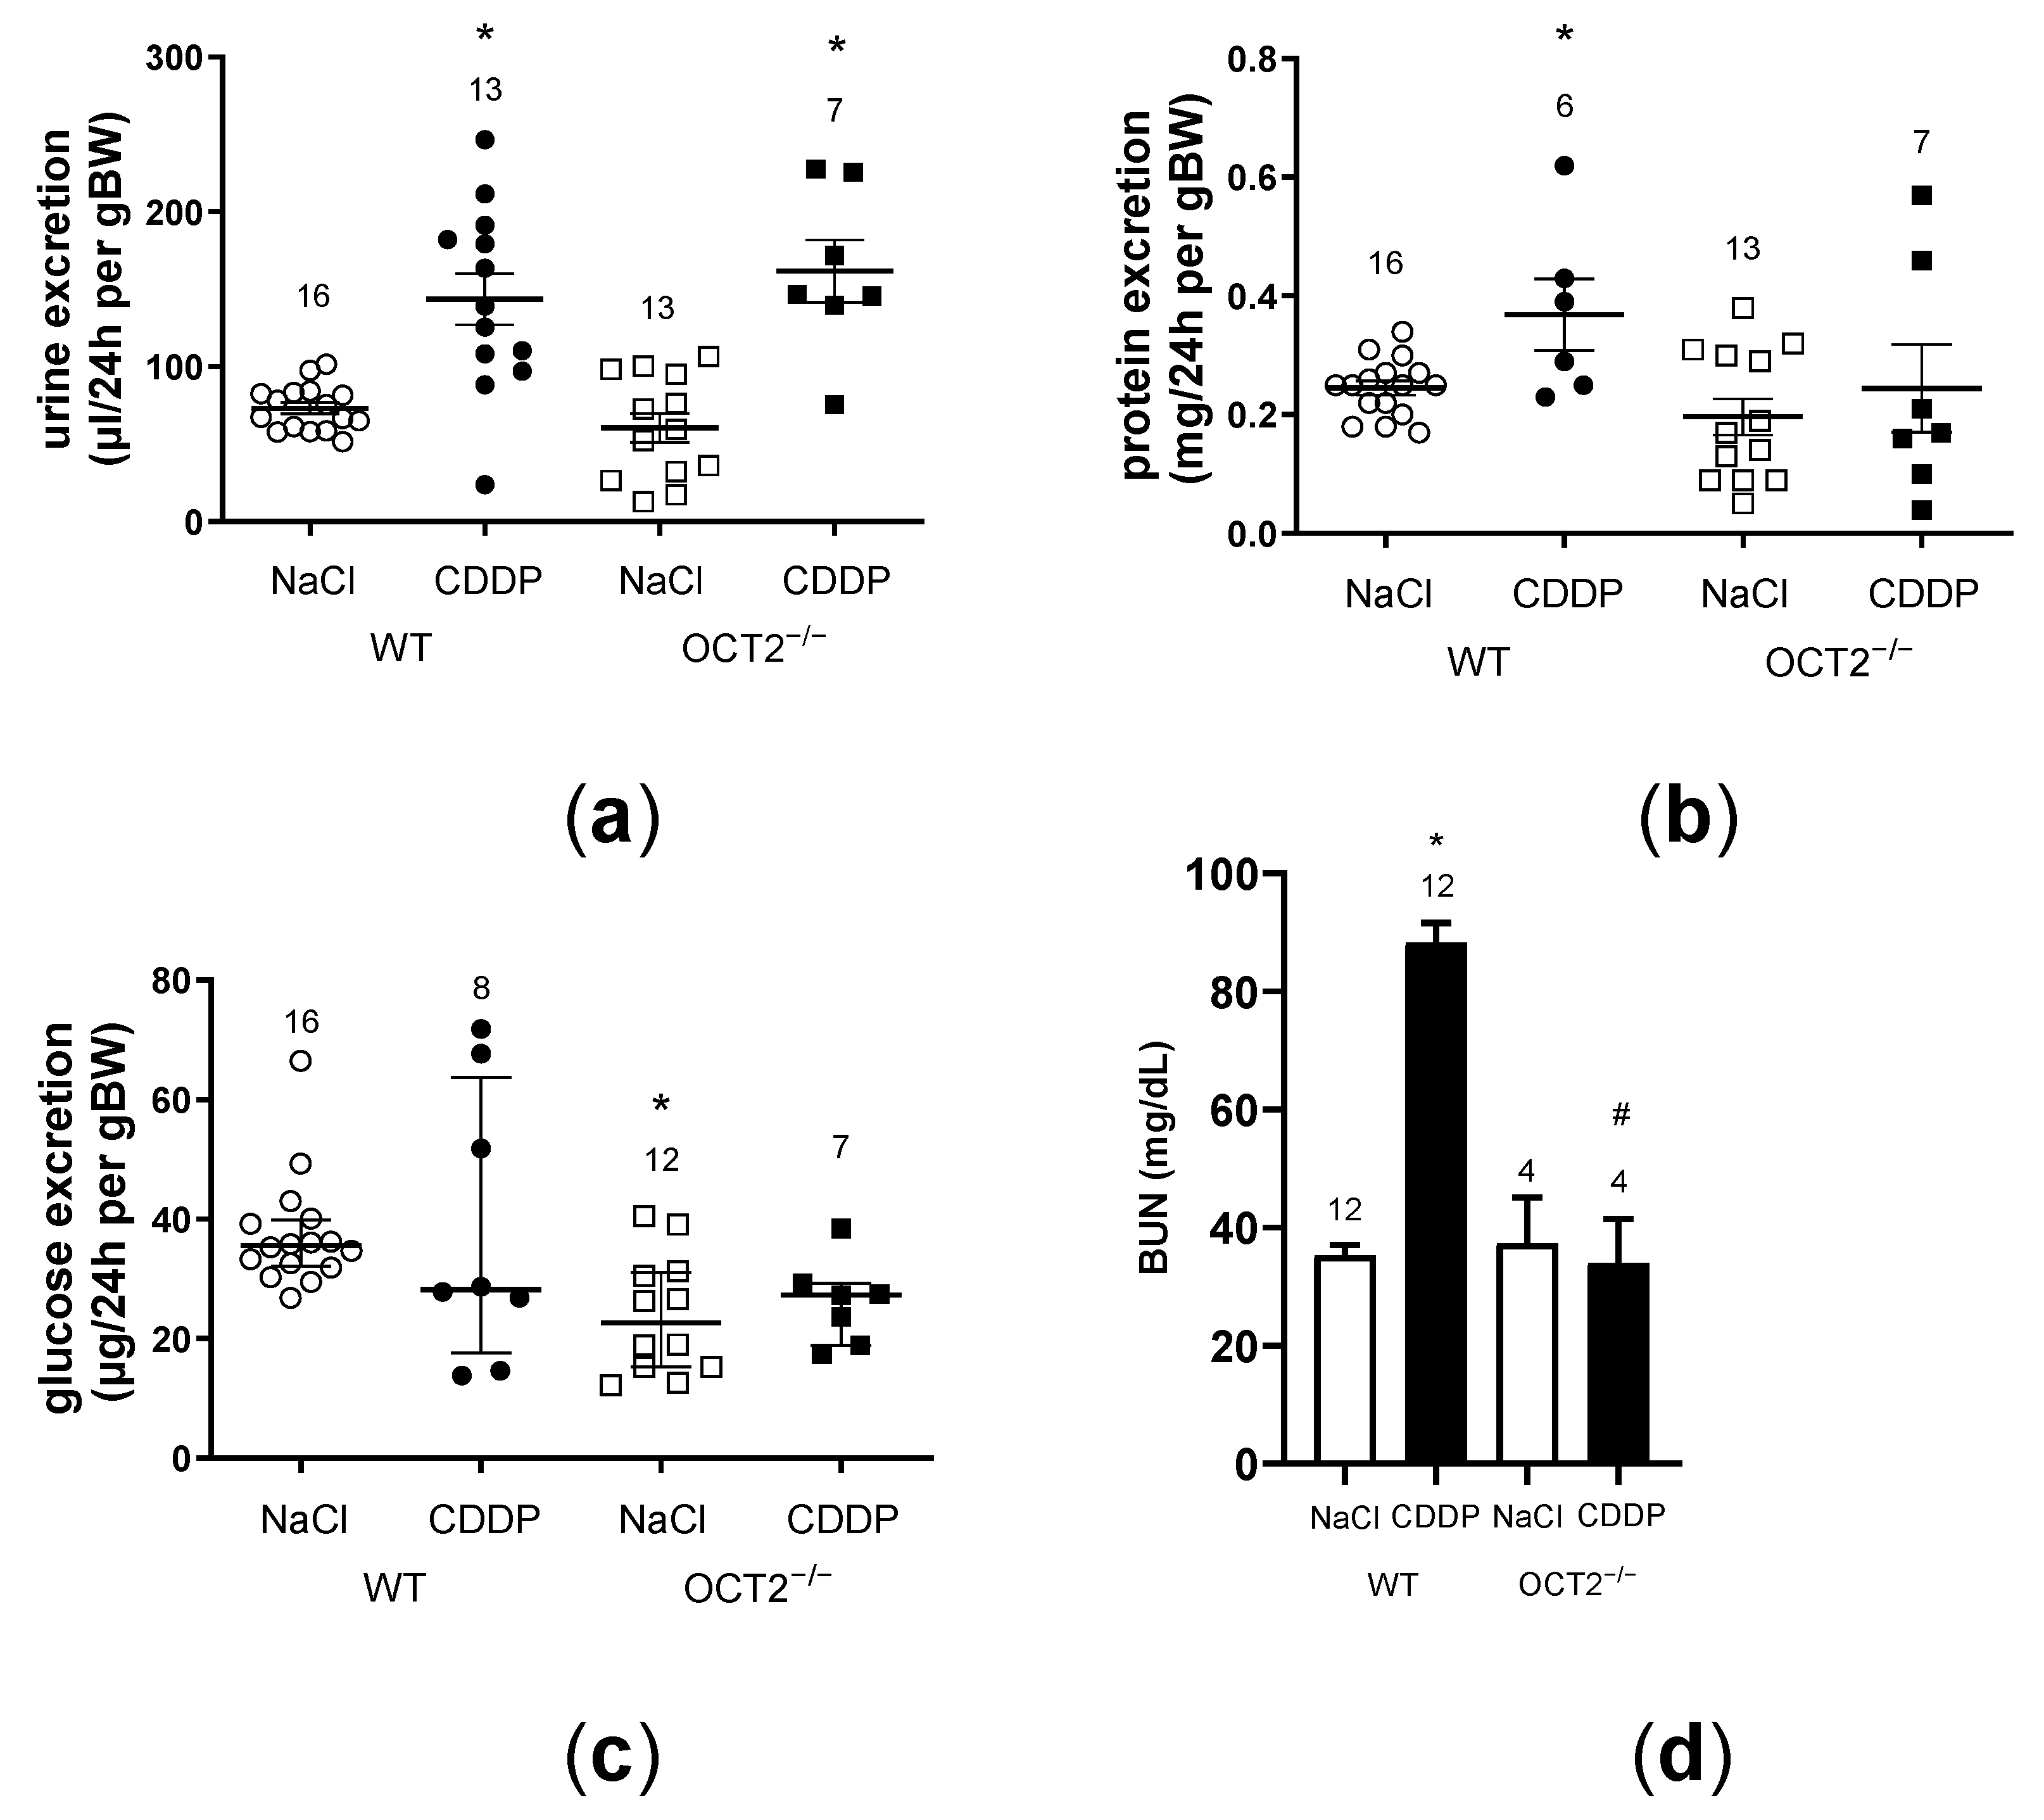
2. Results
3. Discussion
4. Materials and Methods
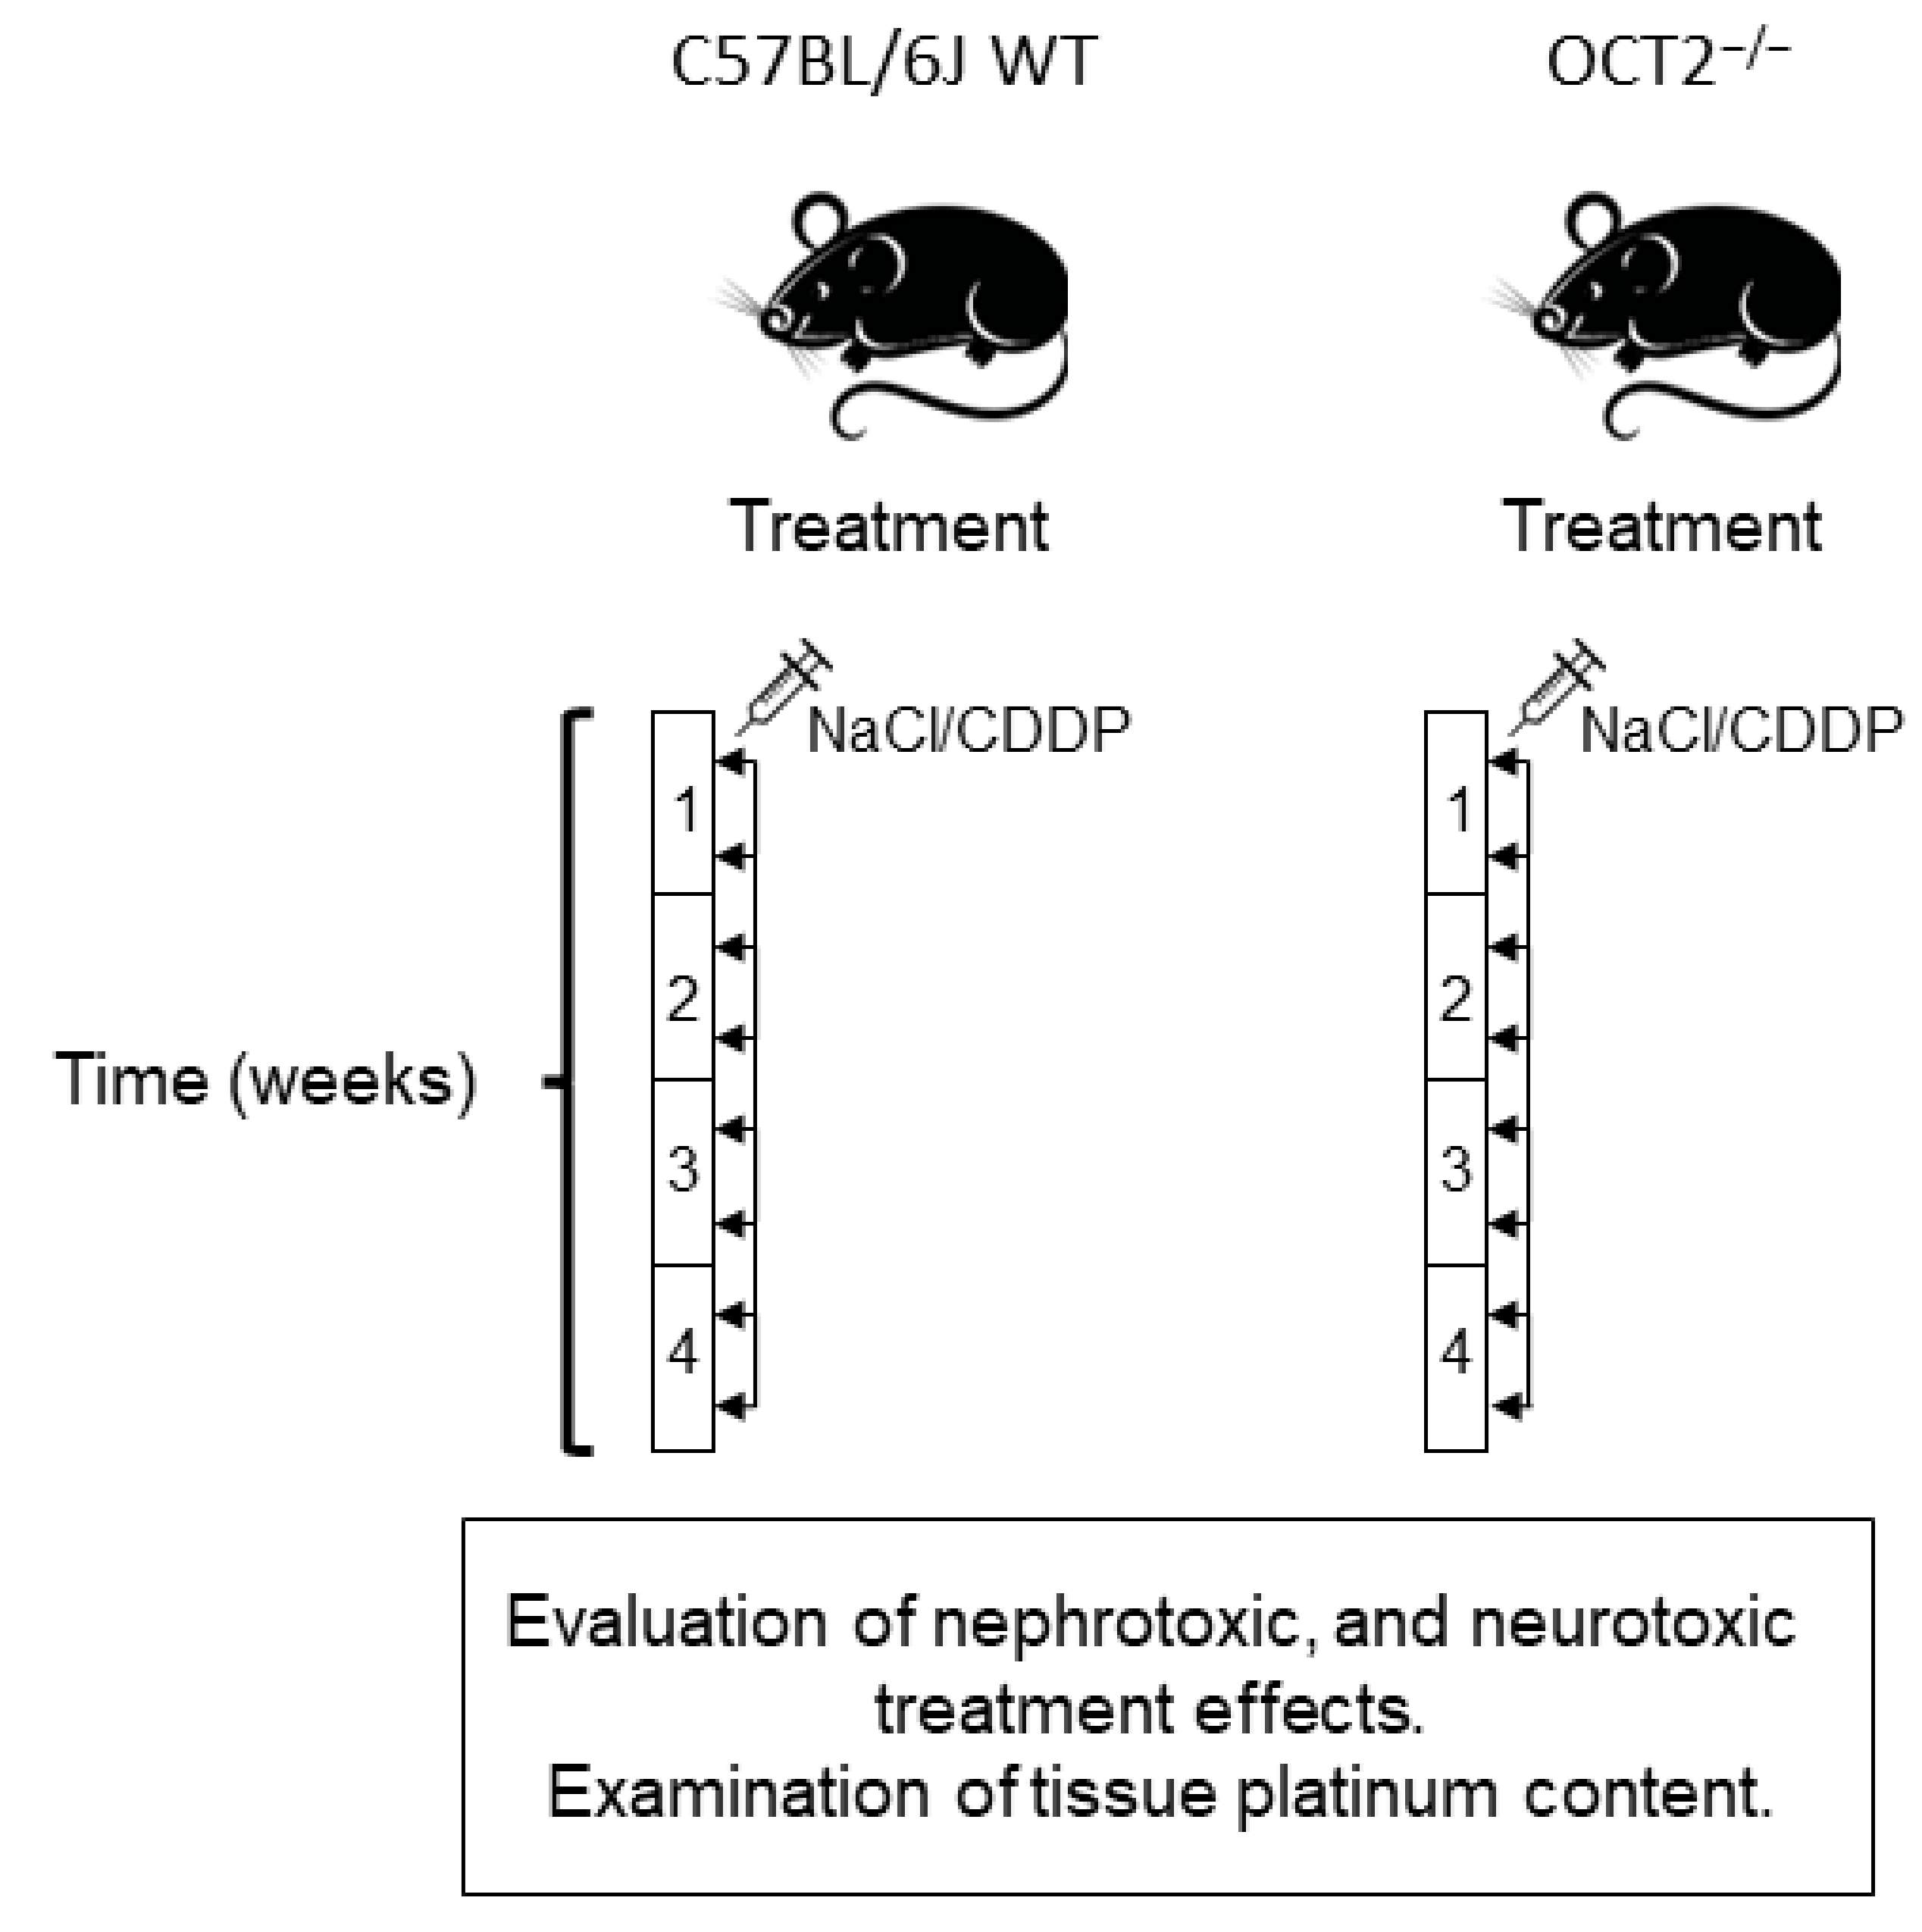
4.1. Animals
4.2. Treatment of Mice
4.3. Measurement of Urinary Protein and Glucose Levels and Assessment of Renal Histology
4.4. Neurotoxicity Assessments
4.5. Cell Culture
4.6. DRG Cell Cultures
4.7. Fluorescence Measurements
4.8. Cell Viability Test
4.9. Statistics
4.10. Chemicals
Author Contributions
Funding
Institutional Review Board Statement
Informed Consent Statement
Data Availability Statement
Acknowledgments
Conflicts of Interest
References
- Dasari, S.; Njiki, S.; Mbemi, A.; Yedjou, C.G.; Tchounwou, P.B. Pharmacological Effects of Cisplatin Combination with Natural Products in Cancer Chemotherapy. Int. J. Mol. Sci. 2022, 23, 1532. [Google Scholar] [CrossRef]
- Oun, R.; Moussa, Y.E.; Wheate, N.J. The Side Effects of Platinum-Based Chemotherapy Drugs: A Review for Chemists. Dalton Trans. 2018, 47, 6645–6653. [Google Scholar] [CrossRef]
- McMahon, K.R.; Rassekh, S.R.; Schultz, K.R.; Blydt-Hansen, T.; Cuvelier, G.D.E.; Mammen, C.; Pinsk, M.; Carleton, B.C.; Tsuyuki, R.T.; Ross, C.J.D.; et al. Epidemiologic Characteristics of Acute Kidney Injury During Cisplatin Infusions in Children Treated for Cancer. JAMA Netw. Open 2020, 3, e203639. [Google Scholar] [CrossRef] [PubMed]
- Latcha, S.; Jaimes, E.A.; Patil, S.; Glezerman, I.G.; Mehta, S.; Flombaum, C.D. Long–Term Renal Outcomes after Cisplatin Treatment. Clin. J. Am. Soc. Nephrol. 2016, 11, 1173–1179. [Google Scholar] [CrossRef] [PubMed] [Green Version]
- Rybak, L.; Mukherjea, D.; Ramkumar, V. Mechanisms of Cisplatin-Induced Ototoxicity and Prevention. Semin. Hear. 2019, 40, 197–204. [Google Scholar] [CrossRef] [PubMed]
- Staff, N.P.; Cavaletti, G.; Islam, B.; Lustberg, M.; Psimaras, D.; Tamburin, S. Platinum-induced Peripheral Neurotoxicity: From Pathogenesis to Treatment. J. Peripher. Nerv. Syst. 2019, 24, S26–S39. [Google Scholar] [CrossRef] [PubMed]
- McDonald, E.S.; Randon, K.R.; Knight, A.; Windebank, A.J. Cisplatin Preferentially Binds to DNA in Dorsal Root Ganglion Neurons in Vitro and in Vivo: A Potential Mechanism for Neurotoxicity. Neurobiol. Dis. 2005, 18, 305–313. [Google Scholar] [CrossRef]
- Einhorn, L.H. Curing Metastatic Testicular Cancer. Proc. Natl. Acad. Sci. USA 2002, 99, 4592–4595. [Google Scholar] [CrossRef]
- Marullo, R.; Werner, E.; Degtyareva, N.; Moore, B.; Altavilla, G.; Ramalingam, S.S.; Doetsch, P.W. Cisplatin Induces a Mitochondrial-ROS Response That Contributes to Cytotoxicity Depending on Mitochondrial Redox Status and Bioenergetic Functions. PLoS ONE 2013, 8, e81162. [Google Scholar] [CrossRef] [Green Version]
- Johnson, B.W.; Murray, V.; Temple, M.D. Characterisation of the DNA Sequence Specificity, Cellular Toxicity and Cross-Linking Properties of Novel Bispyridine-Based Dinuclear Platinum Complexes. BMC Cancer 2016, 16, 333. [Google Scholar] [CrossRef] [Green Version]
- Miyazawa, M.; Bogdan, A.R.; Tsuji, Y. Perturbation of Iron Metabolism by Cisplatin through Inhibition of Iron Regulatory Protein 2. Cell Chem. Biol. 2019, 26, 85–97.e4. [Google Scholar] [CrossRef] [PubMed]
- England, C.G.; Miller, M.C.; Kuttan, A.; Trent, J.O.; Frieboes, H.B. Release Kinetics of Paclitaxel and Cisplatin from Two and Three Layered Gold Nanoparticles. Eur. J. Pharm. Biopharm. 2015, 92, 120–129. [Google Scholar] [CrossRef] [PubMed] [Green Version]
- Harrach, S.; Ciarimboli, G. Role of Transporters in the Distribution of Platinum-Based Drugs. Front. Pharmacol. 2015, 6, 85. [Google Scholar] [CrossRef] [PubMed] [Green Version]
- Motohashi, H.; Nakao, Y.; Masuda, S.; Katsura, T.; Kamba, T.; Ogawa, O.; Inui, K.-I. Precise Comparison of Protein Localization among OCT, OAT, and MATE in Human Kidney. J. Pharm. Sci. 2013, 102, 3302–3308. [Google Scholar] [CrossRef] [PubMed]
- Ciarimboli, G.; Deuster, D.; Knief, A.; Sperling, M.; Holtkamp, M.; Edemir, B.; Pavenstädt, H.; Lanvers-Kaminsky, C.; am Zehnhoff-Dinnesen, A.; Schinkel, A.H.; et al. Organic Cation Transporter 2 Mediates Cisplatin-Induced Oto- and Nephrotoxicity and Is a Target for Protective Interventions. Am. J. Pathol. 2010, 176, 1169–1180. [Google Scholar] [CrossRef]
- Sprowl, J.A.; Ciarimboli, G.; Lancaster, C.S.; Giovinazzo, H.; Gibson, A.A.; Du, G.; Janke, L.J.; Cavaletti, G.; Shields, A.F.; Sparreboom, A. Oxaliplatin-Induced Neurotoxicity Is Dependent on the Organic Cation Transporter OCT2. Proc. Natl. Acad. Sci. USA 2013, 110, 11199–11204. [Google Scholar] [CrossRef]
- Perše, M. Cisplatin Mouse Models: Treatment, Toxicity and Translatability. Biomedicines 2021, 9, 1406. [Google Scholar] [CrossRef]
- Hucke, A.; Rinschen, M.M.; Bauer, O.B.; Sperling, M.; Karst, U.; Köppen, C.; Sommer, K.; Schröter, R.; Ceresa, C.; Chiorazzi, A.; et al. An Integrative Approach to Cisplatin Chronic Toxicities in Mice Reveals Importance of Organic Cation-Transporter-Dependent Protein Networks for Renoprotection. Arch. Toxicol. 2019, 93, 2835–2848. [Google Scholar] [CrossRef]
- Ciarimboli, G.; Ludwig, T.; Lang, D.; Pavenstädt, H.; Koepsell, H.; Piechota, H.-J.; Haier, J.; Jaehde, U.; Zisowsky, J.; Schlatter, E. Cisplatin Nephrotoxicity Is Critically Mediated via the Human Organic Cation Transporter 2. Am. J. Pathol. 2005, 167, 1477–1484. [Google Scholar] [CrossRef] [Green Version]
- Filipski, K.K.; Mathijssen, R.H.; Mikkelsen, T.S.; Schinkel, A.H.; Sparreboom, A. Contribution of Organic Cation Transporter 2 (OCT2) to Cisplatin-Induced Nephrotoxicity. Clin. Pharmacol. Ther. 2009, 86, 396–402. [Google Scholar] [CrossRef]
- Yonezawa, A.; Masuda, S.; Yokoo, S.; Katsura, T.; Inui, K.-I. Cisplatin and Oxaliplatin, but Not Carboplatin and Nedaplatin, Are Substrates for Human Organic Cation Transporters (SLC22A1-3 and Multidrug and Toxin Extrusion Family). J. Pharmacol. Exp. Ther. 2006, 319, 879–886. [Google Scholar] [CrossRef] [PubMed] [Green Version]
- Yonezawa, A.; Masuda, S.; Nishihara, K.; Yano, I.; Katsura, T.; Inui, K. Association between Tubular Toxicity of Cisplatin and Expression of Organic Cation Transporter ROCT2 (Slc22a2) in the Rat. Biochem. Pharmacol. 2005, 70, 1823–1831. [Google Scholar] [CrossRef] [PubMed]
- Pabla, N.; Gibson, A.A.; Buege, M.; Ong, S.S.; Li, L.; Hu, S.; Du, G.; Sprowl, J.A.; Vasilyeva, A.; Janke, L.J.; et al. Mitigation of Acute Kidney Injury by Cell-Cycle Inhibitors That Suppress Both CDK4/6 and OCT2 Functions. Proc. Natl. Acad. Sci. USA 2015, 112, 5231–5236. [Google Scholar] [CrossRef] [PubMed]
- Sprowl, J.A.; Lancaster, C.S.; Pabla, N.; Hermann, E.; Kosloske, A.M.; Gibson, A.A.; Li, L.; Zeeh, D.; Schlatter, E.; Janke, L.J.; et al. Cisplatin-Induced Renal Injury Is Independently Mediated by OCT2 and P53. Clin. Cancer Res. 2014, 20, 4026–4035. [Google Scholar] [CrossRef] [PubMed] [Green Version]
- Sears, S.M.; Sharp, C.N.; Krueger, A.; Oropilla, G.B.; Saforo, D.; Doll, M.A.; Megyesi, J.; Beverly, L.J.; Siskind, L.J. C57BL/6 Mice Require a Higher Dose of Cisplatin to Induce Renal Fibrosis and CCL2 Correlates with Cisplatin-Induced Kidney Injury. Am. J. Physiol.-Ren. Physiol. 2020, 319, F674–F685. [Google Scholar] [CrossRef] [PubMed]
- Rabe, M.; Schaefer, F. Non-Transgenic Mouse Models of Kidney Disease. Nephron 2016, 133, 53–61. [Google Scholar] [CrossRef]
- Motohashi, H.; Sakurai, Y.; Saito, H.; Masuda, S.; Urakami, Y.; Goto, M.; Fukatsu, A.; Ogawa, O.; Inui, K.-I. Gene Expression Levels and Immunolocalization of Organic Ion Transporters in the Human Kidney. J. Am. Soc. Nephrol. 2002, 13, 866–874. [Google Scholar] [CrossRef]
- Oswald, S.; Müller, J.; Neugebauer, U.; Schröter, R.; Herrmann, E.; Pavenstädt, H.; Ciarimboli, G. Protein Abundance of Clinically Relevant Drug Transporters in The Human Kidneys. Int. J. Mol. Sci. 2019, 20, 5303. [Google Scholar] [CrossRef] [Green Version]
- Carozzi, V.A.; Canta, A.; Oggioni, N.; Sala, B.; Chiorazzi, A.; Meregalli, C.; Bossi, M.; Marmiroli, P.; Cavaletti, G. Neurophysiological and Neuropathological Characterization of New Murine Models of Chemotherapy-Induced Chronic Peripheral Neuropathies. Exp. Neurol. 2010, 226, 301–309. [Google Scholar] [CrossRef]
- Schaumburg, H.H.; Zotova, E.; Raine, C.S.; Tar, M.; Arezzo, J. The Rat Caudal Nerves: A Model for Experimental Neuropathies. J. Peripher. Nerv. Syst. 2010, 15, 128–139. [Google Scholar] [CrossRef]
- Cavaletti, G.; Tredici, G.; Marmiroli, P.; Petruccioli, M.G.; Barajon, I.; Fabbrica, D. Morphometric Study of the Sensory Neuron and Peripheral Nerve Changes Induced by Chronic Cisplatin (DDP) Administration in Rats. Acta Neuropathol. 1992, 84, 364–371. [Google Scholar] [CrossRef] [PubMed]
- Lessans, S.; Lassiter, C.B.; Carozzi, V.; Heindel, P.; Semperboni, S.; Oggioni, N.; Chiorazzi, A.; Thompson, C.; Wagner, M.; Holden, J.; et al. Global Transcriptomic Profile of Dorsal Root Ganglion and Physiological Correlates of Cisplatin-Induced Peripheral Neuropathy. Nurs. Res. 2019, 68, 145–155. [Google Scholar] [CrossRef] [PubMed]
- Huang, K.M.; Leblanc, A.F.; Uddin, M.E.; Kim, J.Y.; Chen, M.; Eisenmann, E.D.; Gibson, A.A.; Li, Y.; Hong, K.W.; DiGiacomo, D.; et al. Neuronal Uptake Transporters Contribute to Oxaliplatin Neurotoxicity in Mice. J. Clin. Investig. 2020, 130, 4601–4606. [Google Scholar] [CrossRef] [PubMed]
- Jong, N.N.; Nakanishi, T.; Liu, J.J.; Tamai, I.; McKeage, M.J. Oxaliplatin Transport Mediated by Organic Cation/Carnitine Transporters OCTN1 and OCTN2 in Overexpressing Human Embryonic Kidney 293 Cells and Rat Dorsal Root Ganglion Neurons. J. Pharmacol. Exp. Ther. 2011, 338, 537–547. [Google Scholar] [CrossRef] [PubMed] [Green Version]
- Liu, J.J.; Jamieson, S.M.F.; Subramaniam, J.; Ip, V.; Jong, N.N.; Mercer, J.F.B.; McKeage, M.J. Neuronal Expression of Copper Transporter 1 in Rat Dorsal Root Ganglia: Association with Platinum Neurotoxicity. Cancer Chemother. Pharmacol. 2009, 64, 847–856. [Google Scholar] [CrossRef]
- Koepsell, H. Multiple Binding Sites in Organic Cation Transporters Require Sophisticated Procedures to Identify Interactions of Novel Drugs. Biol. Chem. 2019, 400, 195–207. [Google Scholar] [CrossRef] [Green Version]
- Keller, T.; Gorboulev, V.; Mueller, T.D.; Dötsch, V.; Bernhard, F.; Koepsell, H. Rat Organic Cation Transporter 1 Contains Three Binding Sites for Substrate 1-Methyl-4-phenylpyridinium per Monomer. Mol. Pharmacol. 2019, 95, 169–182. [Google Scholar] [CrossRef] [Green Version]
- Popp, C.; Gorboulev, V.; Müller, T.D.; Gorbunov, D.; Shatskaya, N.; Koepsell, H. Amino Acids Critical for Substrate Affinity of Rat Organic Cation Transporter 1 Line the Substrate Binding Region in a Model Derived from the Tertiary Structure of Lactose Permease. Mol. Pharmacol. 2005, 67, 1600–1611. [Google Scholar] [CrossRef] [Green Version]
- Ciarimboli, G.; Koepsell, H.; Iordanova, M.; Gorboulev, V.; Dürner, B.; Lang, D.; Edemir, B.; Schröter, R.; Van Le, T.; Schlatter, E. Individual PKC-Phosphorylation Sites in Organic Cation Transporter 1 Determine Substrate Selectivity and Transport Regulation. J. Am. Soc. Nephrol. 2005, 16, 1562–1570. [Google Scholar] [CrossRef] [Green Version]
- Jonker, J.W.; Wagenaar, E.; Van Eijl, S.; Schinkel, A.H. Deficiency in the Organic Cation Transporters 1 and 2 (Oct1/Oct2 [Slc22a1/Slc22a2]) in Mice Abolishes Renal Secretion of Organic Cations. Mol. Cell. Biol. 2003, 23, 7902–7908. [Google Scholar] [CrossRef] [Green Version]
- Gage, G.J.; Kipke, D.R.; Shain, W. Whole Animal Perfusion Fixation for Rodents. J. Vis. Exp. 2012, 65, e3564. [Google Scholar] [CrossRef] [Green Version]
- Marmiroli, P.; Riva, B.; Pozzi, E.; Ballarini, E.; Lim, D.; Chiorazzi, A.; Meregalli, C.; Distasi, C.; Renn, C.L.; Semperboni, S.; et al. Susceptibility of Different Mouse Strains to Oxaliplatin Peripheral Neurotoxicity: Phenotypic and Genotypic Insights. PLoS ONE 2017, 12, e0186250. [Google Scholar] [CrossRef]
- Canta, A.; Chiorazzi, A.; Carozzi, V.; Meregalli, C.; Oggioni, N.; Sala, B.; Crippa, L.; Avezza, F.; Forestieri, D.; Rotella, G.; et al. In Vivo Comparative Study of the Cytotoxicity of a Liposomal Formulation of Cisplatin (LipoplatinTM). Cancer Chemother. Pharmacol. 2011, 68, 1001–1008. [Google Scholar] [CrossRef]
- Massmann, V.; Edemir, B.; Schlatter, E.; Al-Monajjed, R.; Harrach, S.; Klassen, P.; Holle, S.K.; Sindic, A.; Dobrivojevic, M.; Pavenstädt, H.; et al. The Organic Cation Transporter 3 (OCT3) as Molecular Target of Psychotropic Drugs: Transport Characteristics and Acute Regulation of Cloned Murine OCT3. Pflugers Arch. 2014, 466, 517–527. [Google Scholar] [CrossRef] [PubMed]
- Harrach, S.; Haag, J.; Steinbüchel, M.; Schröter, R.; Neugebauer, U.; Bertrand, J.; Ciarimboli, G. Interaction of Masitinib with Organic Cation Transporters. Int. J. Mol. Sci. 2022, 23, 14189. [Google Scholar] [CrossRef] [PubMed]
- Röhr, D.; Halfter, H.; Schulz, J.B.; Young, P.; Gess, B. Sodium-Dependent Vitamin C Transporter 2 Deficiency Impairs Myelination and Remyelination after Injury: Roles of Collagen and Demethylation. Glia 2017, 65, 1186–1200. [Google Scholar] [CrossRef]
- Ciarimboli, G.; Schlatter, E. Organic Cation Transport Measurements Using Fluorescence Techniques; Bönisch, H. , Sitte, H.H., Eds.; Springer Science+Business Media: New York, NY, USA, 2016; pp. 173–187. [Google Scholar]
- Wilde, S.; Schlatter, E.; Koepsell, H.; Edemir, B.; Reuter, S.; Pavenstädt, H.; Neugebauer, U.; Schröter, R.; Brast, S.; Ciarimboli, G. Calmodulin-Associated Post-Translational Regulation of Rat Organic Cation Transporter 2 in the Kidney Is Gender Dependent. Cell Mol. Life Sci. 2009, 66, 1729–1740. [Google Scholar] [CrossRef]
- Mosmann, T. Rapid Colorimetric Assay for Cellular Growth and Survival: Application to Proliferation and Cytotoxicity Assays. J. Immunol. Methods 1983, 65, 55–63. [Google Scholar] [CrossRef]

Disclaimer/Publisher’s Note: The statements, opinions and data contained in all publications are solely those of the individual author(s) and contributor(s) and not of MDPI and/or the editor(s). MDPI and/or the editor(s) disclaim responsibility for any injury to people or property resulting from any ideas, methods, instructions or products referred to in the content. |
© 2023 by the authors. Licensee MDPI, Basel, Switzerland. This article is an open access article distributed under the terms and conditions of the Creative Commons Attribution (CC BY) license (https://creativecommons.org/licenses/by/4.0/).
Share and Cite
Hucke, A.; Schröter, R.; Ceresa, C.; Chiorazzi, A.; Canta, A.; Semperboni, S.; Marmiroli, P.; Cavaletti, G.; Gess, B.; Ciarimboli, G. Role of Mouse Organic Cation Transporter 2 for Nephro- and Peripheral Neurotoxicity Induced by Chemotherapeutic Treatment with Cisplatin. Int. J. Mol. Sci. 2023, 24, 11486. https://doi.org/10.3390/ijms241411486
Hucke A, Schröter R, Ceresa C, Chiorazzi A, Canta A, Semperboni S, Marmiroli P, Cavaletti G, Gess B, Ciarimboli G. Role of Mouse Organic Cation Transporter 2 for Nephro- and Peripheral Neurotoxicity Induced by Chemotherapeutic Treatment with Cisplatin. International Journal of Molecular Sciences. 2023; 24(14):11486. https://doi.org/10.3390/ijms241411486
Chicago/Turabian StyleHucke, Anna, Rita Schröter, Cecilia Ceresa, Alessia Chiorazzi, Annalisa Canta, Sara Semperboni, Paola Marmiroli, Guido Cavaletti, Burkhard Gess, and Giuliano Ciarimboli. 2023. "Role of Mouse Organic Cation Transporter 2 for Nephro- and Peripheral Neurotoxicity Induced by Chemotherapeutic Treatment with Cisplatin" International Journal of Molecular Sciences 24, no. 14: 11486. https://doi.org/10.3390/ijms241411486