
Unlocking the Potential of Stroke Blood Biomarkers: Early Diagnosis, Ischemic vs. Haemorrhagic Differentiation and Haemorrhagic Transformation Risk: A Comprehensive Review

 ,
,  ,
,
Abstract
:1. Introduction
- Diagnostic biomarkers: able to differentiate stroke (ischemic or haemorrhagic) from stroke mimics
- Differentiating biomarkers: able to distinguish intraparenchymal haemorrhage from cerebral ischemia
- Predictive biomarkers: able to predict the possible haemorrhagic transformation of an ischemic stroke.
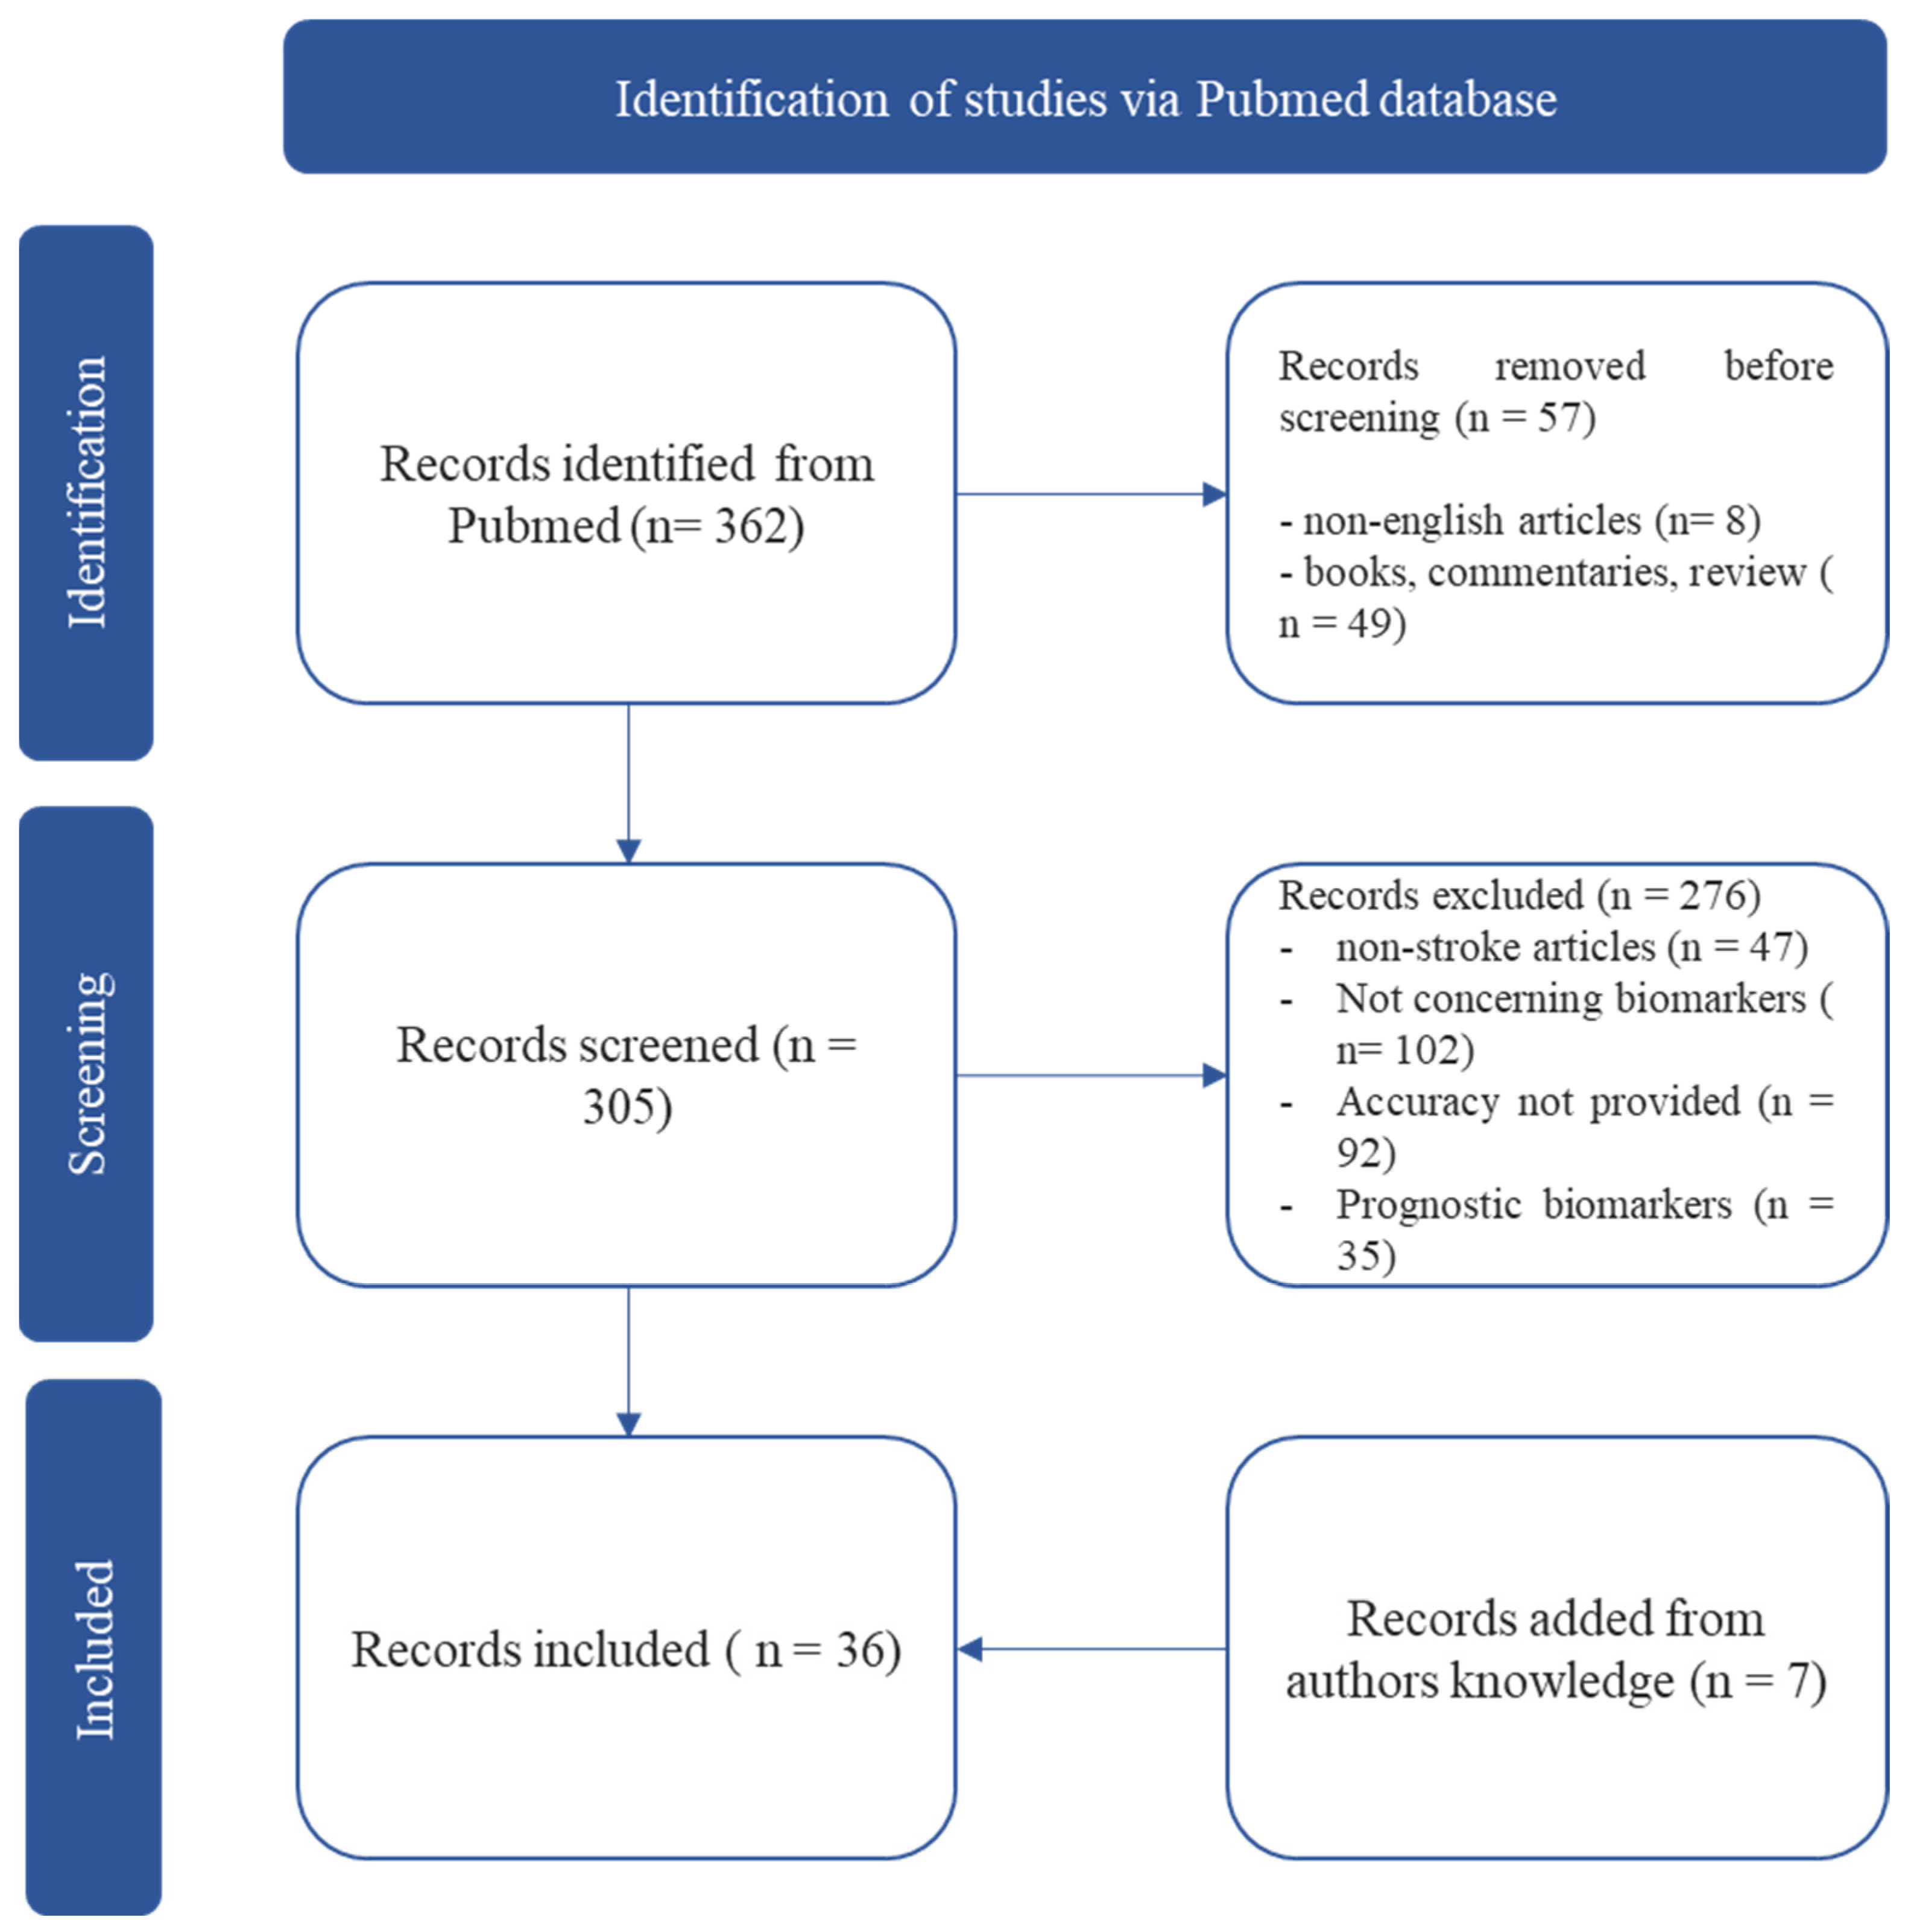
2. Methods
3. Results
3.1. GFAP
3.2. NSE
3.3. S100b
3.4. MMP-9
3.5. NT-ProBNP
3.6. IMA and IMA Index
3.7. FABP
3.8. NR2 and Anti-NR2A/B Antibodies
3.9. ATIII and Fibrinogen
3.10. Other Biomarker
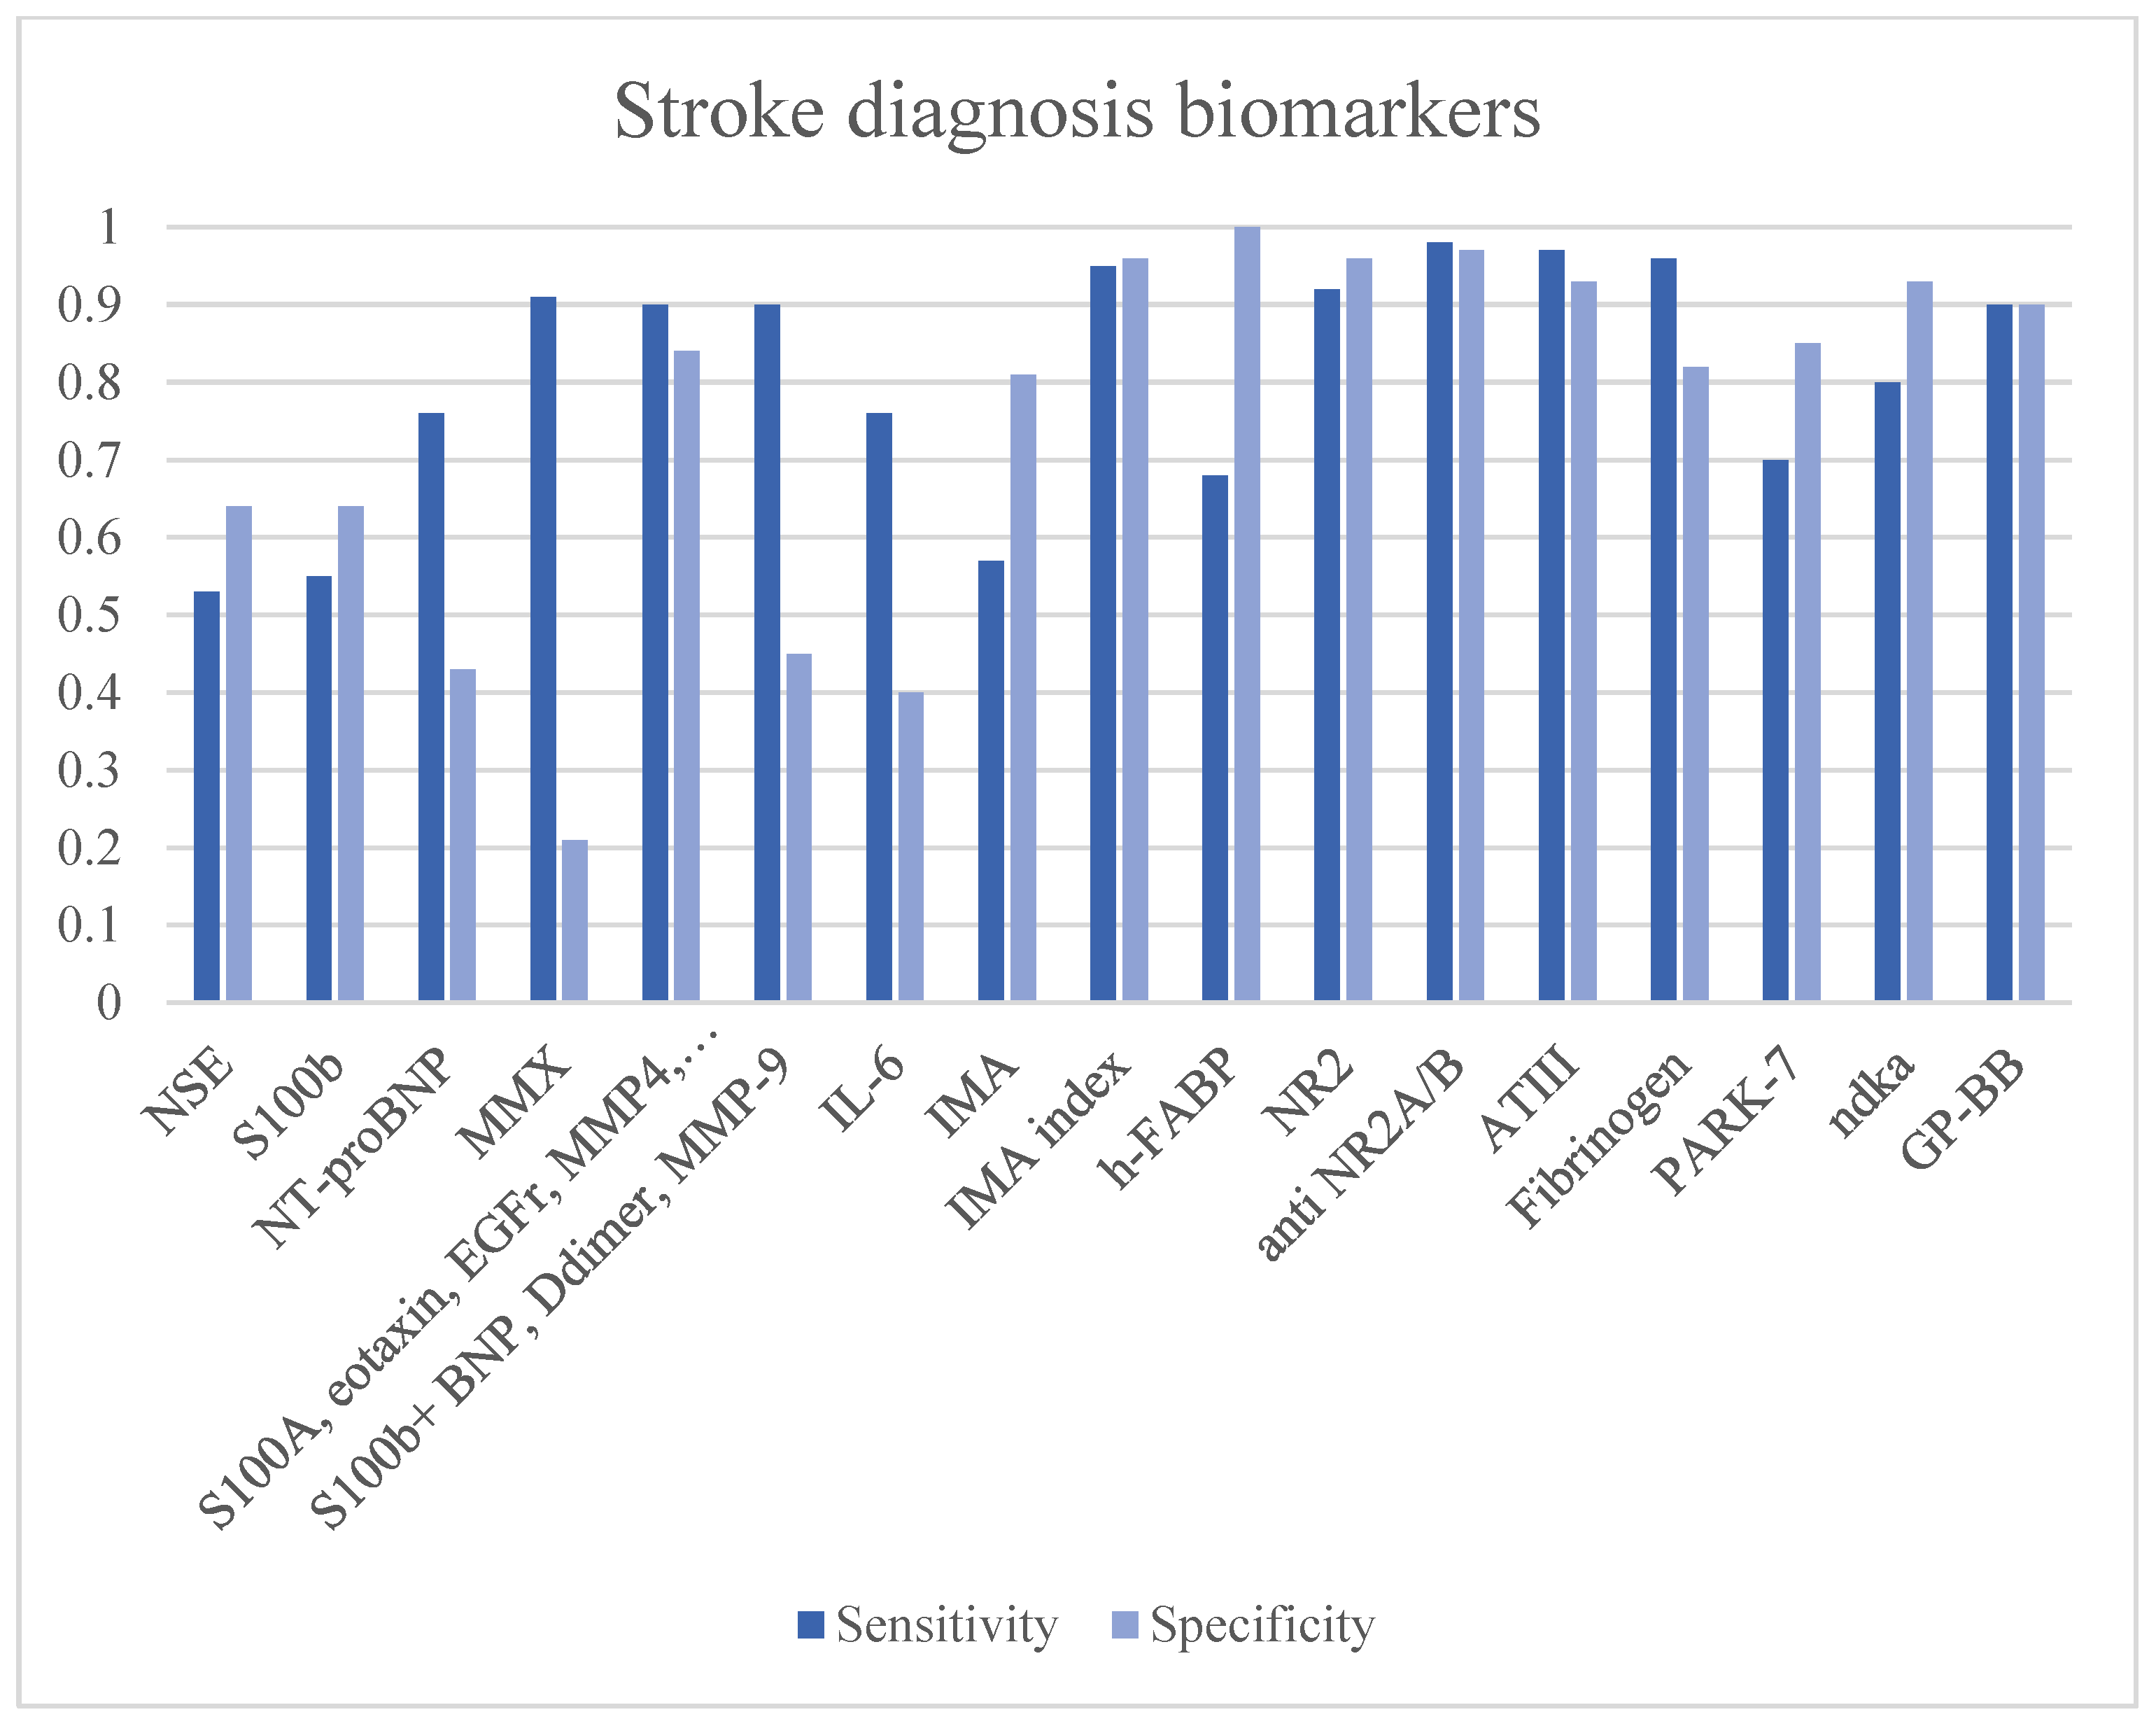
3.11. Stroke Diagnosis Biomarkers
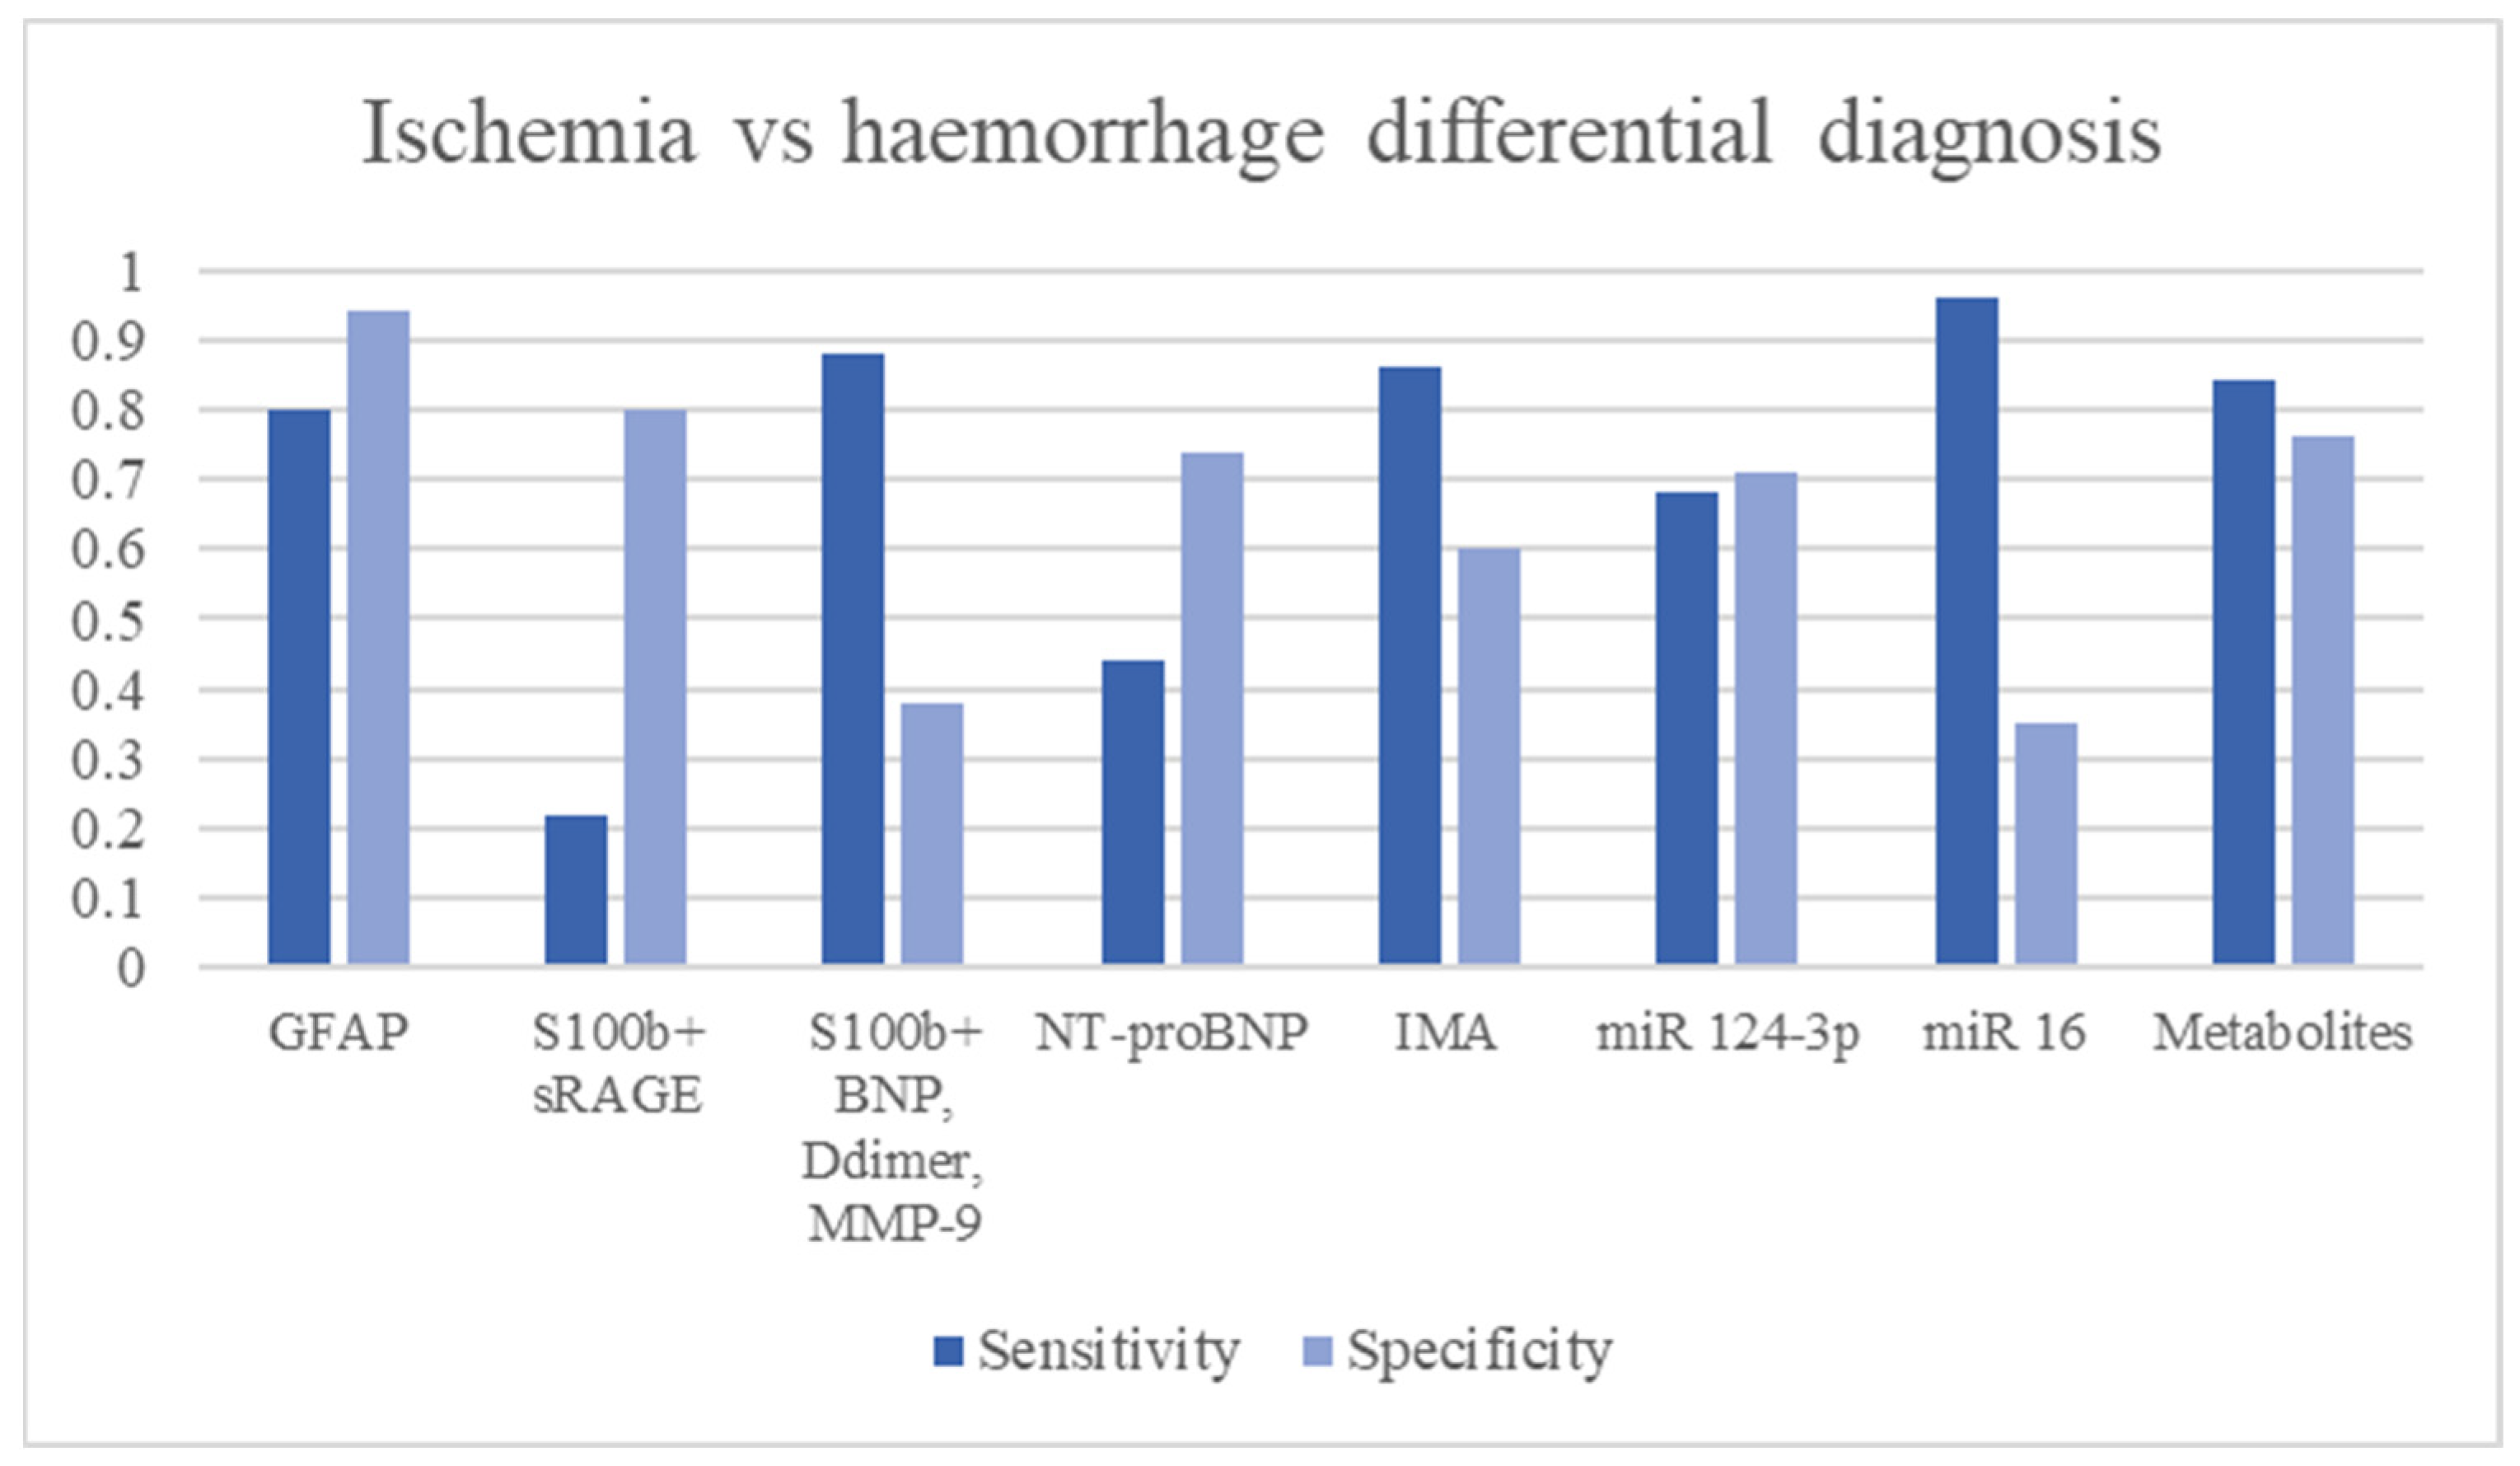
3.12. Ischemic vs. Haemorrhagic Stroke Differential Diagnosis
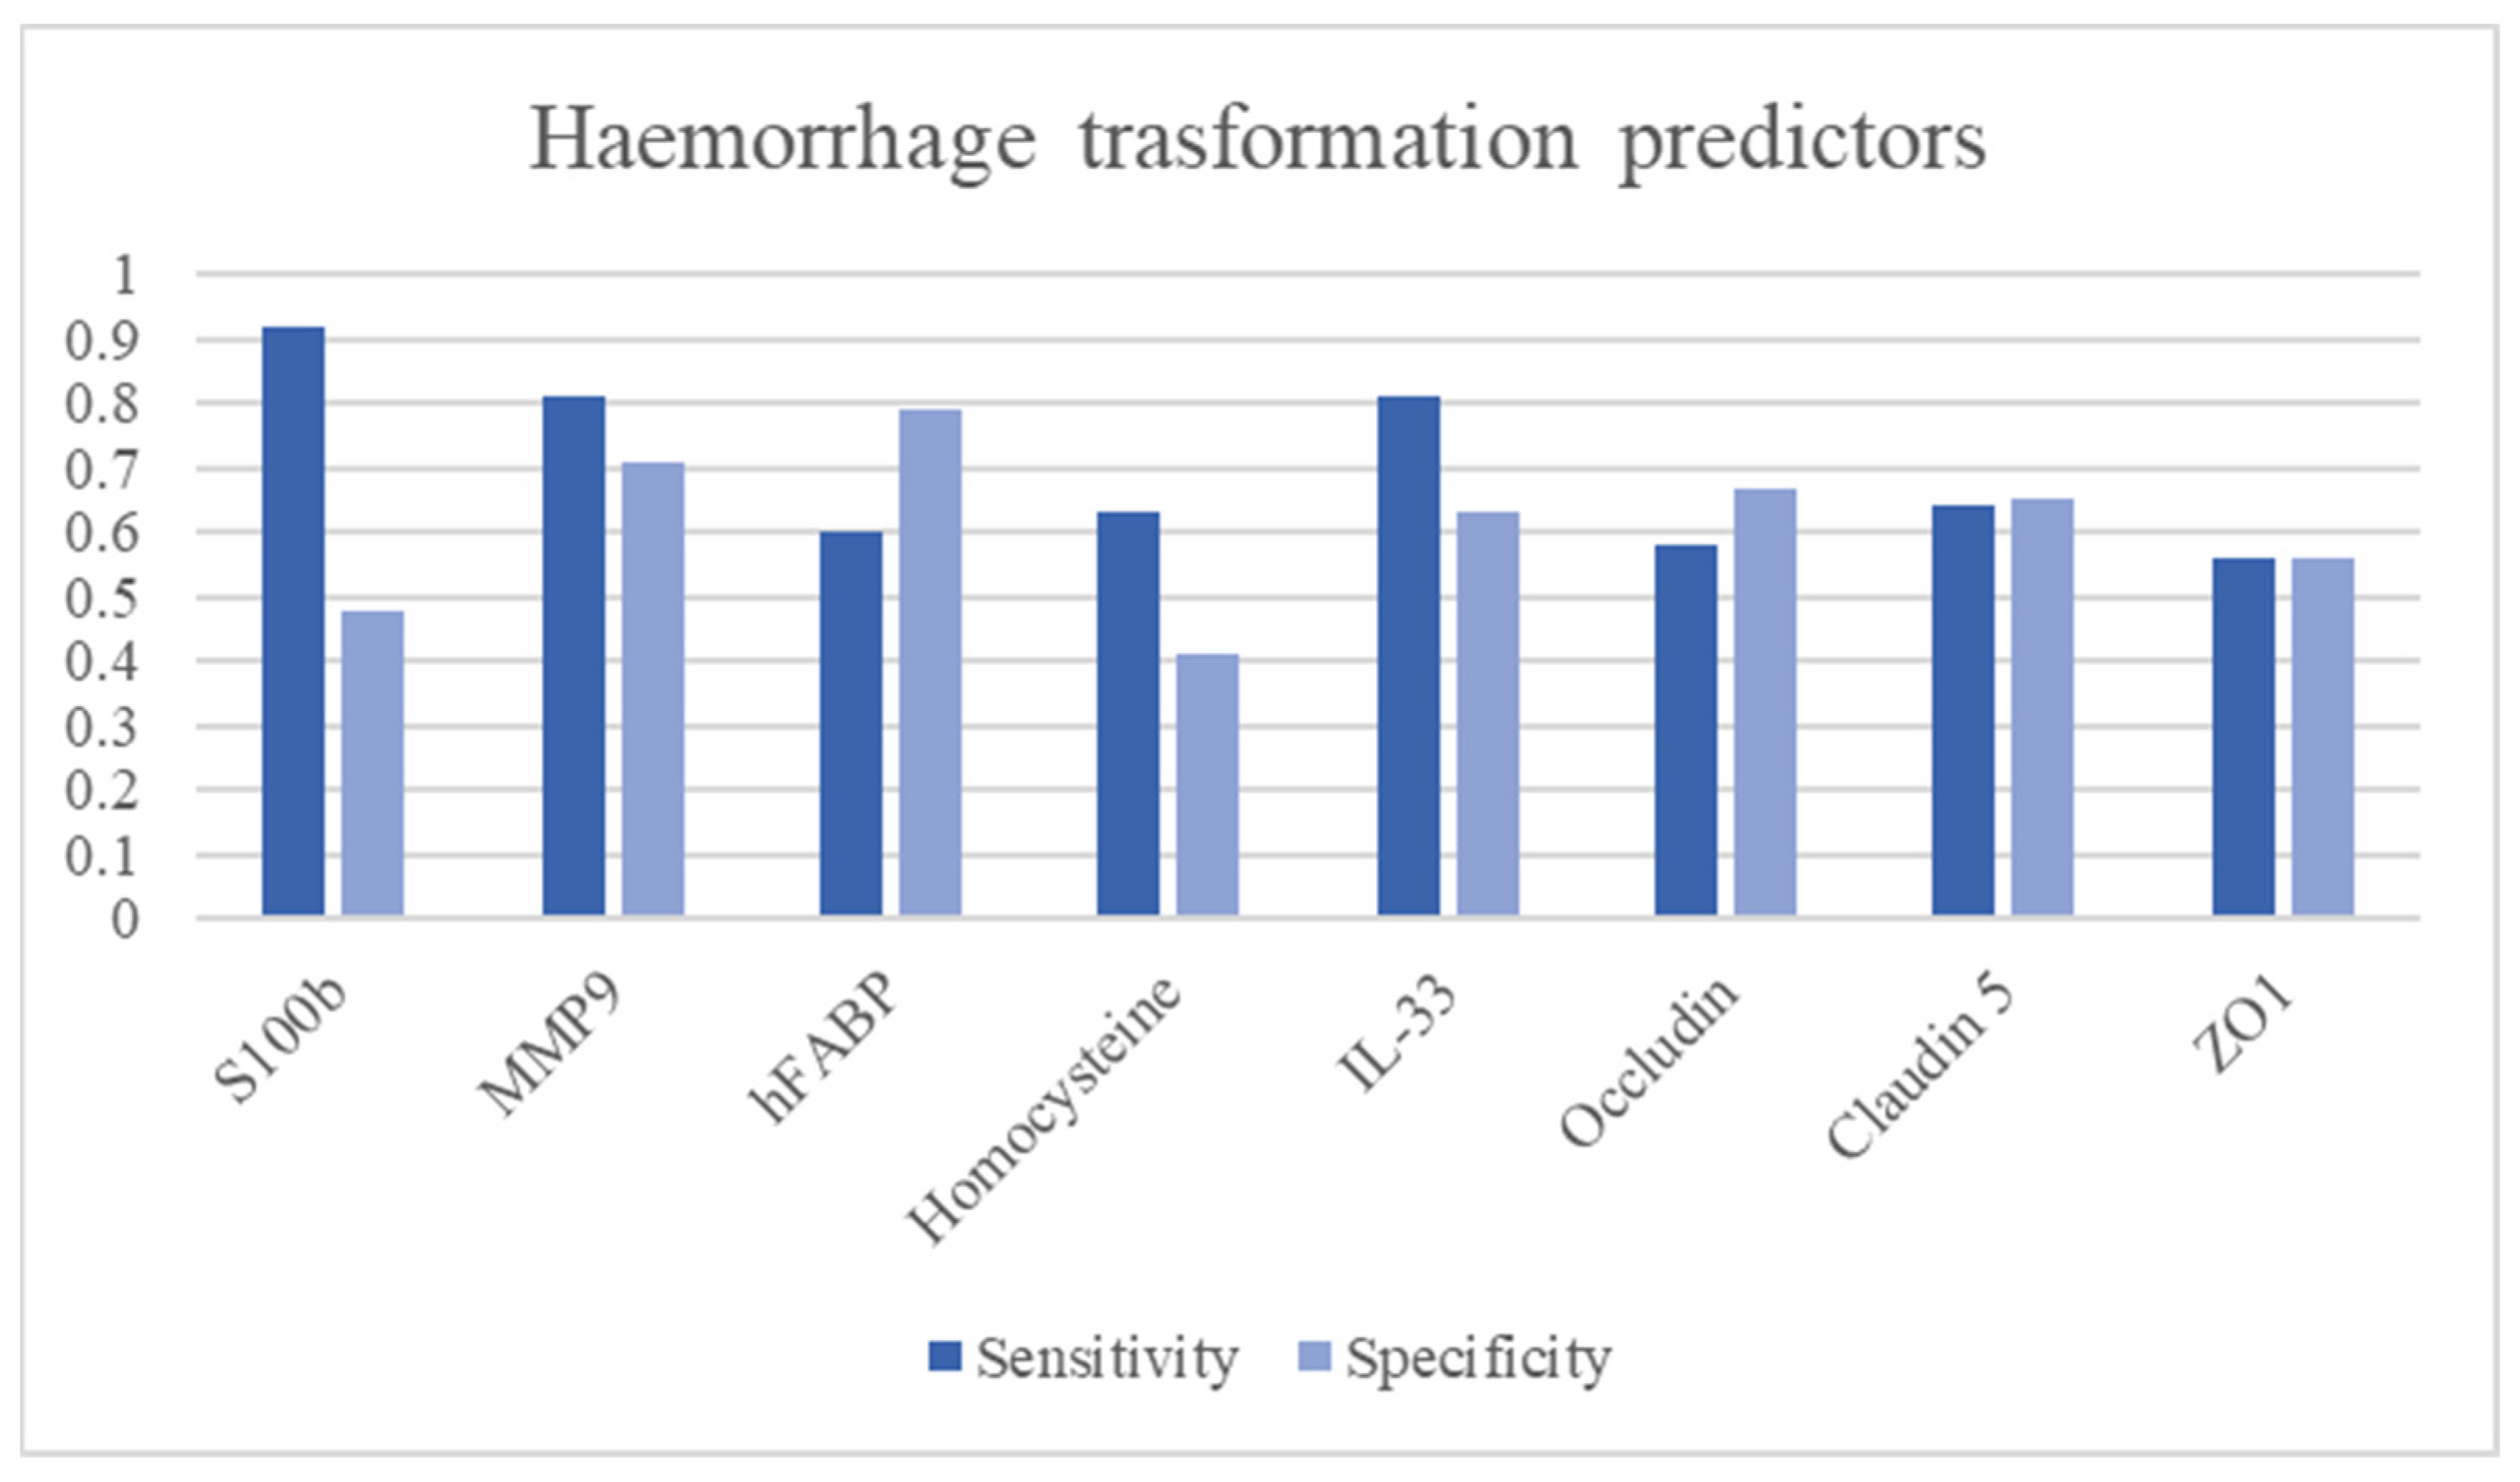
3.13. Haemorrhagic Stroke Transformation Predictors
4. Discussion
Biomarkers Panel
Author Contributions
Funding
Institutional Review Board Statement
Informed Consent Statement
Data Availability Statement
Conflicts of Interest
References
- Saver, J.L. Time Is Brain—Quantified. Stroke 2006, 37, 263–266. [Google Scholar] [CrossRef] [PubMed] [Green Version]
- Risitano, A.; Toni, D. Time is brain: Timing of revascularization of brain arteries in stroke. Eur. Heart J. Suppl. 2020, 22, L155–L159. [Google Scholar] [CrossRef] [PubMed]
- Saver, J.L.; Fonarow, G.C.; Smith, E.E.; Reeves, M.J.; Grau-Sepulveda, M.V.; Pan, W.; Olson, D.M.; Hernandez, A.F.; Peterson, E.D.; Schwamm, L.H. Time to treatment with intravenous tissue plasminogen activator and outcome from acute ischemic stroke. JAMA 2013, 309, 2480–2488. [Google Scholar] [CrossRef] [PubMed] [Green Version]
- di Biase, L.; Bonura, A.; Caminiti, M.L.; Pecoraro, P.M.; Di Lazzaro, V. Neurophysiology tools to lower the stroke onset to treatment time during the golden hour: Microwaves, bioelectrical impedance and near infrared spectroscopy. Ann. Med. 2022, 54, 2658–2671. [Google Scholar] [CrossRef]
- Powers, W.J.; Rabinstein, A.A.; Ackerson, T.; Adeoye, O.M.; Bambakidis, N.C.; Becker, K.; Biller, J.; Brown, M.; Demaerschalk, B.M.; Hoh, B.; et al. Guidelines for the Early Management of Patients With Acute Ischemic Stroke: 2019 Update to the 2018 Guidelines for the Early Management of Acute Ischemic Stroke: A Guideline for Healthcare Professionals From the American Heart Association/American Stroke Association. Stroke 2019, 50, e344–e418. [Google Scholar] [PubMed]
- Kleindorfer, D.O.; Towfighi, A.; Chaturvedi, S.; Cockroft, K.M.; Gutierrez, J.; Lombardi-Hill, D.; Kamel, H.; Kernan, W.N.; Kittner, S.J.; Leira, E.C.; et al. 2021 Guideline for the Prevention of Stroke in Patients With Stroke and Transient Ischemic Attack: A Guideline From the American Heart Association/American Stroke Association. Stroke 2021, 52, e364–e467. [Google Scholar] [CrossRef]
- Berge, E.; Whiteley, W.; Audebert, H.; De Marchis, G.M.; Fonseca, A.C.; Padiglioni, C.; de la Ossa, N.P.; Strbian, D.; Tsivgoulis, G.; Turc, G. European Stroke Organisation (ESO) guidelines on intravenous thrombolysis for acute ischaemic stroke. Eur. Stroke J. 2021, 6, I–LXII. [Google Scholar] [CrossRef] [PubMed]
- Turc, G.; Bhogal, P.; Fischer, U.; Khatri, P.; Lobotesis, K.; Mazighi, M.; Schellinger, P.D.; Toni, D.; de Vries, J.; White, P.; et al. European Stroke Organisation (ESO)-European Society for Minimally Invasive Neurological Therapy (ESMINT) Guidelines on Mechanical Thrombectomy in Acute Ischemic Stroke. J. NeuroInterventional Surg. 2019, 4, 6–12. [Google Scholar] [CrossRef] [Green Version]
- Hacke, W.; Kaste, M.; Bluhmki, E.; Brozman, M.; Dávalos, A.; Guidetti, D.; Larrue, V.; Lees, K.R.; Medeghri, Z.; Machnig, T.; et al. Thrombolysis with alteplase 3 to 4.5 hours after acute ischemic stroke. N. Engl. J. Med. 2008, 359, 1317–1329. [Google Scholar] [CrossRef] [Green Version]
- Albers, G.W.; Clark, W.M.; Madden, K.P.; Hamilton, S.A. ATLANTIS trial: Results for patients treated within 3 hours of stroke onset. Alteplase Thrombolysis for Acute Noninterventional Therapy in Ischemic Stroke. Stroke 2002, 33, 493–495. [Google Scholar] [CrossRef] [Green Version]
- Marler, J.R. NINDS clinical trials in stroke: Lessons learned and future directions. Stroke 2007, 38, 3302–3307. [Google Scholar] [CrossRef] [PubMed] [Green Version]
- Davis, S.M.; Donnan, G.A.; Parsons, M.W.; Levi, C.; Butcher, K.S.; Peeters, A.; Barber, P.A.; Bladin, C.; De Silva, D.A.; Byrnes, G.; et al. Effects of alteplase beyond 3 h after stroke in the Echoplanar Imaging Thrombolytic Evaluation Trial (EPITHET): A placebo-controlled randomised trial. Lancet Neurol. 2008, 7, 299–309. [Google Scholar] [CrossRef] [PubMed]
- Lees, K.R.; Bluhmki, E.; von Kummer, R.; Brott, T.G.; Toni, D.; Grotta, J.C.; Albers, G.W.; Kaste, M.; Marler, J.R.; Hamilton, S.A.; et al. Time to treatment with intravenous alteplase and outcome in stroke: An updated pooled analysis of ECASS, ATLANTIS, NINDS, and EPITHET trials. Lancet 2010, 375, 1695–1703. [Google Scholar] [CrossRef] [PubMed]
- Mowla, A.; Doyle, J.; Lail, N.S.; Rajabzadeh-Oghaz, H.; Deline, C.; Shirani, P.; Ching, M.; Crumlish, A.; Steck, D.A.; Janicke, D.; et al. Delays in door-to-needle time for acute ischemic stroke in the emergency department: A comprehensive stroke center experience. J. Neurol. Sci. 2017, 376, 102–105. [Google Scholar] [CrossRef] [PubMed]
- Birenbaum, D.; Bancroft, L.W.; Felsberg, G.J. Imaging in Acute Stroke. West. J. Emerg. Med. 2011, 12, 67–76. [Google Scholar]
- Albers, G.W. Diffusion-weighted MRI for evaluation of acute stroke. Neurology 1998, 51, S47–S49. [Google Scholar] [CrossRef] [PubMed]
- Kim, B.J.; Kang, H.G.; Kim, H.-J.; Ahn, S.-H.; Kim, N.Y.; Warach, S.; Kang, D.-W. Magnetic Resonance Imaging in Acute Ischemic Stroke Treatment. J. Stroke 2014, 16, 131–145. [Google Scholar] [CrossRef] [PubMed] [Green Version]
- Keller, T.; Zeller, T.; Peetz, D.; Tzikas, S.; Roth, A.; Czyz, E.; Bickel, C.; Baldus, S.; Warnholtz, A.; Fröhlich, M.; et al. Sensitive Troponin I Assay in Early Diagnosis of Acute Myocardial Infarction. N. Engl. J. Med. 2009, 361, 868–877. [Google Scholar] [CrossRef] [PubMed] [Green Version]
- Kamtchum-Tatuene, J.; Jickling, G.C. Blood Biomarkers for Stroke Diagnosis and Management. Neuromolecular Med. 2019, 21, 344–368. [Google Scholar] [CrossRef]
- Driga, M.P.; Catalin, B.; Olaru, D.G.; Slowik, A.; Plesnila, N.; Hermann, D.M.; Popa-Wagner, A. The Need for New Biomarkers to Assist with Stroke Prevention and Prediction of Post-Stroke Therapy Based on Plasma-Derived Extracellular Vesicles. Biomedicines 2021, 9, 1226. [Google Scholar] [CrossRef]
- Kuriakose, D.; Xiao, Z. Pathophysiology and Treatment of Stroke: Present Status and Future Perspectives. Int. J. Mol. Sci. 2020, 21, 7609. [Google Scholar] [CrossRef] [PubMed]
- Ng, G.J.L.; Quek, A.M.L.; Cheung, C.; Arumugam, T.V.; Seet, R.C.S. Stroke biomarkers in clinical practice: A critical appraisal. Neurochem. Int. 2017, 107, 11–22. [Google Scholar] [CrossRef] [PubMed]
- Baez, S.d.l.C.; García del Barco, D.; Hardy-Sosa, A.; Guillen Nieto, G.; Bringas-Vega, M.L.; Llibre-Guerra, J.J.; Valdes-Sosa, P. Scalable Bio Marker Combinations for Early Stroke Diagnosis: A Systematic Review. Front. Neurol. 2021, 12, 638693. [Google Scholar] [CrossRef] [PubMed]
- Jacque, C.M.; Vinner, C.; Kujas, M.; Raoul, M.; Racadot, J.; Baumann, N.A. Determination of glial fibrillary acidic protein (GFAP) in human brain tumors. J. Neurol. Sci. 1978, 35, 147–155. [Google Scholar] [CrossRef] [PubMed]
- Weinstein, D.E.; Shelanski, M.L.; Liem, R.K. Suppression by antisense mRNA demonstrates a requirement for the glial fibrillary acidic protein in the formation of stable astrocytic processes in response to neurons. J. Cell Biol. 1991, 112, 1205–1213. [Google Scholar] [CrossRef] [PubMed]
- Liedtke, W.; Edelmann, W.; Bieri, P.L.; Chiu, F.C.; Cowan, N.J.; Kucherlapati, R.; Raine, C.S. GFAP is necessary for the integrity of CNS white matter architecture and long-term maintenance of myelination. Neuron 1996, 17, 607–615. [Google Scholar] [CrossRef] [Green Version]
- Paetau, A.; Elovaara, I.; Paasivuo, R.; Virtanen, I.; Palo, J.; Haltia, M. Glial filaments are a major brain fraction in infantile neuronal ceroid-lipofuscinosis. Acta Neuropathol. 1985, 65, 190–194. [Google Scholar] [CrossRef]
- Foerch, C.; Curdt, I.; Yan, B.; Dvorak, F.; Hermans, M.; Berkefeld, J.; Raabe, A.; Neumann-Haefelin, T.; Steinmetz, H.; Sitzer, M. Serum glial fibrillary acidic protein as a biomarker for intracerebral haemorrhage in patients with acute stroke. J. Neurol. Neurosurg. Psychiatry 2006, 77, 181–184. [Google Scholar] [CrossRef] [PubMed] [Green Version]
- Foerch, C.; Niessner, M.; Back, T.; Bauerle, M.; De Marchis, G.M.; Ferbert, A.; Grehl, H.; Hamann, G.F.; Jacobs, A.; Kastrup, A.; et al. Diagnostic accuracy of plasma glial fibrillary acidic protein for differentiating intracerebral hemorrhage and cerebral ischemia in patients with symptoms of acute stroke. Clin. Chem. 2012, 58, 237–245. [Google Scholar] [CrossRef] [Green Version]
- Rozanski, M.; Waldschmidt, C.; Kunz, A.; Grittner, U.; Ebinger, M.; Wendt, M.; Winter, B.; Bollweg, K.; Villringer, K.; Fiebach, J.B.; et al. Glial Fibrillary Acidic Protein for Prehospital Diagnosis of Intracerebral Hemorrhage. Cerebrovasc. Dis. 2017, 43, 76–81. [Google Scholar] [CrossRef]
- Llombart, V.; García-Berrocoso, T.; Bustamante, A.; Giralt, D.; Rodriguez-Luna, D.; Muchada, M.; Penalba, A.; Boada, C.; Hernández-Guillamon, M.; Montaner, J. Plasmatic retinol-binding protein 4 and glial fibrillary acidic protein as biomarkers to differentiate ischemic stroke and intracerebral hemorrhage. J. Neurochem. 2016, 136, 416–424. [Google Scholar] [CrossRef] [PubMed]
- Xiong, L.; Yang, Y.; Zhang, M.; Xu, W. The use of serum glial fibrillary acidic protein test as a promising tool for intracerebral hemorrhage diagnosis in Chinese patients and prediction of the short-term functional outcomes. Neurol. Sci. 2015, 36, 2081–2087. [Google Scholar] [CrossRef] [PubMed]
- Katsanos, A.H.; Makris, K.; Stefani, D.; Koniari, K.; Gialouri, E.; Lelekis, M.; Chondrogianni, M.; Zompola, C.; Dardiotis, E.; Rizos, I.; et al. Plasma Glial Fibrillary Acidic Protein in the Differential Diagnosis of Intracerebral Hemorrhage. Stroke 2017, 48, 2586–2588. [Google Scholar] [CrossRef] [PubMed]
- Kumar, A.; Misra, S.; Yadav, A.K.; Sagar, R.; Verma, B.; Grover, A.; Prasad, K. Role of glial fibrillary acidic protein as a biomarker in differentiating intracerebral haemorrhage from ischaemic stroke and stroke mimics: A meta-analysis. Biomarkers 2020, 25, 1–8. [Google Scholar] [CrossRef] [PubMed]
- Perry, L.A.; Lucarelli, T.; Penny-Dimri, J.C.; McInnes, M.D.; Mondello, S.; Bustamante, A.; Montaner, J.; Foerch, C.; Kwan, P.; Davis, S.; et al. Glial fibrillary acidic protein for the early diagnosis of intracerebral hemorrhage: Systematic review and meta-analysis of diagnostic test accuracy. Int. J. Stroke 2019, 14, 390–399. [Google Scholar] [CrossRef]
- Clegg, N.; Ferguson, C.; True, L.D.; Arnold, H.; Moorman, A.; Quinn, J.E.; Vessella, R.L.; Nelson, P.S. Molecular characterization of prostatic small-cell neuroendocrine carcinoma. Prostate 2003, 55, 55–64. [Google Scholar] [CrossRef]
- Cunningham, R.T.; Watt, M.; Winder, J.; McKinstry, S.; Lawson, J.T.; Johnston, C.F.; Hawkins, S.A.; Buchanan, K.D. Serum neurone-specific enolase as an indicator of stroke volume. Eur. J. Clin. Investig. 1996, 26, 298–303. [Google Scholar] [CrossRef]
- Kim, B.J.; Kim, Y.-J.; Ahn, S.H.; Kim, N.Y.; Kang, D.-W.; Kim, J.S.; Kwon, S.U. The second elevation of neuron-specific enolase peak after ischemic stroke is associated with hemorrhagic transformation. J. Stroke Cerebrovasc. Dis. 2014, 23, 2437–2443. [Google Scholar] [CrossRef]
- Serum Neuron-Specific Enolase and S100 Calcium Binding Protein B Biomarker Levels Do Not Improve Diagnosis of Acute Stroke-PubMed. Available online: https://pubmed.ncbi.nlm.nih.gov/22953311/ (accessed on 1 June 2023).
- Wang, D.D.; Bordey, A. The astrocyte odyssey. Prog. Neurobiol. 2008, 86, 342–367. [Google Scholar] [CrossRef]
- Donato, R.; Cannon, B.R.; Sorci, G.; Riuzzi, F.; Hsu, K.; Weber, D.J.; Geczy, C.L. Functions of S100 Proteins. Curr. Mol. Med. 2013, 13, 24–57. [Google Scholar] [CrossRef] [PubMed] [Green Version]
- Koh, S.X.T.; Lee, J.K.W. S100B as a Marker for Brain Damage and Blood–Brain Barrier Disruption Following Exercise. Sports Med. 2014, 44, 369–385. [Google Scholar] [CrossRef] [PubMed]
- Montaner, J.; Mendioroz, M.; Delgado, P.; García-Berrocoso, T.; Giralt, D.; Merino, C.; Ribó, M.; Rosell, A.; Penalba, A.; Fernández-Cadenas, I.; et al. Differentiating ischemic from hemorrhagic stroke using plasma biomarkers: The S100B/RAGE pathway. J. Proteom. 2012, 75, 4758–4765. [Google Scholar] [CrossRef] [PubMed]
- Laskowitz, D.T.; Kasner, S.E.; Saver, J.; Remmel, K.S.; Jauch, E.C. BRAIN Study Group Clinical usefulness of a biomarker-based diagnostic test for acute stroke: The Biomarker Rapid Assessment in Ischemic Injury (BRAIN) study. Stroke 2009, 40, 77–85. [Google Scholar] [CrossRef] [PubMed] [Green Version]
- Kim, M.H.; Kang, S.Y.; Kim, M.C.; Lee, W.I. Plasma biomarkers in the diagnosis of acute ischemic stroke. Ann. Clin. Lab. Sci. 2010, 40, 336–341. [Google Scholar] [PubMed]
- Kazmierski, R.; Michalak, S.; Wencel-Warot, A.; Nowinski, W.L. Serum tight-junction proteins predict hemorrhagic transformation in ischemic stroke patients. Neurology 2012, 79, 1677–1685. [Google Scholar] [CrossRef] [PubMed]
- Meijer, B.; Gearry, R.B.; Day, A.S. The Role of S100A12 as a Systemic Marker of Inflammation. Int. J. Inflamm. 2012, 2012, 907078. [Google Scholar] [CrossRef] [PubMed] [Green Version]
- Sharma, R.; Macy, S.; Richardson, K.; Lokhnygina, Y.; Laskowitz, D.T. A blood-based biomarker panel to detect acute stroke. J. Stroke Cerebrovasc. Dis. 2014, 23, 910–918. [Google Scholar] [CrossRef]
- Visse, R.; Nagase, H. Matrix Metalloproteinases and Tissue Inhibitors of Metalloproteinases. Circ. Res. 2003, 92, 827–839. [Google Scholar] [CrossRef]
- Kozuka, K.; Kohriyama, T.; Nomura, E.; Ikeda, J.; Kajikawa, H.; Nakamura, S. Endothelial markers and adhesion molecules in acute ischemic stroke–sequential change and differences in stroke subtype. Atherosclerosis 2002, 161, 161–168. [Google Scholar] [CrossRef] [PubMed]
- Yuan, R.; Tan, S.; Wang, D.; Wu, S.; Cao, X.; Zhang, S.; Wu, B.; Liu, M. Predictive value of plasma matrix metalloproteinase-9 concentrations for spontaneous haemorrhagic transformation in patients with acute ischaemic stroke: A cohort study in Chinese patients. J. Clin. Neurosci. 2018, 58, 108–112. [Google Scholar] [CrossRef]
- Wang, L.; Wei, C.; Deng, L.; Wang, Z.; Song, M.; Xiong, Y.; Liu, M. The Accuracy of Serum Matrix Metalloproteinase-9 for Predicting Hemorrhagic Transformation After Acute Ischemic Stroke: A Systematic Review and Meta-Analysis. J. Stroke Cerebrovasc. Dis. 2018, 27, 1653–1665. [Google Scholar] [CrossRef] [PubMed]
- Potter, L.R.; Yoder, A.R.; Flora, D.R.; Antos, L.K.; Dickey, D.M. Natriuretic Peptides: Their Structures, Receptors, Physiologic Functions and Therapeutic Applications. In Handbook of Experimental Pharmacology; Springer: Berlin/Heidelberg, Germany, 2009; pp. 341–366. [Google Scholar] [CrossRef] [Green Version]
- Longstreth, W.T.; Kronmal, R.A.; Thompson, J.L.P.; Christenson, R.H.; Levine, S.R.; Gross, R.; Brey, R.L.; Buchsbaum, R.; Elkind, M.S.V.; Tirschwell, D.L.; et al. Amino terminal pro-B-type natriuretic peptide, secondary stroke prevention, and choice of antithrombotic therapy. Stroke 2013, 44, 714–719. [Google Scholar] [CrossRef] [PubMed] [Green Version]
- Fonseca, A.C.; Matias, J.S.; Pinho e Melo, T.; Falcão, F.; Canhão, P.; Ferro, J.M. N-terminal probrain natriuretic peptide as a biomarker of cardioembolic stroke. Int. J. Stroke 2011, 6, 398–403. [Google Scholar] [CrossRef] [PubMed]
- Bustamante, A.; López-Cancio, E.; Pich, S.; Penalba, A.; Giralt, D.; García-Berrocoso, T.; Ferrer-Costa, C.; Gasull, T.; Hernández-Pérez, M.; Millan, M.; et al. Blood Biomarkers for the Early Diagnosis of Stroke: The Stroke-Chip Study. Stroke 2017, 48, 2419–2425. [Google Scholar] [CrossRef] [PubMed]
- Bar-Or, D.; Curtis, G.; Rao, N.; Bampos, N.; Lau, E. Characterization of the Co(2+) and Ni(2+) binding amino-acid residues of the N-terminus of human albumin. An insight into the mechanism of a new assay for myocardial ischemia. Eur. J. Biochem. 2001, 268, 42–47. [Google Scholar] [CrossRef] [PubMed]
- Roy, D.; Quiles, J.; Gaze, D.C.; Collinson, P.; Kaski, J.C.; Baxter, G.F. Role of reactive oxygen species on the formation of the novel diagnostic marker ischaemia modified albumin. Heart 2006, 92, 113–114. [Google Scholar] [CrossRef] [Green Version]
- Bar-Or, D.; Winkler, J.V.; Vanbenthuysen, K.; Harris, L.; Lau, E.; Hetzel, F.W. Reduced albumin-cobalt binding with transient myocardial ischemia after elective percutaneous transluminal coronary angioplasty: A preliminary comparison to creatine kinase-MB, myoglobin, and troponin I. Am. Heart J. 2001, 141, 985–991. [Google Scholar] [CrossRef] [PubMed] [Green Version]
- Sinha, M.K.; Gaze, D.C.; Tippins, J.R.; Collinson, P.O.; Kaski, J.C. Ischemia modified albumin is a sensitive marker of myocardial ischemia after percutaneous coronary intervention. Circulation 2003, 107, 2403–2405. [Google Scholar] [CrossRef] [PubMed] [Green Version]
- Abboud, H.; Labreuche, J.; Meseguer, E.; Lavallee, P.C.; Simon, O.; Olivot, J.-M.; Mazighi, M.; Dehoux, M.; Benessiano, J.; Steg, P.G.; et al. Ischemia-modified albumin in acute stroke. Cerebrovasc. Dis. 2007, 23, 216–220. [Google Scholar] [CrossRef] [PubMed]
- Gunduz, A.; Turedi, S.; Mentese, A.; Altunayoglu, V.; Turan, I.; Karahan, S.C.; Topbas, M.; Aydin, M.; Eraydin, I.; Akcan, B. Ischemia-modified albumin levels in cerebrovascular accidents. Am. J. Emerg. Med. 2008, 26, 874–878. [Google Scholar] [CrossRef]
- Ahn, J.H.; Choi, S.C.; Lee, W.G.; Jung, Y.S. The usefulness of albumin-adjusted ischemia-modified albumin index as early detecting marker for ischemic stroke. Neurol. Sci. 2011, 32, 133–138. [Google Scholar] [CrossRef] [PubMed]
- Kleine, A.H.; Glatz, J.F.; Van Nieuwenhoven, F.A.; Van der Vusse, G.J. Release of heart fatty acid-binding protein into plasma after acute myocardial infarction in man. Mol. Cell. Biochem. 1992, 116, 155–162. [Google Scholar] [CrossRef]
- Zimmermann-Ivol, C.G.; Burkhard, P.R.; Le Floch-Rohr, J.; Allard, L.; Hochstrasser, D.F.; Sanchez, J.-C. Fatty acid binding protein as a serum marker for the early diagnosis of stroke: A pilot study. Mol. Cell. Proteom. 2004, 3, 66–72. [Google Scholar] [CrossRef] [PubMed] [Green Version]
- Park, S.-Y.; Kim, M.-H.; Kim, O.-J.; Ahn, H.-J.; Song, J.-Y.; Jeong, J.-Y.; Oh, S.-H. Plasma heart-type fatty acid binding protein level in acute ischemic stroke: Comparative analysis with plasma S100B level for diagnosis of stroke and prediction of long-term clinical outcome. Clin. Neurol. Neurosurg. 2013, 115, 405–410. [Google Scholar] [CrossRef] [PubMed]
- Wunderlich, M.T.; Hanhoff, T.; Goertler, M.; Spener, F.; Glatz, J.F.C.; Wallesch, C.-W.; Pelsers, M.M.A.L. Release of brain-type and heart-type fatty acid-binding proteins in serum after acute ischaemic stroke. J. Neurol. 2005, 252, 718–724. [Google Scholar] [CrossRef]
- Gappoeva, M.; Izykenova, G.; Granstrem, O.; Dambinova, S. Expression of NMDA Neuroreceptors in Experimental Ischemia. Biochemistry 2003, 68, 696–702. [Google Scholar] [PubMed]
- Dambinova, S.A.; Bettermann, K.; Glynn, T.; Tews, M.; Olson, D.; Weissman, J.D.; Sowell, R.L. Diagnostic potential of the NMDA receptor peptide assay for acute ischemic stroke. PLoS ONE 2012, 7, e42362. [Google Scholar] [CrossRef] [Green Version]
- Dambinova, S.A.; Khounteev, G.A.; Izykenova, G.A.; Zavolokov, I.G.; Ilyukhina, A.Y.; Skoromets, A.A. Blood test detecting autoantibodies to N-methyl-D-aspartate neuroreceptors for evaluation of patients with transient ischemic attack and stroke. Clin. Chem. 2003, 49, 1752–1762. [Google Scholar] [CrossRef] [Green Version]
- Stehling, F.; Weber, R.; Ozcelik, A.; Bröcker, M.; Volbracht, L.; Diener, H.-C.; Busch, E. Acute changes of coagulation and fibrinolysis parameters after experimental thromboembolic stroke and thrombolytic therapy. Neurosci. Lett. 2008, 441, 39–43. [Google Scholar] [CrossRef]
- Meng, R.; Li, Z.-Y.; Ji, X.; Ding, Y.; Meng, S.; Wang, X. Antithrombin III associated with fibrinogen predicts the risk of cerebral ischemic stroke. Clin. Neurol. Neurosurg. 2011, 113, 380–386. [Google Scholar] [CrossRef]
- Kitamura, K.; Kato, J.; Kawamoto, M.; Tanaka, M.; Chino, N.; Kangawa, K.; Eto, T. The intermediate form of glycine-extended adrenomedullin is the major circulating molecular form in human plasma. Biochem. Biophys. Res. Commun. 1998, 244, 551–555. [Google Scholar] [CrossRef] [PubMed]
- Garayoa, M.; Martínez, A.; Lee, S.; Pío, R.; An, W.G.; Neckers, L.; Trepel, J.; Montuenga, L.M.; Ryan, H.; Johnson, R.; et al. Hypoxia-inducible factor-1 (HIF-1) up-regulates adrenomedullin expression in human tumor cell lines during oxygen deprivation: A possible promotion mechanism of carcinogenesis. Mol. Endocrinol. 2000, 14, 848–862. [Google Scholar] [CrossRef] [PubMed]
- Serrano, J.; Alonso, D.; Encinas, J.M.; Lopez, J.C.; Fernandez, A.P.; Castro-blanco, S.; Fernández-Vizarra, P.; Richart, A.; Bentura, M.L.; Santacana, M.; et al. Adrenomedullin expression is up-regulated by ischemia–reperfusion in the cerebral cortex of the adult rat. Neuroscience 2002, 109, 717–731. [Google Scholar] [CrossRef] [PubMed]
- Julián-Villaverde, F.J.; Ochoa-Callejero, L.; Siles, E.; Martínez-Lara, E.; Martínez, A. Adrenomedullin Is a Diagnostic and Prognostic Biomarker for Acute Intracerebral Hemorrhage. Curr. Issues Mol. Biol. 2021, 43, 324–334. [Google Scholar] [CrossRef]
- Nygård, O.; Vollset, S.E.; Refsum, H.; Stensvold, I.; Tverdal, A.; Nordrehaug, J.E.; Ueland, M.; Kvåle, G. Total plasma homocysteine and cardiovascular risk profile: The Hordaland Homocysteine Study. JAMA 1995, 274, 1526–1533. [Google Scholar] [CrossRef]
- Ambros, V. The functions of animal microRNAs. Nature 2004, 431, 350–355. [Google Scholar] [CrossRef]
- Laterza, O.F.; Lim, L.; Garrett-Engele, P.W.; Vlasakova, K.; Muniappa, N.; Tanaka, W.K.; Johnson, J.M.; Sina, J.F.; Fare, T.L.; Sistare, F.D.; et al. Plasma MicroRNAs as sensitive and specific biomarkers of tissue injury. Clin. Chem. 2009, 55, 1977–1983. [Google Scholar] [CrossRef] [Green Version]
- Broughton, B.R.S.; Reutens, D.C.; Sobey, C.G. Apoptotic mechanisms after cerebral ischemia. Stroke 2009, 40, e331–e339. [Google Scholar] [CrossRef] [Green Version]
- Leung, L.Y.; Chan, C.P.Y.; Leung, Y.K.; Jiang, H.L.; Abrigo, J.M.; Wang, D.F.; Chung, J.S.H.; Rainer, T.H.; Graham, C.A. Comparison of miR-124-3p and miR-16 for early diagnosis of hemorrhagic and ischemic stroke. Clin. Chim. Acta 2014, 433, 139–144. [Google Scholar] [CrossRef]
- Jung, J.Y.; Lee, H.-S.; Kang, D.-G.; Kim, N.S.; Cha, M.H.; Bang, O.-S.; Ryu, D.H.; Hwang, G.-S. 1H-NMR-based metabolomics study of cerebral infarction. Stroke 2011, 42, 1282–1288. [Google Scholar] [CrossRef] [Green Version]
- Zhang, X.; Li, Y.; Liang, Y.; Sun, P.; Wu, X.; Song, J.; Sun, X.; Hong, M.; Gao, P.; Deng, D. Distinguishing Intracerebral Hemorrhage from Acute Cerebral Infarction through Metabolomics. Rev. Investig. Clin. 2017, 69, 319–328. [Google Scholar] [CrossRef] [PubMed] [Green Version]
- Mirchandani, A.S.; Salmond, R.J.; Liew, F.Y. Interleukin-33 and the function of innate lymphoid cells. Trends Immunol. 2012, 33, 389–396. [Google Scholar] [CrossRef] [PubMed]
- Chen, Z.; Hu, Q.; Huo, Y.; Zhang, R.; Fu, Q.; Qin, X. Serum Interleukin-33 is a Novel Predictive Biomarker of Hemorrhage Transformation and Outcome in Acute Ischemic Stroke. J. Stroke Cerebrovasc. Dis. 2021, 30, 105506. [Google Scholar] [CrossRef] [PubMed]
- Locksley, R.M.; Killeen, N.; Lenardo, M.J. The TNF and TNF receptor superfamilies: Integrating mammalian biology. Cell 2001, 104, 487–501. [Google Scholar] [CrossRef] [Green Version]
- Lin, C.; Tang, X.; Shi, Z.; Zhang, L.; Yan, D.; Niu, C.; Zhou, M.; Wang, L.; Fu, W.; Guo, D. Serum tumor necrosis factor α levels are associated with new ischemic brain lesions after carotid artery stenting. J. Vasc. Surg. 2018, 68, 771–778. [Google Scholar] [CrossRef]
- Di Nottia, M.; Masciullo, M.; Verrigni, D.; Petrillo, S.; Modoni, A.; Rizzo, V.; Di Giuda, D.; Rizza, T.; Niceta, M.; Torraco, A.; et al. DJ-1 modulates mitochondrial response to oxidative stress: Clues from a novel diagnosis of PARK7. Clin. Genet. 2017, 92, 18–25. [Google Scholar] [CrossRef] [PubMed]
- Zhu, M.; Patel, S.H.; Han, S. DJ-1, a Parkinson’s disease related protein, aggregates under denaturing conditions and co-aggregates with α-synuclein through hydrophobic interaction. Biochim. Biophys. Acta Gen. Subj. 2017, 1861, 1759–1769. [Google Scholar] [CrossRef]
- Kim, S.H.; Fountoulakis, M.; Cairns, N.J.; Lubec, G. Human brain nucleoside diphosphate kinase activity is decreased in Alzheimer’s disease and Down syndrome. Biochem. Biophys. Res. Commun. 2002, 296, 970–975. [Google Scholar]
- Allard, L.; Burkhard, P.R.; Lescuyer, P.; Burgess, J.A.; Walter, N.; Hochstrasser, D.F.; Sanchez, J.-C. PARK7 and nucleoside diphosphate kinase A as plasma markers for the early diagnosis of stroke. Clin. Chem. 2005, 51, 2043–2051. [Google Scholar] [CrossRef]
- Allard, L.; Turck, N.; Burkhard, P.R.; Walter, N.; Rosell, A.; Gex-Fabry, M.; Hochstrasser, D.F.; Montaner, J.; Sanchez, J.-C. Ubiquitin fusion degradation protein 1 as a blood marker for the early diagnosis of ischemic stroke. Biomark. Insights 2007, 2, 155–164. [Google Scholar] [CrossRef] [PubMed]
- Drummond, G. Brain glycogen phosphorylase. Arch. Biochem. Biophys. 1964, 105, 156–162. [Google Scholar] [CrossRef] [PubMed]
- Dobson, J.G.; Mayer, S.E. Mechanisms of activation of cardiac glycogen phosphorylase in ischemia and anoxia. Circ. Res. 1973, 33, 412–420. [Google Scholar] [CrossRef] [PubMed]
- Rabitzsch, G.; Mair, J.; Lechleitner, P.; Noll, F.; Hofmann, V.; Krause, E.G.; Dienstl, F.; Puschendorf, B. Isoenzyme BB of glycogen phosphorylase b and myocardial infarction. Lancet 1993, 341, 1032–1033. [Google Scholar] [CrossRef]
- Ignacio, P.C.; Baldwin, B.A.; Vijayan, V.K.; Tait, R.C.; Gorin, F.A. Brain isozyme of glycogen phosphorylase: Immunohistological localization within the central nervous system. Brain Res. 1990, 529, 42–49. [Google Scholar] [CrossRef] [PubMed]
- Park, K.-Y.; Ay, I.; Avery, R.; Caceres, J.A.; Siket, M.S.; Pontes-Neto, O.M.; Zheng, H.; Rost, N.S.; Furie, K.L.; Sorensen, A.G.; et al. New biomarker for acute ischaemic stroke: Plasma glycogen phosphorylase isoenzyme BB. J. Neurol. Neurosurg. Psychiatry 2018, 89, 404–409. [Google Scholar] [CrossRef]
- Bernardo-Castro, S.; Sousa, J.A.; Brás, A.; Cecília, C.; Rodrigues, B.; Almendra, L.; Machado, C.; Santo, G.; Silva, F.; Ferreira, L.; et al. Pathophysiology of Blood–Brain Barrier Permeability Throughout the Different Stages of Ischemic Stroke and Its Implication on Hemorrhagic Transformation and Recovery. Front. Neurol. 2020, 11, 1605. [Google Scholar] [CrossRef]
- Spronk, E.; Sykes, G.; Falcione, S.; Munsterman, D.; Joy, T.; Kamtchum-Tatuene, J.; Jickling, G.C. Hemorrhagic Transformation in Ischemic Stroke and the Role of Inflammation. Front. Neurol. 2021, 12, 661955. [Google Scholar] [CrossRef]
- Jickling, G.C.; Liu, D.; Stamova, B.; Ander, B.P.; Zhan, X.; Lu, A.; Sharp, F.R. Hemorrhagic transformation after ischemic stroke in animals and humans. J. Cereb. Blood Flow Metab. 2014, 34, 185–199. [Google Scholar] [CrossRef] [Green Version]
- Sandoval, K.E.; Witt, K.A. Blood-brain barrier tight junction permeability and ischemic stroke. Neurobiol. Dis. 2008, 32, 200–219. [Google Scholar] [CrossRef]


| Domain | Search String |
|---|---|
| Cerebrovascular disease | (cerebrovascular disorder or brain vascular disorders or vascular diseases, intracranial or intracranial vascular disease or cerebrovascular occlusion or cerebrovascular accident or intracranial embolism, and thrombosis or cerebrovascular insufficiencies) |
| Ischemia | AND (ischemia or Stroke or infarction or brain infarction or hypoxia-ischemia or brain ischemia or ischemic attack) |
| Haemorrhage | AND (intracerebral haemorrhage, cerebral haemorrhage, or intracranial haemorrhage) |
| Biomarkers | AND (- a biological marker or biomarker or biologic marker or marker, biological, or biomarker panel) |
| Diagnosis | AND (blood plasma sample, serum plasma sample, cerebrospinal fluid, blood proteins, plasma, blood, marker, serum, or serum marker or laboratory markers) AND (diagnoses or diagnostic or examinations) |
| Accuracy | AND (accuracy or sensitivity or specificity or AUC) |
| Name | Function | Aim | Time | Sample Size | Cut Off | Sensitivity | Specificity | LR+ | LR− | Diagnostic OR | AUC | Ref. | Limitations |
|---|---|---|---|---|---|---|---|---|---|---|---|---|---|
| NSE | Glycolysis metalloenzyme. Marker of small cell carcinomas. | Stroke detection | 8–48 h | 79 patients (44 IS, 17 ICH, 11 mimics) | <14 mcg/L | 53% | 64% | 1.47 | 0.73 | 2.00 | 0.73 | [39] | |
| S100b | Glial protein with neurite extension, astrocyte proliferation and inhibition of microtubule assembly functions. | Stroke vs. TIA + Mimics | 8–48 h | 79 patients (44 IS, 17 ICH, 11 mimics) | <130 ng/L | 55% | 64% | 1.53 | 0.70 | 2.17 | 0.60 | [39] | |
| S100b + BNP + D-dimer + MMP-9 | Stroke (all) diagnosis | <3 h | 343 stroke | N/A | 90% | 45% | 1.64 | 0.22 | 7.36 | 0.75 | [44] | Low specificity in stroke diagnosis and differential. | |
| IS diagnosis | 91% | 45% | 1.65 | 0.20 | 8.27 | 0.73 | |||||||
| MMX (S100b + BNP + D-dimer + MMP-9) | Stroke diagnosis | <6 h | 196 (57 control, 89 IS, 11 ICH, 39 other brain disorders) | 1.3 | 91% | 21.5% | 1.16 | 0.42 | 2.77 | 0.712 | [45] | Low specificity in stroke diagnosis. | |
| 5.9 | 20.2% | 93.5% | 3.11 | 0.85 | 3.64 | ||||||||
| S100A12 + eotaxin + EGFR + MMP4 + prolactin | Stroke diagnosis | <4.5 h | 167 (57 IS, 32 ICH, 41 TIA, and 37 mimics) | 90% | 84% | 5.63 | 0.12 | 47.25 | [48] | ||||
| NT-proBNP | a peptide secreted by cardiac ventricles in response to cardiomyocyte elongation with subsequent functions: increasing renal filtration rate and vasodilation. | Stroke type diagnosis (cardioembolic stroke) | <72 h | 92 (66 IS 26 control) | 265.5 pg/mL | 71.4% | 73.7% | 2.71 | 0.39 | 7.00 | 0.77 | [55] | Low accuracy in stroke diagnosis and differential. Good performance in stroke etiology diagnosis. |
| IS with AF | 94.4% | 72.9% | 3.48 | 0.08 | 45.35 | 0.92 | |||||||
| Stroke diagnosis | <6 h | 1308 patients (71.9% ischemic, 14.8% stroke mimics, and 13.3% haemorrhagic) | >3.47 ng/mL | 76.9% | 43.5% | 1.36 | 0.53 | 2.56 | [56] | ||||
| IL-6 | Interleukin of inflammation | Stroke diagnosis | <6 h | 1308 patients (71.9% ischemic, 14.8% stroke mimics, and 13.3% haemorrhagic) | 76.8% | 40.7% | 1.30 | 0.57 | 2.27 | [56] | |||
| IMA | Albumin N-terminal portion modified by hypoxia, acidosis and ROS, resulting in a reduction of its metal-binding capacity | Stroke diagnosis | <3 h | 118 (84 IS, 18 ICH, 16 TIA or epilepsy) | 80 U/mL | 57.8% | 81.3% | 3.09 | 0.52 | 5.95 | [61] | Low performance in stroke diagnosis and differential | |
| IMA index | Stroke diagnosis | < 3 h | 52 (28 IS, 24 mimics) | 98 U/mL | 95.8% | 96.4% | 26.61 | 0.04 | 610.79 | 0.990 | [63] | Not studied ischemic vs. haemorrhage differential performance. | |
| h-FABP | Cytoplasmic proteins are involved in the metabolism of fatty acids, ensuring their transport to the mitochondrion for oxidation | Stroke diagnosis | <24 h | 64 (22 strokes, 22 controls, 20 myocardial infarctions) | >0.531 (OD) | 68.2% | 100% | - | 0.32 | - | [65] | Low sensitivity in stroke diagnosis and differential. | |
| NR2 | Degradation product of NMDA receptor | Stroke diagnosis | <72 h | 192 patients | 1 mcg/L | 92% | 96% | 23.00 | 0.08 | 276.00 | [69] | Increase late after-stroke damage | |
| Anti-NR2A/B | Antibodies against NMDA subunits | Stroke diagnosis | 3–5 h ICH 9–12 h IS | 460 (205 IS and ICH, 255 controls) | 2.0 ng/mL | 98% | 97% | 32.67 | 0.02 | 1584.33 | 0.99 | [70] | Increase late after-stroke damage |
| TIA diagnosis | 98% | 95% | 19.60 | 0.02 | 931.00 | 0.99 | |||||||
| ATIII | Stroke diagnosis | <4.5 h | 198 (152 IS, 46 mimics) | <210% | 97.32% | 93.62% | 15.25 | 0.03 | 532.86 | [72] | Not studied ICH vs. IS differential performances | ||
| Fibrinogen | >4 g/L | 96.05% | 82.61% | 5.52 | 0.05 | 115.51 | |||||||
| TNF alpha | Systemic inflammation cytokin | Stroke prediction after carotid stenting | After surgery | 255 (128 underwent endoartectomy) | 9.45 pg/ml | 45.3% | 82.8% | 2.63 | 0.66 | 3.99 | 0.651 | [87] | Low performances in stroke prediction. |
| PARK-7 | Oxidative stress response regulation protein | Stroke diagnosis | 3 h | 787 (622 IS, 165 controls) | 9.33 mcg/L | 54–91% | 80–97% | 6.30 | 0.31 | 20.29 | 0.74 | [91] | Not studied stroke differential performance |
| NDKA | enzyme responsible for the catalysis of phosphate group exchange between different nucluoside diphosphate groups | Stroke diagnosis | 3 h | 787 (622 IS, 165 controls) | 2 mcg/L | 70–90% | 90–97% | 12.31 | 0.21 | 57.54 | 0.83 | ||
| GP-BB | the enzyme that catalyzes the degradation reaction of glycogen to glucose-1-phosphate | Stroke diagnosis | >4.5 h | 305 (172 IS, 133 controls) | 7.0 ng/mL | 93% | 93% | 13.29 | 0.08 | 176.51 | 0.96 | [97] | Need troponin I evaluation to improve specificity. |
| Name | Function | Aim | Time | Sample Size | Cut Off | Sensitivity | Specificity | LR+ | LR− | Diagnostic OR | AUC | Ref. | Limitations |
|---|---|---|---|---|---|---|---|---|---|---|---|---|---|
| GFAP | Astrocytes proteolytic enzime involved in cell-cell communication, astrocyte-neuron interaction, maintenaco of BBB, reparative process in CNS | Ischemia-Haemorrhage differential Hematoma size evaluation | <6 h | 135 patients (42 ICH, 93 IS) | 2.9 ng/L | 79% | 98% | 39.50 | 0.21 | 184.33 | [28] | Not able to diagnose IS | |
| <2 h | 205 patients (39 ICH, 163 IS, 3 mimics) | 2.9 ng/L | 84.2% | 96.3% | 22.76 | 0.16 | 138.70 | [29] | |||||
| 63 min (median) | 74 patients (25 ICH, 49 IS) | 2.9 ng/L | 36% (hematoma volume < 15 mL) | 100% | - | 0.64 | - | [30] | |||||
| 61.5% (hematoma volume > 15 mL) | 100% | - | 0.39 | - | |||||||||
| 2–6 h | 43 ICH 65 IS | 0.7 ng/mL | 86% | 79% | 4.10 | 0.18 | 23.11 | [32] | |||||
| <6 h | 270 patients (IS: 121, ICH: 34, stroke mimics: 31, subarachnoid haemorrhage: 5, controls: 79) | 0.43 ng/mL | 91% | 97% | 30.33 | 0.09 | 326.93 | 0.97 | [33] | ||||
| Metanalyses | 75–78% | 95% | 15.30 | 0.25 | 61.85 | 0.90–0.93 | [34,35] | ||||||
| RBP4 + GFAP | Ischemia-Haemorrhage differential | 74 patients (25 ICH, 49 IS) | RBP4 > 48.75 mcg/mL GFAP > 0.7 ng/mL | 68.4% | 84% | 4.28 | 0.38 | 11.36 | [32] | ||||
| S100b + sRAGE | S100b receptor | Haemorrhage vs. ischemia | <3 h | 915 (776 IS, 139 ICH) | S100b > 96 pg/mL sRAGE <0.97 ng/mL | 22.7% | 80.2% | 1.15 | 0.96 | 1.19 | 0.762 (with the clinical feature) | [43] | Low sensitivity in ischemia-haemorrhage differential. Improved if it is associated with the patient’s clinical features |
| S100b + BNP + D-dimer + MMP-9 | Haemorrhage diagnosis | 88% | 38% | 1.42 | 0.32 | 4.49 | 0.81 | [44] | |||||
| NT-proBNP | a peptide secreted by cardiac ventricles in response to cardiomyocyte elongation with subsequent functions: increasing renal filtration rate and vasodilation. | Haemorrhage vs. Ischemia | <6 h | >5.70 ng/mL | 44.8% | 74.9% | 1.78 | 0.74 | 2.42 | [56] | |||
| IMA | Albumin N-terminal portion modified by hypoxia, acidosis and ROS, resulting in a reduction of its metal-binding capacity | ICH, IS, SAH diagnosis | 86.8% | 60.5% | 2.20 | 0.22 | 10.07 | [61] | |||||
| Adrenomedullin | Vasodilator peptide hormone | ICH diagnosis | <24 h | 114 (50 controls, 64 ICH) | >69 pg/mL | 80% | 100% | - | 0.20 | - | 0.89 | [76] | |
| miR 124-3p | Non-coding RNA is involved in the regulation of gene expression, cell development, apoptosis and metabolism | ICH vs. IS | <24 h | 93 (74 IS, 19 ICH) | >3 × 10⁵ copies/mL | 68.4% | 71.2% | 2.38 | 0.44 | 5.35 | [83] | Not studied in early ICH vs. IS differential. Not studied performance stroke diagnosis. | |
| miR 16 | ≤2 × 10⁹ copies/mL | 96.7% | 35.1% | 1.49 | 0.09 | 15.85 | |||||||
| Metabolomics | Small metabolites of lactate, pyruvate, glycolate etc. | ICH vs. IS | 2–12 h | 322 (129 IS, 128 ICH, 65 controls) | 84% | 76.9% | 3.64 | 0.21 | 17.48 | [83] | Not studied performance in stroke diagnosis. |
| Name | Function | Aim | Time | Sample Size | Cut Off | Sensitivity | Specificity | LR+ | LR− | Diagnostic OR | AUC | Ref. | Limitations |
|---|---|---|---|---|---|---|---|---|---|---|---|---|---|
| NSE | Glycolysis metalloenzyme. Marker of small cell carcinomas. | Haemorrhagic transformation predictor Stroke volume | 83 IS | Second peak | - | - | 6.884 | [38] | Low accuracy in stroke detection | ||||
| S100b | Glial protein with neurite extension, astrocyte proliferation and inhibition of microtubule assembly functions. | Haemorrhagic transformation predictor | 3–6 h | 458 IS | >11.89 pg/mL | 92.9% | 48.1% | 1.79 | 0.15 | 12.13 | 0.746 | [46] | Low accuracy in stroke detection |
| MMP-9 | A zinc-metalloproteinase is involved in extracellular matrix degradation. | Haemorrhagic transformation predictor | <24 h | 168 IS | >181.7 ng/mL | 82.9% | 81.3% | 4.43 | 0.21 | 21.08 | [51] | Not able to diagnose stroke | |
| 3–6 h | 458 IS | 68.7% | 45.3% | 1.26 | 0.69 | 1.82 | [46] | ||||||
| 1492 IS (metanalysis) | 85% | 79% | 4.05 | 0.19 | 21.32 | 0.89 | [52] | ||||||
| h-FABP | Cytoplasmic proteins are involved in the metabolism of fatty acids, ensuring their transport to the mitochondrion for oxidation | Clinical outcome predictor | <24 h | 238 (111 IS, 127 controls) | 9.70 ng/mL | 59.5% | 79.5% | 2.90 | 0.51 | 5.70 | 0.71 | [66] | |
| Homocysteine | Methionine-derived amino acid | Haemorrhagic transformation | 1378 patients | >16.56 μmol/L | 63.3% | 41.3% | 1.08 | 0.89 | 1.21 | [77] | Low specificity in haemorrhagic transformation | ||
| IL-33 | Interleukin producted by T helper 2 | Haemorrhagic transformation | 191 (151 IS, 40 controls) | <67.66 ng/L | 81.3% | 63% | 2.20 | 0.30 | 7.40 | 0.739 | [85] | Not studied performance stroke diagnosis and differential | |
| Occludin | Blood-brain barrier tight junction components | Haemorrhagic transformation | <3 h | 458 IS | >0.029/ng/mL | 58.6% | 67.5% | 1.80 | 0.61 | 2.94 | 0.622 | [46] | Not able to diagnose stroke |
| Claudin 5 | 1.601 ng/mL | 64.3% | 65.8% | 1.88 | 0.54 | 3.47 | 0.599 | ||||||
| ZO1 | >1.36 RU/mL | 56.7% | 56% | 1.29 | 0.77 | 1.67 | 0.519 |
Disclaimer/Publisher’s Note: The statements, opinions and data contained in all publications are solely those of the individual author(s) and contributor(s) and not of MDPI and/or the editor(s). MDPI and/or the editor(s) disclaim responsibility for any injury to people or property resulting from any ideas, methods, instructions or products referred to in the content. |
© 2023 by the authors. Licensee MDPI, Basel, Switzerland. This article is an open access article distributed under the terms and conditions of the Creative Commons Attribution (CC BY) license (https://creativecommons.org/licenses/by/4.0/).
Share and Cite
di Biase, L.; Bonura, A.; Pecoraro, P.M.; Carbone, S.P.; Di Lazzaro, V. Unlocking the Potential of Stroke Blood Biomarkers: Early Diagnosis, Ischemic vs. Haemorrhagic Differentiation and Haemorrhagic Transformation Risk: A Comprehensive Review. Int. J. Mol. Sci. 2023, 24, 11545. https://doi.org/10.3390/ijms241411545
di Biase L, Bonura A, Pecoraro PM, Carbone SP, Di Lazzaro V. Unlocking the Potential of Stroke Blood Biomarkers: Early Diagnosis, Ischemic vs. Haemorrhagic Differentiation and Haemorrhagic Transformation Risk: A Comprehensive Review. International Journal of Molecular Sciences. 2023; 24(14):11545. https://doi.org/10.3390/ijms241411545
Chicago/Turabian Styledi Biase, Lazzaro, Adriano Bonura, Pasquale Maria Pecoraro, Simona Paola Carbone, and Vincenzo Di Lazzaro. 2023. "Unlocking the Potential of Stroke Blood Biomarkers: Early Diagnosis, Ischemic vs. Haemorrhagic Differentiation and Haemorrhagic Transformation Risk: A Comprehensive Review" International Journal of Molecular Sciences 24, no. 14: 11545. https://doi.org/10.3390/ijms241411545
APA Styledi Biase, L., Bonura, A., Pecoraro, P. M., Carbone, S. P., & Di Lazzaro, V. (2023). Unlocking the Potential of Stroke Blood Biomarkers: Early Diagnosis, Ischemic vs. Haemorrhagic Differentiation and Haemorrhagic Transformation Risk: A Comprehensive Review. International Journal of Molecular Sciences, 24(14), 11545. https://doi.org/10.3390/ijms241411545