Abstract
We present a novel label-free colorimetric method for detecting exonuclease III (Exo III) activity using the peroxidase-mimicking activity of cerium oxide nanoparticles (nanoceria). Exo III, an enzyme that specifically catalyzes the stepwise removal of mononucleotides from the 3′-OH termini of double-stranded DNA, plays a significant role in various cellular and physiological processes, including DNA proofreading and repair. Malfunctions of Exo III have been associated with increased cancer risks. To assay the activity of Exo III, we applied the previous reports in that the peroxidase-mimicking activity of nanoceria is inhibited due to the aggregation induced by the electrostatic attraction between DNA and nanoceria. In the presence of Exo III, the substrate DNA (subDNA), which inhibits nanoceria’s activity, is degraded, thereby restoring the peroxidase-mimicking activity of nanoceria. Consequently, the 3,3′,5,5′-tetramethylbenzidine (TMB) substrate is oxidized, leading to a color change from colorless to blue, along with an increase in the absorbance intensity. This approach enabled us to reliably detect Exo III at a limit of detection (LOD) of 0.263 units/mL across a broad dynamic range from 3.1 to 400 units/mL, respectively, with an outstanding specificity. Since this approach does not require radiolabels, complex DNA design, or sophisticated experimental techniques, it provides a simpler and more feasible alternative to standard methods.
1. Introduction
Exonucleases represent a class of enzymes with a unique ability to catalyze the cleavage of DNA molecules through hydrolyzing the phosphodiester bonds, thereby playing a pivotal role in DNA digestion. Notably, these enzymes function at either the 3′-terminus or the 5′-terminus of the DNA sequence, dependent on the type of exonuclease [1,2]. One prominent type of exonuclease is exonuclease III (Exo III), a well-known member of the exonuclease enzyme family. This particular enzyme contributes to the sequential removal of mononucleotides from the 3′-hydroxyl termini of double-stranded DNA, thus aiding in DNA disassembly via a methodical catalytic process [3]. The 3′-5′ activity of Exo III exhibits a crucial role across several critical cellular and physiological processes, including DNA proofreading and repair [4,5,6]. When defects occur in 3′-5′ exonucleases, cells may process transcription and translation incorrectly, which can lead to a lack of protection against cancer, particularly when exposed to long periods of stress [7]. Consequently, it is essential to develop reliable analytical methods for accurately measuring the activity of 3′-5′ exonucleases [8].
Gel electrophoresis and radiolabeling serve as the standard techniques for detecting 3′-5′ exonuclease activity. However, despite their widespread use, both methods are time-consuming, labor intensive, and pose safety risks during the detection process [9,10]. Recently, alternative methods for detecting 3′-5′ exonuclease activity have been developed, such as fluorescence-based methods utilizing the G-quadruplex [11,12,13,14,15] and FRET [16,17,18,19]. In addition, a detection method using metal nanoparticles, including copper nanoparticles [20,21], has been developed for detecting 3′-5′ exonuclease activity. However, these techniques still present several drawbacks, such that they necessitate complicated preparation procedures and the use of modified fluorescent probes, making them less straightforward and convenient.
Since the discovery of the peroxidase-mimicking activity of magnetic nanoparticles (MNPs) [22], there has been increasing interest in nanoscaled peroxidase mimetics and their potential applications in bioanalysis. This includes a multitude of metal nanoparticles, such as gold nanoparticles (AuNPs) [23,24], platinum nanoparticles (PtNPs) [25,26], iron oxide nanoparticles (Fe3O4 NPs) [27,28], cupric oxide nanoparticles (CuO NPs) [29], and cerium oxide nanoparticles (CeO2 NPs, also termed as nanoceria) [30,31,32].
Remarkably, cerium oxide nanoparticles (nanoceria) exhibiting oxidase-like activity present exceptional stability and catalytic efficiency for substrate oxidation, even in the absence of supplemental oxidizing agents [30,31]. Previous studies have reported that the peroxidase-mimicking activity of nanoceria can be regulated using nucleic acids. This regulation occurs through electrostatic interactions that bind the nucleic acids to the nanoparticles. The subsequent aggregation of nanoceria, induced by this binding, incites a decline in their catalytic activity [33,34,35].
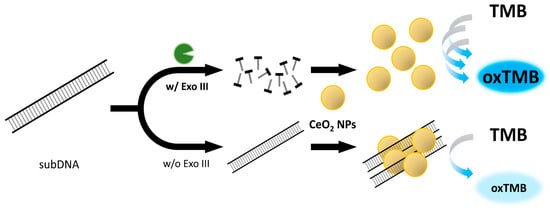
In this study, we have devised a new label-free colorimetric detection method for Exo III activity utilizing the peroxidase-mimicking property of nanoceria. Our strategy relies on inhibiting nanoceria’s peroxidase-mimicking activity through substrate DNA (subDNA) binding. The absence of Exo III allows the subDNA to bind to nanoceria, causing aggregation due to electrostatic attraction. This binding significantly hinders the efficient oxidation of the 3,3′,5,5′-tetramethylbenzidine (TMB) substrate, limiting direct contact and resulting in a low absorbance intensity due to the production of a small quantity of oxidized TMB. However, the presence of Exo III degrades the subDNA, which enhances the peroxidase-mimicking activity of nanoceria and promotes the oxidation of the TMB substrate. This induces a color change from colorless to blue, which consequently results in an increase in the absorbance intensity.
2. Results and Discussion
2.1. Exo III Detection Based on Nanoceria
The overall procedure for the nanoceria-based label-free colorimetric detection of Exo III has been illustrated in Figure 1. Exo III exhibits specificity in catalyzing the stepwise removal of mononucleotides from the 3′-OH termini of dsDNA. We employed a dsDNA with a length of 200 bp as the substrate for Exo III. In the absence of Exo III, the subDNA binds to the surface of the nanoceria and causes aggregation due to the electrostatic attraction between the positive charge on the surface of the nanoceria and the negative charge on the phosphate backbone. Consequently, the binding effects of the subDNA greatly hinder the efficient oxidation of the TMB substrate by restricting direct contact between the nanoceria and the TMB substrate. This limitation results in the production of a small quantity of oxidized TMB, consequently leading to a low absorbance intensity. However, in the presence of Exo III, subDNA is digested by the specific activity of Exo III. As a result, nanoceria actively facilitates the oxidation of TMB, leading to a recovered absorbance intensity.
2.2. Feasibility of Exo III Detection
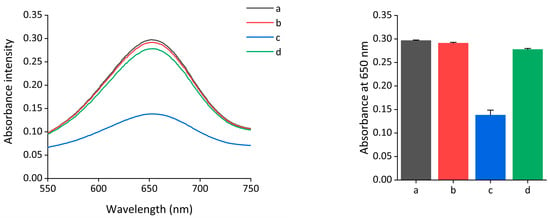
To demonstrate the feasibility of the colorimetric assay of Exo III, the absorbance intensity spectra of oxidized TMB under different conditions were obtained. As shown in Figure 2, a highly retained absorbance signal was observed when only nanoceria were present (line a), and a negligible decrease in the absorbance intensity was observed even when Exo III was present together (line b). In contrast, a notable reduction in the absorbance intensity was observed in the presence of both the nanoceria and subDNA (line c). This indicates that the peroxidase-mimicking activity of nanoceria was reduced by the interaction between the nanoceria and subDNA. However, the highly recovered absorbance intensity was measured when Exo III was added to the nanoceria and subDNA. These results indicate that Exo III promotes the degradation of the subDNA, which in turn regulates the peroxidase-mimicking activity of nanoceria. This led to a change in the absorbance intensity by Exo III, as depicted in the mechanism displayed in Figure 1.
Figure 2.
Feasibility of the nanoceria-based colorimetric assay of Exo III. Absorption spectra were measured under the following conditions: a: nanoceria, b: nanoceria + Exo III, c: nanoceria + subDNA, and d: nanoceria + subDNA + Exo III. The nanoceria, Exo III, and subDNA concentrations were 0.375 wt%, 400 units/mL, and 400 nM, respectively. The error bars indicate the standard deviations obtained from triplicate measurements.
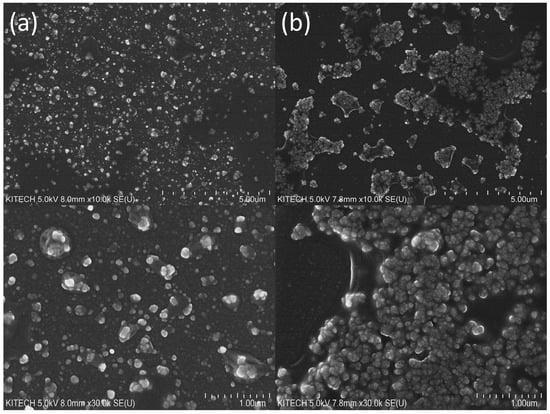
Next, we investigated the inhibitory effects of DNA on the oxidase-mimicking activity of nanoceria. From analyzing scanning electron microscopy (SEM) images to evaluate the surfaces of nanoceria (Figure 3) and utilizing dynamic light scattering (DLS) to measure particle size distributions (Figure S1a), it was observed that the aggregation of nanoceria was significantly enhanced when incubated with the subDNA compared to those not exposed to subDNA treatment. Furthermore, it was confirmed that the zeta potential of nanoceria decreased from 7.03 mV to −1.078 mV, respectively, following aggregation induced by the subDNA (Figure S1b). These results align well with the outcomes that have been reported in previous reports [33,34,35].
2.3. Determination of the Exo III Detection System
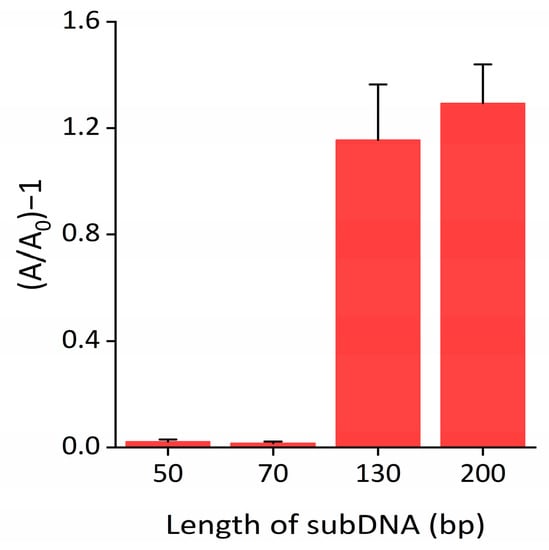
To maximize the performance of the Exo III detection system, we optimized the reaction conditions by examining the absorbance intensity defined as (A/A0)−1, where A0 and A represent the absorbance intensity at 650 nm in the absence and presence of Exo III, respectively. As shown in Figure 4 and Figure S2, the optimal absorbance intensity ratio was observed for a subDNA length of 200 bp. SubDNAs shorter than 130 bp interacted weakly with nanoceria and were not able to sufficiently inhibit peroxidase-mimicking activity. Furthermore, the absorbance signal declined as the concentration of subDNA increased up to 400 nM, after which it reached a plateau (Figure S3). The results in Figure S4 reveal that the optimal concentration of nanoceria was 0.375 wt%. As shown in Figures S5 and S6, the reaction time of nanoceria with the subDNA and nanoceria with the TMB substrate were 30 and 20 min, respectively. We also explored various commonly used biological buffers to compare their effects on the inhibition of nanoceria’s peroxidase-mimicking activity. Notably, our buffer condition exhibited the highest peroxidase-mimicking activity of bare nanoceria and strongly retained the signal from binding subDNA to the nanoceria (Figure S7). In contrast, in the phosphate buffer, it was confirmed that the peroxidase-mimicking activity of nanoceria was significantly suppressed, regardless of the presence of the subDNA, due to the strong adsorption of phosphate on the nanoceria surface [36].
2.4. Evaluation of the Exo III Detection System Performance
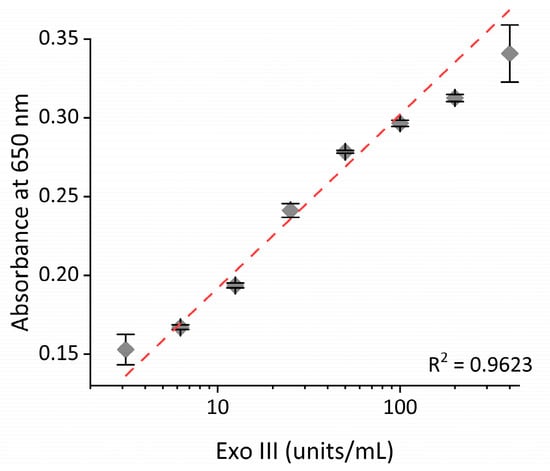
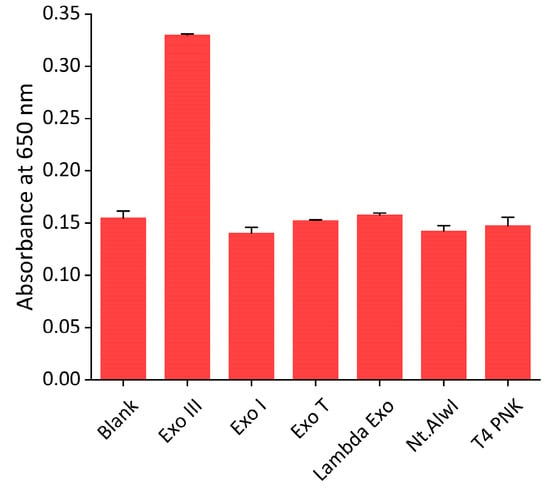
To determine the sensitivity of the proposed system, Exo III, under varying concentrations, was subjected to the assay. As shown in Figure 5, the absorbance intensity increased as the concentration of Exo III increased. In addition, a strong linear relationship (R2 = 0.9623) was established between the absorbance intensity and the logarithm of the concentration of Exo III from 3.1 to 400 units/mL, respectively. This finding confirms that our technique can quantitively and reliably determine Exo III levels over a wide dynamic range. Based on the 3σ/slope (where σ is the standard deviation of a 3.1 units/mL Exo III), the limit of detection (LOD) was estimated to be 0.263 units/mL. The sensitivity of this approach is comparable to previously reported Exo III detection techniques but exhibits a uniquely wide dynamic range (as detailed in Table 1). Next, the selectivity of our technique was assessed through examining the extent of the absorbance intensity by other nucleases, such as Exo I, Exo T, Lambda Exo, Nt. AlwI, and T4 PNK under the same conditions. As exhibited in Figure 6 and Figure S8, a high absorbance intensity was only observed from Exo III, whereas other nucleases produced only minor absorbance intensities similar to that of the blank. These obtained results clearly demonstrate the remarkable specificity of the proposed strategy towards the intended target, Exo III, thereby validating the high specificity of this system.
Figure 5.
Sensitivity of the nanoceria-based Exo III activity assay. The relationship between the absorbance intensity at 650 nm and the concentration of Exo III. The error bars indicate the standard deviations obtained from triplicate measurements.
Table 1.
Comparison of the different methods that have been used for the determination of Exo III activity.
Figure 6.
Selectivity of the nanoceria-based Exo III activity assay. The absorbance intensities at 650 nm were measured in the sample containing Exo III (400 units/mL) and other nucleases, such as Exo I, Exo T, Lambda Exo, Nt AlwI, and T4 PNK (400 units/mL). The error bars indicate the standard deviations obtained from triplicate measurements.
2.5. Real-Sample Test of the Exo III Detection System
To verify the general applicability of this system for biological samples, such as human serum, Exo III under varying concentrations was spiked into 10% human serum and subjected to the proposed assay. As shown in Figure S9, an excellent linear relationship (R2 = 0.9852) was also obtained between the absorbance intensity and the logarithm of the concentration of Exo III from 6.2 to 400 units/mL, respectively, in 10% human serum. Based on this calibration curve, the concentrations of Exo III in 10% human serum were successfully determined, with a coefficient of variation (CV) of less than 3.382% and a recovery ratio between 98.74 and 107.53%, respectively (Table 2). Overall, these results demonstrate that this developed Exo III detection system is able to identify Exo III in complex heterogeneous specimens, thereby verifying its robust applicability for real biological sample analysis.
3. Materials and Methods
3.1. Materials
The oligonucleotide sequences used in this work (Table S1) and nuclease-free water were purchased from Integrated DNA Technologies (Coralville, IA, USA). Moreover, 10× NEBuffer 1, exonuclease I, exonuclease III, exonuclease T, lambda exonuclease, Nt. AlwI, and T4 polynucleotide kinase were all purchased from New England Biolabs (Ipswich, MA, USA). Nanoceria dispersion (catalog number 289744, 20 wt% dispersed in 2.5% acetic acid), 3,3′,5,5′-tetramethylbenzidine (TMB, catalog number T0440), human serum (catalog number H4522), 1 M HEPES buffer solution (pH 5.0) (Figure S7), sodium phosphate dibasic (Figure S7), sodium phosphate monobasic (Figure S7), acetic acid (Figure S7), and sodium acetate (Figure S7) were all purchased from Sigma-Aldrich (St. Louis, MO, USA). Finally, 1 M Tris-HCl buffer (pH 7.4) (Figure S7) was purchased from Bioneer (Daejeon, Republic of Korea).
3.2. Nanoceria-Based Exonuclease III Assay
The solution was prepared by mixing 2.5 μL of NEBuffer 1 (10×), 7.5 μL of nuclease-free water, 10 μL of substrate DNA (1 μM), and 5 μL of the sample containing the exonuclease. The mixture was then incubated at 37 °C for 1 h. After incubation, 20 μL of the reaction mixture was mixed with 60 μL of nanoceria (0.5 wt%) and incubated at room temperature for 30 min to permit the aggregation of the substrate DNA and nanoceria. Then, 100 μL of TMB was added and incubated at room temperature for 20 min followed by centrifugation at 10,000× g for 1 min to separate the nanoceria from the solution. The absorbance intensity was measured using 100 μL of supernatant. Spectrophotometric measurements were carried out using the Infinite M 200 PRO (Tecan, Zurich, Switzerland) equipped with a desktop computer for absorbance data acquisition.
3.3. Confirmation of DNA-Induced Aggregation of Nanoceria
The scanning electron microscopy images were obtained using an emission scanning electron microscope (FE-SEM, Hitachi SU-8010, Hitachi, Japan) at a voltage of 5 kV. Particle size distribution and zeta potential measurements were performed using a Zetasizer Lab (Malvern Panalytical Ltd., Malvern, UK), and the samples were scanned three times to obtain the average zeta potential and diameter of the nanoceria.
3.4. Gel Electrophoresis Analysis of the Nuclease Reactant
The solution was prepared by mixing 2.5 μL of NEBuffer 1 (10×), 7.5 μL of nuclease-free water, 10 μL of substrate DNA (1 μM), and 5 μL of the sample containing various nucleases (Exo III, Exo I, Exo T, Lambda Exo, Nt. AlwI, and T4 PNK). The mixture was then incubated at 37 °C for 1 h. A mixture of 5 μL of nuclease reactant and 1 μL of gel electrophoresis loading buffer (6×, Bioneer) was loaded onto a 2% agarose gel, and gel electrophoresis was conducted at 100 V for 50 min using 1× TBE as the running buffer. After staining with GreenStar™ nucleic acid staining solution I (1×, Bioneer), a gel image was photographed using a Gel Doc Go Imaging System (Bio-Rad, Hercules, CA, USA).
3.5. Real-Sample Test of the Exonuclease III Detection System
Various concentrations of Exo III were spiked into 10% human serum to mimic real samples. To quantify the amount of spiked Exo III, a calibration curve was constructed using a standard set of known concentrations of Exo III in the 10% human serum. The unknown quantity of Exo III was then estimated based on this curve.
4. Conclusions
In this study, we developed a label-free colorimetric assay to detect levels of Exo III activity based on the peroxidase-mimicking activity of nanoceria. This strategy was based on the mechanism by which the peroxidase-mimicking activity of nanoceria was inhibited by binding with the subDNA. The presence of Exo III causes subDNA degradation and promotes the peroxidase-mimicking activity of nanoceria, increasing the absorbance intensity. Based on this strategy, Exo III was successfully detected at an LOD of 0.263 units/mL; a wide dynamic range from 3.1 to 400 units/mL, respectively, along with an excellent specificity was also confirmed. In contrast to previously reported studies, this strategy offers a greater level of feasibility as it does not rely on fluorescence dye labels and does not necessitate intricate DNA design nor sophisticated experimental techniques.
Supplementary Materials
The supporting information can be downloaded at: https://www.mdpi.com/article/10.3390/ijms241512330/s1.
Author Contributions
Conceptualization, H.H.; methodology, H.H., J.H.J. and C.Y.L.; validation, H.H. and S.H.J.; formal analysis, H.H., J.H.J. and S.H.J.; investigation, H.H., C.Y.L. and J.K.A.; data curation, H.H. and J.H.J.; writing—original draft preparation, H.H. and C.Y.L.; writing—review and editing, J.K.A. and C.Y.L.; supervision, J.K.A.; funding acquisition, J.K.A. All authors have read and agreed to the published version of the manuscript.
Funding
This study has been conducted with the supports of the Korea Institute of Industrial Technology as the “Development of fiber-based technology for reduction of hazardous substances in the air (kitech EO-23-0005)”. This work was also supported by the Korea Institute of Planning and Evaluation for Technology in Food, Agriculture, and Forestry (IPET) through the Crop Viruses and Pests Response Industry Technology Development Program, funded by the Ministry of Agriculture, Food and Rural Affairs (MAFRA) (321104-3).
Institutional Review Board Statement
Not applicable.
Informed Consent Statement
Not applicable.
Data Availability Statement
Not applicable.
Conflicts of Interest
The authors declare no conflict of interest.
References
- Fraser, M.J. Endo-Exonucleases: Enzymes Involved in DNA Repair and Cell Death? Bioessays 1994, 16, 761–766. [Google Scholar] [CrossRef]
- Zuo, Y.; Deutscher, M.P. Exoribonuclease Superfamilies: Structural Analysis and Phylogenetic Distribution. Nucleic Acids Res. 2001, 29, 1017–1026. [Google Scholar] [CrossRef]
- Mol, C.D.; Kuo, C.F.; Thayer, M.M.; Cunningham, R.P.; Tainer, J.A. Structure and Function of the Multifunctional DNA-Repair Enzyme Exonuclease III. Nature 1995, 374, 381–386. [Google Scholar] [CrossRef]
- Paull, T.T.; Gellert, M. The 3′ to 5′ Exonuclease Activity of Mre11 Facilitates Repair of DNA Double-Strand Breaks. Mol. Cell 1998, 1, 969–979. [Google Scholar] [CrossRef]
- Song, L.; Chaudhuri, M.; Knopf, C.W.; Parris, D.S. Contribution of the 3′- to 5′-Exonuclease Activity of Herpes Simplex Virus Type 1 DNA Polymerase to the Fidelity of DNA Synthesis. J. Biol. Chem. 2004, 279, 18535–18543. [Google Scholar] [CrossRef]
- Gammon, D.B.; Evans, D.H. The 3′-to-5′ Exonuclease Activity of Vaccinia Virus DNA Polymerase Is Essential and Plays a Role in Promoting Virus Genetic Recombination. J. Virol. 2009, 83, 4236–4250. [Google Scholar] [CrossRef]
- Loeb, L.A. Mutator Phenotype May Be Required for Multistage Carcinogenesis. Cancer Res. 1991, 51, 3075–3079. [Google Scholar]
- Wang, C.J.; Lam, W.; Bussom, S.; Chang, H.M.; Cheng, Y.C. TREX1 Acts in Degrading Damaged DNA from Drug-Treated Tumor Cells. DNA Repair 2009, 8, 1179–1189. [Google Scholar] [CrossRef]
- Jeltsch, A.; Fritz, A.; Alves, J.; Wolfes, H.; Pingoud, A. A Fast and Accurate Enzyme-Linked Immunosorbent Assay for the Determination of the DNA Cleavage Activity of Restriction Endonucleases. Anal. Biochem. 1993, 213, 234–240. [Google Scholar] [CrossRef]
- Alves, J.; Rüter, T.; Geiger, R.; Fliess, A.; Maass, G.; Pingoud, A. Changing the Hydrogen-Bonding Potential in the DNA Binding Site of EcoRl by Site-Directed Mutagenesis Drastically Reduces the Enzymatic Activity, Not, However, the Preference of This Restriction Endonuclease for Cleavage within the Site -GAATTC-. Biochemistry 1989, 28, 2678–2684. [Google Scholar] [CrossRef]
- Leung, C.; Chan, D.S.; Man, B.Y.; Wang, C.; Lam, W.; Cheng, Y.; Fong, W.; Hsiao, W.W.; Ma, D. Simple and Convenient G-Quadruplex-Based Turn-on Fluorescence Assay for 3′ → 5′ Exonuclease Activity. Anal. Chem. 2011, 83, 463–466. [Google Scholar] [CrossRef]
- He, H.Z.; Chan, W.I.; Mak, T.Y.; Liu, L.J.; Wang, M.; Chan, D.S.H.; Ma, D.L.; Leung, C.H. Detection of 3′→5′ Exonuclease Activity Using a Metal-Based Luminescent Switch-on Probe. Methods 2013, 64, 218–223. [Google Scholar] [CrossRef] [PubMed]
- Jiang, X.; Liu, H.; Khusbu, F.Y.; Ma, C.; Ping, A.; Zhang, Q.; Wu, K.; Chen, M. Label-Free Detection of Exonuclease III Activity and Its Inhibition Based on DNA Hairpin Probe. Anal. Biochem. 2018, 555, 55–58. [Google Scholar] [CrossRef] [PubMed]
- Burkin, K.M.; Bodulev, O.L.; Gribas, A.V.; Sakharov, I.Y. One-Step Label-Free Chemiluminescent Assay for Determination of Exonuclease III Activity towards Hairpin Oligonucleotides. Enzyme Microb. Technol. 2019, 131, 109419. [Google Scholar] [CrossRef] [PubMed]
- Yang, W.; Ruan, Y.; Wu, W.; Chen, P.; Xu, L.; Fu, F. A “Turn-on” and Label-Free Fluorescent Assay for the Rapid Detection of Exonuclease III Activity Based on Tb3+-Induced G-Quadruplex Conjugates. Anal. Bioanal. Chem. 2014, 406, 4535–4540. [Google Scholar] [CrossRef] [PubMed]
- Zhang, X.; Bai, Y.; Jiang, Y.; Wang, N.; Yang, F.; Zhan, L.; Huang, C. Homo-FRET Enhanced Ratiometric Fluorescence Strategy for Exonuclease III Activity Detection. Anal. Methods 2021, 13, 1489–1494. [Google Scholar] [CrossRef]
- Lee, J.; Min, D.-H. A Simple Fluorometric Assay for DNA Exonuclease Activity Based on Graphene Oxide. Analyst 2012, 137, 2024–2026. [Google Scholar] [CrossRef]
- Qin, Y.; Yang, Y.; He, R.; Zhou, L.; Zhang, L. Self-Assembled Nanosheets of Perylene Monoamide Derivative as Sensitive Fluorescent Biosensor for Exonuclease III Activity. Chem. Res. Chin. Univ. 2022, 38, 1497–1503. [Google Scholar] [CrossRef]
- Liu, X.; Wu, Y.; Wu, X.; Zhao, J.X. A Graphene Oxide-Based Fluorescence Assay for the Sensitive Detection of DNA Exonuclease Enzymatic Activity. Analyst 2019, 144, 6231–6239. [Google Scholar] [CrossRef]
- Zhang, H.; Lin, Z.; Su, X. Label-Free Detection of Exonuclease III by Using DsDNA-Templated Copper Nanoparticles as Fluorescent Probe. Talanta 2015, 131, 59–63. [Google Scholar] [CrossRef]
- Lee, C.; Gang, J. Label-Free Rapid and Simple Detection of Exonuclease III Activity with DNA-Templated Copper Nanoclusters. J. Microbiol. Biotechnol. 2018, 28, 1467–1472. [Google Scholar] [CrossRef]
- Gao, L.; Zhuang, J.; Nie, L.; Zhang, J.; Zhang, Y.; Gu, N.; Wang, T.; Feng, J.; Yang, D.; Perrett, S.; et al. Intrinsic Peroxidase-like Activity of Ferromagnetic Nanoparticles. Nat. Nanotechnol. 2007, 2, 577–583. [Google Scholar] [CrossRef]
- Jv, Y.; Li, B.; Cao, R. Positively-Charged Gold Nanoparticles as Peroxidiase Mimic and Their Application in Hydrogen Peroxide and Glucose Detection. Chem. Commun. 2010, 46, 8017–8019. [Google Scholar] [CrossRef]
- Wang, S.; Chen, W.; Liu, A.-L.; Hong, L.; Deng, H.-H.; Lin, X.-H. Comparison of the Peroxidase-like Activity of Unmodified, Amino-Modified, and Citrate-Capped Gold Nanoparticles. ChemPhysChem 2012, 13, 1199–1204. [Google Scholar] [CrossRef]
- Gao, Z.; Xu, M.; Hou, L.; Chen, G.; Tang, D. Irregular-Shaped Platinum Nanoparticles as Peroxidase Mimics for Highly Efficient Colorimetric Immunoassay. Anal. Chim. Acta 2013, 776, 79–86. [Google Scholar] [CrossRef]
- Park, J.M.; Jung, H.W.; Chang, Y.W.; Kim, H.S.; Kang, M.J.; Pyun, J.C. Chemiluminescence Lateral Flow Immunoassay Based on Pt Nanoparticle with Peroxidase Activity. Anal. Chim. Acta 2015, 853, 360–367. [Google Scholar] [CrossRef]
- Park, K.S.; Kim, M.I.; Cho, D.Y.; Park, H.G. Label-Free Colorimetric Detection of Nucleic Acids Based on Target-Induced Shielding against the Peroxidase-Mimicking Activity of Magnetic Nanoparticles. Small 2011, 7, 1521–1525. [Google Scholar] [CrossRef]
- Yang, Y.C.; Wang, Y.T.; Tseng, W.L. Amplified Peroxidase-Like Activity in Iron Oxide Nanoparticles Using Adenosine Monophosphate: Application to Urinary Protein Sensing. ACS Appl. Mater. Interfaces 2017, 9, 10069–10077. [Google Scholar] [CrossRef]
- Chen, W.; Chen, J.; Feng, Y.-B.; Hong, L.; Chen, Q.-Y.; Wu, L.-F.; Lin, X.-H.; Xia, X.-H. Peroxidase-like Activity of Water-Soluble Cupric Oxide Nanoparticles and Its Analytical Application for Detection of Hydrogen Peroxide and Glucose. Analyst 2012, 137, 1706–1712. [Google Scholar] [CrossRef]
- Asati, A.; Santra, S.; Kaittanis, C.; Nath, S.; Perez, J.M. Oxidase-like Activity of Polymer-Coated Cerium Oxide Nanopartieles. Angew. Chem. Int. Ed. 2009, 48, 2308–2312. [Google Scholar] [CrossRef]
- Asati, A.; Kaittanis, C.; Santra, S.; Perez, J.M. PH-Tunable Oxidase-like Activity of Cerium Oxide Nanoparticles Achieving Sensitive Fluorigenic Detection of Cancer Biomarkers at Neutral PH. Anal. Chem. 2011, 83, 2547–2553. [Google Scholar] [CrossRef]
- Liu, B.; Sun, Z.; Huang, P.J.J.; Liu, J. Hydrogen Peroxide Displacing DNA from Nanoceria: Mechanism and Detection of Glucose in Serum. J. Am. Chem. Soc. 2015, 137, 1290–1295. [Google Scholar] [CrossRef]
- Kim, M.I.; Park, K.S.; Park, H.G. Ultrafast Colorimetric Detection of Nucleic Acids Based on the Inhibition of the Oxidase Activity of Cerium Oxide Nanoparticles. Chem. Commun. 2014, 50, 9577–9580. [Google Scholar] [CrossRef]
- Kim, H.Y.; Ahn, J.K.; Kim, M.I.; Park, K.S.; Park, H.G. Rapid and Label-Free, Electrochemical DNA Detection Utilizing the Oxidase-Mimicking Activity of Cerium Oxide Nanoparticles. Electrochem. Commun. 2019, 99, 5–10. [Google Scholar] [CrossRef]
- Kim, H.Y.; Park, K.S.; Park, H.G. Glucose Oxidase-like Activity of Cerium Oxide Nanoparticles: Use for Personal Glucose Meter-Based Label-Free Target DNA Detection. Theranostics 2020, 10, 4507–4514. [Google Scholar] [CrossRef]
- Liu, H.; Liu, J. Self-Limited Phosphatase-Mimicking CeO2 Nanozymes. ChemNanoMat 2020, 6, 947–952. [Google Scholar] [CrossRef]
- Xu, M.; Li, B. Label-Free Fluorescence Strategy for Sensitive Detection of Exonuclease Activity Using SYBR Green i as Probe. Spectrochim. Acta Part A Mol. Biomol. Spectrosc. 2015, 151, 22–26. [Google Scholar] [CrossRef]
Disclaimer/Publisher’s Note: The statements, opinions and data contained in all publications are solely those of the individual author(s) and contributor(s) and not of MDPI and/or the editor(s). MDPI and/or the editor(s) disclaim responsibility for any injury to people or property resulting from any ideas, methods, instructions or products referred to in the content. |
© 2023 by the authors. Licensee MDPI, Basel, Switzerland. This article is an open access article distributed under the terms and conditions of the Creative Commons Attribution (CC BY) license (https://creativecommons.org/licenses/by/4.0/).
