

Red Blood Cell Deformability Is Expressed by a Set of Interrelated Membrane Proteins

 ,
, 

Abstract
:1. Introduction
2. Results
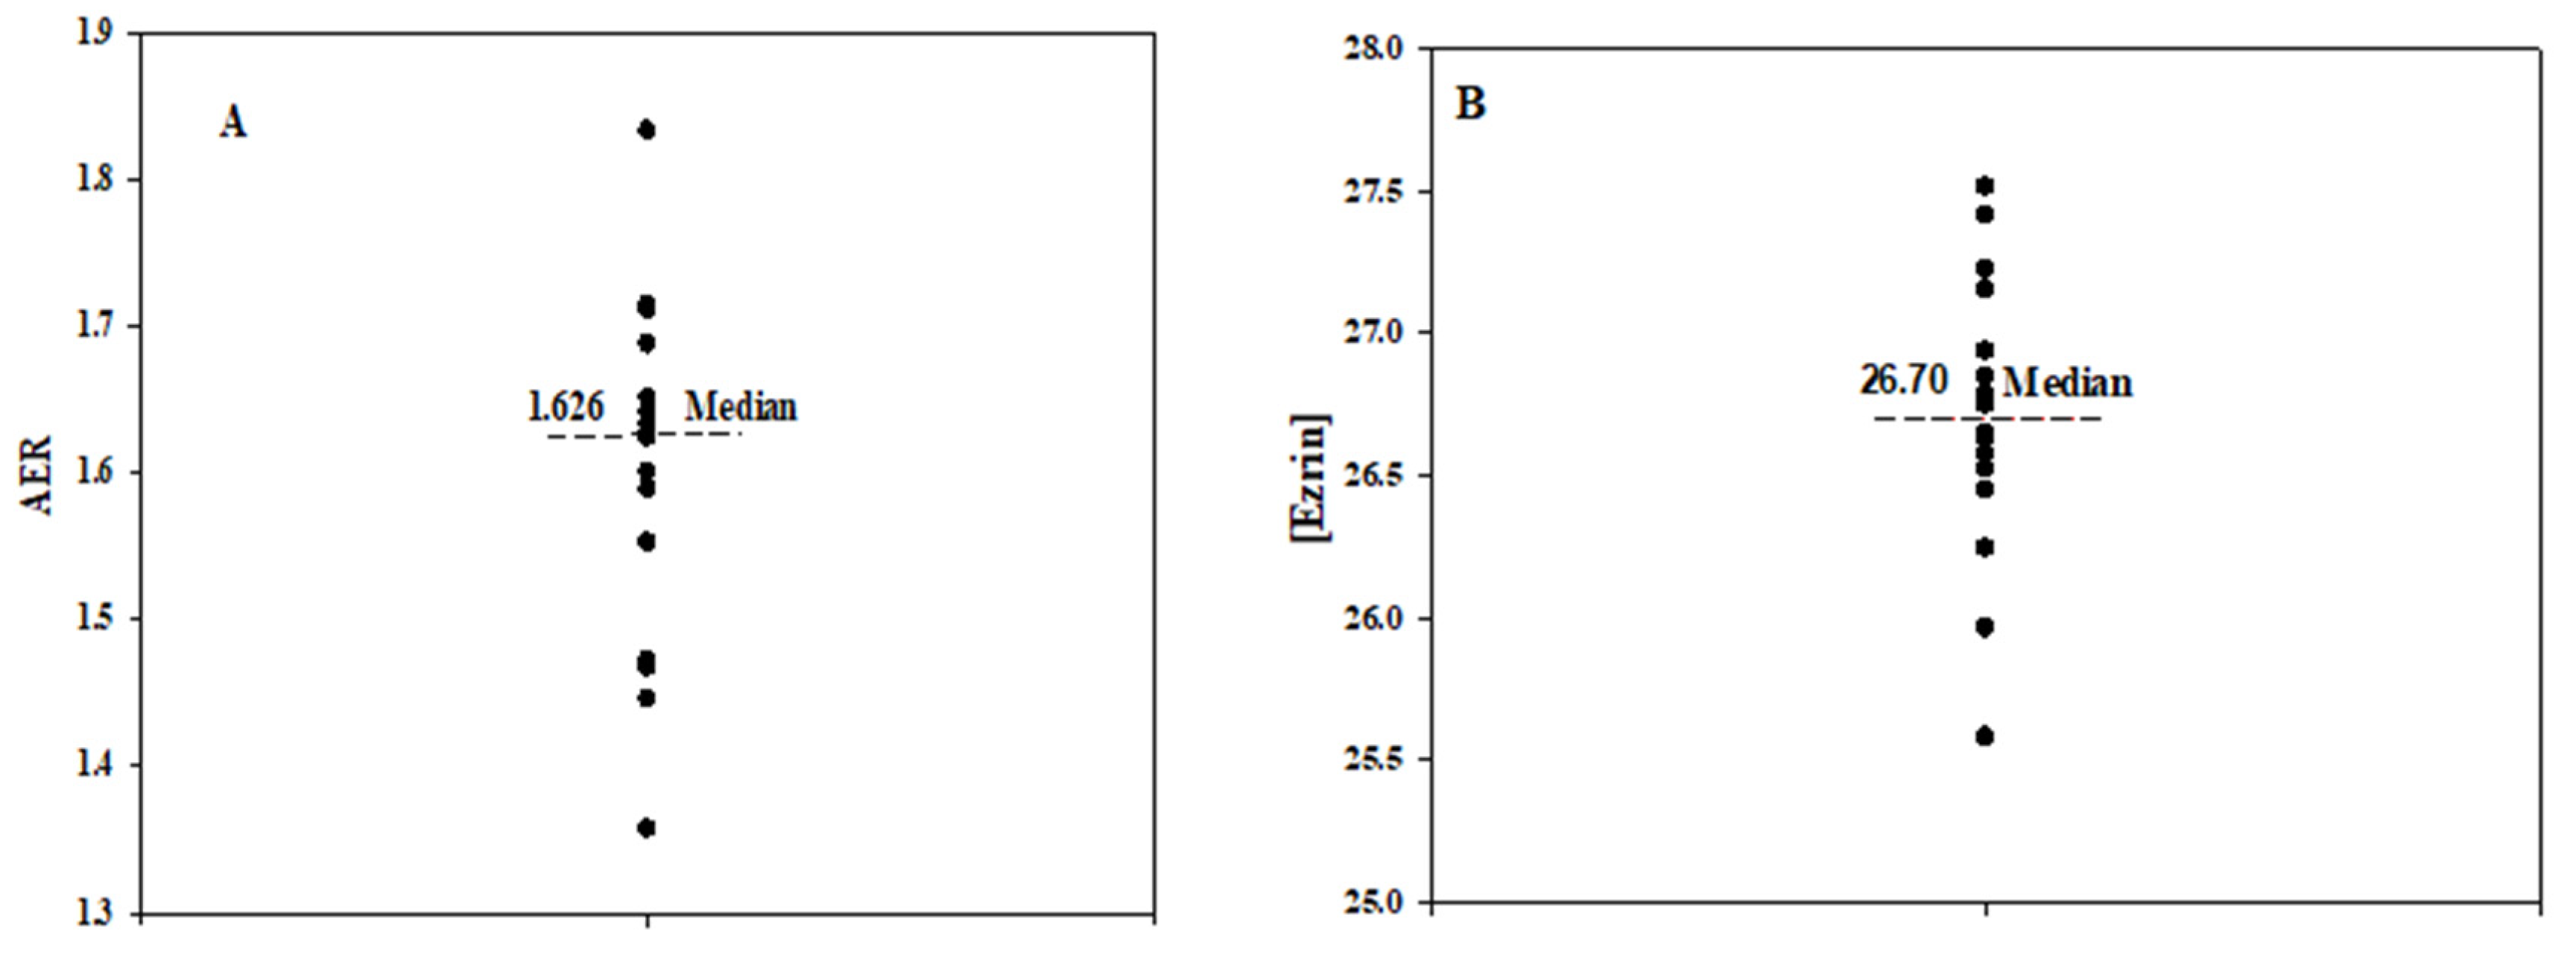
2.1. Variability in RBC Deformability and Respective Level of Membrane Proteins
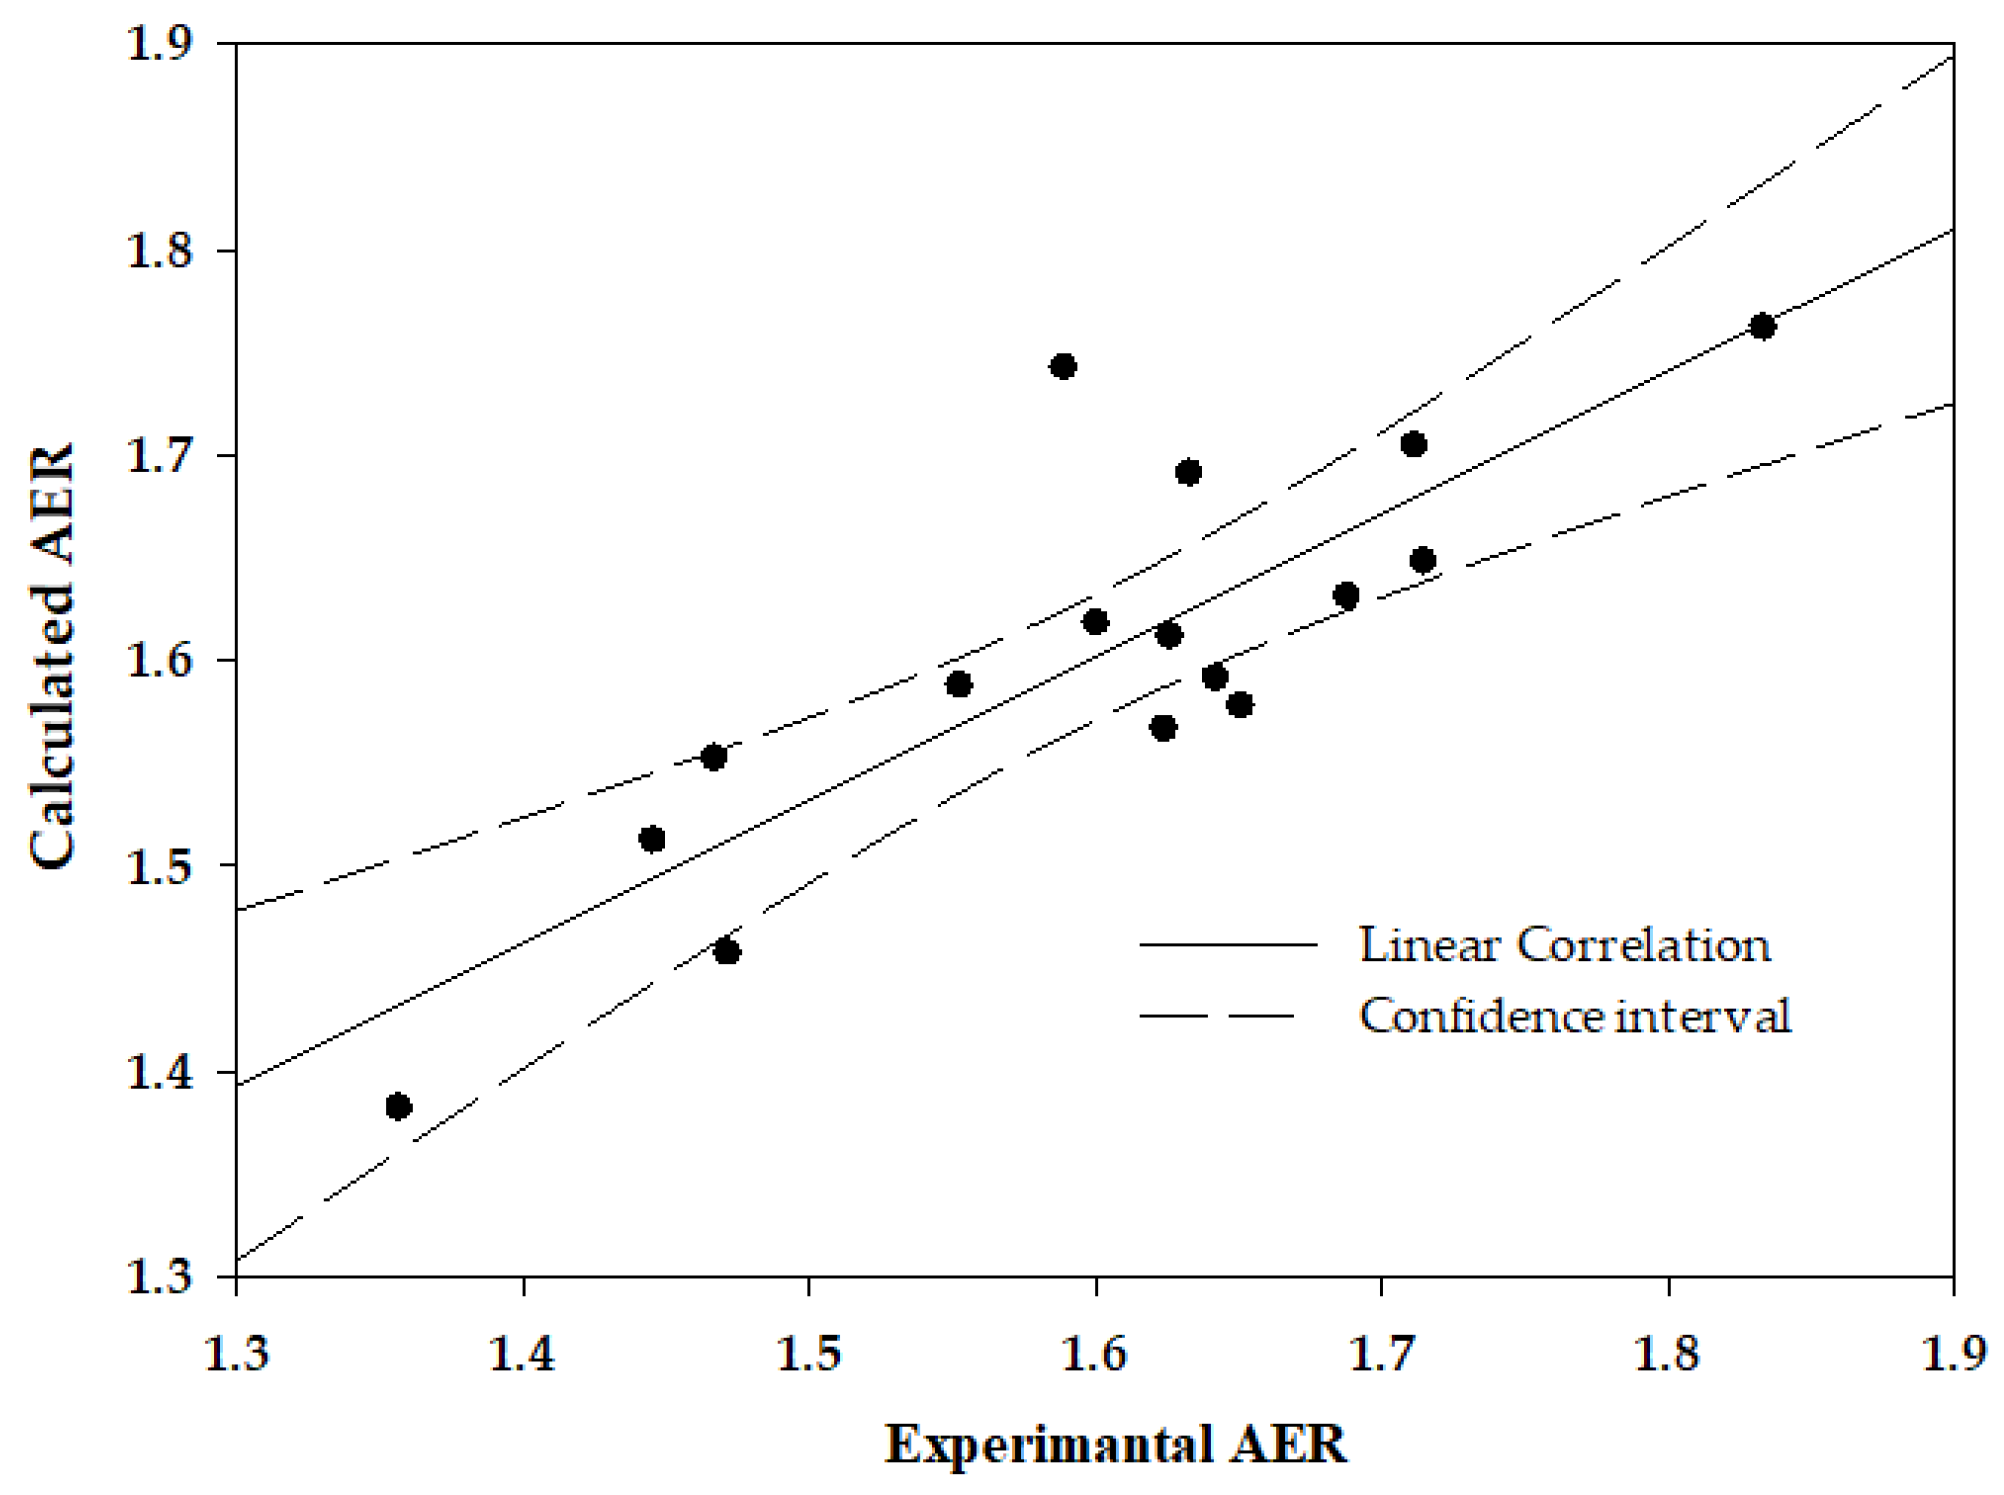
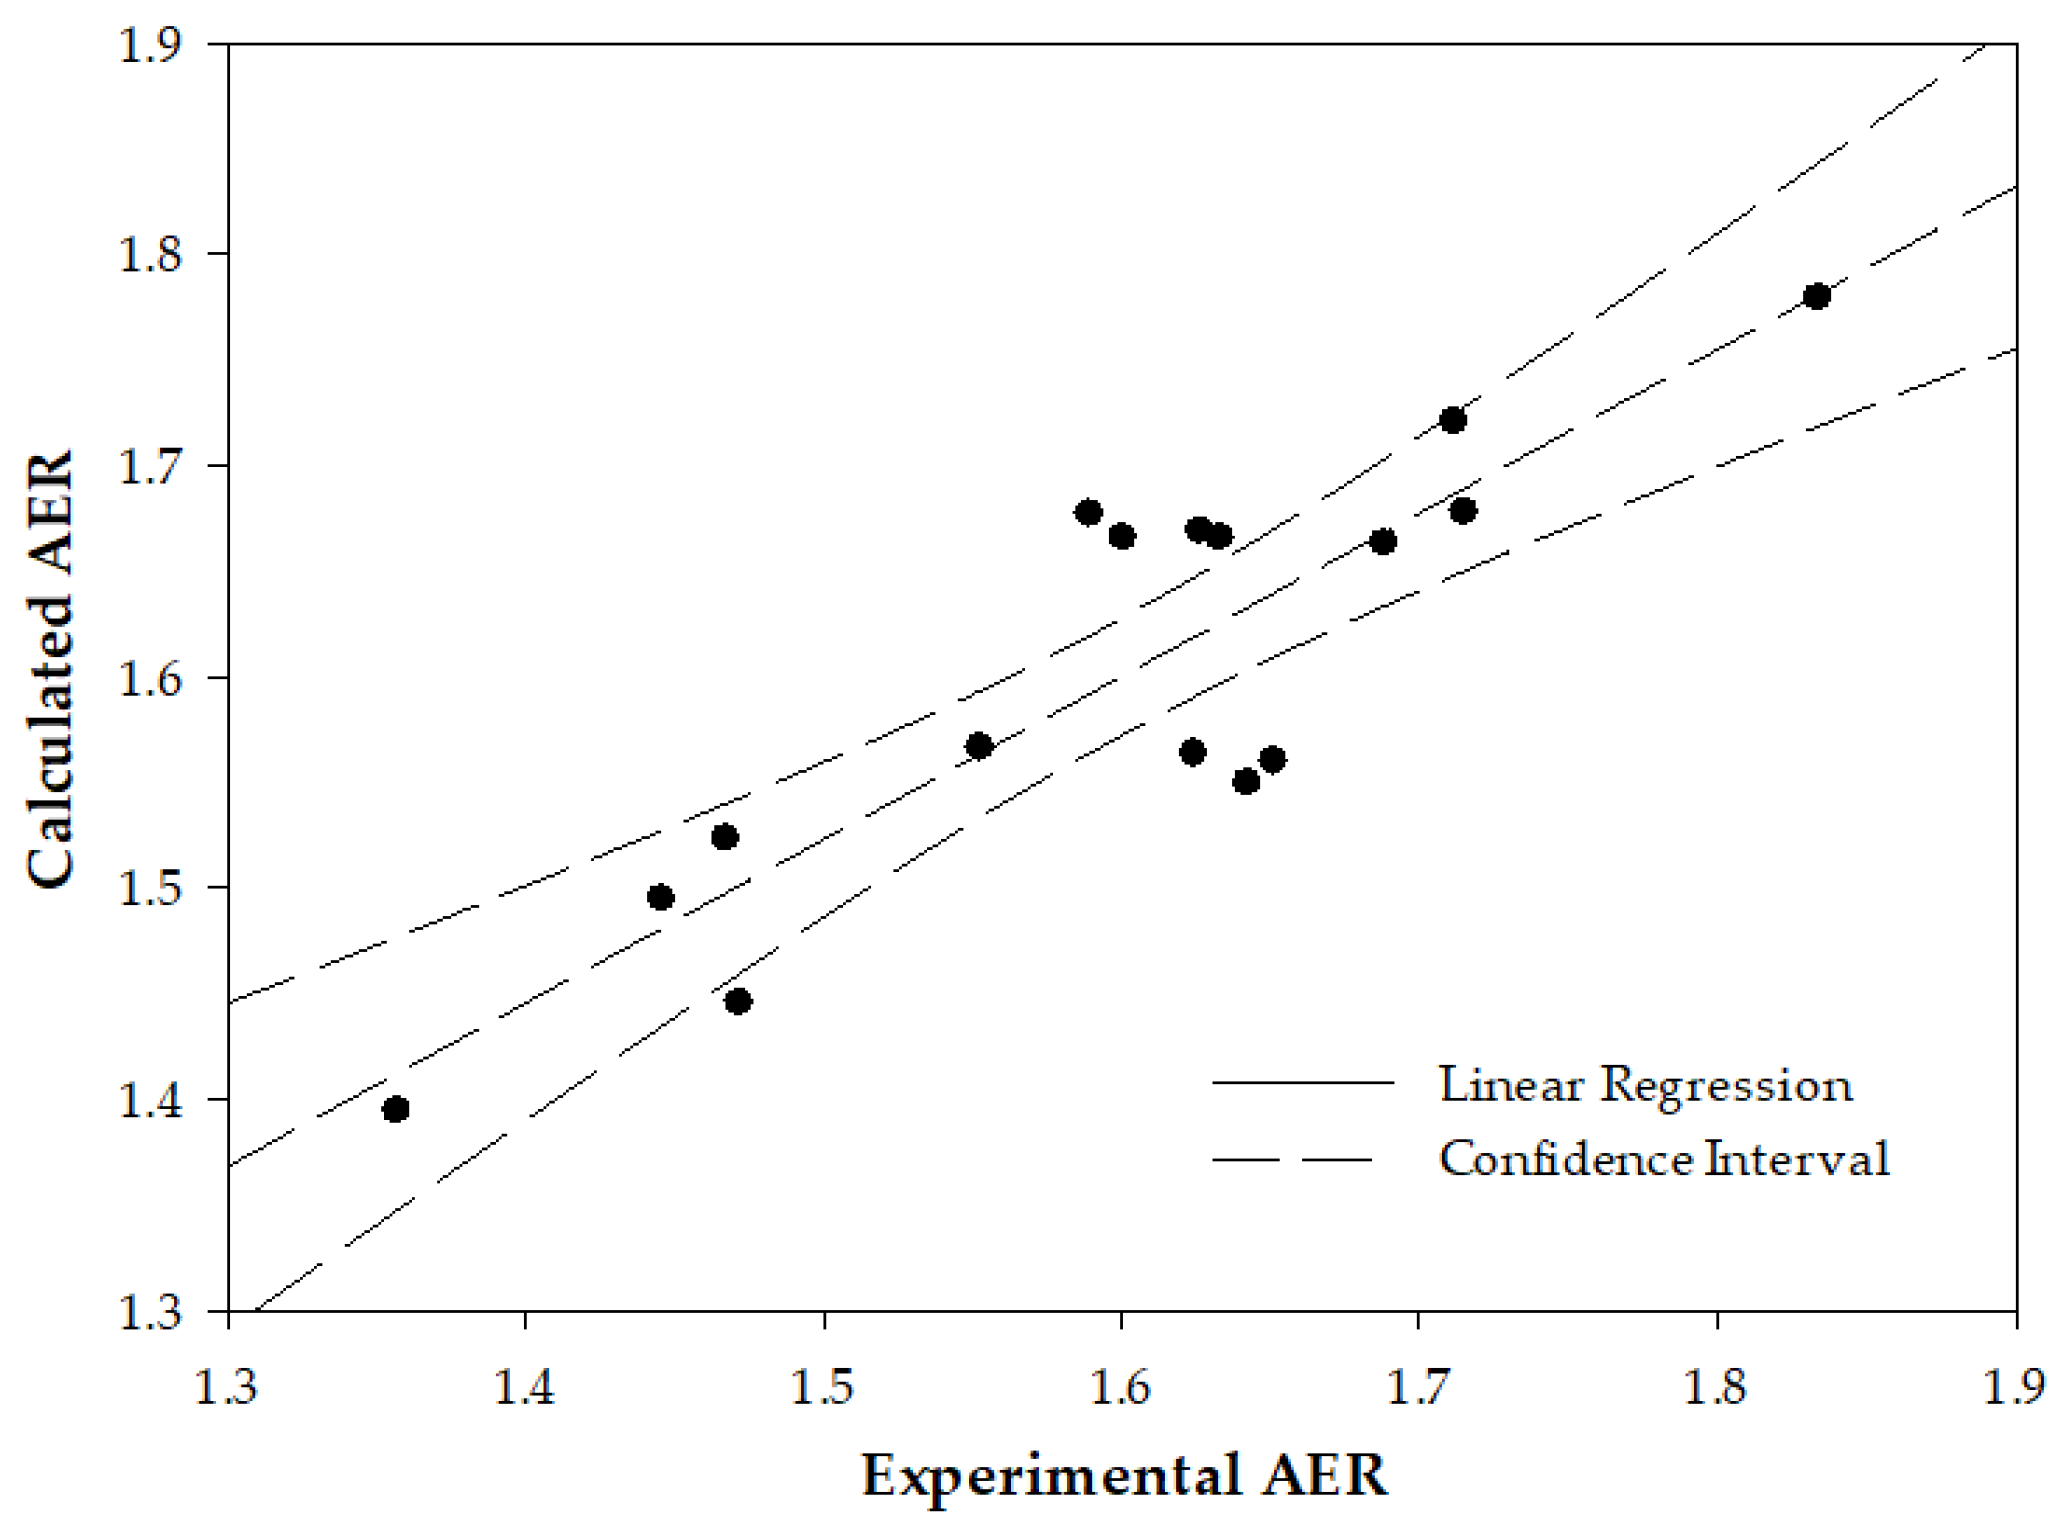
2.2. Interrelation between the Deformability-Expressing Membrane Proteins
3. Discussion
4. Materials and Methods
4.1. Materials
4.2. Methods
4.2.1. RBC Sample Sources
4.2.2. Isolation of RBC
4.2.3. Preparation of RBC Membranes
4.2.4. Determination of RBC Membrane Protein Composition
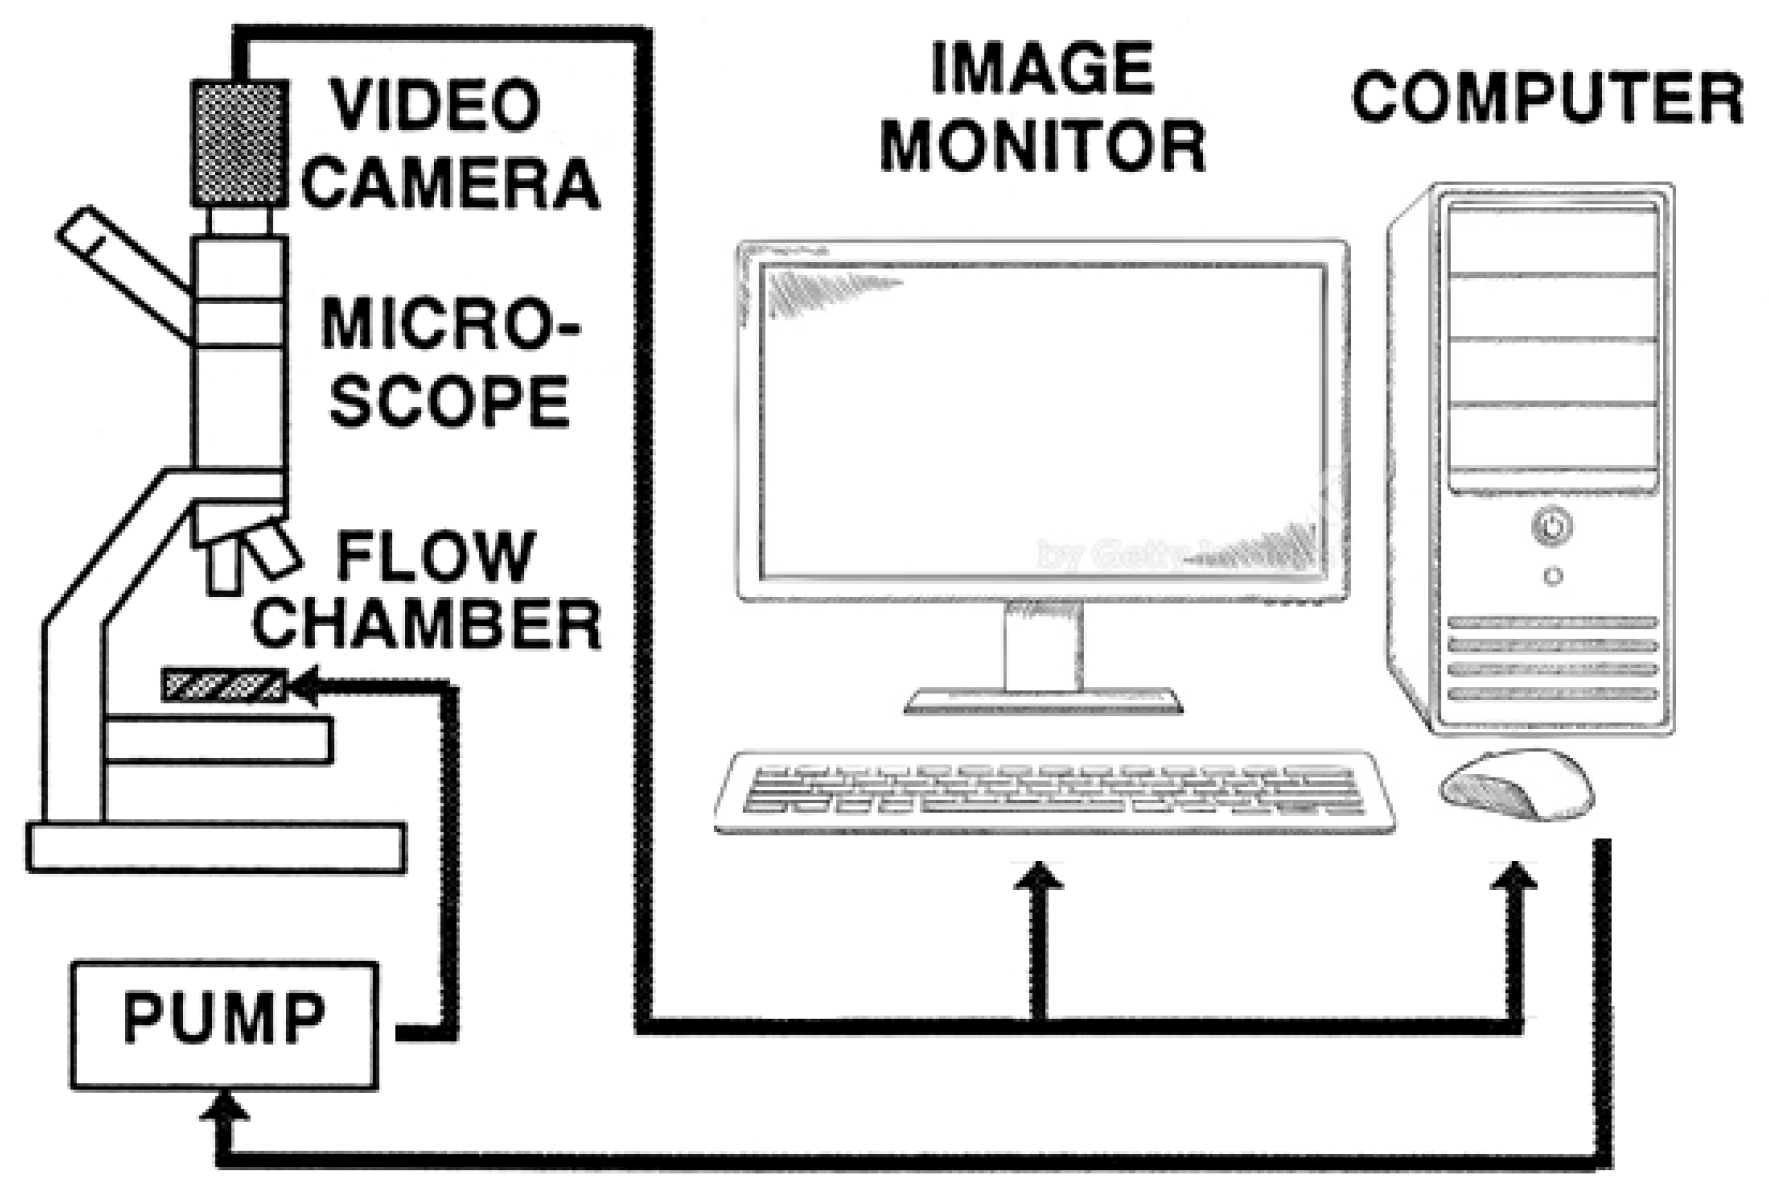
4.2.5. Determination of RBC Deformability
4.2.6. Statistical Analysis
5. Conclusions
Author Contributions
Funding
Institutional Review Board Statement
Informed Consent Statement
Data Availability Statement
Conflicts of Interest
References
- Barshtein, G.; Ben-Ami, R.; Yedgar, S. Role of red blood cell flow behavior in hemodynamics and hemostasis. Expert. Rev. Cardiovasc. Ther. 2007, 5, 743–752. [Google Scholar] [CrossRef] [PubMed]
- Barshtein, G.; Gural, A.; Zelig, O.; Arbell, D.; Yedgar, S. Preparation of packed red blood cell units in the blood bank: Alteration in red blood cell deformability. Transfus. Apher. Sci. 2020, 59, 102738. [Google Scholar] [CrossRef] [PubMed]
- Barshtein, G.; Arbell, D.; Yedgar, S. Hemodynamic Functionality of Transfused Red Blood Cells in the Microcirculation of Blood Recipients. Front. Physiol. 2018, 9, 41. [Google Scholar] [CrossRef] [PubMed]
- Parthasarathi, K.; Lipowsky, H.H. Capillary recruitment in response to tissue hypoxia and its dependence on red blood cell deformability. Am. J. Physiol. 1999, 277, H2145–H2157. [Google Scholar] [PubMed]
- Matot, I.; Katz, M.; Pappo, O.; Zelig, O.; Corchia, N.; Yedgar, S.; Barshtein, G.; Bennett-Guerrero, E.; Abramovitch, R. Resuscitation with aged blood exacerbates liver injury in a hemorrhagic rat model. Crit. Care Med. 2013, 41, 842–849. [Google Scholar] [CrossRef] [PubMed]
- Sakr, Y.; Chierego, M.; Piagnerelli, M.; Verdant, C.; Dubois, M.J.; Koch, M.; Creteur, J.; Gullo, A.; Vincent, J.L.; De Backer, D. Microvascular response to red blood cell transfusion in patients with severe sepsis. Crit. Care Med. 2007, 35, 1639–1644. [Google Scholar] [CrossRef] [PubMed]
- McHedlishvili, G. Disturbed blood flow structuring as critical factor of hemorheological disorders in microcirculation. Clin. Hemorheol. Microcirc. 1998, 19, 315–325. [Google Scholar] [PubMed]
- Warkentin, T.E.; Barr, R.D.; Ali, M.A.; Mohandas, N. Recurrent acute splenic sequestration crisis due to interacting genetic defects: Hemoglobin SC disease and hereditary spherocytosis. Blood 1990, 75, 266–270. [Google Scholar] [CrossRef] [Green Version]
- Mohandas, N.; Chasis, J.A. Red blood cell deformability, membrane material properties and shape: Regulation by transmembrane, skeletal and cytosolic proteins and lipids. Semin. Hematol. 1993, 30, 171–192. [Google Scholar]
- Mohandas, N.; Gallagher, P.G. Red cell membrane: Past, present, and future. Blood 2008, 112, 3939–3948. [Google Scholar] [CrossRef] [Green Version]
- Huang, S.; Amaladoss, A.; Liu, M.; Chen, H.; Zhang, R.; Preiser, P.R.; Dao, M.; Han, J. In Vivo splenic clearance correlates with in vitro deformability of red blood cells from Plasmodium yoelii-infected mice. Infect. Immun. 2014, 82, 2532–2541. [Google Scholar] [CrossRef] [PubMed] [Green Version]
- Perez, S.M.; Riquelme, B.; Acosta, I.; Valverde, J.; Milani, A. Erythrocytes dynamic viscoelasticity in beta-thalassaemia minor. Clin. Hemorheol. Microcirc. 2006, 35, 311–316. [Google Scholar] [PubMed]
- Baskurt, O.K.; Gelmont, D.; Meiselman, H.J. Red blood cell deformability in sepsis. Am. J. Respir. Crit. Care Med. 1998, 157, 421–427. [Google Scholar] [CrossRef] [PubMed]
- Stuart, J.; Johnson, C.S. Rheology of the sickle cell disorders. Bailliere’s Clin. Haematol. 1987, 1, 747–775. [Google Scholar] [CrossRef] [PubMed]
- Negrean, V.; Suciu, I.; Sampelean, D.; Cozma, A. Rheological changes in diabetic microangiopathy. Rom. J. Intern. Med. = Rev. Roum. Med. Interne 2004, 42, 407–413. [Google Scholar]
- Kowal, P.; Marcinkowska-Gapinska, A. Hemorheological changes dependent on the time from the onset of ischemic stroke. J. Neurol. Sci. 2007, 258, 132–136. [Google Scholar] [CrossRef] [PubMed]
- Barshtein, G.; Gural, A.; Zelig, O.; Arbell, D.; Yedgar, S. Unit-to-unit variability in the deformability of red blood cells. Transfus. Apher. Sci. 2020, 59, 102876. [Google Scholar] [CrossRef]
- Barshtein, G.; Rasmusen, T.L.; Zelig, O.; Arbell, D.; Yedgar, S. Inter-donor variability in deformability of red blood cells in blood units. Transfus. Med. 2020, 30, 492–496. [Google Scholar] [CrossRef]
- Livshits, L.; Barshtein, G.; Arbell, D.; Gural, A.; Levin, C.; Guizouarn, H. Do We Store Packed Red Blood Cells under “Quasi-Diabetic” Conditions? Biomolecules 2021, 11, 992. [Google Scholar] [CrossRef]
- Badior, K.E.; Casey, J.R. Molecular mechanism for the red blood cell senescence clock. IUBMB Life 2018, 70, 32–40. [Google Scholar] [CrossRef] [Green Version]
- Bosman, G.J.; Lasonder, E.; Groenen-Dopp, Y.A.; Willekens, F.L.; Werre, J.M.; Novotny, V.M. Comparative proteomics of erythrocyte aging in vivo and in vitro. J. Proteom. 2010, 73, 396–402. [Google Scholar] [CrossRef] [PubMed]
- Sudnitsyna, J.; Skverchinskaya, E.; Dobrylko, I.; Nikitina, E.; Gambaryan, S.; Mindukshev, I. Microvesicle Formation Induced by Oxidative Stress in Human Erythrocytes. Antioxidants 2020, 9, 929. [Google Scholar] [CrossRef] [PubMed]
- Willekens, F.L.; Werre, J.M.; Groenen-Dopp, Y.A.; Roerdinkholder-Stoelwinder, B.; de Pauw, B.; Bosman, G.J. Erythrocyte vesiculation: A self-protective mechanism? Br. J. Haematol. 2008, 141, 549–556. [Google Scholar] [CrossRef] [PubMed]
- Huisjes, R.; Bogdanova, A.; van Solinge, W.W.; Schiffelers, R.M.; Kaestner, L.; van Wijk, R. Squeezing for Life—Properties of Red Blood Cell Deformability. Front. Physiol. 2018, 9, 656. [Google Scholar] [CrossRef] [PubMed] [Green Version]
- Orbach, A.; Zelig, O.; Yedgar, S.; Barshtein, G. Biophysical and Biochemical Markers of Red Blood Cell Fragility. Transfus. Med. Hemother. 2017, 44, 183–187. [Google Scholar] [CrossRef] [PubMed] [Green Version]
- Salzer, U.; Zhu, R.; Luten, M.; Isobe, H.; Pastushenko, V.; Perkmann, T.; Hinterdorfer, P.; Bosman, G.J. Vesicles generated during storage of red cells are rich in the lipid raft marker stomatin. Transfusion 2008, 48, 451–462. [Google Scholar] [CrossRef] [PubMed]
- Evans, E.A.; La Celle, P.L. Intrinsic material properties of the erythrocyte membrane indicated by mechanical analysis of deformation. Blood 1975, 45, 29–43. [Google Scholar] [CrossRef] [PubMed] [Green Version]
- Sergunova, V.; Leesment, S.; Kozlov, A.; Inozemtsev, V.; Platitsina, P.; Lyapunova, S.; Onufrievich, A.; Polyakov, V.; Sherstyukova, E. Investigation of Red Blood Cells by Atomic Force Microscopy. Sensors 2022, 22, 2055. [Google Scholar] [CrossRef]
- Agrawal, R.; Smart, T.; Nobre-Cardoso, J.; Richards, C.; Bhatnagar, R.; Tufail, A.; Shima, D.; Jones, P.H.; Pavesio, C. Assessment of red blood cell deformability in type 2 diabetes mellitus and diabetic retinopathy by dual optical tweezers stretching technique. Sci. Rep. 2016, 6, 15873. [Google Scholar] [CrossRef] [Green Version]
- Brandao, M.M.; Fontes, A.; Barjas-Castro, M.L.; Barbosa, L.C.; Costa, F.F.; Cesar, C.L.; Saad, S.T. Optical tweezers for measuring red blood cell elasticity: Application to the study of drug response in sickle cell disease. Eur. J. Haematol. 2003, 70, 207–211. [Google Scholar] [CrossRef]
- Gueguen, M.; Bidet, J.M.; Durand, F.; Driss, F.; Joffre, A.; Genetet, B. Filtration pressure and red blood cell deformability: Evaluation of a new device: Erythrometre. Biorheol. Suppl. 1984, 1, 261–265. [Google Scholar] [CrossRef] [PubMed]
- Islamzada, E.; Matthews, K.; Guo, Q.; Santoso, A.T.; Duffy, S.P.; Scott, M.D.; Ma, H. Deformability based sorting of stored red blood cells reveals donor-dependent aging curves. Lab Chip 2020, 20, 226–235. [Google Scholar] [CrossRef] [PubMed]
- Rabai, M.; Meiselman, H.J.; Wenby, R.B.; Detterich, J.A.; Feinberg, J. Analysis of light scattering by red blood cells in ektacytometry using global pattern fitting. Biorheology 2012, 49, 317–328. [Google Scholar] [CrossRef] [PubMed]
- Baskurt, O.K.; Meiselman, H.J. Determination of red blood cell shape recovery time constant in a Couette system by the analysis of light reflectance and ektacytometry. Biorheology 1996, 33, 489–503. [Google Scholar] [CrossRef] [PubMed]
- Barshtein, G.; Goldschmidt, N.; Pries, A.R.; Zelig, O.; Arbell, D.; Yedgar, S. Deformability of transfused red blood cells is a potent effector of transfusion-induced hemoglobin increment: A study with beta-thalassemia major patients. Am. J. Hematol. 2017, 92, E559–E560. [Google Scholar] [CrossRef] [PubMed] [Green Version]
- Faustino, V.; Rodrigues, R.O.; Pinho, D.; Costa, E.; Santos-Silva, A.; Miranda, V.; Amaral, J.S.; Lima, R. A Microfluidic Deformability Assessment of Pathological Red Blood Cells Flowing in a Hyperbolic Converging Microchannel. Micromachines 2019, 10, 645. [Google Scholar] [CrossRef] [PubMed] [Green Version]
- Chen, Y.; Miyazono, K.; Otsuka, Y.; Kanamori, M.; Yamashita, A.; Arashiki, N.; Matsumoto, T.; Takada, K.; Sato, K.; Mohandas, N.; et al. Membrane skeleton hyperstability due to a novel alternatively spliced 4.1R can account for ellipsoidal camelid red cells with decreased deformability. J. Biol. Chem. 2023, 299, 102877. [Google Scholar] [CrossRef]
- Cilek, N.; Ugurel, E.; Goksel, E.; Yalcin, O. Signaling mechanisms in red blood cells: A view through the protein phosphorylation and deformability. J. Cell. Physiol. 2023. [Google Scholar] [CrossRef]
- Kuo, M.S.; Chuang, C.H.; Cheng, H.C.; Lin, H.R.; Wang, J.S.; Hsu, K. Different Involvement of Band 3 in Red Cell Deformability and Osmotic Fragility—A Comparative GP.Mur Erythrocyte Study. Cells 2021, 10, 3369. [Google Scholar] [CrossRef]
- Spinelli, S.; Straface, E.; Gambardella, L.; Caruso, D.; Falliti, G.; Remigante, A.; Marino, A.; Morabito, R. Aging Injury Impairs Structural Properties and Cell Signaling in Human Red Blood Cells; Acai Berry Is a Keystone. Antioxidants 2023, 12, 848. [Google Scholar] [CrossRef]
- Anong, W.A.; Franco, T.; Chu, H.; Weis, T.L.; Devlin, E.E.; Bodine, D.M.; An, X.; Mohandas, N.; Low, P.S. Adducin forms a bridge between the erythrocyte membrane and its cytoskeleton and regulates membrane cohesion. Blood 2009, 114, 1904–1912. [Google Scholar] [CrossRef] [PubMed] [Green Version]
- Franco, T.; Low, P.S. Erythrocyte adducin: A structural regulator of the red blood cell membrane. Transfus. Clin. Biol. 2010, 17, 87–94. [Google Scholar] [CrossRef] [PubMed]
- Ciana, A.; Achilli, C.; Minetti, G. Membrane rafts of the human red blood cell. Mol. Membr. Biol. 2014, 31, 47–57. [Google Scholar] [CrossRef] [PubMed]
- Lux, S.E., IV. Anatomy of the red cell membrane skeleton: Unanswered questions. Blood 2016, 127, 187–199. [Google Scholar] [CrossRef] [PubMed] [Green Version]
- Salzer, U.; Prohaska, R. Stomatin, flotillin-1, and flotillin-2 are major integral proteins of erythrocyte lipid rafts. Blood 2001, 97, 1141–1143. [Google Scholar] [CrossRef] [PubMed] [Green Version]
- Loniewska-Lwowska, A.; Koza, K.; Mendek-Czajkowska, E.; Wieszczy, P.; Adamowicz-Salach, A.; Branicka, K.; Witos, I.; Sapala-Smoczynska, A.; Jackowska, T.; Fabijanska-Mitek, J. Diminished presentation of complement regulatory protein CD55 on red blood cells from patients with hereditary haemolytic anaemias. Int. J. Lab. Hematol. 2018, 40, 128–135. [Google Scholar] [CrossRef] [PubMed]
- Sparrow, R.L.; Healey, G.; Patton, K.A.; Veale, M.F. Red blood cell age determines the impact of storage and leukocyte burden on cell adhesion molecules, glycophorin A and the release of annexin V. Transfus. Apher. Sci. 2006, 34, 15–23. [Google Scholar] [CrossRef] [PubMed]
- McVey, M.J.; Kuebler, W.M.; Orbach, A.; Arbell, D.; Zelig, O.; Barshtein, G.; Yedgar, S. Reduced deformability of stored red blood cells is associated with generation of extracellular vesicles. Transfus. Apher. Sci. 2020, 59, 102851. [Google Scholar] [CrossRef]
- Renoux, C.; Faivre, M.; Bessaa, A.; Da Costa, L.; Joly, P.; Gauthier, A.; Connes, P. Impact of surface-area-to-volume ratio, internal viscosity and membrane viscoelasticity on red blood cell deformability measured in isotonic condition. Sci. Rep. 2019, 9, 6771. [Google Scholar] [CrossRef] [Green Version]
- Chien, W.; Gompper, G.; Fedosov, D.A. Effect of cytosol viscosity on the flow behavior of red blood cell suspensions in microvessels. Microcirculation 2021, 28, e12668. [Google Scholar] [CrossRef]
- Algrain, M.; Turunen, O.; Vaheri, A.; Louvard, D.; Arpin, M. Ezrin contains cytoskeleton and membrane binding domains accounting for its proposed role as a membrane-cytoskeletal linker. J. Cell Biol. 1993, 120, 129–139. [Google Scholar] [CrossRef] [PubMed]
- Li, H.; Yang, J.; Chu, T.T.; Naidu, R.; Lu, L.; Chandramohanadas, R.; Dao, M.; Karniadakis, G.E. Cytoskeleton Remodeling Induces Membrane Stiffness and Stability Changes of Maturing Reticulocytes. Biophys. J. 2018, 114, 2014–2023. [Google Scholar] [CrossRef] [PubMed] [Green Version]
- Marfatia, S.M.; Lue, R.A.; Branton, D.; Chishti, A.H. In Vitro binding studies suggest a membrane-associated complex between erythroid p55, protein 4.1, and glycophorin C. J. Biol. Chem. 1994, 269, 8631–8634. [Google Scholar] [CrossRef]
- Wieschhaus, A.; Khan, A.; Zaidi, A.; Rogalin, H.; Hanada, T.; Liu, F.; De Franceschi, L.; Brugnara, C.; Rivera, A.; Chishti, A.H. Calpain-1 knockout reveals broad effects on erythrocyte deformability and physiology. Biochem. J. 2012, 448, 141–152. [Google Scholar] [CrossRef] [PubMed] [Green Version]
- Wang, Y.; You, G.; Chen, P.; Li, J.; Chen, G.; Wang, B.; Li, P.; Han, D.; Zhou, H.; Zhao, L. The mechanical properties of stored red blood cells measured by a convenient microfluidic approach combining with mathematic model. Biomicrofluidics 2016, 10, 024104. [Google Scholar] [CrossRef] [PubMed] [Green Version]
- Kriebardis, A.G.; Antonelou, M.H.; Stamoulis, K.E.; Economou-Petersen, E.; Margaritis, L.H.; Papassideri, I.S. Progressive oxidation of cytoskeletal proteins and accumulation of denatured hemoglobin in stored red cells. J. Cell. Mol. Med. 2007, 11, 148–155. [Google Scholar] [CrossRef] [PubMed] [Green Version]
- Lu, T.; Lee, C.H.; Anvari, B. Morphological Characteristics, Hemoglobin Content, and Membrane Mechanical Properties of Red Blood Cell Delivery Systems. ACS Appl. Mater. Interfaces 2022, 14, 18219–18232. [Google Scholar] [CrossRef]
- Bosman, G.J.; Lasonder, E.; Luten, M.; Roerdinkholder-Stoelwinder, B.; Novotny, V.M.; Bos, H.; De Grip, W.J. The proteome of red cell membranes and vesicles during storage in blood bank conditions. Transfusion 2008, 48, 827–835. [Google Scholar]
- Sun, L.; Yu, Y.; Niu, B.; Wang, D. Red Blood Cells as Potential Repositories of MicroRNAs in the Circulatory System. Front. Genet. 2020, 11, 442. [Google Scholar] [CrossRef]
- Thangaraju, K.; Neerukonda, S.N.; Katneni, U.; Buehler, P.W. Extracellular Vesicles from Red Blood Cells and Their Evolving Roles in Health, Coagulopathy and Therapy. Int. J. Mol. Sci. 2020, 22, 153. [Google Scholar] [CrossRef]
- D’Alessandro, A.; Blasi, B.; D’Amici, G.M.; Marrocco, C.; Zolla, L. Red blood cell subpopulations in freshly drawn blood: Application of proteomics and metabolomics to a decades-long biological issue. Blood Transfus. 2013, 11, 75–87. [Google Scholar] [CrossRef] [PubMed]
- Wilkinson, D.K.; Turner, E.J.; Parkin, E.T.; Garner, A.E.; Harrison, P.J.; Crawford, M.; Stewart, G.W.; Hooper, N.M. Membrane raft actin deficiency and altered Ca2+-induced vesiculation in stomatin-deficient overhydrated hereditary stomatocytosis. Biochim. Biophys. Acta 2008, 1778, 125–132. [Google Scholar] [CrossRef] [PubMed]
- Rungaldier, S.; Oberwagner, W.; Salzer, U.; Csaszar, E.; Prohaska, R. Stomatin interacts with GLUT1/SLC2A1, band 3/SLC4A1, and aquaporin-1 in human erythrocyte membrane domains. Biochim. Biophys. Acta 2013, 1828, 956–966. [Google Scholar] [CrossRef] [Green Version]
- Gilden, J.; Krummel, M.F. Control of cortical rigidity by the cytoskeleton: Emerging roles for septins. Cytoskeleton 2010, 67, 477–486. [Google Scholar] [CrossRef] [PubMed] [Green Version]
- Marsick, B.M.; San Miguel-Ruiz, J.E.; Letourneau, P.C. Activation of ezrin/radixin/moesin mediates attractive growth cone guidance through regulation of growth cone actin and adhesion receptors. J. Neurosci. 2012, 32, 282–296. [Google Scholar] [CrossRef] [PubMed] [Green Version]
- Anastasiadi, A.T.; Paronis, E.C.; Arvaniti, V.Z.; Velentzas, A.D.; Apostolidou, A.C.; Balafas, E.G.; Dzieciatkowska, M.; Kostomitsopoulos, N.G.; Stamoulis, K.; Papassideri, I.S.; et al. The Post-Storage Performance of RBCs from Beta-Thalassemia Trait Donors Is Related to Their Storability Profile. Int. J. Mol. Sci. 2021, 22, 12281. [Google Scholar] [CrossRef] [PubMed]
- Cohen, R.M.; Franco, R.S.; Khera, P.K.; Smith, E.P.; Lindsell, C.J.; Ciraolo, P.J.; Palascak, M.B.; Joiner, C.H. Red cell life span heterogeneity in hematologically normal people is sufficient to alter HbA1c. Blood 2008, 112, 4284–4291. [Google Scholar] [CrossRef] [PubMed] [Green Version]
- Tzounakas, V.L.; Anastasiadi, A.T.; Dzieciatkowska, M.; Karadimas, D.G.; Stamoulis, K.; Papassideri, I.S.; Hansen, K.C.; D’Alessandro, A.; Kriebardis, A.G.; Antonelou, M.H. Proteome of Stored RBC Membrane and Vesicles from Heterozygous Beta Thalassemia Donors. Int. J. Mol. Sci. 2021, 22, 3369. [Google Scholar] [CrossRef]
- Freitas Leal, J.K.; Lasonder, E.; Sharma, V.; Schiller, J.; Fanelli, G.; Rinalducci, S.; Brock, R.; Bosman, G. Vesiculation of Red Blood Cells in the Blood Bank: A Multi-Omics Approach towards Identification of Causes and Consequences. Proteomes 2020, 8, 6. [Google Scholar] [CrossRef] [Green Version]
- Gautier, E.F.; Ducamp, S.; Leduc, M.; Salnot, V.; Guillonneau, F.; Dussiot, M.; Hale, J.; Giarratana, M.C.; Raimbault, A.; Douay, L.; et al. Comprehensive Proteomic Analysis of Human Erythropoiesis. Cell Rep. 2016, 16, 1470–1484. [Google Scholar] [CrossRef] [Green Version]
- Barshtein, G.; Arbell, D.; Livshits, L.; Gural, A. Is It Possible to Reverse the Storage-Induced Lesion of Red Blood Cells? Front. Physiol. 2018, 9, 914. [Google Scholar] [CrossRef]
- Barshtein, G.; Pries, A.R.; Goldschmidt, N.; Zukerman, A.; Orbach, A.; Zelig, O.; Arbell, D.; Yedgar, S. Deformability of transfused red blood cells is a potent determinant of transfusion-induced change in recipient’s blood flow. Microcirculation 2016, 23, 479–486. [Google Scholar] [CrossRef]


| № | Proteins | Gene | Significance, p | Pearson Coefficient, r |
|---|---|---|---|---|
| 1 | Ezrin | EZR | 0.00006 | 0.83 |
| 2 | Long-chain-fatty-acid—CoA ligase 4 | ACSL4 | 0.0002 | 0.81 |
| 3 | Argonaute-2 | EIF2C2 | 0.0003 | 0.79 |
| 4 | Protein band 4.1 | EPB41 | 0.0003 | 0.79 |
| 5 | Glycophorin C | GYPC | 0.0005 | 0.77 |
| 6 | GTP-binding proteins Ras | RAC1/3 | 0.0007 | 0.76 |
| 7 | Stomatin | STOM | 0.0008 | 0.75 |
| 8 | G-adducin | ADD3 | 0.001 | 0.75 |
| 9 | Flotellin-1 | FLOT1 | 0.001 | 0.73 |
| 10 | CD44 | CD44 | 0.002 | 0.72 |
| 11 | Band-3 | SLC4A1 | 0.002 | 0.72 |
| 12 | Flotellin-2 | FLOT2 | 0.002 | 0.71 |
| 13 | Integrin-associated protein CD47 | CD47 | 0.003 | 0.72 |
| 14 | Glycophorins A | GYPA | 0.004 | 0.67 |
| EIF2C2 | EZR | EPB41 | ACSL4 | FLOT1 | GYPC | STOM | CD44 | SLC4A1 | FLOT2 | RAC1/3 | CD47 | GYPA | ADD3 | |
|---|---|---|---|---|---|---|---|---|---|---|---|---|---|---|
| EIF2C2 | 1.00 | |||||||||||||
| EZR | 0.72 | 1.00 | ||||||||||||
| EPB41 | 0.92 | 0.71 | 1.00 | |||||||||||
| ACSL4 | 0.90 | 0.81 | 0.86 | 1.00 | ||||||||||
| FLOT1 | 0.88 | 0.70 | 0.93 | 0.87 | 1.00 | |||||||||
| GYPC | 0.84 | 0.71 | 0.88 | 0.84 | 0.96 | 1.00 | ||||||||
| STOM | 0.85 | 0.71 | 0.85 | 0.91 | 0.94 | 0.96 | 1.00 | |||||||
| CD44 | 0.89 | 0.67 | 0.84 | 0.89 | 0.93 | 0.95 | 0.98 | 1.00 | ||||||
| SLC4A1 | 0.85 | 0.62 | 0.89 | 0.84 | 0.97 | 0.98 | 0.97 | 0.95 | 1.00 | |||||
| FLOT2 | 0.85 | 0.67 | 0.84 | 0.89 | 0.96 | 0.97 | 0.99 | 0.98 | 0.98 | 1.00 | ||||
| RAC1/3 | 0.85 | 0.72 | 0.84 | 0.91 | 0.93 | 0.94 | 0.97 | 0.95 | 0.95 | 0.97 | 1.00 | |||
| CD47 | 0.82 | 0.69 | 0.78 | 0.86 | 0.88 | 0.89 | 0.95 | 0.93 | 0.92 | 0.95 | 0.96 | 1.00 | ||
| GYPA | 0.86 | 0.58 | 0.91 | 0.79 | 0.89 | 0.85 | 0.83 | 0.83 | 0.90 | 0.86 | 0.90 | 0.84 | 1.00 | |
| ADD3 | 0.75 | 0.79 | 0.78 | 0.69 | 0.68 | 0.67 | 0.60 | 0.63 | 0.63 | 0.58 | 0.67 | 0.57 | 0.67 | 1.00 |
Disclaimer/Publisher’s Note: The statements, opinions and data contained in all publications are solely those of the individual author(s) and contributor(s) and not of MDPI and/or the editor(s). MDPI and/or the editor(s) disclaim responsibility for any injury to people or property resulting from any ideas, methods, instructions or products referred to in the content. |
© 2023 by the authors. Licensee MDPI, Basel, Switzerland. This article is an open access article distributed under the terms and conditions of the Creative Commons Attribution (CC BY) license (https://creativecommons.org/licenses/by/4.0/).
Share and Cite
Barshtein, G.; Gural, A.; Arbell, D.; Barkan, R.; Livshits, L.; Pajic-Lijakovic, I.; Yedgar, S. Red Blood Cell Deformability Is Expressed by a Set of Interrelated Membrane Proteins. Int. J. Mol. Sci. 2023, 24, 12755. https://doi.org/10.3390/ijms241612755
Barshtein G, Gural A, Arbell D, Barkan R, Livshits L, Pajic-Lijakovic I, Yedgar S. Red Blood Cell Deformability Is Expressed by a Set of Interrelated Membrane Proteins. International Journal of Molecular Sciences. 2023; 24(16):12755. https://doi.org/10.3390/ijms241612755
Chicago/Turabian StyleBarshtein, Gregory, Alexander Gural, Dan Arbell, Refael Barkan, Leonid Livshits, Ivana Pajic-Lijakovic, and Saul Yedgar. 2023. "Red Blood Cell Deformability Is Expressed by a Set of Interrelated Membrane Proteins" International Journal of Molecular Sciences 24, no. 16: 12755. https://doi.org/10.3390/ijms241612755
APA StyleBarshtein, G., Gural, A., Arbell, D., Barkan, R., Livshits, L., Pajic-Lijakovic, I., & Yedgar, S. (2023). Red Blood Cell Deformability Is Expressed by a Set of Interrelated Membrane Proteins. International Journal of Molecular Sciences, 24(16), 12755. https://doi.org/10.3390/ijms241612755