Article

Genome-Wide Identification and Expression Analysis of BrGeBP Genes Reveal Their Potential Roles in Cold and Drought Stress Tolerance in Brassica rapa

College of Horticulture Science and Engineering, Shandong Agricultural University, Tai’an 271000, China
*
Authors to whom correspondence should be addressed.
These authors contributed equally to this work.
Int. J. Mol. Sci. 2023, 24(17), 13597; https://doi.org/10.3390/ijms241713597
Submission received: 2 August 2023 / Revised: 29 August 2023 / Accepted: 1 September 2023 / Published: 2 September 2023

Abstract

:
The GLABROUS1 Enhancer Binding Protein (GeBP) gene family is pivotal in regulating plant growth, development, and stress responses. However, the role of GeBP in Brassica rapa remains unclear. This study identifies 20 BrGeBP genes distributed across 6 chromosomes, categorized into 4 subfamilies. Analysis of their promoter sequences reveals multiple stress-related elements, including those responding to drought, low temperature, methyl jasmonate (MeJA), and gibberellin (GA). Gene expression profiling demonstrates wide expression of BrGeBPs in callus, stem, silique, and flower tissues. Notably, BrGeBP5 expression significantly decreases under low-temperature treatment, while BrGeBP3 and BrGeBP14 show increased expression during drought stress, followed by a decrease. Protein interaction predictions suggest that BrGeBP14 homolog, At5g28040, can interact with DES1, a known stress-regulating protein. Additionally, microRNA172 targeting BrGeBP5 is upregulated under cold tolerance. These findings underscore the vital role of BrGeBPs in abiotic stress tolerance. Specifically, BrGeBP3, BrGeBP5, and BrGeBP14 show great potential for regulating abiotic stress. This study contributes to understanding the function of BrGeBPs and provides valuable insights for studying abiotic stress in B. rapa.

1. Introduction

GLABROUS1 Enhancer Binding Protein (GeBP) is a plant-specific DNA-binding protein initially discovered in Arabidopsis thaliana. GeBP and its homologs share two conserved regions: an unknown motif in the central region and a C-terminal hypothesized leucine zipper motif [1]. Both regions are crucial for downstream gene expression trans-activation.
At present, 16, 10, 10, 9, and 16 GeBP genes have been identified in Arabidopsis thaliana [1], Solanum lycopersicum [2], Mangifera indica L [3], Glycine max [4], and Bambusoideae [5], respectively. Previous studies highlight the importance of the GeBP gene family in plant growth and development. For instance, GeBP regulates trichome development through the expression control of the GLABROUS1 (GL1) gene [6]. In A. thaliana, GeBP also influences trichome elongation by modulating gibberellins and cytokinins in vivo [7]. Gilles Vachon et al. reported that GeBP/GPL redundantly contributes to the cytokinin hormone pathway. A mutant with triple loss-of-function of gebp gpl1 gpl2 reportedly displayed reduced responsiveness to exogenous cytokinin in some cytokinin responses, including senescence and growth. Additionally, the triple mutant showed notably elevated levels of type-A ARR cytokinin response genes, suggesting that GeBP may enhance negative feedback regulation, leading to cytokinin insensitivity [6].
Several studies have demonstrated the crucial role of GeBP in responding to environmental stresses. Ray reported its upregulation under drought stress, similar to B. napus, indicating GeBP’s key role in plant response to drought stress [8]. In studies on apples, overexpression of MdGeBP3 showed sensitivity to cytokinin, while its ectopic expression in A. thaliana reduced drought resistance [9]. Moreover, GeBP is vital in a plant’s ability to withstand the detrimental effects of heavy metals, like Cd, Cu, and Zn [10]. In response to adverse rhizosphere growth conditions, plants reorganize root architecture to avoid unfavorable areas. Recent studies have shown that GeBP-LIKE4 (GPL4) transcription factor is crucial in regulating root growth inhibition under heavy metal stress, particularly Cd stress. GPL4 is essential in the avoidance response to heavy metals, which occurs by regulating reactive oxygen species (ROS) concentration to inhibit root growth during heavy metal exposure. Notably, GPL4 also exhibits a similar response to excess Cu and Zn [10]. These findings emphasize the significance of GeBP and its associated transcription factors in mediating plant responses to heavy metal stress.
Brassica rapa, an important globally consumed vegetable in the Brassicaceae family, faces various stresses during growth. However, no studies have explored the GeBP transcription factor gene family in B. rapa. This study identifies the BrGeBP gene at the genome-wide level and analyzes its sequence characteristics, gene expression, regulatory mechanism, and epigenetics. The results provide insights for future studies on abiotic stresses of BrGeBP genes and offer genetic resources for biological breeding.

2. Results

2.1. Identification, Physicochemical Characterization of GeBP Family Genes

A total of 20 BrGeBP genes were identified from the B. rapa genome using the BLAST program with the AtGeBP gene sequence. These genes were renamed BrGeBP1–BrGeBP20 and divided into four subfamilies. The physicochemical properties of BrGeBPs are presented in Table 1. BrGeBP genes are distributed across 6 of the 10 chromosomes, with chromosome 4 having the highest number (6), followed by chromosome 1 (5), and chromosomes 6 and 9 with 2 genes each. Chromosome 5 has the least representation, with only one gene. The BrGeBP18–BrGeBP20 genes were found on the scaffold. Subcellular localization analysis revealed that all BrGeBPs are localized to the nucleus. Bioinformatics analysis of the 20 members showed varying amino acid lengths, molecular weights (MWs), and isoelectric points (pIs). The lengths of BrGeBP proteins range from 299 aa (BrGeBP10 and BrGeBP11) to 640 aa (BrGeBP9), molecular weights range from 33 kDa (BrGeBP10) to 73 kDa (BrGeBP9), and isoelectric point (pI) ranged from 4.56 (BrGeBP7) to 8.98 (BrGeBP9).

2.2. Phylogenetic Relationships

Phylogenetic analysis of BrGeBP proteins, along with A. thaliana and O. sativa, was carried out using the maximum likelihood method (Figure 1). The 51 GeBPs were clustered into 4 major groups (I, II, III, IV). The results from the evolutionary relationship showed that Group I was the largest, comprising 28 members, including B. rapa (6), A. thaliana (6), and all OsGeBPs. Group II comprised 13 members: B. rapa (7) and A. thaliana (6). Group III had four GeBP members: B. rapa (3) and A. thaliana (1). Group IV contained five members: B. rapa (3) and A. thaliana (2). Thus, BrGeBPs exhibited a closer relationship with A. thaliana than O. sativa.

2.3. Gene Structure and Conserved Motif Analysis

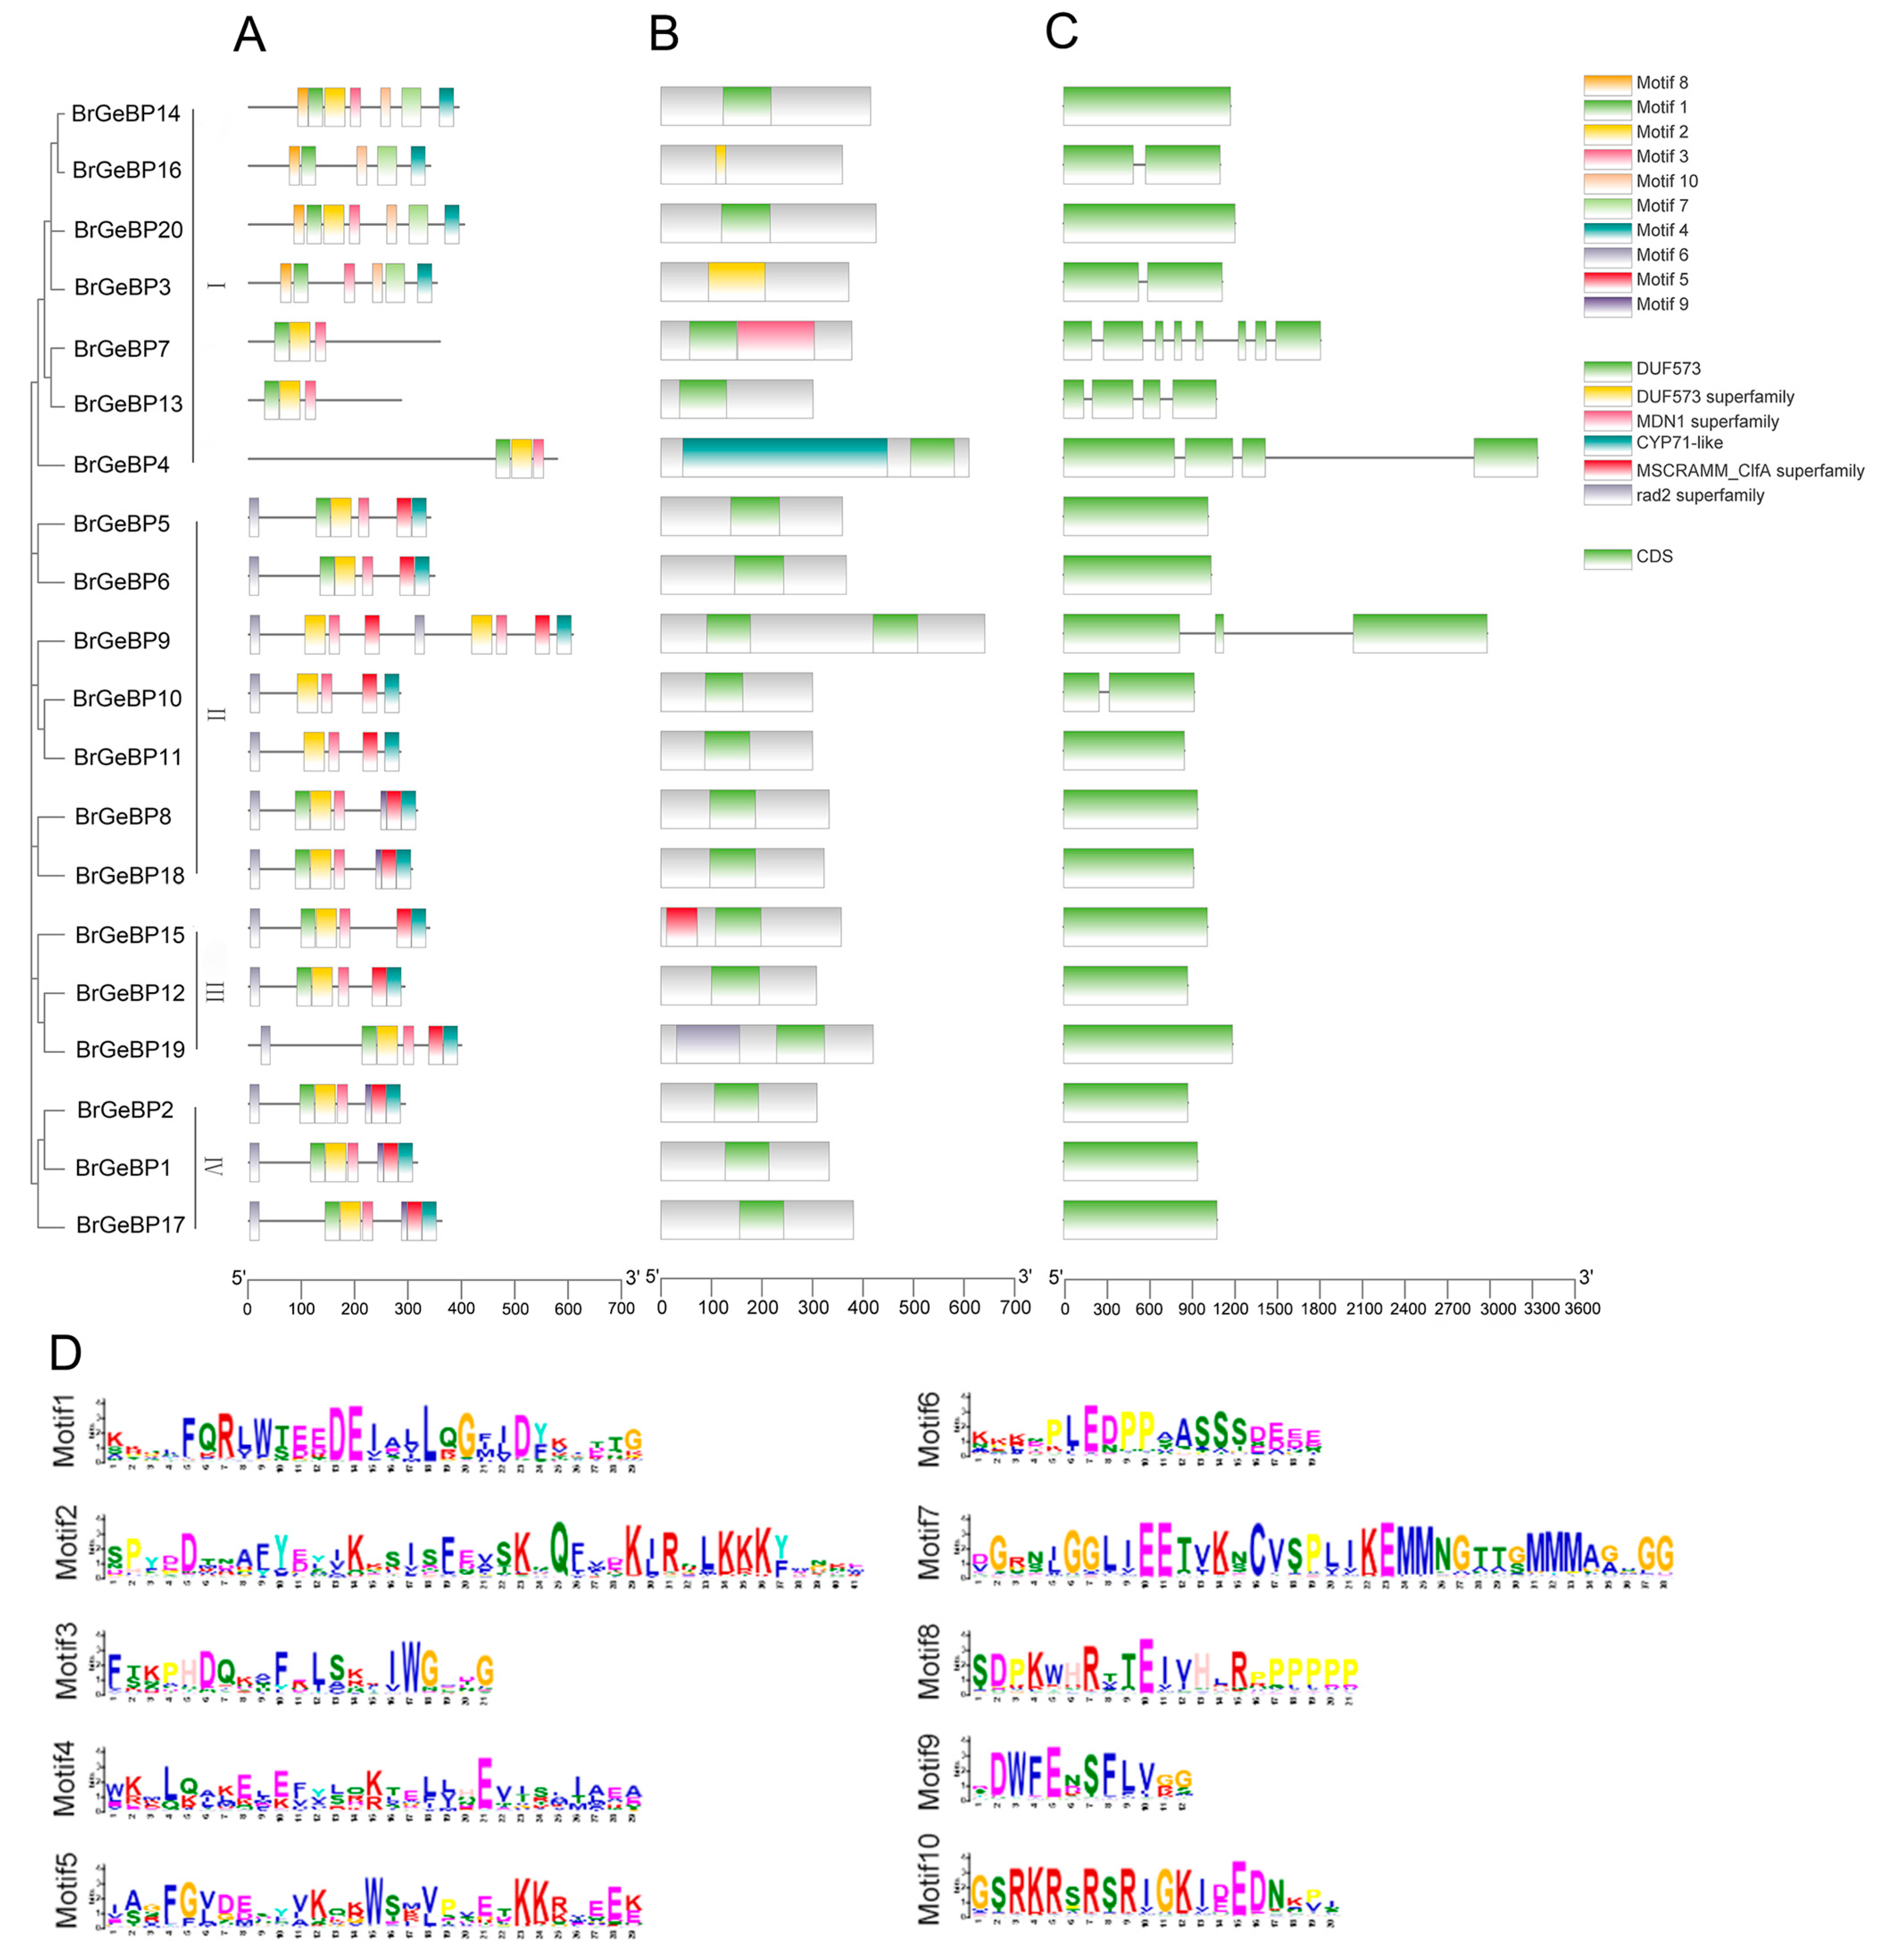
The phylogenetic relationship of 20 BrGeBP genes was constructed using MEGA-X, resulting in four subgroups based on their similarity levels. BrGeBP proteins exhibited three to nine presumed conserved motifs (Figure 2A), with all four subgroups showing similar motif organization and composition. Notably, BrGeBP4, BrGeBP7, and BrGeBP13 had three motifs, while BrGeBP9 had nine motifs. Motifs 1, 2, 3, and 4 were widely present in all BrGeBPs, indicating their conserved nature and potential importance in target gene regulation [11].
Functional domain prediction revealed that the four conserved motifs were situated within the DUF573 domain. Among the BrGeBPs, 14 possessed or exclusively had the DUF573 domain, making it the core domain of the GeBP family (Figure 2B).
The exon–intron configurations of BrGeBPs genes were examined to gain insights into the structural evolution of BrGeBP genes (Figure 2C). The results revealed 20 BrGeBP genes, with exon numbers ranging from 1 to 8. Among them, 13 had no introns, and BrGeBP7 gene had 7 introns. Genes with similar structures were found clustered together.

2.4. Analysis of Promoter Cis-Elements of BrGeBPs

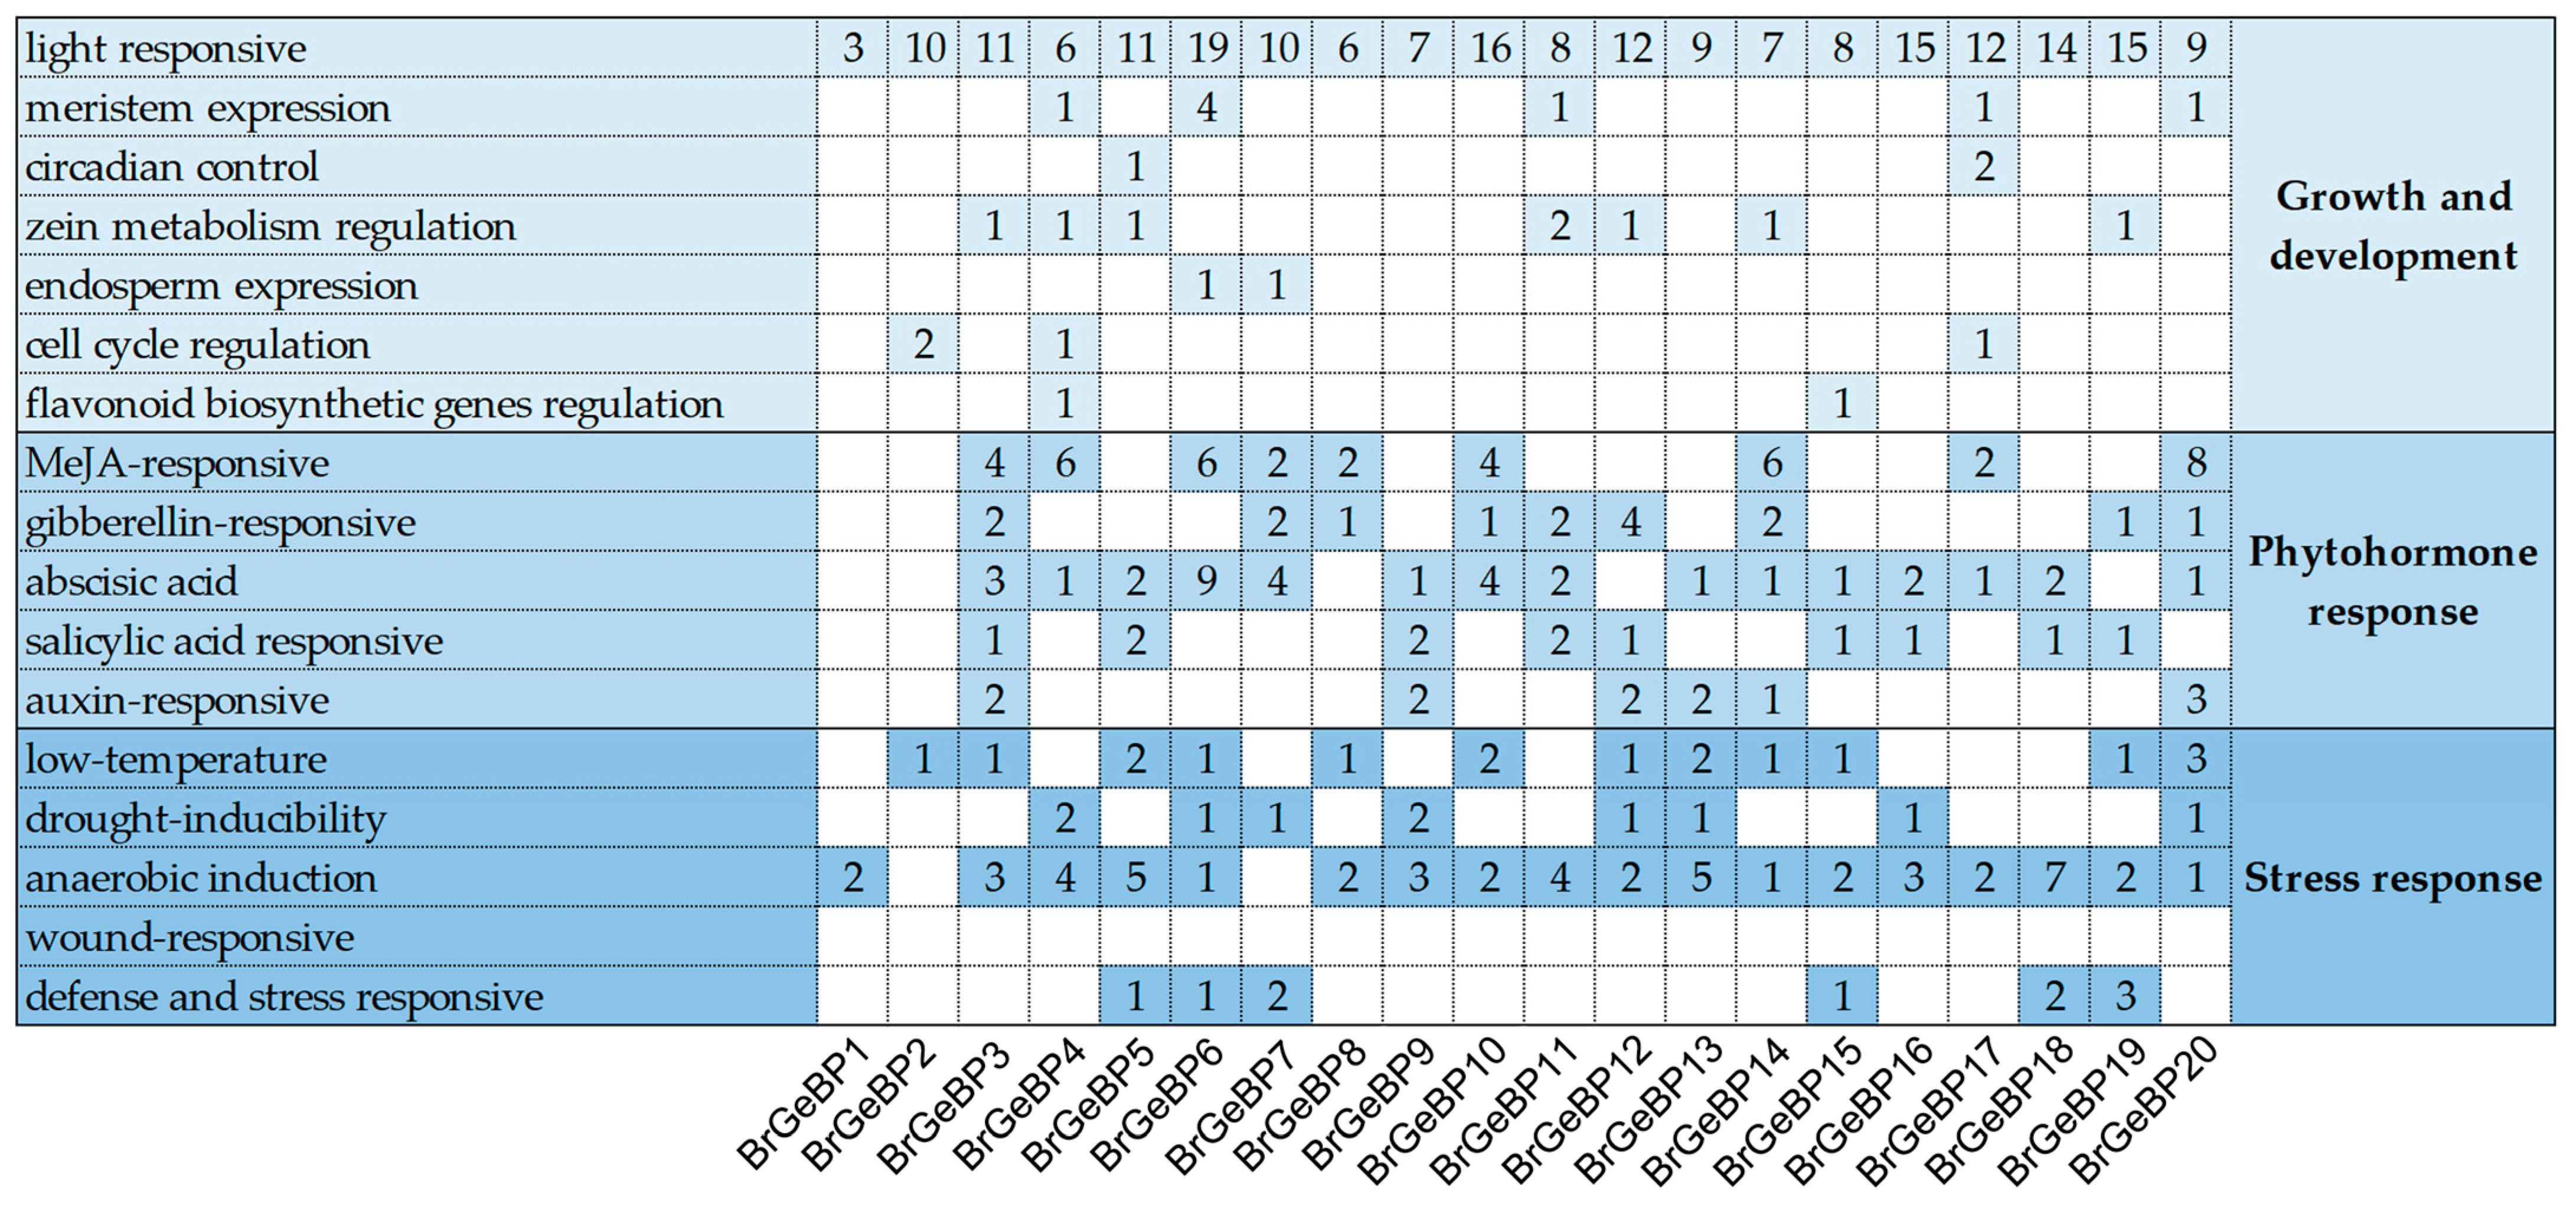
Promoters are crucial sequence elements in genes, initiating gene transcription. To explore the possible regulation mode of the GeBP genes, we analyzed the 2 kb upstream region of BrGeBP coding sequences for cis-elements prediction using PlantCARE (Figure 3). Light-responsive elements were the most abundant, averaging 10.4 elements per gene, significantly higher than other elements. BrGeBP6 had the highest number, with 19 light-responsive elements. Except for BrGeBP2 and BrGeBP7, all members contained anaerobic induction regulatory elements. Most genes contained various plant hormone response elements, with 75% having abscisic acid response elements and 45% containing MeJA-, salicylic acid-, and gibberellin-responsive elements. Additionally, ~60% of the genes had low-temperature response elements, indicating their potential roles in abiotic stress and hormonal responses. These promoter sequences also revealed other response elements, indicating functional diversity in the GeBP gene family.

2.5. Gene Expression Analysis of the BrGeBPs

2.5.1. Analysis of Tissue-Specific Expression of BrGeBPs

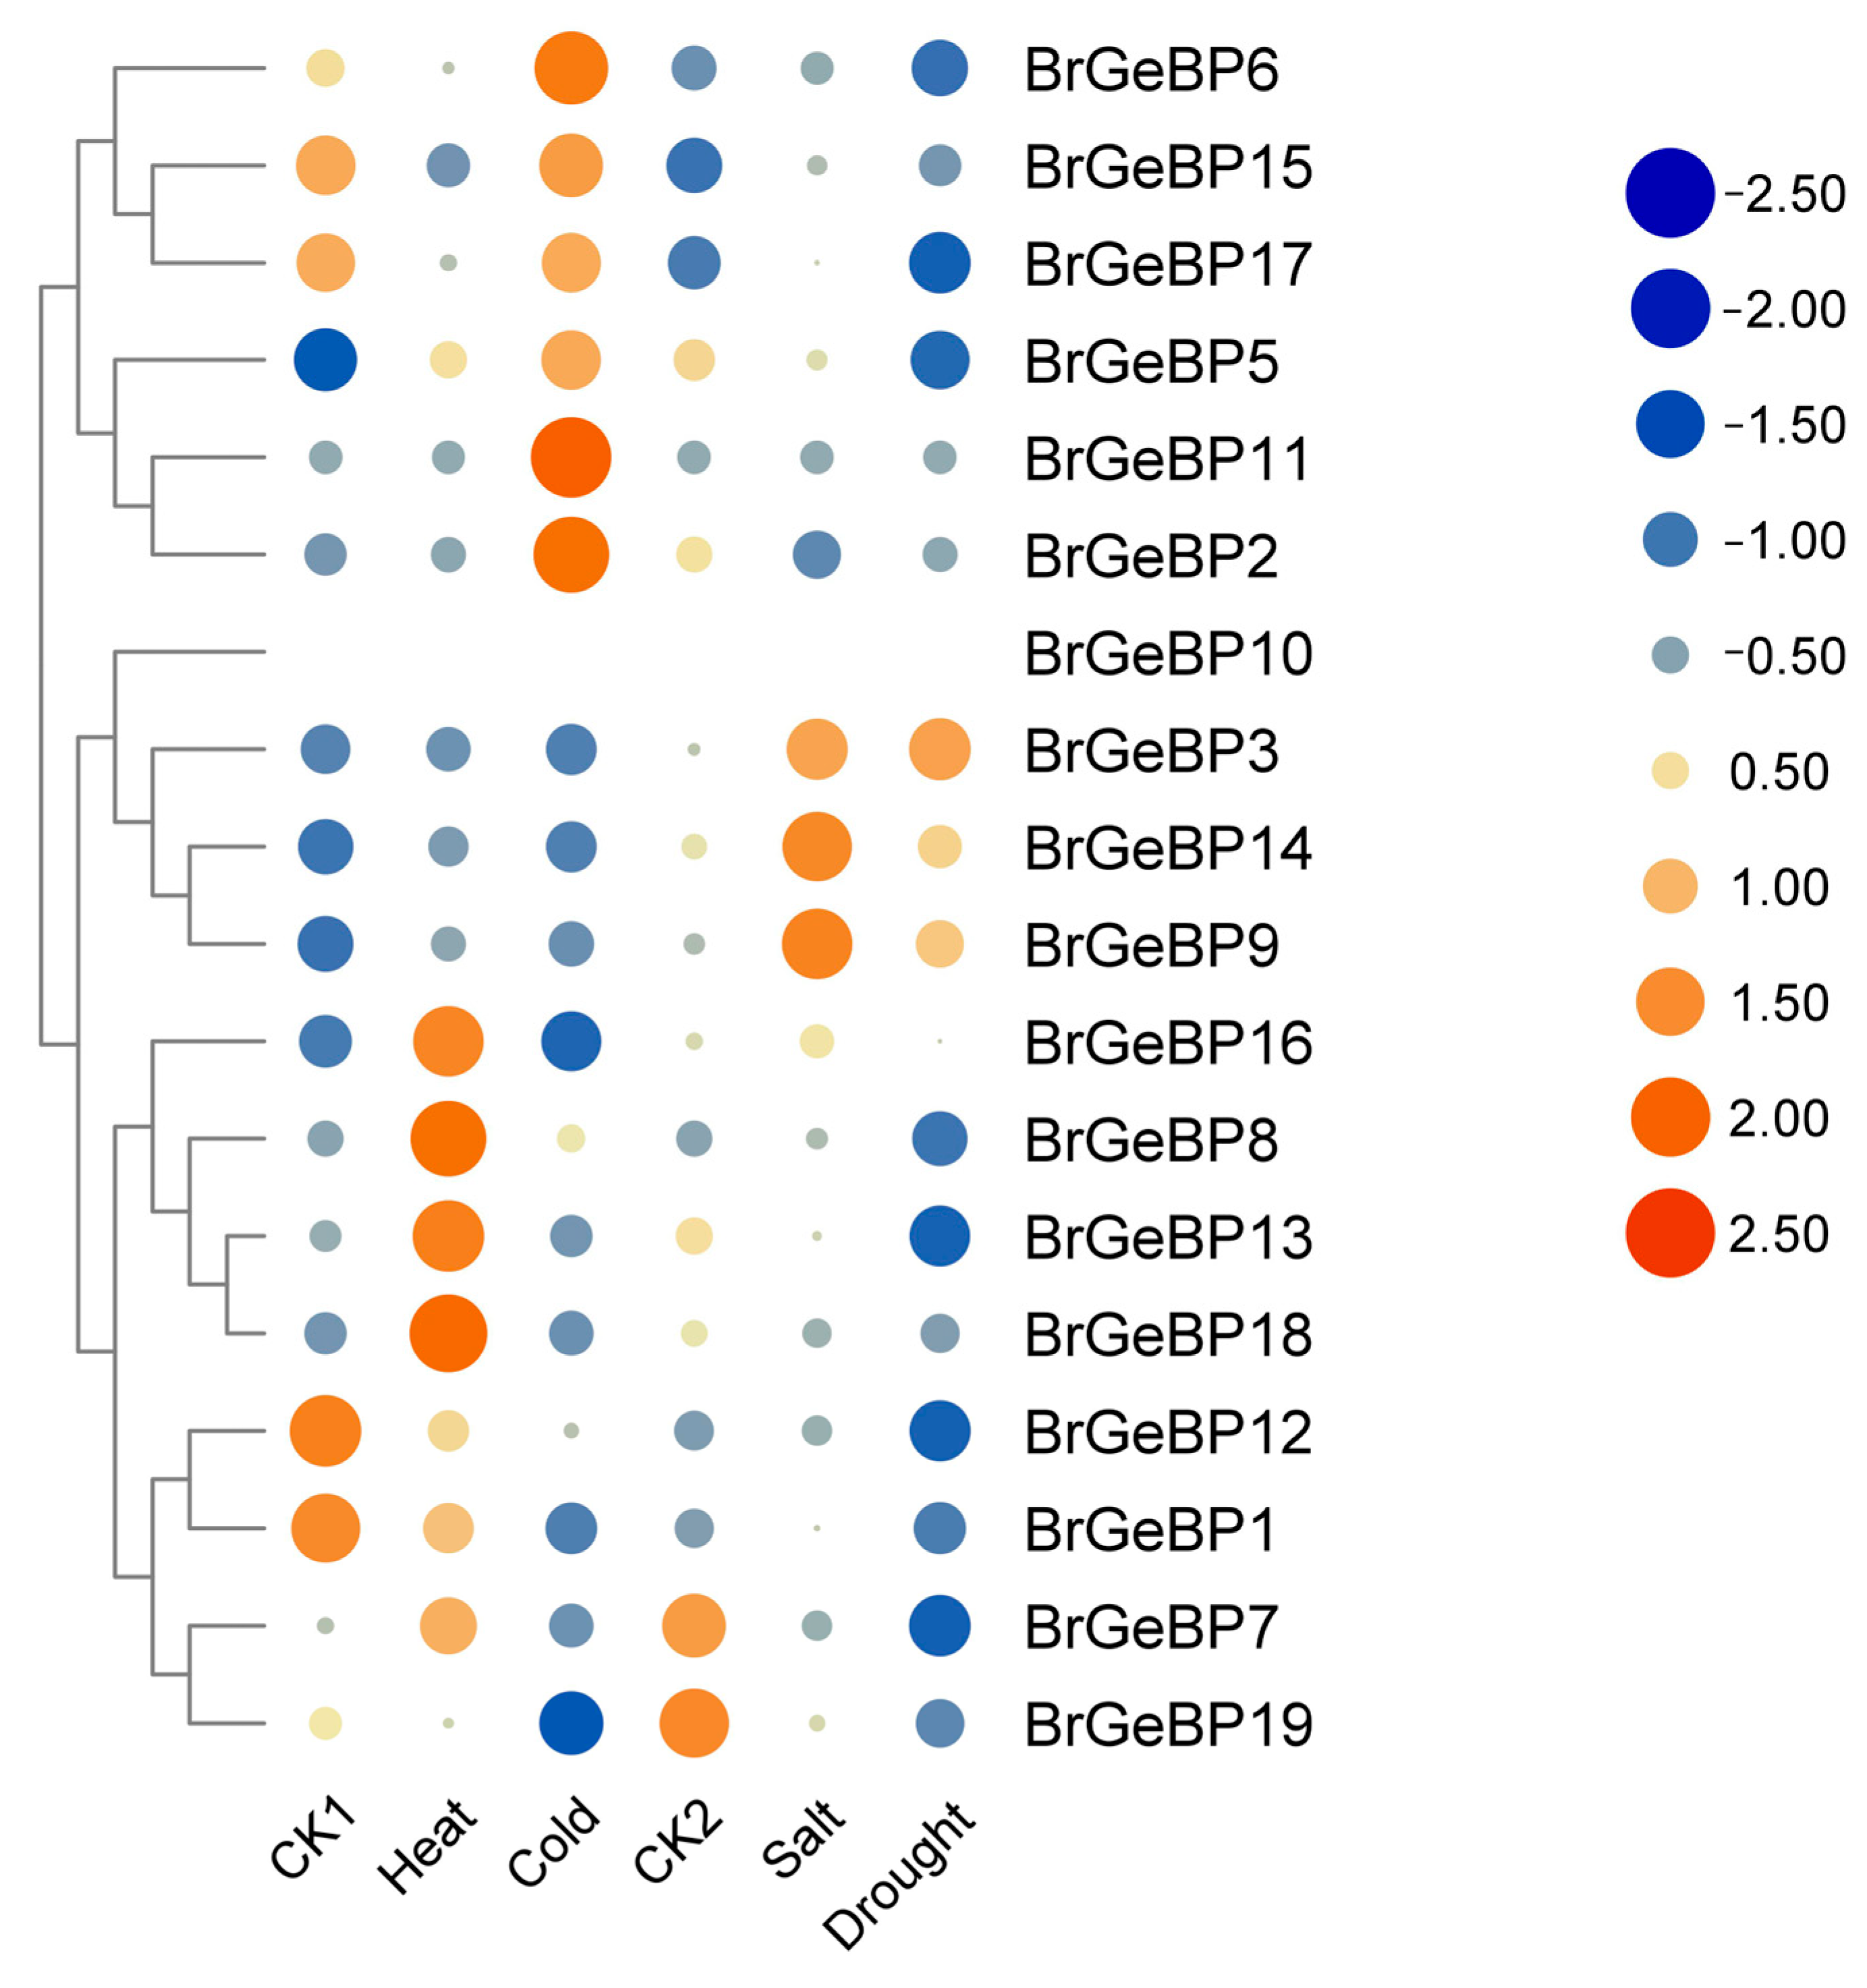
The expression patterns of BrGeBPs in six organs and tissues (callus, flower, leaf, root, silique, and stem) were investigated based on public transcriptome data (Figure 4; Supplementary Table S1). Out of the 18 BrGeBP genes, all except BrGeBP4 and BrGeBP10 were expressed in at least 5 examined organs and tissues. Furthermore, tissue-specific expression was observed for some genes. For instance, BrGeBP16 showed significantly higher transcript abundances in the callus, indicating its involvement in callus differentiation. BrGeBP1 and BrGeBP12 exhibited high expression in the silique, suggesting their critical role in fruit development. BrGeBP3, BrGeBP6, BrGeBP8, and BrGeBP20 showed peak transcript levels in stems, indicating their roles in organ development and growth. BrGeBP7 and BrGeBP9 were highly expressed in flowers, indicating their importance in flower development. Notably, BrGeBP12 was exclusively expressed in the silique, while BrGeBP3 had a 12-fold higher expression in stems than in roots. Conversely, some genes, particularly BrGeBP4 and BrGeBP10, showed no expression in any organ and tissue. These findings imply that BrGeBPs may be important during organogenesis, fruit development, and sexual reproduction.

2.5.2. Expression Patterns in Response to Abiotic Stress Analysis

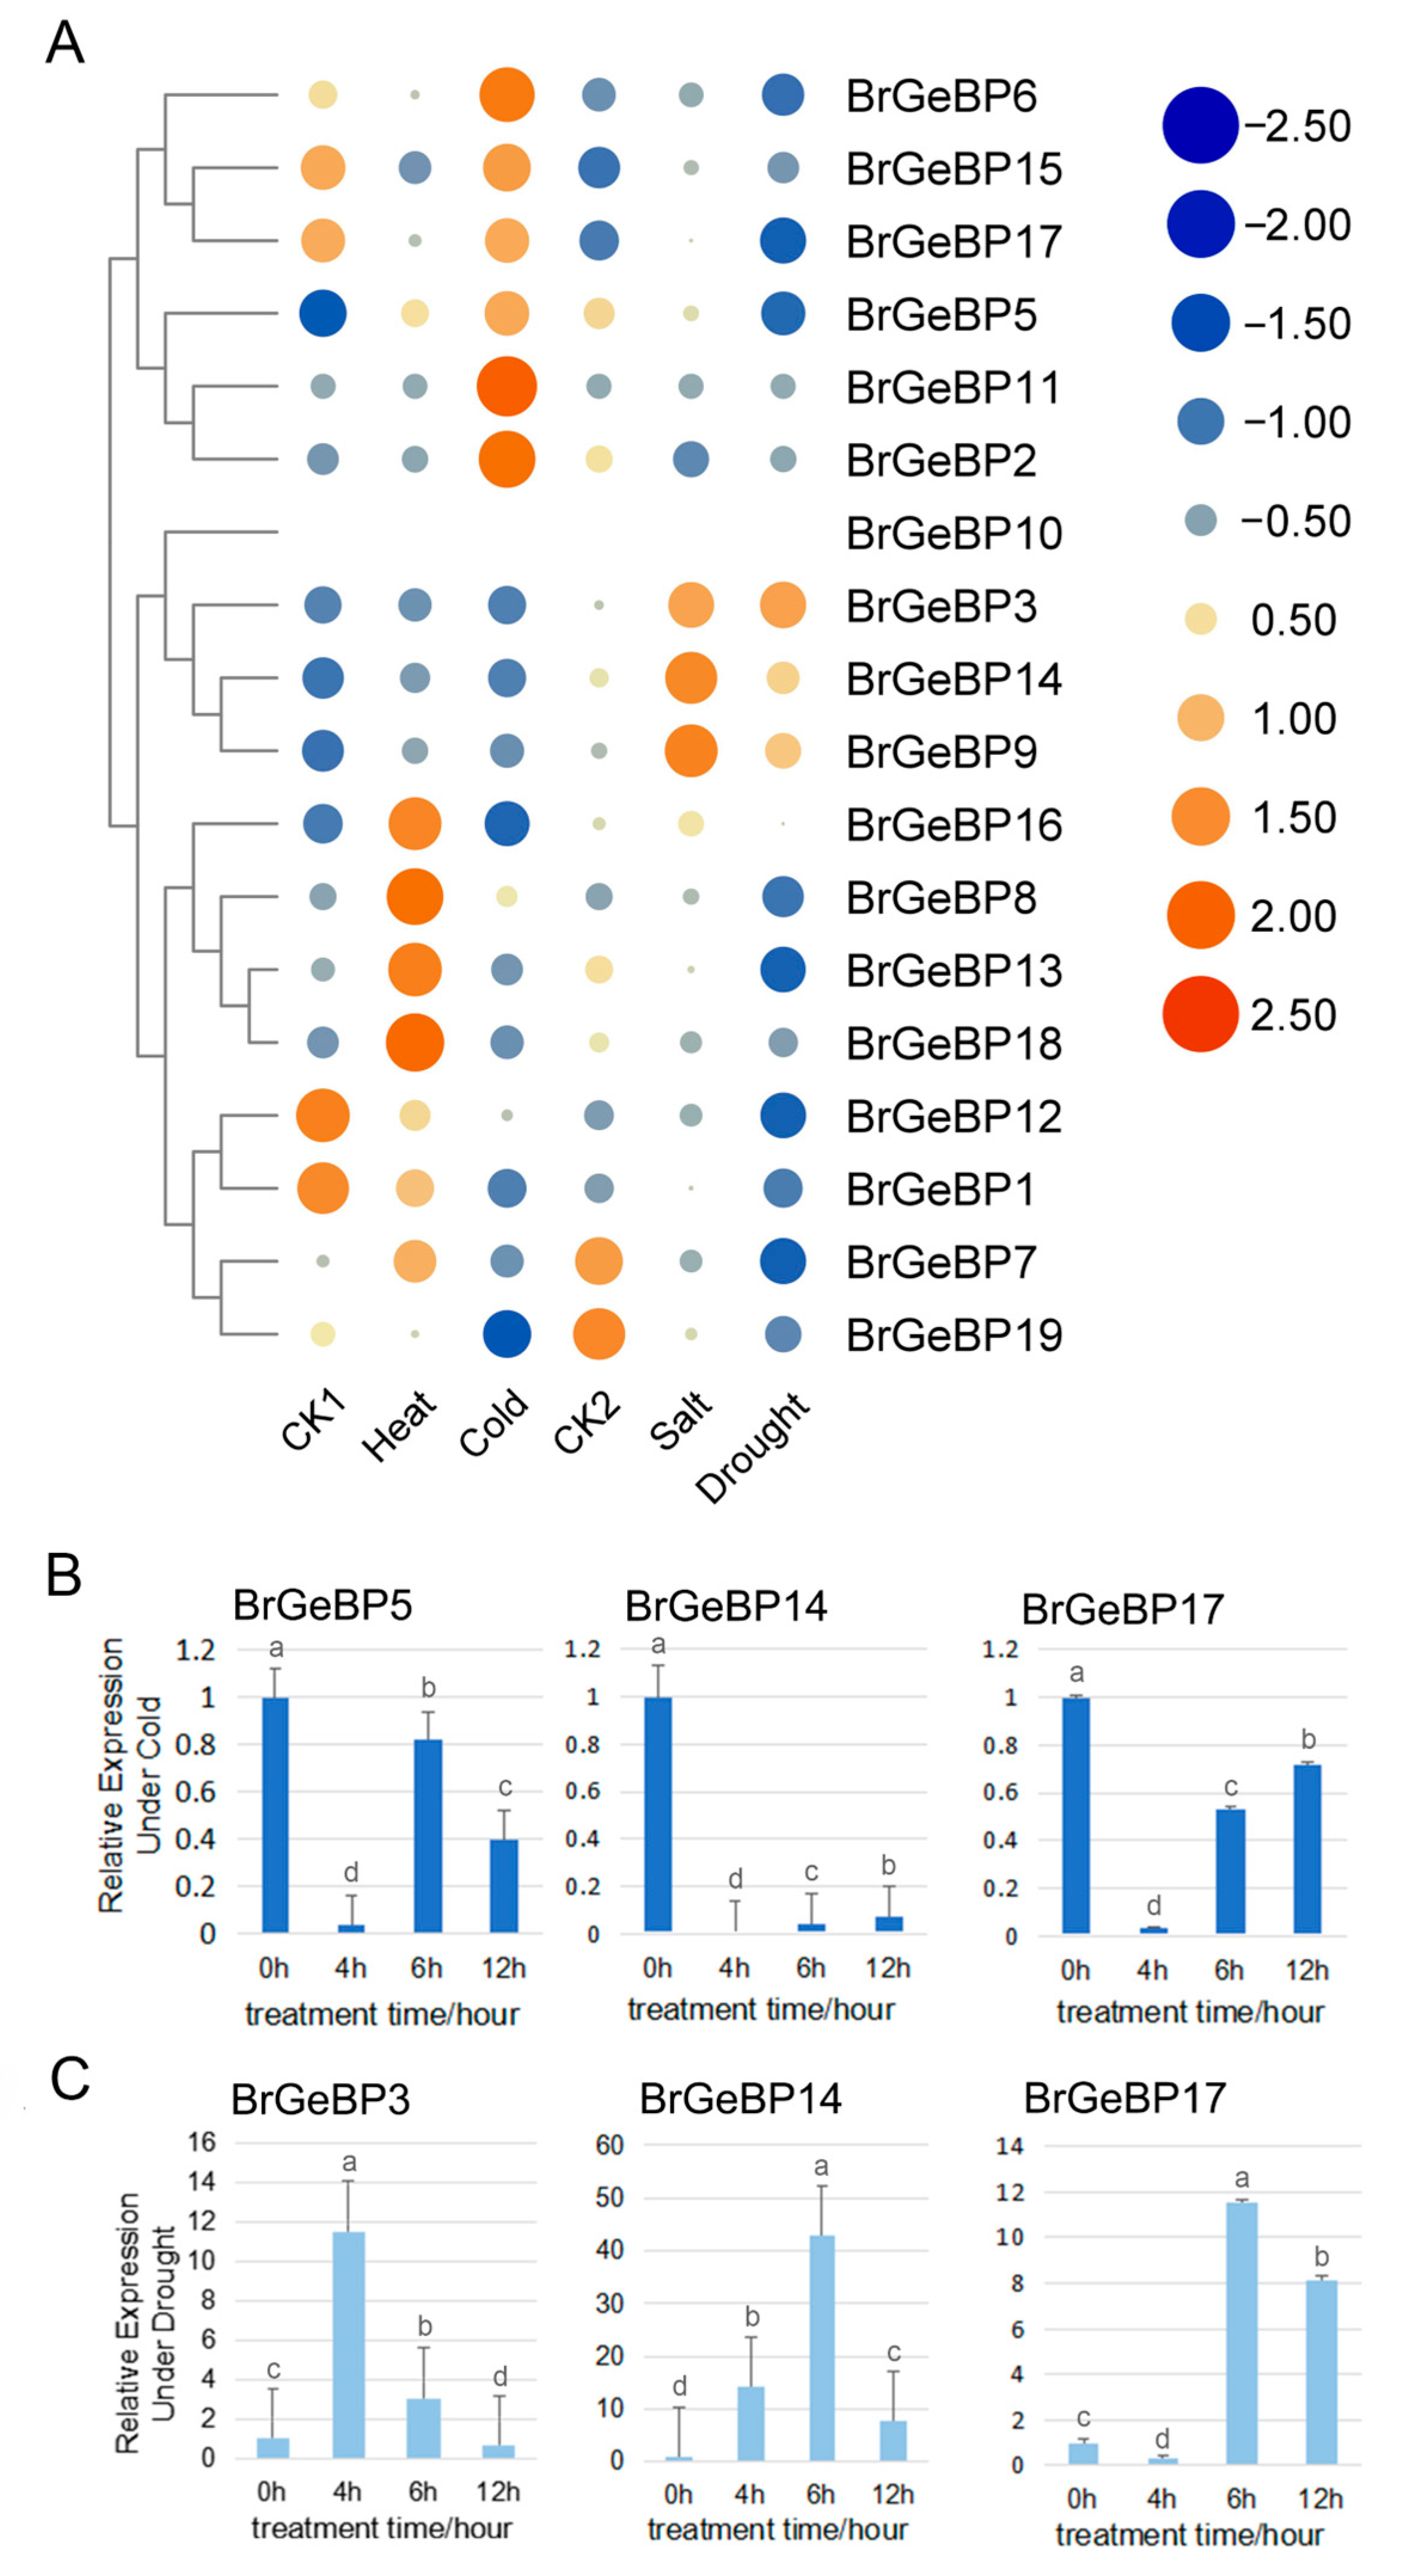
B. rapa, a winter storage crop, experiences both cold and drought stress. To assess this gene family’s role in stress response, we analyzed their gene expression profiles post-stress (Figure 5A–C; Supplementary Table S2). BrGeBP5 and BrGeBP17 showed higher expression under cold stress, while BrGeBP3 and BrGeBP14 exhibited higher expression under drought stress. We also examined lowly expressed genes in the transcriptome as they may play important roles in specific developmental stages, including BrGeBP14, and BrGeBP17 for cold and drought stress treatments, respectively. The qRT-PCR-mediated functional validation of the key genes screened from the transcriptome confirmed that BrGeBP5, BrGeBP14, and BrGeBP17 were significantly downregulated after cold treatment. Conversely, under drought stress (Figure 5C), BrGeBP3 and BrGeBP14 showed higher expression levels than the control, peaking at 4 h and 6 h, respectively.

2.6. Prediction of Protein–Protein Interaction

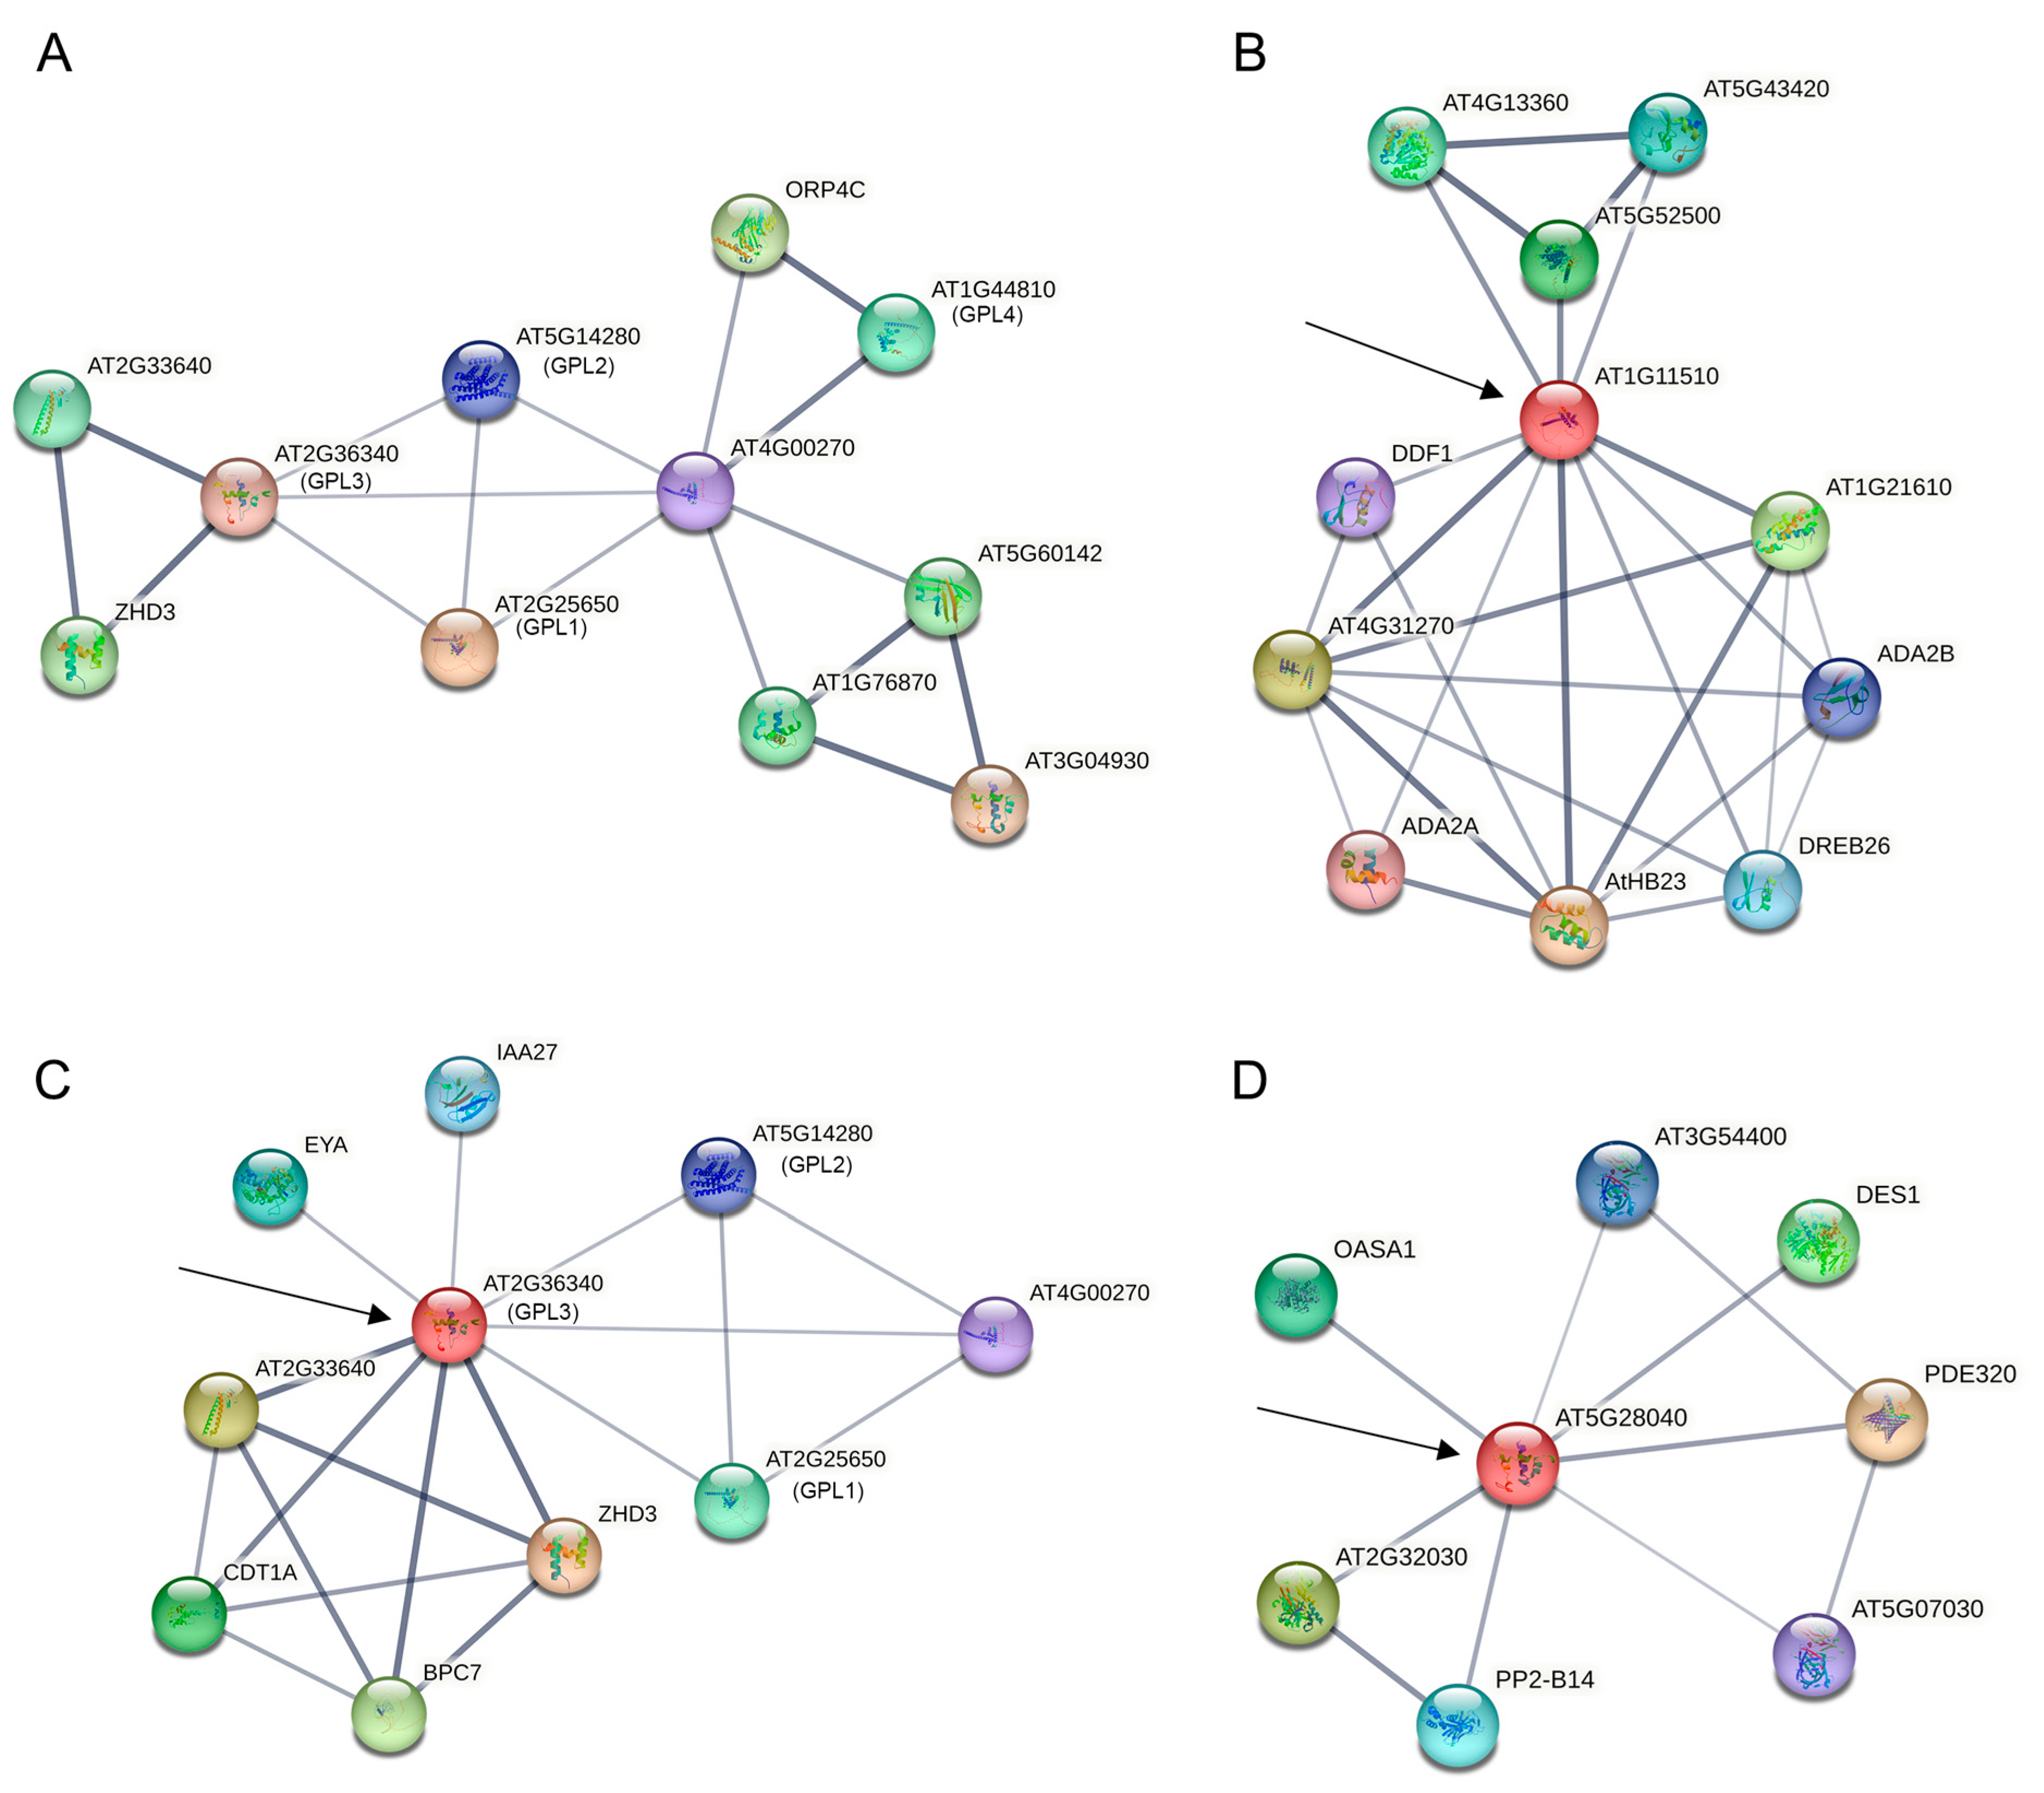
Proteins are pivotal in various cellular functions, interacting physically with molecules, like lipids, nucleic acids, and metabolites. Given the close evolutionary relationship between B. rapa and A. thaliana, we can predict the function of corresponding homologous genes in B. rapa through protein–protein interaction (PPI) analysis of the GeBP genes in A. thaliana. This study utilized the STRING database’s resources and algorithms to construct a predicted protein interaction network map for AtGeBPs (Figure 6A; Supplementary Table S3). STRING results identified significant partners of the AtGeBP gene, including At2g25650 (GPL1) and At2g36340 (GPL3). These genes interact with CPR5 and counteract its active role in cell expansion, thereby suppressing CPR5 in this process. The CPR5–GeBP interaction is crucial for plant bacterial resistance [12]. Additionally, we observed an interaction between At1g11510 (homologous to BrGeBP10, BrGeBP12, and BrGeBP15) and DREB26 (At1g21910), a transcriptional activator involved in plant development and abiotic stress tolerance. DREB26 was found to participate in salt and osmotic stress response pathways [13] (Figure 6B). Furthermore, At2g36340 (homologous to BrGeBP7) interacts with IAA27 (Figure 6C), a key regulator in various aspects of plant growth and development. Silencing IAA27 significantly affects the root system, leaf physiology, reproductive organs, and fruit quality [14]. Additionally, At5g28040 (homologous to BrGeBP3, BrGeBP14, and BrGeBP16) interacts with DES1 and OASA1 (Figure 6D). DES1 is an essential enzyme involved in hydrogen sulfide (H2S) production, and ABA induction leads to sulfhydrylation modification of DES1 and H2S production, thus, promoting stomatal closure and conferring extreme temperature tolerance [15]. The ABA-regulated OASA1 gene is induced in leaves, stems, and roots under high salt and heavy metal stress.

2.7. Prediction of microRNAs Targeting BrGeBPs

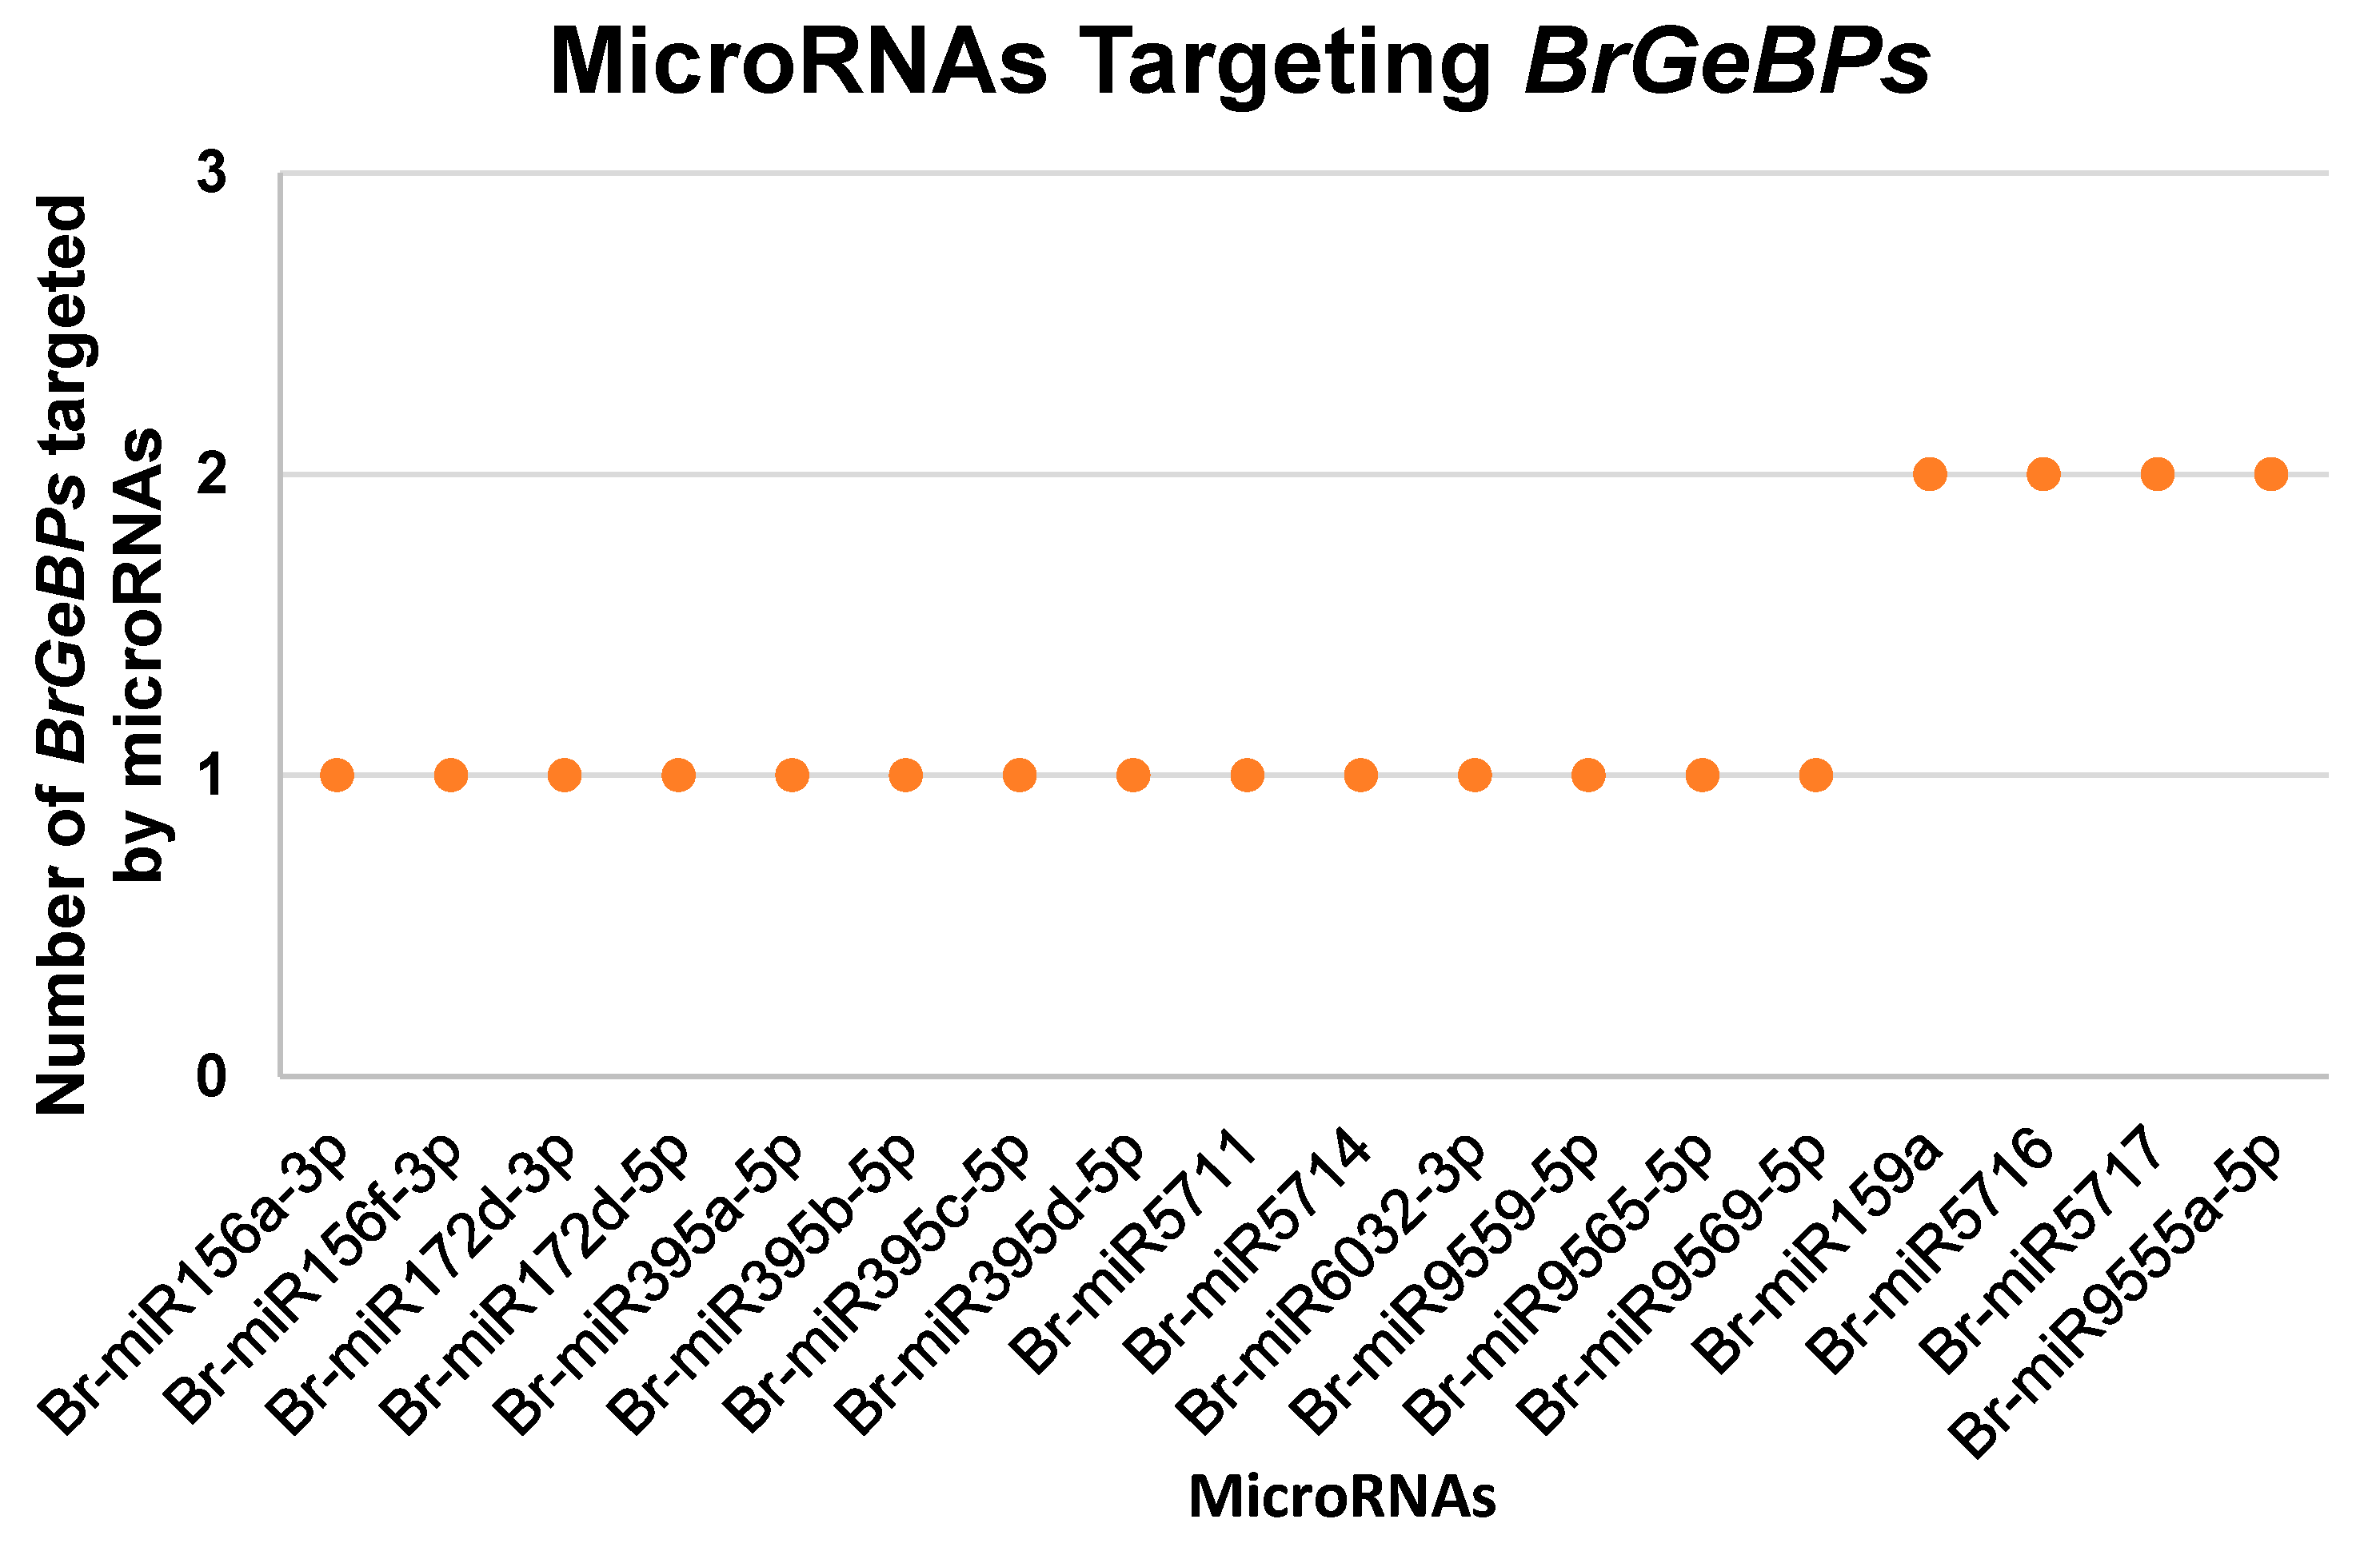
MicroRNAs are critical in post-transcriptional gene expression regulation, particularly in plant stress responses. To enhance our understanding of BrGeBP genes, we investigated microRNAs associated with these genes (Figure 7; Supplementary Table S4). Table 2 presents details of BrGeBPs and their respective targeted microRNAs. Eighteen microRNA types were identified to regulate BrGeBPs, such as Br-miR156a-3p, Br-miR156f-3p, Br-miR172d-3p, Br-miR172d-5p, Br-miR395a-5p, Br-miR395b-5p, Br-miR395c-5p, Br-miR395d-5p, Br-miR5711, Br-miR5714, Br-miR6032-3p, Br-miR9559-5p, Br-miR9565-5p, and Br-miR9569-5p, each targeting a single BrGeBP gene. Additionally, Br-miR159a, Br-miR5716, Br-miR5717, and Br-miR9555a-5p targeted two different BrGeBP genes. Notably, more microRNAs were found targeting a single BrGeBP gene than those targeting two genes. Among them, BrGeBP4 emerged as the most targeted gene by microRNAs.

3. Discussion

Plants respond to biotic or abiotic pressures by regulating physiological and biochemical reactions, altering transcription factor expression to enhance stress resistance [1]. Prior research highlights GeBP transcription factors’ pivotal roles in plant growth, development, leaf senescence, and abiotic stress [3,10,16,17]. However, GeBP genes’ functional and family analysis in B. rapa remains unexplored. Here, we used bioinformatics to investigate BrGeBP gene family characteristics, gene expression, regulatory mechanisms, and epigenetics, facilitating future BrGeBP gene family functional studies.
This study identified 20 B. rapa GeBP gene family members. Based on phylogenetic relationships and sequence similarities, BrGeBP was classified into four groups. Interestingly, B. rapa, A. thaliana, and O. sativa belonged to different groups, indicating distant relations between B. rapa and O. sativa. Conversely, A. thaliana and B. rapa grouped together, suggesting they shared similar physiological functions for their GeBP genes. Motif designs were also similar within the groups, implying a potential role of BrGeBP7 and BrGeBP13 in regulating B. rapa trichome cell elongation.
Post-transcriptional gene regulation involves miRNAs, which are single-stranded non-coding microRNAs [18,19]. Br-miR395a-5p, Br-miR395b-5p, Br-miR395c-5p, Br-miR395d-5p, and Br-miR5717 were found to target BrGeBP4 of the GeBP gene family. These microRNAs work together to regulate the expression of BrGeBP4, which is crucial for precisely controlling plant growth and development [1]. They may target different sites on the gene to achieve distinct regulatory effects. Studies show that miR395’s targeting of growth-regulating factor (GRF) transcription factors and the Sulfate transporter 4;1 (SULTR4;1) gene in A. thaliana regulates sulfur (S) uptake and distribution [20]. This suggests that miR395’s regulation of BrGeBP4 might influence S metabolism and stress response in B. rapa. Notably, we identified a novel microRNA, Br-miR5717, targeting BrGeBP4. To our knowledge, this is the first report of miR5717 targeting a GeBP family transcription factor. Thus, miR5717 may play a unique role in regulating GeBP-mediated gene expression in B. rapa. Altogether, the concurrent targeting of a GeBP family member by these five microRNAs achieves greater intricate and precise gene regulation, optimizing the function of the gene family member in B. rapa growth and development.
BrGeBP5 shows a high potential for regulating low-temperature stress (Figure 5A). Transcriptome analysis confirmed the upregulation of BrGeBP5 expression under low-temperature treatment, further validated using qRT-PCR. Promoter element analysis showed the presence of low-temperature corresponding elements, abscisic acid, and salicylic acid-responsive elements in BrGeBP5. Previous investigations have found salicylic acid to be effective in enhancing the growth of watermelon and citrus plants and cold tolerance in maize, potato, rice, and other plants under cold stress [21,22,23,24]. Additionally, low-temperature stress induces ABA production, which plays a vital role in enhancing plant stress resistance by promoting the activity of the antioxidant defense system and preventing oxidative stress [25]. Additionally, the prediction of target genes suggests that both Br-miR172d-5p and Br-miR5714 target BrGeBP5. Studies on the A. thaliana miR172 have demonstrated its responsiveness to changes in environmental temperature, with low temperatures increasing miR172d expression, consequently reducing the plant’s low-temperature sensitivity [26].
BrGeBP3 and BrGeBP14 potentially respond to drought stress in B. rapa. Transcriptomic analysis showed upregulation of both genes under drought treatment. qRT-PCR results indicated peak expression at four and six hours post-stress, respectively, before declining. Promoter analysis revealed MeJA, gibberellin, abscisic acid, and auxin-responsive elements in both genes. Drought conditions prompt plants to reduce transpiration and avoid dehydration through certain mechanisms, like stomatal closure and canopy growth inhibition. Tomato studies have indicated that drought induction leads to GA inactivation, which causes early stomata closure during soil dehydration and inhibits leaf GA synthesis, thus, limiting the transpiration area [27]. Drought stress increases ABA content, leading to stomatal closure for water loss reduction, with ABA signaling being a core drought stress signaling pathway in plants [28]. Exogenous IAA improves drought tolerance in white clover [29]. BrGeBP3 also contains a salicylic acid-responsive element. These findings provide important evidence for the role of GA, ABA, and IAA in drought stress adaptation. Protein interaction studies have shown that At5g28040 (a homolog of BrGeBP3 and BrGeBP14) interacts with DES1. H2S peroxidizes DES1 and promotes H2S production, which mediates peroxidative sulfation of OST1/SnRK2.6, which positively regulates ABA signaling and accelerates stomatal closure [30]. Additionally, drought-induced hormones (ABA, SA, MeJA, and ethylene) and ROS signaling vary among plant species, which promote H2S accumulation in guard cells, consequently initiating downstream signaling for stomatal closure and finally enhancing plant drought stress resistance [31].

4. Materials and Methods

4.1. Identification and Physicochemical Characterization of GeBP Family Genes

A. thaliana genome data were downloaded from TAIR and BRAD, and candidate B. rapa GeBP family members were searched by two-way BLAST in the B. rapa genome. This was followed by further identification of candidate genes using conserved domain analysis. The TBtools and Expasy (https://www.expasy.org/, accessed on 4 November 2022) software were used to analyze the molecular weight (MW), isoelectric point (pI), and other physicochemical properties of the GeBP family proteins in B. rapa [32,33].

4.2. Phylogenetic Relationships and Synteny Analysis

The gff3 file was downloaded from the B. rapa database, with the GeBP gene distribution on chromosomes being plotted using the TBtools software (v1.120). The phylogenetic trees of GeBP families in B. rapa, O. sativa, and A. thaliana were constructed by maximum likelihood estimation (MLE) using the MEGA-X software (v10.0.1) [34]. The phylogenetic tree was improved using iTOL (https://itol.embl.de/, accessed on 3 January 2023) to more clearly present the inter-species relationships [35].

4.3. Gene Structure and Analysis of Conserved Motif and Cis-Elements

The gene structure of BrGeBP was visualized using the TBtools Visual Gene Structure (basic) program. Its conserved motifs were analyzed using the MEME 5.4.1 online program (https://meme-suite.org/meme/tools/meme, accessed on 14 January 2023) [36]. The B. rapa GeBP was obtained through EnsemblPlants Family genes initiation codon 2000 bp upstream sequence, with the sequence analysis performed using the PlantCARE online website (http://bioinformatics.psb.ugent.be/webtools/plantcare/html/, accessed on 14 January 2023) [37,38].

4.4. Gene Expression Analysis

The transcriptome sequences of B. rapa of different tissues from NCBI GEO (https://www.ncbi.nlm.nih.gov/geo/, accessed on 11 November 2022) with the accession number GSE43245 were downloaded, and the data were normalized using the transcripts per million (TPM) method. The transcriptome sequences of A. thaliana under various abiotic stress treatments were downloaded, as shown in Table S1. Gene expression profile heatmaps were prepared using TBtools (v1.120) [32].

4.5. Plant Material and Stress Treatments

B. rapa with stable self-incompatibility was utilized for the stress treatments. The plump seeds were seeded in MS modified medium (with vitamins, sucrose, and agar) and cultivated in a plant incubator. Seedlings with six leaves and similar growth status were selected for the stress treatments. The seedlings were placed in a hydroponic system with 150 mM NaCl to simulate salt stress and in 15% PEG6000 to simulate drought conditions. The plants were exposed to 4 °C for the cold stress treatment. We used unstressed B. rapa seedlings with the same growth period and under the same growth conditions as a control (CK). The duration of all stress treatments was 4, 6, and 12 h. Three biological replicates were run for each treatment group, and the samples were stored at −80 °C.

4.6. Total RNA Extraction and qRT-PCR

Total RNA was extracted using the SteadyPure Plant RNA Extraction Kit (Accurate Biotechnology, Hunan, China). These were then reverse-transcribed using the TransScript® Uni All-in-One First-Strand cDNA Synthesis SuperMix for qPCR (TransGen, AU341-02, Beijing, China) for subsequent qRT-PCR analysis. The qRT-PCR reaction was performed on a qTOWER3 qPCR machine using the ChamQ SYBR qPCR Master Mix (Q711-03, Vazyme, Nanjing, China). The BrActin2 was used as the internal reference gene, while relative expression level analysis of each gene was conducted using the 2−ΔΔCT method. The gene-specific primer sequences are listed in Supplementary Table S5.

4.7. Statistical Analysis

The analysis of significant differences (a, b, c, d) was conducted using the single-factor ANOVA test on IBM SPSS Statistics 25 to compare the obtained means (with a = 0.05).

4.8. Prediction of Protein–Protein Interaction

For protein–protein interaction network analysis, predictions were made on the protein–protein interaction network prediction website (http://cn.string-db.org, accessed on 6 June 2023), where B. rapa was selected as the organism to obtain a protein–protein interaction map (minimum required interaction score = 0.400, using default settings for other parameters) [39].

4.9. Prediction of microRNAs Targeting BrGeBPs Genes

CDS sequences of BrGeBP were used to determine the interaction of genes with microRNAs using the psRNATarget database (http://plantgrn.noble.org/psRNATarget, accessed on 14 January 2023), and drawing was accomplished by using Excel.

5. Conclusions

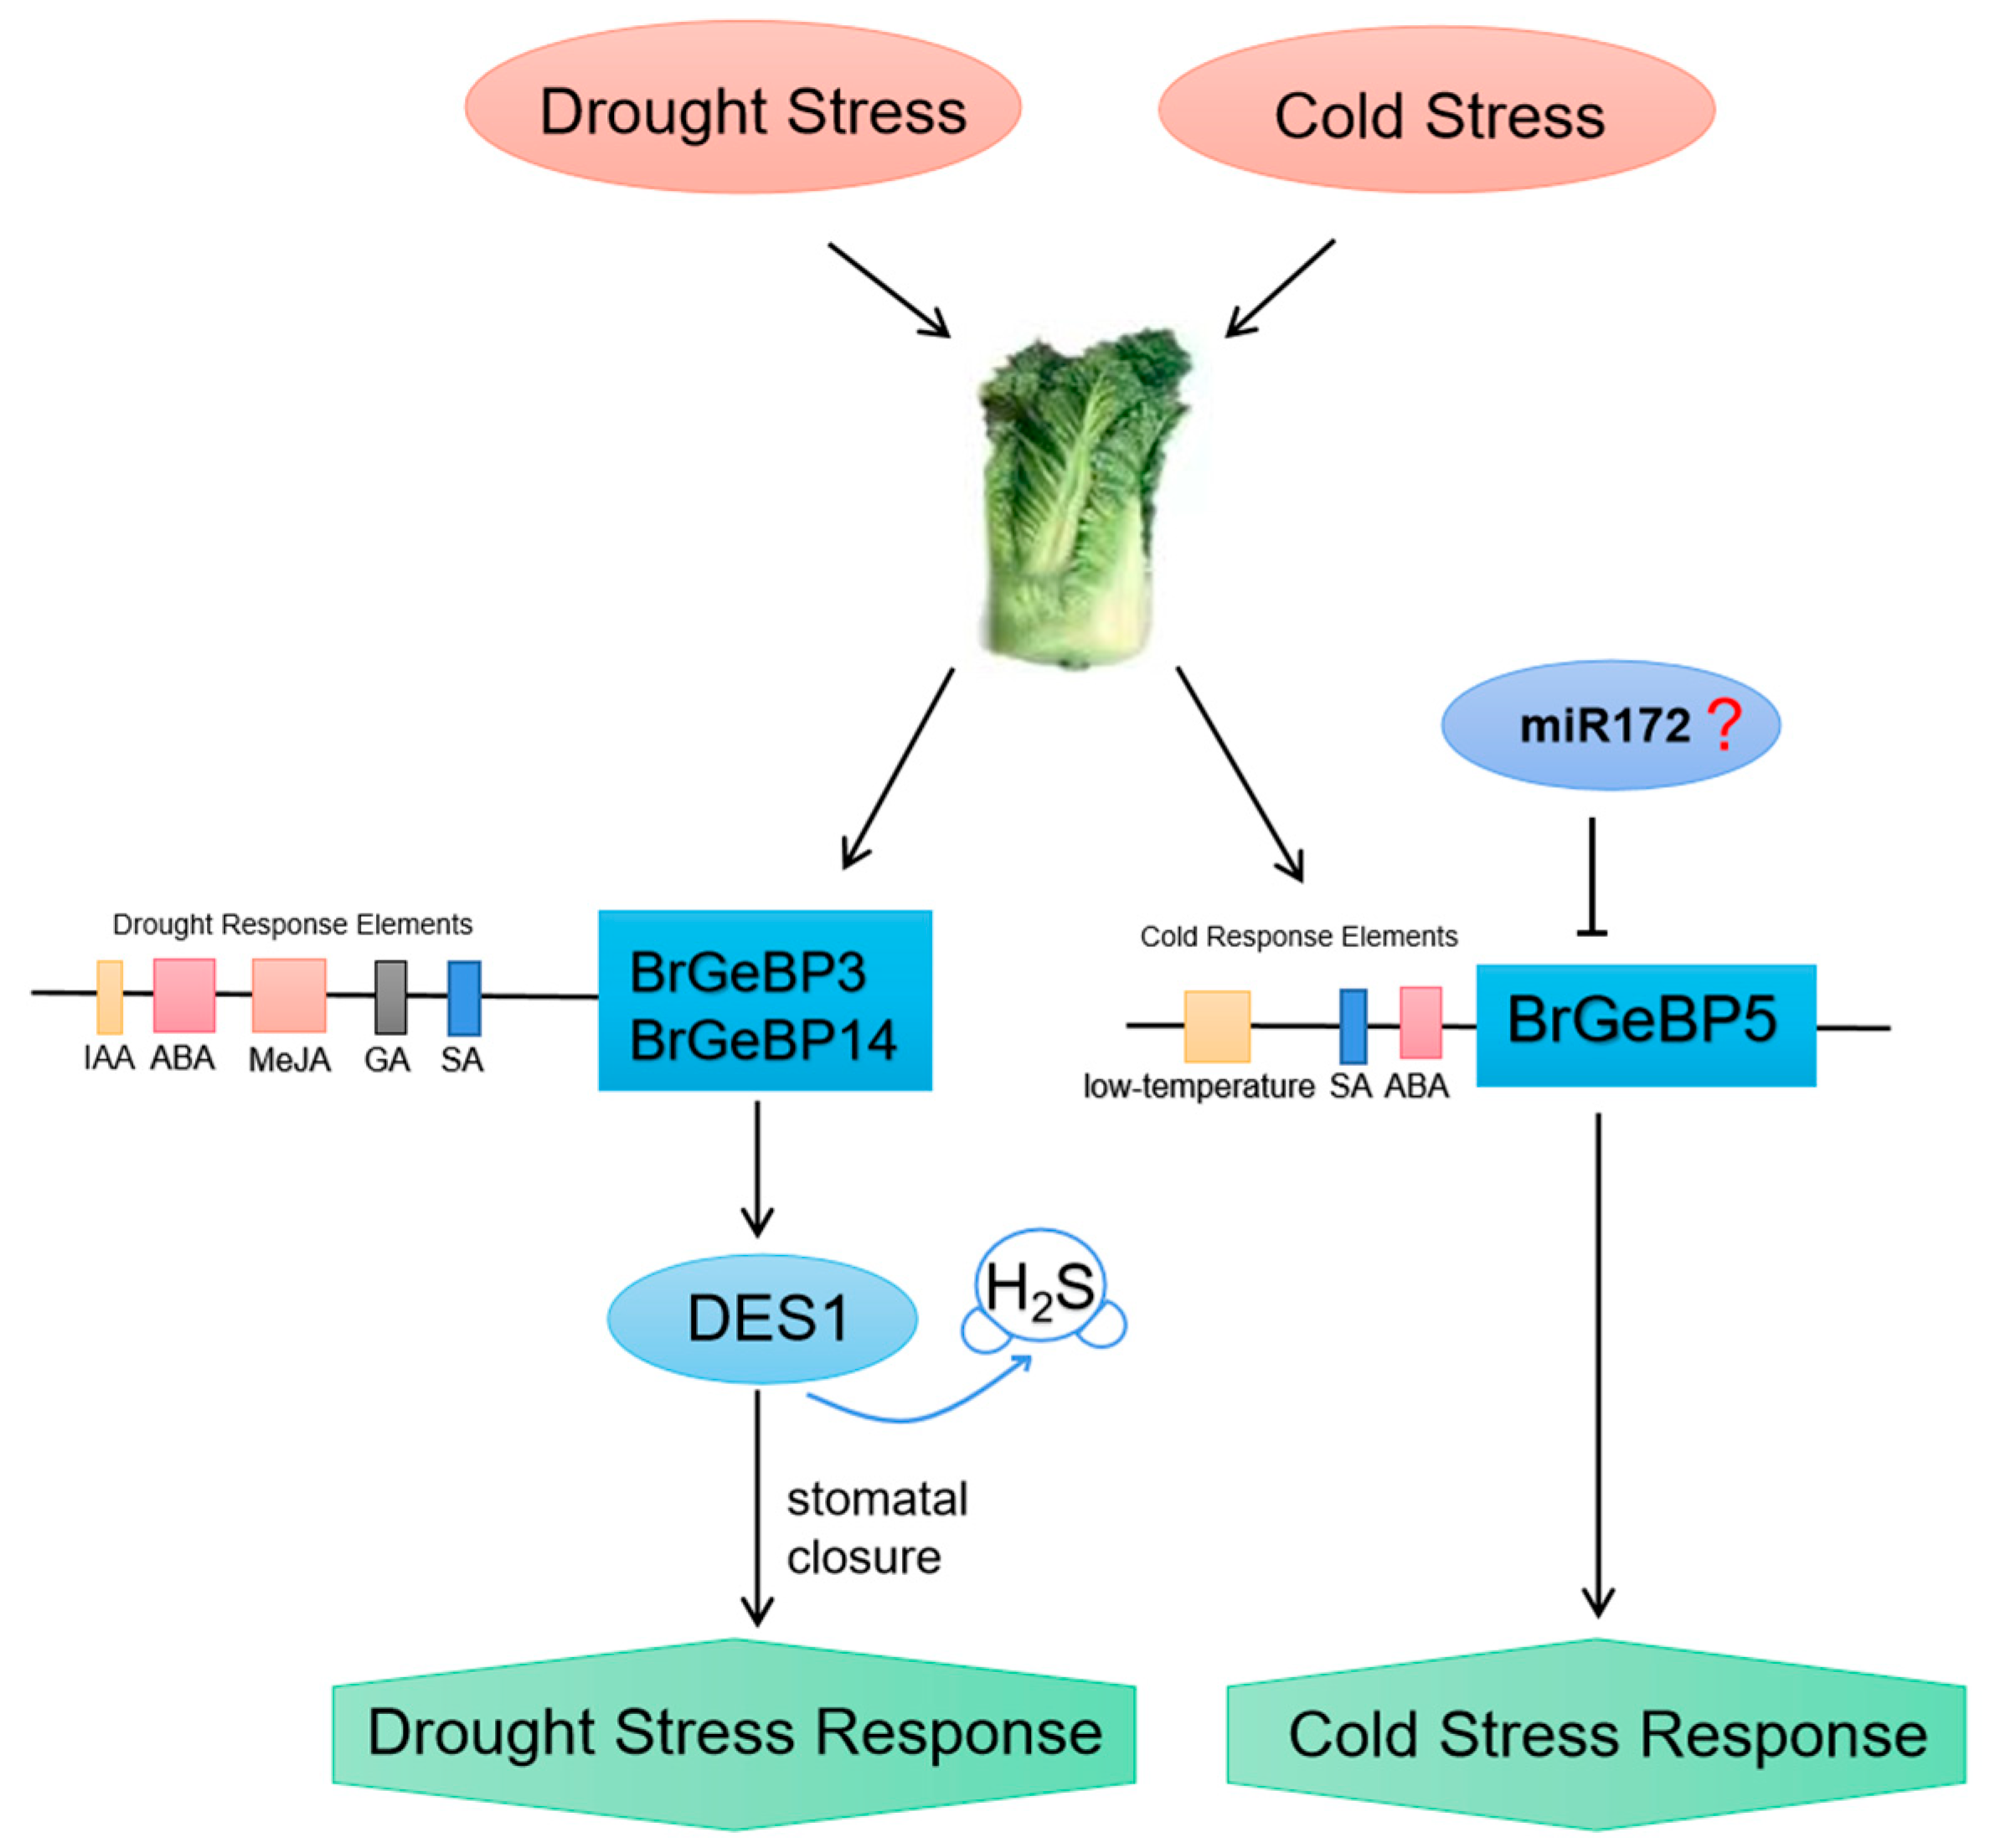
In summary, we identified 20 BrGeBPs in the B. rapa genome. After the comprehensive analysis of sequence features, expression profiles, protein–protein interactions, prediction of microRNA targeted to BrGeBPs, and published data, we speculate that BrGeBP5 has great potential in regulating low-temperature stress response, while BrGeBP3 and BrGeBP14 regulated the drought stress tolerance (Figure 8).

Supplementary Materials

The following supporting information can be downloaded at: https://www.mdpi.com/article/10.3390/ijms241713597/s1.

Author Contributions

J.H. and Q.D. conceived the project and designed the experiments; R.W. and X.W. performed the bioinformatics analysis and experiments with help from Z.W., X.Z., L.C.; R.W. and X.W. wrote the manuscript. J.H. and Q.D. revised the manuscript. All authors have read and agreed to the published version of the manuscript.

Funding

This research was funded by Shandong Provincial Natural Science Foundation (ZR2022MC021) and the Key Program of Shandong Province Science Foundation (ZR2020KC017).

Institutional Review Board Statement

Not applicable.

Informed Consent Statement

Not applicable.

Data Availability Statement

All the data that support the findings of this study are available in the paper and its supplementary material published online.

Acknowledgments

We are grateful to Zhilong Bao’s lab for help with qRT-PCR experiments.

Conflicts of Interest

The authors declare no conflict of interest.

References

  1. Curaba, J.; Herzog, M.; Vachon, G. GeBP, the first member of a new gene family in Arabidopsis, encodes a nuclear protein with DNA-binding activity and is regulated by KNAT1. Plant J. 2003, 33, 305–317. [Google Scholar] [CrossRef] [PubMed]
  2. Chen, K.; Liu, J.; Song, H.; Zhang, Z.; Chen, X.; Wang, A. The tomato genome sequence provides insights into fleshy fruit evolution. Nature 2012, 485, 635–641. [Google Scholar] [CrossRef]
  3. Sun, R.; Yang, N.; Liu, Z.; Xia, Y.; Sun, Y.; Gao, Q.; Pu, J.; Dang, Z.; Zhang, H. Identification and expression analysis of mango GeBP transcription factor family genes. Non-Wood For. Res. 2021, 39, 137–147. [Google Scholar] [CrossRef]
  4. Liu, S.; Liu, Y.; Liu, C.; Zhang, F.; Wei, J.; Li, B. Genome-Wide Characterization and Expression Analysis of GeBP Family Genes in Soybean. Plants 2022, 11, 1848. [Google Scholar] [CrossRef]
  5. Shan, X.; Yang, K.; Shi, J.; Zhu, C.; Gao, Z. Genome-wide identification and expression analysis of GeBP transcription factorgene family in moso bamboo. J. Nanjing For. Univ. (Nat. Sci. Ed.) 2020, 44, 41–48. [Google Scholar] [CrossRef]
  6. Chevalier, F.; Perazza, D.; Laporte, F.; Henanff, G.L.; Hornitschek, P.; Bonneville, J.M.; Herzog, M.; Vachon, G. GeBP and GeBP-like proteins are noncanonical leucine-zipper transcription factors that regulate cytokinin response in Arabidopsis. Plant Physiol. 2008, 146, 1142–1154. [Google Scholar] [CrossRef] [PubMed]
  7. Yanai, O.; Shani, E.; Dolezal, K.; Tarkowski, P.; Sablowski, R.; Sandberg, G.; Samach, A.; Ori, N. Arabidopsis KNOXI proteins activate cytokinin biosynthesis. Curr. Biol. 2005, 15, 1566–1571. [Google Scholar] [CrossRef]
  8. Ray, S.; Dansana, P.K.; Giri, J.; Deveshwar, P.; Arora, R.; Agarwal, P.; Khurana, J.P.; Kapoor, S.; Tyagi, A.K. Modulation of transcription factor and metabolic pathway genes in response to water-deficit stress in rice. Funct. Integr. Genom. 2011, 11, 157–178. [Google Scholar] [CrossRef]
  9. Liu, R.; Li, H.; Qiao, Z.; Liu, H.; Zhao, L.; Wang, X.; Zhang, Z.; Zhang, S.; Song, L.; You, C. Genome-wide analysis of MdGeBP family and functional identification of MdGeBP3 in Malus domestica. Environ. Exp. Botany 2023, 208, 105262. [Google Scholar] [CrossRef]
  10. Khare, D.; Mitsuda, N.; Lee, S.; Song, W.; Hwang, D.; Ohme-Takagi, M.; Martinoia, E.; Lee, Y.; Hwang, J. Root avoidance of toxic metals requires the GeBP-LIKE 4 transcription factor in Arabidopsis thaliana. New Phytol. 2017, 213, 1257–1273. [Google Scholar] [CrossRef]
  11. Huang, J.; Zhang, Q.; He, Y.; Liu, W.; Xu, Y.; Liu, K.; Xian, F.; Li, J.; Hu, J. Genome-wide identification, expansion mechanism and expression profiling analysis of GLABROUS1 enhancer-binding protein (GeBP) gene family in Gramineae crops. Int. J. Mol. Sci. 2021, 22, 8758. [Google Scholar] [CrossRef]
  12. Perazza, D.; Laporte, F.; Balagué, C.; Chevalier, F.; Remo, S.; Bourge, M.; Larkin, J.; Herzog, M.; Vachon, G. GeBP/GPL Transcription Factors Regulate a Subset of CPR5-Dependent Processes. Plant Physiol. 2011, 157, 1232–1242. [Google Scholar] [CrossRef] [PubMed]
  13. Kamei, A.; Seki, M.; Umezawa, T.; Ishida, J.; Satou, M.; Akiyama, K.; Zhu, J.; Shinozaki, K. Analysis of gene expression profiles in Arabidopsis salt overly sensitive mutants sos2-1 and sos3-1. Plant Cell Environ. 2005, 28, 1267–1275. [Google Scholar] [CrossRef]
  14. Bassa, C.; Mila, I.; Bouzayen, M.; Audran-Delalande, C. Phenotypes associated with down-regulation of Sl-IAA27 support functional diversity among Aux/IAA family members in tomato. Plant Cell Physiol. 2012, 53, 1583–1595. [Google Scholar] [CrossRef]
  15. Zhou, M.; Zhang, J.; Shen, J.; Zhou, H.; Zhao, D.; Gotor, C.; Romero, L.C.; Fu, L.; Li, Z.; Yang, J.; et al. Hydrogen sulfide-linked persulfidation of ABI4 controls ABA responses through the transactivation of MAPKKK18 in Arabidopsis. Mol. Plant 2021, 14, 921–936. [Google Scholar] [CrossRef] [PubMed]
  16. García-Cano, E.; Hak, H.; Magori, S.; Lazarowitz, S.G.; Citovsky, V. The Agrobacterium F-Box Protein Effector VirF Destabilizes the Arabidopsis GLABROUS1 Enhancer/Binding Protein-Like Transcription Factor VFP4, a Transcriptional Activator of Defense Response Genes. Mol. Plant Microbe Interact. 2018, 31, 576–586. [Google Scholar] [CrossRef] [PubMed]
  17. Ma, C.; Chen, Q.; Wang, S.; Lers, A. Downregulation of GeBP-like α factor by MiR827 suggests their involvement in senescence and phosphate homeostasis. BMC Biol. 2021, 19, 90. [Google Scholar] [CrossRef]
  18. Cui, C.; Wang, J.J.; Zhao, J.H.; Fang, Y.Y.; He, X.F.; Guo, H.S.; Duan, C.G. A Brassica miRNA Regulates Plant Growth and Immunity through Distinct Modes of Action. Mol. Plant 2020, 13, 231–245. [Google Scholar] [CrossRef]
  19. Wang, W.; Liu, D.; Zhang, X.; Chen, D.; Cheng, Y.; Shen, F. Plant MicroRNAs in Cross-Kingdom Regulation of Gene Expression. Int. J. Mol. Sci. 2018, 19, 2007. [Google Scholar] [CrossRef]
  20. Liang, G.; Yang, F.; Yu, D. MicroRNA395 mediates regulation of sulfate accumulation and allocation in Arabidopsis thaliana. Plant J. 2010, 62, 1046–1057. [Google Scholar] [CrossRef]
  21. Keshabarz, H.; Sanavy, S.A.M.; Moghadan, R.S.G. Impact of Foliar Application with Salicylic Acid on Biochemical Characters of Canola Plants under Cold Stress Condition. Not. Sci. Biologicae. 2016, 8, 98–105. [Google Scholar] [CrossRef]
  22. Cheng, F.; Lu, J.; Gao, M.; Shi, K.; Kong, Q.; Huang, Y.; Bie, Z. Redox Signaling and CBF-Responsive Pathway Are Involved in Salicylic Acid-Improved Photosynthesis and Growth under Chilling Stress in Watermelon. Front. Plant Sci. 2016, 7, 1519. [Google Scholar] [CrossRef]
  23. Ahmad, F.; Singh, A.; Kamal, A. Salicylic acid–mediated defense mechanisms to abiotic stress tolerance. In Plant Signaling Molecules; Woodhead Publishing: Sawston, UK, 2019; pp. 355–369. [Google Scholar] [CrossRef]
  24. Tottempudi, K.P. Mechanisms of chilling-induced oxidative stress injury and tolerance in developing maize seedlings: Changes in antioxidant system, oxidation of proteins and lipids, and protease activities. Plant J. 1996, 10, 1017–1026. [Google Scholar] [CrossRef]
  25. Guo, W.; Chen, R.; Gong, Z.; Yin, Y.; Ahmed, S.; He, Y. Exogenous abscisic acid increases antioxidant enzymes and related gene expression in pepper (Capsicum annuum) leaves subjected to chilling stress. Genet. Mol. Res. 2012, 11, 4063–4080. [Google Scholar] [CrossRef] [PubMed]
  26. Ó’Maoiléidigh, D.S.; van Driel, A.D.; Singh, A.; Sang, Q.; Le Bec, N.; Vincent, C.; Vayssieres, A.; Branchat, M.R.; Severing, E.; Gallegos, R.M.; et al. Systematic analyses of the MIR172 family members of Arabidopsis define their distinct roles in regulation of APETALA2 during floral transition. PLoS Biol. 2021, 19, e3001043. [Google Scholar] [CrossRef] [PubMed]
  27. Shohat, H.; Cheriker, H.; Kilambi, H.V.; Illouz Eliaz, N.; Blum, S.; Amsellem, Z.; Tarkowská, D.; Aharoni, A.; Eshed, Y.; Weiss, D. Inhibition of gibberellin accumulation by water deficiency promotes fast and long-term ‘drought avoidance’ responses in tomato. New Phytol. 2021, 232, 1985–1998. [Google Scholar] [CrossRef]
  28. Yoshida, T.; Christmann, A.; Yamaguchi-Shinozaki, K.; Grill, E.; Fernie, A.R. Revisiting the Basal Role of ABA—Roles Outside of Stress. Trends Plant Sci. 2019, 24, 625–635. [Google Scholar] [CrossRef] [PubMed]
  29. Zhang, Y.; Li, Y.; Hassan, M.; Li, Z.; Peng, Y. Indole-3-acetic acid improves drought tolerance of white clover via activating auxin, abscisic acid and jasmonic acid related genes and inhibiting senescence genes. BMC Plant Biol. 2020, 20, 150. [Google Scholar] [CrossRef]
  30. Chen, S.; Jia, H.; Wang, X.; Shi, C.; Wang, X.; Ma, P.; Wang, J.; Ren, M.; Li, J. Hydrogen Sulfide Positively Regulates Abscisic Acid Signaling through Persulfidation of SnRK2.6 in Guard Cells. Mol. Plant 2020, 13, 732–744. [Google Scholar] [CrossRef]
  31. Liu, H.; Wang, J.; Liu, J.; Liu, T.; Xue, S. Hydrogen sulfide (H2S) signaling in plant development and stress responses. aBIOTECH 2021, 2, 32–63. [Google Scholar] [CrossRef]
  32. Chen, C.; Chen, H.; Zhang, Y.; Thomas, H.R.; Frank, M.H.; He, Y.; Xia, R. TBtools: An Integrative Toolkit Developed for Interactive Analyses of Big Biological Data. Mol. Plant 2020, 13, 1194–1202. [Google Scholar] [CrossRef] [PubMed]
  33. Appel, R.D.; Bairoch, A.; Hochstrasser, D.F. A new generation of information retrieval tools for biologists: The example of the ExPASy WWW server. Trends Biochem. Sci. 1994, 19, 258–260. [Google Scholar] [CrossRef] [PubMed]
  34. Bailey, T.L.; Boden, M.; Buske, F.A.; Frith, M.; Grant, C.E.; Clementi, L.; Ren, J.; Li, W.W.; Noble, W.S. MEME SUITE: Tools for motif discovery and searching. Nucleic Acids Res. 2009, 37, W202–W208. [Google Scholar] [CrossRef] [PubMed]
  35. Letunic, I.; Bork, P. Interactive Tree Of Life (iTOL) v5: An online tool for phylogenetic tree display and annotation. Nucleic Acids Res. 2021, 49, W293–W296. [Google Scholar] [CrossRef]
  36. Bailey, T.L.; Johnson, J.; Grant, C.E.; Noble, W.S. The MEME Suite. Nucleic Acids Res. 2015, 43, W39–W49. [Google Scholar] [CrossRef]
  37. Bolser, D.M.; Staines, D.M.; Perry, E.; Kersey, P.J. Ensembl Plants: Integrating Tools for Visualizing, Mining, and Analyzing Plant Genomic Data. In Plant Genomics Databases: Methods and Protocols; Humana Press: New York, NY, USA, 2017; Volume 1533, pp. 1–31. [Google Scholar] [CrossRef]
  38. Lescot, M.; Déhais, P.; Thijs, G.; Marchal, K.; Moreau, Y.; Van de Peer, Y.; Rouzé, P.; Rombauts, S. PlantCARE, a database of plant cis-acting regulatory elements and a portal to tools for in silico analysis of promoter sequences. Nucleic Acids Res. 2002, 30, 325–327. [Google Scholar] [CrossRef] [PubMed]
  39. Szklarczyk, D.; Gable, A.L.; Nastou, K.C.; Lyon, D.; Kirsch, R.; Pyysalo, S.; Doncheva, N.T.; Legeay, M.; Fang, T.; Bork, P.; et al. The STRING database in 2021: Customizable protein-protein networks, and functional characterization of user-uploaded gene/measurement sets. Nucleic Acids Res. 2021, 49, D605–D612. [Google Scholar] [CrossRef]
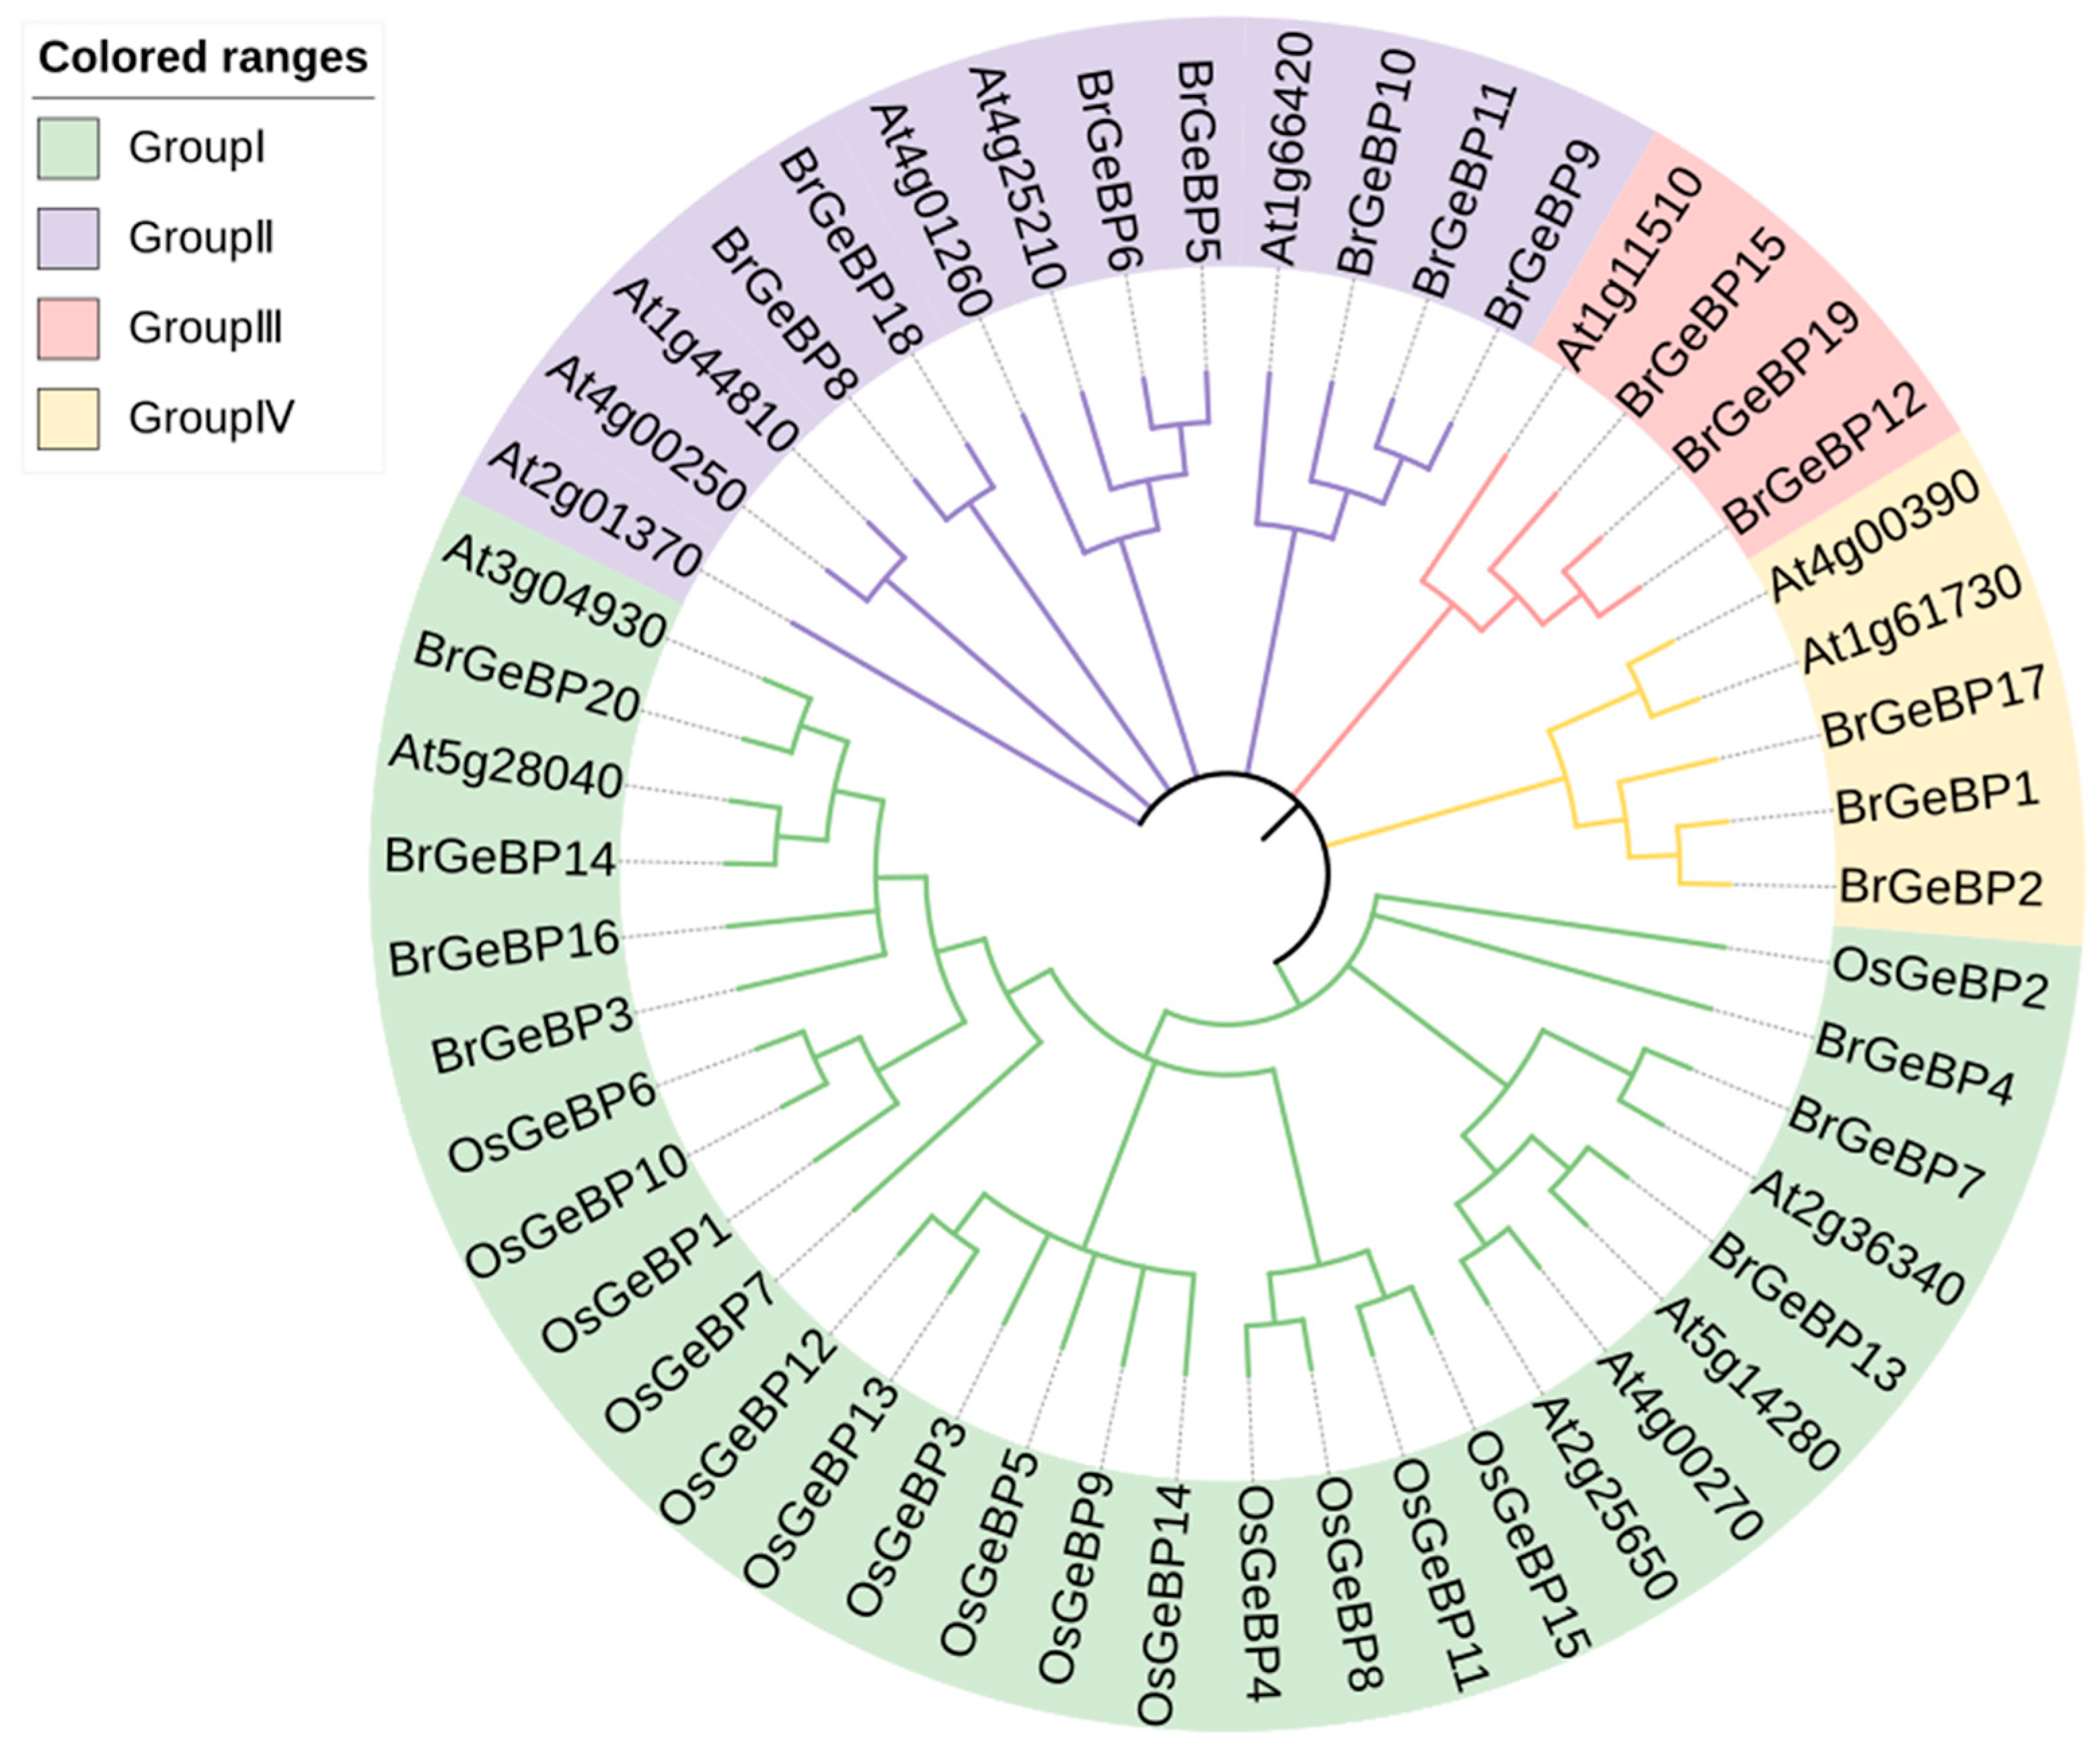
Figure 1. Evolutionary tree of GeBP family in B. rapa, A. thaliana, and O. sativa.
Ijms 24 13597 g001
Figure 2. (A) Analysis of the conserved structural domains, (B) analysis of the functional structural domains, and (C) gene structure analysis of BrGeBPs. The exons and introns are represented by the green boxes and black lines, respectively. (D) Conserved sequence analysis of BrGeBPs.
Ijms 24 13597 g002
Figure 3. Analysis of cis-elements in promoter sequences of the BrGeBPs. The number of cis-elements in each gene is indicated by numbers.
Ijms 24 13597 g003
Figure 4. Expression pattern of BrGeBP genes in different organs and tissues of B. rapa. Darker red, larger dots indicate higher expression level; darker blue, larger dots indicate lower expression level.
Ijms 24 13597 g004
Figure 5. (A) Analysis of BrGeBP gene transcriptome data under abiotic stress. Darker red, larger dots indicate higher expression level; darker blue, larger dots indicate lower expression level; (B) cold treatment; (C) drought treatment. The above experiments were performed using 0 h as the control, with the treatment times set to 2, 4, 6, and 12 h. Each group had three biological replicates, with error bars indicating standard errors. Letters above the data bars indicate the statistical significance (the means are arranged in descending order, with the letter “a” after the highest mean, a = 0.05).
Ijms 24 13597 g005
Figure 6. Protein–protein interaction networks of GeBP gene family in A. thaliana. (A) All BrGeBP PPIs; (B) At1g11510 PPIs; (C) At2g36340 PPIs; (D) At5g28040 PPIs. Minimum required interaction score of 0.400; default settings were used for the other parameters. Network nodes represent proteins, edges represent protein–protein associations. Arrows indicate protein-interacting genes. The thinner the linkage and the darker the color, the stronger the correlation, and vice versa, the weaker the correlation.
Ijms 24 13597 g006
Figure 7. Smart graph illustration of microRNA targeting the GeBP genes in B. rapa.
Ijms 24 13597 g007
Figure 8. The putative molecular mechanism of BrGeBPs-regulated stress response.
Ijms 24 13597 g008
Table 1. Information about GeBP gene family of B. rapa.
Gene IDGene NameChromosome (Chr)StartEndpIMolecular Weight (Average)Protein Length (aa) Subcellular LocationA. thaliana Homologous GeBP Genes
Bra031402BrGeBP1A0117755753177567515.0936,940.88332nucl: 13At4g00390
Bra021317BrGeBP2A0122344927223458538.8934,587.78308nucl: 14At4g00390
Bra040116BrGeBP3A0128356166283573485.1740,831.34371nucl: 8, cyto: 3, vacu: 2At5g28040
Bra013842BrGeBP4A01803290080364348.9569,620.11609chlo: 9, nucl: 2, extr: 2At5g25140
Bra013873BrGeBP5A01817502781761037.5339,311.39358nucl: 11, chlo: 1, cyto: 1At4g25210
Bra019183BrGeBP6A0325822483258235835.7240,527.59366nucl: 12, cyto: 1At4g25210
Bra017244BrGeBP7A0415774327157762424.5643,160.65377nucl: 10, cyto: 3At2g36340
Bra032717BrGeBP8A04523628852372865.3136,619.28332nucl: 13At1g44810
Bra028105BrGeBP9A04576856657717238.9872,816.9640nucl: 13At1g61730
Bra028106BrGeBP10A04577276357737376.1733,634.76299nucl: 14At1g11510
Bra028108BrGeBP11A04577685557777545.9133,917.13299nucl: 14At1g61730
Bra025445BrGeBP12A04869388886948115.6134,648.02307nucl: 13At1g11510
Bra039500BrGeBP13A05953622495373625.7134,161.25300nucl: 10, cyto: 2, plas: 2At5g14280
Bra009986BrGeBP14A0618469313184705574.8744,964.03414nucl: 12, cyto: 1At5g28040
Bra019847BrGeBP15A06401990540209757.6639,168.47356nucl: 14At1g11510
Bra036116BrGeBP16A09264132426424914.6938,400.59358nucl: 12, cysk: 1At5g28040
Bra027078BrGeBP17A09825309782542395.1542,108.78380nucl: 13At1g61730
Bra034488BrGeBP18Scaffold0000963569603579285.3535,634.26322nucl: 13At1g61730
Bra038583BrGeBP19Scaffold0001492507212519805.0846,353.94419nucl: 10, cyto: 4At1g61730
Bra040416BrGeBP20Scaffold00020397200984774.8446,795.99425nucl: 13At3g04930
aa, amino acids. Subcellular location: chlo (chloroplast), cyto (cytosol), nucl (nucleus), extr (extracellular), cysk (cytoskeleton), plas (plasma membrane), vacu (vacuolar membrane). The numerical values indicate the expression of each gene in different organelles.
Table 2. Details of BrGeBPs and targeted microRNAs.
MicroRNAsMicroRNA Targeting BrGeBPs
Br-miR156a-3pBrGeBP9
Br-miR156f-3pBrGeBP9
Br-miR172d-3pBrGeBP15
Br-miR172d-5pBrGeBP5
Br-miR395a-5pBrGeBP4
Br-miR395b-5pBrGeBP4
Br-miR395c-5pBrGeBP4
Br-miR395d-5pBrGeBP4
Br-miR5711BrGeBP19
Br-miR5714BrGeBP5
Br-miR6032-3pBrGeBP19
Br-miR9559-5pBrGeBP20
Br-miR9565-5pBrGeBP20
Br-miR9569-5pBrGeBP20
Br-miR159aBrGeBP8BrGeBP18
Br-miR5716BrGeBP9BrGeBP10
Br-miR5717BrGeBP4BrGeBP13
Br-miR9555a-5pBrGeBP13BrGeBP7
Disclaimer/Publisher’s Note: The statements, opinions and data contained in all publications are solely those of the individual author(s) and contributor(s) and not of MDPI and/or the editor(s). MDPI and/or the editor(s) disclaim responsibility for any injury to people or property resulting from any ideas, methods, instructions or products referred to in the content.