Abstract
Apolipoprotein-CIII (apo-CIII) is involved in triglyceride-rich lipoprotein metabolism and linked to beta-cell damage, insulin resistance, and cardiovascular disease. Apo-CIII exists in four main proteoforms: non-glycosylated (apo-CIII0a), and glycosylated apo-CIII with zero, one, or two sialic acids (apo-CIII0c, apo-CIII1 and apo-CIII2). Our objective is to determine how apo-CIII glycosylation affects lipid traits and type 2 diabetes prevalence, and to investigate the genetic basis of these relations with a genome-wide association study (GWAS) on apo-CIII glycosylation. We conducted GWAS on the four apo-CIII proteoforms in the DiaGene study in people with and without type 2 diabetes (n = 2318). We investigated the relations of the identified genetic loci and apo-CIII glycosylation with lipids and type 2 diabetes. The associations of the genetic variants with lipids were replicated in the Diabetes Care System (n = 5409). Rs4846913-A, in the GALNT2-gene, was associated with decreased apo-CIII0a. This variant was associated with increased high-density lipoprotein cholesterol and decreased triglycerides, while high apo-CIII0a was associated with raised high-density lipoprotein-cholesterol and triglycerides. Rs67086575-G, located in the IFT172-gene, was associated with decreased apo-CIII2 and with hypertriglyceridemia. In line, apo-CIII2 was associated with low triglycerides. On a genome-wide scale, we confirmed that the GALNT2-gene plays a major role i O-glycosylation of apolipoprotein-CIII, with subsequent associations with lipid parameters. We newly identified the IFT172/NRBP1 region, in the literature previously associated with hypertriglyceridemia, as involved in apolipoprotein-CIII sialylation and hypertriglyceridemia. These results link genomics, glycosylation, and lipid metabolism, and represent a key step towards unravelling the importance of O-glycosylation in health and disease.
1. Introduction
Type 2 diabetes and cardiovascular disease are two of the leading causes of disease burden worldwide [1]. Triglycerides and low-density lipoprotein (LDL)-cholesterol (c) are important contributors to cardiovascular disease risk [2]. One of the central players in lipid metabolism is apolipoprotein-CIII (apo-CIII) [3].
Apo-CIII inhibits lipoprotein lipase [4] and hepatic lipase [5], which regulate triglyceride-rich lipoprotein (TRL) metabolism [6]. Apo-CIII is present mostly on TRLs when the triglyceride levels are high and mostly on high-density lipoproteins (HDL) when the triglyceride levels are low [7,8]. Apo-CIII levels and variation in the APOC3 gene contribute to dyslipidaemia, artery wall inflammation, atherogenesis, and cardiovascular disease (CVD) risk [9,10,11]. Moreover, high apo-CIII levels have been linked to insulin resistance and beta-cell destruction [12,13]. APOC3 promotor variants increase type 2 diabetes risk and the need for insulin treatment, particularly among lean patients [14].
Polypeptide N-acetylgalactosaminyltransferase 2 (GalNAc-T2), encoded by the GALNT2 gene, initiates mucin-type O-glycosylation of apo-CIII in the Golgi apparatus [15]. Mutations in the GALNT2 gene cause rare congenital glycosylation disorders affecting apo-CIII glycosylation [16] and affect lipid profiles [17]. Without such mutations, apo-CIII exists in different proteoforms [18,19]. The four most abundant apo-CIII proteoforms are the non-glycosylated apo-CIII0a, and the proteoforms containing a mucin-type core-1 O-glycosylation with zero (apo-CIII0c), one (apo-CIII1), and two (apo-CIII2) sialic acids [18,19,20] (Supplementary Figure S1). Apo-CIII proteoforms have different effects on hepatic TRL clearance receptors and the on potential of apo-CIII to inhibit lipoprotein lipase (LPL) resulting in variation in hepatic triglyceride clearance and lipid profile [21,22]. In smaller scale cohorts, the concentrations of apo-CIII0a, apo-CIII0c, and apo-CIII1 have been associated with lower small dense LDL [23] and higher triglyceride levels [18,24,25].
The objective of our study was to investigate the association between apo-CIII glycosylation and lipid traits, as well as the prevalence of type 2 diabetes, in a large population-based cohort. Moreover, we conducted the first genome-wide association studies (GWASs) of apo-CIII O-glycosylation in the DiaGene Study and explored the associations between genetic variants, apoCIII proteoforms, lipid levels, and type 2 diabetes. The genetic associations with lipid levels were subsequently replicated in the Hoorn Diabetes Care System cohort.
2. Results
2.1. Cohort Characteristics
Apo-CIII glycosylation was available for 2,318 participants in the DiaGene Study; the participants’ mean age was 65.3 (SD 9.5) years, 51% was female, the median body mass index (BMI) was 28.0 (IQR 25.2 to 31.6) kg/m2, 68% had type 2 diabetes, and 48% used lipid-lowering therapy. In the Hoorn DCS, genotypes of 5409 participants with type 2 diabetes were available; the mean age was 61.1 (SD 11.0) years, 44.6% was female, the median BMI was 29.4 (IQR 26.6 to 33.1) kg/m2 and 42.1% used lipid-lowering therapy (Table 1).

2.2. Apo-CIII O-Glycosylation, Type 2 Diabetes and Lipid Parameters
Apo-CIII0a had a significant, negative association with the prevalence of type 2 diabetes (Table 2). In addition, apo-CIII0a was significantly associated with high cholesterol levels from both HDL and non-HDL particles, including LDL. Apo-CIII0c was associated with high triglycerides, total cholesterol, and non-HDL-c; but not with HDL-c or LDL-c. These associations point at more TRLs when the proportion of apo-CIII0c is high. Apo-CIII1 and the apo-CIII1/apo-CIII2 ratio were positively and apo-CIII2 was negatively associated with LDL-c, non-HDL-c, total cholesterol, and triglycerides. HDL-c was associated with a lower apo-CIII1/apo-CIII2 ratio, lower proportion of apo-CIII1, and higher proportion of apo-CIII2 (Table 2). Adjustment for the use of lipid-lowering therapy and repeating these analyses for people with and without type 2 diabetes separately did not alter the direction of effect, although some associations lost significance (Supplementary Table S1).
2.3. GWASs of Apo-CIII O-Glycosylation Proteoforms
We conducted GWASs on the four main proteoforms of apo-CIII and the apo-CIII1/apo-CIII2 ratio in the DiaGene study. In total, we identified 11 SNPs with p < 1 × 10⁻⁶. The GWAS results are summarized in Table 3, Figure 1 and Supplementary Figure S2. One signal, the A allele of rs4846913 at the GALNT2 locus on chromosome 1, was genome-wide significantly associated with decreased apo-CIII0a (p = 9.77 × 10−36) (Table 3, Supplementary Figure S3). This SNP was also associated with high HDL-c (p = 0.065) and low triglycerides (p = 0.006) in the meta-analysis (Table 4), in line with public GWAS data (p = 7.46 × 10−146 [26] and 2.28 × 10−235 [27], respectively). The association of rs4846913 with apo-CIII0a remained genome-wide significant when analysed for people with and without type 2 diabetes separately (Supplementary Table S5). The variant rs35498929-T, also in the GALNT2 locus, was associated at a suggestive significance level with decreased apo-CIII0a (p = 7.44 × 10⁻⁷) and with higher prevalence of type 2 diabetes (p = 0.006) in the relatively small DiaGene study for such analyses (Supplementary Figure S3 and Supplementary Table S3).
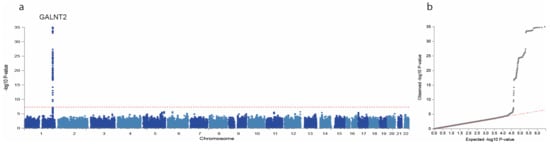
Figure 1.
Manhattan and QQ plot of apo-CIII0a genome-wide association study (GWAS). GWAS of apo-CIII0a showing associations with alleles at the GALNT2 locus on chromosome 1. Manhattan plot (a) showing significance of the association of each single nucleotide polymorphism (SNP) allele with apo-CIII0a by plotting the -log10 of the p-Value against the genomic position. The horizontal red dotted line corresponds to the genome-wide significance threshold of p = 5 × 10⁻⁸. Quantile–quantile plot (b) is a plot of the observed -log10(p) against the expected -log10(p) under the null hypothesis of no association. Deviation above the red dotted y = x line indicates lower p-Values that would be expected to occur by chance and implies statistically significant association.
Two variants reached a suggestive significance level for associations with one or more apo-CIII proteoforms without reaching formal genome-wide significance but were also associated with one or more lipid traits in the meta-analyses. The rs10842926-C in the PPFIBP1 locus, was associated with decreased apo-CIII1 (p = 7.07 × 10⁻⁷, Supplementary Figure S4, Table 3). This variant was also associated with high LDL-c (p = 0.016) and low triglycerides (p = 0.039) with nominal significance in meta-analysis (Table 4) but was not significant in the Type 2 Diabetes Knowledge Portal [27]. The rs67086575-G allele, in the intronic region of the IFT172-gene was associated with apo-CIII2 and the apo-CIII1/apo-CIII2 ratio (p = 7.32 × 10−07 and p =7.37 × 10−07, respectively); and was significant for higher triglycerides (p = 1.07 × 10⁻⁵) in the meta-analysis, and for higher LDL-c, total cholesterol, and non-HDL-c (p = 0.019, p = 0.025, and p = 0.013, respectively) in the DiaGene study (Supplementary Figure S5, Table 4). The associations with triglycerides (p = 4.84 × 10−287) [27], LDL-c (p = 2.90 × 10−51) [26], and total cholesterol (p = 4.76 × 10⁻²⁶) [26] were in line with public data from the Type 2 Diabetes Knowledge Portal and the IEU OpenGWAS Project. The associations of our 11 identified genetic loci with apo-CIII proteoforms had the same direction of effect in people with and without type 2 diabetes (Supplementary Table S5). Other variants had a promising association with an apo-CIII proteoform and showed a significant association with clinical traits in one of the studies, but these signals did not survive the meta-analyses (in Supplementary Tables S3 and S4).
3. Discussion
In the present study, we present the first GWAS of protein O-glycosylation, combined with clinical outcomes. We investigated the associations of apo-CIII proteoforms with lipid traits and prevalent type 2 diabetes, and performed GWASs on apo-CIII O-glycosylation to determine the direction of the associations. We found that the GALNT2 locus was strongly associated with apo-CIII glycosylation and lipid traits. These findings were replicated in an independent population and then meta-analysed. The GALNT2 locus linked apo-CIII0a and triglyceride levels to prevalent type 2 diabetes. To our knowledge, this is the first paper describing a genome-wide association with apo-CIII glycosylation. Moreover, a variant at the IFT172/NRBP1 region, not previously linked to apo-CIII glycosylation, showed consistent associations with apo-CIII sialylation, and with triglyceride and total cholesterol levels.
We confirmed on a genome-wide significant scale that the GALNT2-gene plays a major role in the O-glycosylation of apo-CIII. The GALNT2-gene encodes the GalNAc-T2 enzyme that links N-acetylgalactosamine (GalNAc) to proteins, which is the essential first step in the addition of mucine-type O-linked glycans [28]. Apo-CIII is a selective GalNAc-T2 target: it is dependent of GalNAc-T2 for its glycosylation [29]. In our study, the GALNT2 variants rs4846913-A and rs35498929-T were associated with a low proportion of non-glycosylated apo-CIII0a, reflecting increased O-glycosylation of apo-CIII. The rs4846913 variant is located within a regulatory element that drives the expression of the GALNT2-gene in human hepatocytes [30], which is in line with our findings of increased apo-CIII glycosylation. In vitro studies suggest that the rs4846913-A allele increases binding with transcription factor cytosine-cytosine-adenosine-adenosine-thymidine (CCAAT) enhancer binding protein beta (CEBPB), possibly leading to increased expression of GALNT2 [30], while the C-allele has low functional activity [31].
Rs4846913-A also had a negative association with triglyceride levels, in line with findings in European [26,27] and Asian consortia [32]. In contrast, Holleboom et al. found that rare GALNT2 missense variants resulted in attenuated glycosylation of apo-CIII and better triglyceride clearance [22]. Holleboom et al. [22] found altered apo-CIII sialylation patterns in the carriers of a loss-of-function GALNT2 variant. They speculated that this was due to a smaller amount of glycosylated apo-CIII available for sialylation, increasing the number of disialylated species. In our study, sialylation within O-glycosylated species (apo-CIII0c, apo-CIII1, and apo-CIII2) did not associate with the rs4846913 and rs35498929 GALNT2 variants. Our genetic loci may not share the mechanism described by Holleboom et al. In our data, apo-CIII0a had a small positive association with triglyceride levels, which is in line with findings by Yassine et al. [18]. Apo-CIII0a was associated with higher HDL-c. Unfortunately, there is barely any literature about apo-CIII0a and HDL-c. Koska et al. found opposite directions of effect in their two study cohorts for the association of apo-CIII0a with HDL-c [24]. As demonstrated in vitro, the GalNAc-T2 enzyme, encoded by the GALNT2-gene, also glycosylates angiopoietin-like protein 3 (ANGPTL3), lecithin-cholesterol acyltransferase (LCAT), and phospholipid transfer protein (PLTP), which all play important roles in lipid metabolism, and especially triglyceride and HDL metabolism. Cholesteryl ester transfer protein (CETP) is another glycoprotein whose activity was directly associated with serum triglycerides and inversely with HDL-c [33]. We cannot exclude that GALNT2 can affect lipid profiles through these or other proteins [29]. Moreover, to our knowledge, it is unknown whether glycosylation of these proteins parallels that of apo-CIII in type 2 diabetes. These aspects should be elucidated in future studies.
Regarding sialylation, apo-CIII2 and the apo-CIII1/apo-CIII2 ratio had strong negative and positive associations with triglyceride levels, respectively. Furthermore, rs67086575-G was associated with low apo-CIII2, high apo-CIII1/apo-CIII2 ratio, and with high triglycerides in the meta-analyses. The variant also had a positive association with LDL-c, non-HDL-c and total cholesterol but this was confined to the DiaGene study. The association of this variant with triglycerides, LDL-c and total cholesterol is in agreement with findings in public GWAS data [26,27]. Rs67086575 is located in the intronic region of the IFT172-gene. This gene encodes a peripheral subunit of the intraflagellar transport subcomplex-B (IFT-B) [34]. Mutations in this gene have been associated with ciliopathies, but so far not with glycosylation [34]. However, a link between primary cilia and obesity, insulin signalling, and type 2 diabetes have been described, which makes crosslinks to the lipoprotein metabolism not unlikely [35]. In blood cell lines, this SNP is associated with increased expression of the NRBP1-gene [36]. This NRBP1-gene is suggested to play a role in subcellular trafficking between the endoplasmic reticulum and Golgi apparatus [37]. Since sialylation of O-glycans takes place at the Golgi-membrane [38], the link between rs67086575 and the NRBP1-gene might explain the association of this SNP with apo-CIII sialylation.
Apo-CIII2 is associated with higher HDL-cholesterol, lower LDL-cholesterol, and lower triglyceride levels, while apo-CIII0c and apo-CIII1 showed opposite effects. Our findings are in accordance with findings in type 2 diabetes and prediabetes by Koska et al. [24]. Moreover, glycosylation of apo-CIII may affect its inhibitory potential on LPL, although the direction and magnitude of this effect remains to be determined. Furthermore, apo-CIII glycosylation influences the interaction of LDL with the vascular wall [22,39]. From our data, we could speculate that lowering apo-CIII2 or increasing apo-CIII1 and apo-CIII0a might cause a shift towards a more atherogenic lipid profile. These glycoforms might be an interesting treatment target for the prevention of cardiovascular disease in the general population and in type 2 diabetes. Future large-scale research is needed to confirm the effects of apo-CIII proteoforms on lipid metabolism and cardiovascular disease risk, and to investigate the effect of medication on apo-CIII proteoform distributions, which is relevant for the development and effectivity of lipid-lowering therapy.
Hepatic receptors differentially clear sialylated apo-CIII glycoforms [21], therefore it has to be considered that changed proportions of certain apo-CIII proteoforms might not only be the result of aberrant posttranslational modification of apo-CIII, but might also be the result of accumulation due to dysfunctional clearance pathways. Nevertheless, our genetic findings pointed mainly towards the posttranslational modification of apo-CIII as a cause of aberrant glycosylation and sialylation. Larger GWASs might elucidate possible changes in clearance pathways of apo-CIII proteoforms.
This is the first GWAS of apo-CIII O-glycosylation, and therefore provides new insights into the genetic background of O-glycosylation. Current knowledge regarding the genetics of apo-CIII O-glycosylation is mainly based on studies addressing congenital disorders of glycosylation, where rare genetic variants have been shown to affect apo-CIII O-glycosylation [16]. Findings in these disorders might not be applicable to the general population. Our findings had the same direction and magnitude of effect in people with and without diabetes, which suggests applicability to the general population. The DiaGene Study is the first cohort with detailed information on total plasma apo-CIII O-glycosylation on a large scale, using a high-throughput method to measure apo-CIII proteoforms. To date, the relations between lipids and apo-CIII glycoforms are only investigated in small cohorts. Our findings are in line with those studies, although non-glycosylated apo-CIII0a, has received little attention in the current literature.
There are no previous large-scale studies with data on apo-CIII O-glycosylation. Therefore, direct replication of our GWAS is not possible; this limits our power to detect small effect sizes. Nevertheless, we could only detect associations with substantial effect sizes, which are most relevant as a starting point. Notably, we did replicate the identified lead SNPs from the GWAS with plasma lipids in the independent Hoorn DCS cohort to improve power for effects on the clinical endpoints and decrease the risk of false-positive results. The Hoorn DCS cohort included patients with type 2 diabetes treated by their general practitioner, whereas the DiaGene study included patients with type 2 diabetes from all lines of care and people without diabetes. This could explain some of the differences between these cohorts. A few associations had opposing directions of effect in the DiaGene and Hoorn DCS cohorts. However, the confidence intervals were mostly overlapping, which does not allow definite conclusion on the directions of the effect. Unfortunately, we do not have total apo-CIII plasma concentration data. The distribution of glycoforms in plasma is stable in variable apo-CIII concentrations in young, healthy men [40]. By adding the genetic basis to the analyses, we could offset this limitation for the most part. Both cohorts were mainly of Caucasian descent; therefore, we cannot generalise our findings to other ethnic groups.
In conclusion, variants of the GALNT2-gene affect apo-CIII O-glycosylation, lipid metabolism, and the risk of type 2 diabetes. The GALNT2-gene encodes the GalNAc-T2 enzyme that covalently links N-acetylgalactosamine (GalNAc) to proteins. This suggests that the order of causality has the O-glycosylation at its basis, subsequently affecting apo-CIII function and then altering the lipid profile and the risk of type 2 diabetes, and not vice versa. Moreover, we propose the NRBP1-gene as a possible player in the sialylation of apolipoprotein-CIII and hypertriglyceridemia. Our results confirm a link between genomics, glycosylation, and lipid metabolism. This is a key step towards unravelling the regulation of serum and plasma glycoprotein O-glycosylation in health and disease. Glycophenotype characterisation alongside genetic variant identification should serve as relevant prognostic and predictive tools and should be considered for target identification of new pharmacological agents.
4. Material and Methods
4.1. DiaGene Study
We used cross-sectional data from the DiaGene Study. This study has been described in more detail elsewhere [41]. Briefly, this case-control cohort comprises type 2 diabetes patients from all lines of care and people without diabetes from the area of Eindhoven, the Netherlands. We had available data on apo-CIII O-glycosylation for 1572 persons with type 2 diabetes and 746 persons without diabetes, of which, for 1872 participants, genetic data were also available to perform the GWAS analysis.
4.2. The Hoorn Diabetes Care System Cohort
For replication of the genetic associations with lipid levels, we used data from the Hoorn Diabetes Care System (Hoorn DCS) cohort, described in detail elsewhere [42]. Patients with type 2 diabetes treated in primary care in the region of West Friesland, the Netherlands, are included in this cohort. Genetic, biochemical, anthropometric, and clinical data of 5409 persons with type 2 diabetes were available. Apo-CIII glycosylation measurements were not available in the Hoorn DCS cohort.
Informed consent was obtained from all subjects involved in the study. Both studies were approved by the Medical Ethics Committees of the involved hospitals in compliance with the Declaration of Helsinki principles (DiaGene MEC-2004-230, Hoorn DCS 2007/57).
4.3. Apo-CIII Glycosylation Measurements
The analysis of apo-CIII O-glycosylation in the DiaGene Study was performed using a high-throughput method based on solid-phase extraction, matrix-assisted laser desorption/ionization (MALDI) and ultrahigh-resolution Fourier transform ion cyclotron resonance (FT-ICR) mass spectrometry (MS), described by Demus et al. [25]. The method provides the coefficient of variation values in a range of 6–16% for inter-plate and 1–18% for average intra-plate variability for relative quantitation of all four apo-CIII proteoforms. Apo-CIII0a represents non-glycosylated apo-CIII; the non-, mono- and di-sialylated glycoforms are described as apo-CIII0c, apo-CIII1 and apo-CIII2, respectively. Apo-CIII0a was normalized to the sum of all four proteoforms: apo-CIII0a, apo-CIII0c, apo-CIII1, and apo-CIII2 to reflect the proportion of non-glycosylated apo-CIII. The sum of apo-CIII0c, apo-CIII1, and apo-CIII2 was set to 1.0 to obtain the proportion of these three glycoforms within all glycosylated species of apo-CIII. Additionally, the ratio of apo-CIII1 and apo-CIII2 was calculated. Individuals with missing glycosylation data, missing age, sex, or genetic principal components were excluded from the analyses. Glycan measurements were natural log-transformed prior to GWAS analysis, because of the skewness of their distributions.
4.4. GWAS of Apo-CIII Glycosylation
In the DiaGene and Hoorn DCS cohorts, quality control was performed in PLINK [43], and genotypes were imputed to the Haplotype Reference Consortium r1.1 reference panel [44,45] using the Michigan Imputation Server [46]. Variants with an imputation quality < 0.4, minor allele frequency ≤ 0.05 or ≥0.95; effective allele count ≤ 5; or when out of Hardy–Weinberg Equilibrium (HWE) with HWE p-Value ≤ 1 × 10⁻⁴ were excluded. Using zCall [47] we aimed to call previously uncalled genotypes, mostly of rare variants. Manhattan plots, QQ plots, and locus zoom plots were generated using FUMA [48]. In the DiaGene study, we conducted separate GWASs on all four apo-CIII proteoforms, and the apo-CIII1/apo-CIII2 ratio with RVtest [49] and quality control was performed with EasyQC [50]. We assessed genetic associations using linear regression models adjusted for age, sex, and significant principal components of ancestry (Supplementary Table S2). p-Values lower than or equal to 5 × 10⁻⁸ were considered genome-wide significant. To differentiate diabetes-specific and general genetic effects, the associations of the genetic variants with the apo-CIII proteoforms were investigated separately for people with or without type 2 diabetes, using linear regression models in SPSS.
4.5. Statistical Methods
The associations of apo-CIII glycosylation with lipid markers were analysed in the DiaGene Study using linear regression, separately for each apo-CIII proteoform. The proteoforms were considered the dependent variables. First, the analysis was performed with adjustments for age and sex; subsequently, a sensitivity analysis was performed for the use of lipid-lowering therapy (mostly statins and fibrates, combined as a binary variable). Next, this analysis was repeated for people with and without type 2 diabetes separately to investigate potential differences in medication effects. Since four separate proteoforms were analysed, the Bonferroni corrected p-Value for significance was applied as p < 0.0125 (0.05/4).
The genetic variants with a p-Value < 1 × 10⁻⁶ in the GWASs were selected for further statistical analyses with lipid markers and prevalence of type 2 diabetes. We performed multiple linear regression analyses of the association of the genetic variants with lipid markers HDL-c, non-HDL-c, LDL-c, total cholesterol, and triglycerides, adjusted for age and sex. The triglyceride concentrations were natural log-transformed for the statistical analyses; p-Values are shown for log-transformed triglyceride levels, while effect sizes are shown for non-transformed triglyceride concentrations. Next, we performed logistic regression analyses for the associations of the genetic variants with the prevalence of type 2 diabetes, adjusted for age and sex. The Bonferroni corrected threshold for significance was calculated as p < 0.0045 (0.05/11), as we analysed 11 single nucleotide polymorphisms (SNPs). Variants showing associations with a p-Value < 1 × 10⁻⁶ in the GWASs were investigated for associations with lipid markers in the Hoorn DCS Study. The results of DiaGene and Hoorn DCS of these variants with clinical outcomes were meta-analysed using beta, standard error, and number of participants of each cohort. Subsequently, SNPs were looked up in public GWAS databases Type 2 Diabetes Knowledge Portal [27] and IEU OpenGWAS [26] and in expression quantitative trait loci (eQTL) database eQTLGen [36] on 25 May 2022.
IBM SPSS 25.0 was used for all statistical analyses within the DiaGene study, R version 4.0.5 was used for statistical analysis in the Hoorn DCS and meta-analyses.
Supplementary Materials
The following supporting information can be downloaded at: https://www.mdpi.com/article/10.3390/ijms241914844/s1.
Author Contributions
A.N.: Methodology. Software. Formal analysis. Visualization. Writing—Original Draft. D.D.: Validation. Formal analysis. Investigation. Data Curation. Writing—Review and Editing. R.S.: Software. Formal analysis. Writing—Review and Editing. S.N.: Methodology. Validation. Investigation. Data Curation. Writing—Review and Editing. J.W.J.B.: Investigation. Resources. Writing—Review and Editing. Project administration. P.J.M.E.: Investigation. Resources. Writing—Review and Editing. Project administration. A.G.L.: Conceptualization. Methodology. Resources. Writing—Review and Editing. Project administration. E.J.G.S.: Conceptualization. Methodology. Resources. Writing—Review and Editing. Supervision. Project administration. Funding acquisition. L.M.’t.H.: Investigation. Resources. Writing—Review and Editing. Project administration. M.W.: Methodology. Conceptualization. Investigation. Resources. Writing—Review and Editing. Supervision. M.v.H.: Conceptualization. Methodology. Resources. Writing—Review and Editing. Supervision. Project administration. Funding acquisition. All authors have read and agreed to the published version of the manuscript.
Funding
This project has received funding from the European Union’s Horizon 2020 research and innovation programme under the Marie Skłodowska-Curie grant agreement No 722095. This funding source had no involvement in the study design, collection, analysis, interpretation of data, writing or submitting the article.
Institutional Review Board Statement
The DiaGene and DCS Hoorn studies were conducted in compliance with the Declaration of Helsinki principles and were approved by the Medical Ethics Committees of the involved hospitals (Erasmus MC University Medical center and VU University Medical Center, Amsterdam, respectively) (protocol codes: DiaGene MEC-2004-230, Hoorn DCS 2007/57).
Informed Consent Statement
Informed consent was obtained from all subjects involved in the study.
Data Availability Statement
The data presented in this study are available on request from the corresponding author. The data are not publicly available due to privacy regulations.
Acknowledgments
The authors would like to thank the participants and staff of Diabetes Care System West-Friesland and the DiaGene Study for their cooperation and support.
Conflicts of Interest
The authors declare no conflict of interest.
Declaration of Generative AI and AI-assisted technologies in the writing process
During the preparation of this work the author(s) did not use any AI and AI-assisted technologies in the writing process.
References
- Kyu, H.H.; Abate, D.; Abate, K.H.; Abay, S.M.; Abbafati, C.; Abbasi, N.; Abbastabar, H.; Abd-Allah, F.; Abdela, J.; Abdelalim, A.; et al. Global, regional, and national disability-adjusted life-years (DALYs) for 359 diseases and injuries and healthy life expectancy (HALE) for 195 countries and territories, 1990-2017: A systematic analysis for the Global Burden of Disease Study 2017. Lancet 2018, 392, 1859–1922. [Google Scholar] [CrossRef] [PubMed]
- Sone, H.; Tanaka, S.; Tanaka, S.; Iimuro, S.; Oida, K.; Yamasaki, Y.; Oikawa, S.; Ishibashi, S.; Katayama, S.; Ohashi, Y.; et al. Serum level of triglycerides is a potent risk factor comparable to LDL cholesterol for coronary heart disease in Japanese patients with type 2 diabetes: Subanalysis of the Japan Diabetes Complications Study (JDCS). J. Clin. Endocrinol. Metab. 2011, 96, 3448–3456. [Google Scholar] [CrossRef] [PubMed]
- Borén, J.; Packard, C.J.; Taskinen, M.R. The Roles of ApoC-III on the Metabolism of Triglyceride-Rich Lipoproteins in Humans. Front. Endocrinol. 2020, 11, 474. [Google Scholar] [CrossRef] [PubMed]
- Ginsberg, H.N.; Le, N.A.; Goldberg, I.J.; Gibson, J.C.; Rubinstein, A.; Wang-Iverson, P.; Norum, R.; Brown, W.V. Apolipoprotein B metabolism in subjects with deficiency of apolipoproteins CIII and AI. Evidence that apolipoprotein CIII inhibits catabolism of triglyceride-rich lipoproteins by lipoprotein lipase in vivo. J. Clin. Investig. 1986, 78, 1287–1295. [Google Scholar] [CrossRef]
- Kinnunen, P.K.J.; Ehnholm, C. Effect of serum and C-apoproteins from very low density lipoproteins on human postheparin plasma hepatic lipase. FEBS Lett. 1976, 65, 354–357. [Google Scholar] [CrossRef]
- Zhang, J.; de Albuquerque Rocha, N.; McCullough, P.A. Contribution of ApoCIII to Diabetic Dyslipidemia and Treatment With Volanesorsen. Rev. Cardiovasc. Med. 2018, 19, 13–19. [Google Scholar] [CrossRef]
- Sacks, F.M.; Zheng, C.; Cohn, J.S. Complexities of plasma apolipoprotein C-III metabolism. J. Lipid Res. 2011, 52, 1067–1070. [Google Scholar] [CrossRef]
- Fredenrich, A.; Giroux, L.M.; Tremblay, M.; Krimbou, L.; Davignon, J.; Cohn, J.S. Plasma lipoprotein distribution of apoC-III in normolipidemic and hypertriglyceridemic subjects: Comparison of the apoC-III to apoE ratio in different lipoprotein fractions. J. Lipid Res. 1997, 38, 1421–1432. [Google Scholar] [CrossRef]
- Valladolid-Acebes, I.; Berggren, P.-O.; Juntti-berggren, L. Apolipoprotein CIII Is an Important Piece in the Type-1 Diabetes Jigsaw Puzzle. Int. J. Mol. Sci. 2021, 22, 932. [Google Scholar] [CrossRef]
- Jørgensen, A.B.; Frikke-Schmidt, R.; Nordestgaard, B.G.; Tybjærg-Hansen, A. Loss-of-Function Mutations in APOC3 and Risk of Ischemic Vascular Disease. N. Engl. J. Med. 2014, 371, 32–41. [Google Scholar] [CrossRef]
- Kawakami, A.; Aikawa, M.; Alcaide, P.; Luscinskas, F.W.; Libby, P.; Sacks, F.M. Apolipoprotein CIII induces expression of vascular cell adhesion molecule-1 in vascular endothelial cells and increases adhesion of monocytic cells. Circulation 2006, 114, 681–687. [Google Scholar] [CrossRef] [PubMed]
- Juntti-Berggren, L.; Refai, E.; Appelskog, I.; Andersson, M.; Imreh, G.; Dekki, N.; Uhles, S.; Yu, L.; Griffiths, W.J.; Zaitsev, S.; et al. Apolipoprotein CIII promotes Ca2+-dependent β cell death in type 1 diabetes. Proc. Natl. Acad. Sci. USA 2004, 101, 10090–10094. [Google Scholar] [CrossRef] [PubMed]
- Digenio, A.; Dunbar, R.L.; Alexander, V.J.; Hompesch, M.; Morrow, L.; Lee, R.G.; Graham, M.J.; Hughes, S.G.; Yu, R.; Singleton, W.; et al. Antisense-Mediated Lowering of Plasma Apolipoprotein C-III by Volanesorsen Improves Dyslipidemia and Insulin Sensitivity in Type 2 Diabetes. Diabetes Care 2016, 39, 1408–1415. [Google Scholar] [CrossRef]
- Van Hoek, M.; Van Herpt, T.W.; Dehghan, A.; Hofman, A.; Lieverse, A.G.; Van Duijn, C.M.; Witteman, J.C.M.; Sijbrands, E.J.G. Association of an APOC3 promoter variant with type 2 diabetes risk and need for insulin treatment in lean persons. Diabetologia 2011, 54, 1360–1367. [Google Scholar] [CrossRef] [PubMed]
- Schjoldager, K.T.B.G.; Vakhrushev, S.Y.; Kong, Y.; Steentoft, C.; Nudelman, A.S.; Pedersen, N.B.; Wandall, H.H.; Mandel, U.; Bennett, E.P.; Levery, S.B.; et al. Probing isoform-specific functions of polypeptide GalNAc-transferases using zinc finger nuclease glycoengineered SimpleCells. Proc. Natl. Acad. Sci. USA 2012, 109, 9893–9898. [Google Scholar] [CrossRef]
- Wada, Y.; Okamoto, N. Apolipoprotein C-III O-glycoform profiling of 500 serum samples by matrix-assisted laser desorption/ionization mass spectrometry for diagnosis of congenital disorders of glycosylation. J. Mass Spectrom. 2020, 56, e4597. [Google Scholar] [CrossRef] [PubMed]
- Surakka, I.; Horikoshi, M.; Mägi, R.; Sarin, A.-P.; Mahajan, A.; Lagou, V.; Marullo, L.; Ferreira, T.; Miraglio, B.; Timonen, S.; et al. The impact of low-frequency and rare variants on lipid levels. Nat. Genet. 2015, 47, 589–597. [Google Scholar] [CrossRef]
- Yassine, H.N.; Trenchevska, O.; Ramrakhiani, A.; Parekh, A.; Koska, J.; Walker, R.W.; Billheimer, D.; Reaven, P.D.; Yen, F.T.; Nelson, R.W.; et al. The association of human apolipoprotein C-III sialylation proteoforms with plasma triglycerides. PLoS ONE 2015, 10, e0144138. [Google Scholar] [CrossRef]
- Nicolardi, S.; Van Der Burgt, Y.E.M.; Dragan, I.; Hensbergen, P.J.; Deelder, A.M. Identification of new apolipoprotein-CIII glycoforms with ultrahigh resolution MALDI-FTICR mass spectrometry of human sera. J. Proteome Res. 2013, 12, 2260–2268. [Google Scholar] [CrossRef]
- Dos Santos Seckler, H.; Park, H.M.; Lloyd-Jones, C.M.; Melani, R.D.; Camarillo, J.M.; Wilkins, J.T.; Compton, P.D.; Kelleher, N.L. New Interface for Faster Proteoform Analysis: Immunoprecipitation Coupled with SampleStream-Mass Spectrometry. J. Am. Soc. Mass Spectrom. 2021, 32, 1659–1670. [Google Scholar] [CrossRef]
- Kegulian, N.C.; Ramms, B.; Horton, S.; Trenchevska, O.; Nedelkov, D.; Graham, M.J.; Lee, R.G.; Esko, J.D.; Yassine, H.N.; Gordts, P.L.S.M. ApoC-III glycoforms are differentially cleared by hepatic TRL (Triglyceride-Rich Lipoprotein) receptors. Arterioscler. Thromb. Vasc. Biol. 2019, 39, 2145–2156. [Google Scholar] [CrossRef] [PubMed]
- Holleboom, A.G.; Karlsson, H.; Lin, R.S.; Beres, T.M.; Sierts, J.A.; Herman, D.S.; Stroes, E.S.G.; Aerts, J.M.; Kastelein, J.J.P.; Motazacker, M.M.; et al. Heterozygosity for a loss-of-function mutation in GALNT2 improves plasma triglyceride clearance in man. Cell Metab. 2011, 14, 811–818. [Google Scholar] [CrossRef] [PubMed]
- Mendoza, S.; Trenchevska, O.; King, S.M.; Nelson, R.W.; Nedelkov, D.; Krauss, R.M.; Yassine, H.N. Changes in low-density lipoprotein size phenotypes associate with changes in apolipoprotein C-III glycoforms after dietary interventions. J. Clin. Lipidol. 2017, 11, 224–233.e2. [Google Scholar] [CrossRef] [PubMed]
- Koska, J.; Yassine, H.; Trenchevska, O.; Sinar, S.; Schwenke, D.C.; Yen, F.T.; Billheimer, D.; Nelson, R.W.; Nedelkov, D.; Reaven, P.D. Disialylated apolipoprotein C-III proteoform is associated with improved lipids in prediabetes and type 2 diabetes1. J. Lipid Res. 2016, 57, 894–905. [Google Scholar] [CrossRef]
- Demus, D.; Naber, A.; Dotz, V.; Jansen, B.C.; Bladergroen, M.R.; Nouta, J.; Sijbrands, E.J.G.; Van Hoek, M.; Nicolardi, S.; Wuhrer, M. Large-Scale Analysis of Apolipoprotein CIII Glycosylation by Ultrahigh Resolution Mass Spectrometry. Front. Chem. 2021, 9, 322. [Google Scholar] [CrossRef]
- Elsworth, B.; Lyon, M.; Alexander, T.; Liu, Y.; Matthews, P.; Hallett, J.; Bates, P.; Palmer, T.; Haberland, V.; Smith, G.D.; et al. The MRC IEU OpenGWAS data infrastructure. bioRxiv 2020. [Google Scholar] [CrossRef]
- Type 2 Diabetes Knowledge Portal., n.d. rs4846913, rs67086575, and rs10842926 variant pages. Available online: https://hugeamp.org/ (accessed on 25 May 2022).
- Van Den Boogert, M.A.W.; Rader, D.J.; Holleboom, A.G. New insights into the role of glycosylation in lipoprotein metabolism. Curr. Opin. Lipidol. 2017, 28, 502–506. [Google Scholar] [CrossRef]
- Schjoldager, K.T.B.G.; Vester-Christensen, M.B.; Bennett, E.P.; Levery, S.B.; Schwientek, T.; Yin, W.; Blixt, O.; Clausen, H. O-glycosylation modulates proprotein convertase activation of angiopoietin-like protein 3: Possible role of polypeptide GalNAc-transferase-2 in regulation of concentrations of plasma lipids. J. Biol. Chem. 2010, 285, 36293–36303. [Google Scholar] [CrossRef]
- Roman, T.S.; Marvelle, A.F.; Fogarty, M.P.; Vadlamudi, S.; Gonzalez, A.J.; Buchkovich, M.L.; Huyghe, J.R.; Fuchsberger, C.; Jackson, A.U.; Wu, Y.; et al. Multiple Hepatic Regulatory Variants at the GALNT2 GWAS Locus Associated with High-Density Lipoprotein Cholesterol. Am. J. Hum. Genet. 2015, 97, 801–815. [Google Scholar] [CrossRef]
- Cavalli, M.; Pan, G.; Nord, H.; Wadelius, C. Looking beyond GWAS: Allele-specific transcription factor binding drives the association of GALNT2 to HDL-C plasma levels. Lipids Health Dis. 2016, 15, 18. [Google Scholar] [CrossRef]
- Guo, T.; Yin, R.X.; Huang, F.; Yao, L.M.; Lin, W.X.; Pan, S.L. Association between the DOCK7, PCSK9 and GALNT2 Gene Polymorphisms and Serum Lipid levels. Sci. Rep. 2016, 6, 19079. [Google Scholar] [CrossRef] [PubMed]
- Ridker, P.M.; Paré, G.; Parker, A.N.; Zee, R.Y.L.; Miletich, J.P.; Chasman, D.I. Polymorphism in the CETP gene region, HDL cholesterol, and risk of future myocardial infarction: Genomewide analysis among 18 245 initially healthy women from the Women’s Genome Health Study. Circ. Cardiovasc. Genet. 2009, 2, 26–33. [Google Scholar] [CrossRef] [PubMed]
- Taschner, M.; Bhogaraju, S.; Lorentzen, E. Architecture and function of IFT complex proteins in ciliogenesis. Differentiation 2012, 83, S12. [Google Scholar] [CrossRef] [PubMed]
- Lee, H.; Song, J.; Jung, J.H.; Ko, H.W. Primary cilia in energy balance signaling and metabolic disorder. BMB Rep. 2015, 48, 647. [Google Scholar] [CrossRef] [PubMed]
- Võsa, U.; Claringbould, A.; Westra, H.-J.; Bonder, M.J.; Deelen, P.; Zeng, B.; Kirsten, H.; Saha, A.; Kreuzhuber, R.; Yazar, S.; et al. Large-scale cis- and trans-eQTL analyses identify thousands of genetic loci and polygenic scores that regulate blood gene expression. Nat. Genet. 2021, 53, 1300–1310. [Google Scholar] [CrossRef]
- De Langhe, S.; Haataja, L.; Senadheera, D.; Groffen, J.; Heisterkamp, N. Interaction of the small GTPase Rac3 with NRBP, a protein with a kinase-homology domain. Int. J. Mol. Med. 2002, 9, 451–459. [Google Scholar] [CrossRef]
- Harduin-Lepers, A.; Vallejo-Ruiz, V.; Krzewinski-Recchi, M.A.; Samyn-Petit, B.; Julien, S.; Delannoy, P. The human sialyltransferase family. Biochimie 2001, 83, 727–737. [Google Scholar] [CrossRef]
- Hiukka, A.; Ståhlman, M.; Pettersson, C.; Levin, M.; Adiels, M.; Teneberg, S.; Leinonen, E.S.; Hultén, L.M.; Wiklund, O.; Orešič, M.; et al. ApoCIII-enriched LDL in type 2 diabetes displays altered lipid composition, increased susceptibility for sphingomyelinase, and increased binding to biglycan. Diabetes 2009, 58, 2018–2026. [Google Scholar] [CrossRef]
- Rodríguez, M.; Rehues, P.; Iranzo, V.; Mora, J.; Balsells, C.; Guardiola, M.; Ribalta, J. Distribution of seven ApoC-III glycoforms in plasma, VLDL, IDL, LDL and HDL of healthy subjects. J. Proteom. 2022, 251, 104398. [Google Scholar] [CrossRef]
- Van Herpt, T.T.W.; Lemmers, R.F.H.; van Hoek, M.; Langendonk, J.G.; Erdtsieck, R.J.; Bravenboer, B.; Lucas, A.; Mulder, M.T.; Haak, H.R.; Lieverse, A.G.; et al. Introduction of the DiaGene study: Clinical characteristics, pathophysiology and determinants of vascular complications of type 2 diabetes. Diabetol. Metab. Syndr. 2017, 9, 47. [Google Scholar] [CrossRef]
- Van Der Heijden, A.A.W.A.; Rauh, S.P.; Dekker, J.M.; Beulens, J.W.; Elders, P.; T’Hart, L.M.; Rutters, F.; Van Leeuwen, N.; Nijpels, G. The Hoorn Diabetes Care System (DCS) cohort. A prospective cohort of persons with type 2 diabetes treated in primary care in the Netherlands. BMJ Open 2017, 7, e015599. [Google Scholar] [CrossRef] [PubMed]
- Purcell, S.; Neale, B.; Todd-Brown, K.; Thomas, L.; Ferreira, M.A.R.; Bender, D.; Maller, J.; Sklar, P.; De Bakker, P.I.W.; Daly, M.J.; et al. PLINK: A tool set for whole-genome association and population-based linkage analyses. Am. J. Hum. Genet. 2007, 81, 559–575. [Google Scholar] [CrossRef] [PubMed]
- McCarthy, S.; Das, S.; Kretzschmar, W.; Delaneau, O.; Wood, A.R.; Teumer, A.; Kang, H.M.; Fuchsberger, C.; Danecek, P.; Sharp, K.; et al. A reference panel of 64,976 haplotypes for genotype imputation. Nat. Genet. 2016, 48, 1279–1283. [Google Scholar] [CrossRef] [PubMed]
- Loh, P.; Danecek, P.; Palamara, P.F.; Fuchsberger, C.; Reshef, A.; Finucane, H.K.; Schoenherr, S.; Forer, L.; Mccarthy, S.; Abecasis, G.R.; et al. Reference-based phasing using the Haplotype Reference Consortium panel. Nat. Genet. 2016, 48, 1443–1448. [Google Scholar] [CrossRef] [PubMed]
- Das, S.; Forer, L.; Schönherr, S.; Sidore, C.; Locke, A.E.; Kwong, A.; Vrieze, S.I.; Chew, E.Y.; Levy, S.; McGue, M.; et al. Next-generation genotype imputation service and methods. Nat. Genet. 2016, 48, 1284–1287. [Google Scholar] [CrossRef]
- Goldstein, J.I.; Crenshaw, A.; Carey, J.; Grant, G.B.; Maguire, J.; Fromer, M.; O’dushlaine, C.; Moran, J.L.; Chambert, K.; Stevens, C.; et al. Zcall: A rare variant caller for array-based genotyping. Bioinformatics 2012, 28, 2543–2545. [Google Scholar] [CrossRef]
- Watanabe, K.; Taskesen, E.; Van Bochoven, A.; Posthuma, D. Functional mapping and annotation of genetic associations with FUMA. Nat. Commun. 2017, 8, 1826. [Google Scholar] [CrossRef]
- Zhan, X.; Hu, Y.; Li, B.; Abecasis, G.R.; Liu, D.J. RVTESTS: An efficient and comprehensive tool for rare variant association analysis using sequence data. Bioinformatics 2016, 32, 1423–1426. [Google Scholar] [CrossRef]
- Winkler, T.W.; Day, F.R.; Croteau-Chonka, D.C.; Wood, A.R.; Locke, A.E.; Mägi, R.; Ferreira, T.; Fall, T.; Graff, M.; Justice, A.E.; et al. Quality control and conduct of genome-wide association meta-analyses. Nat. Protoc. 2014, 9, 1192–1212. [Google Scholar] [CrossRef]
Disclaimer/Publisher’s Note: The statements, opinions and data contained in all publications are solely those of the individual author(s) and contributor(s) and not of MDPI and/or the editor(s). MDPI and/or the editor(s) disclaim responsibility for any injury to people or property resulting from any ideas, methods, instructions or products referred to in the content. |
© 2023 by the authors. Licensee MDPI, Basel, Switzerland. This article is an open access article distributed under the terms and conditions of the Creative Commons Attribution (CC BY) license (https://creativecommons.org/licenses/by/4.0/).