
Total Outflow of High-Density Lipoprotein–Cholesteryl Esters from Plasma Is Decreased in a Model of 3/4 Renal Mass Reduction

 , , , , , and
Abstract
:1. Introduction
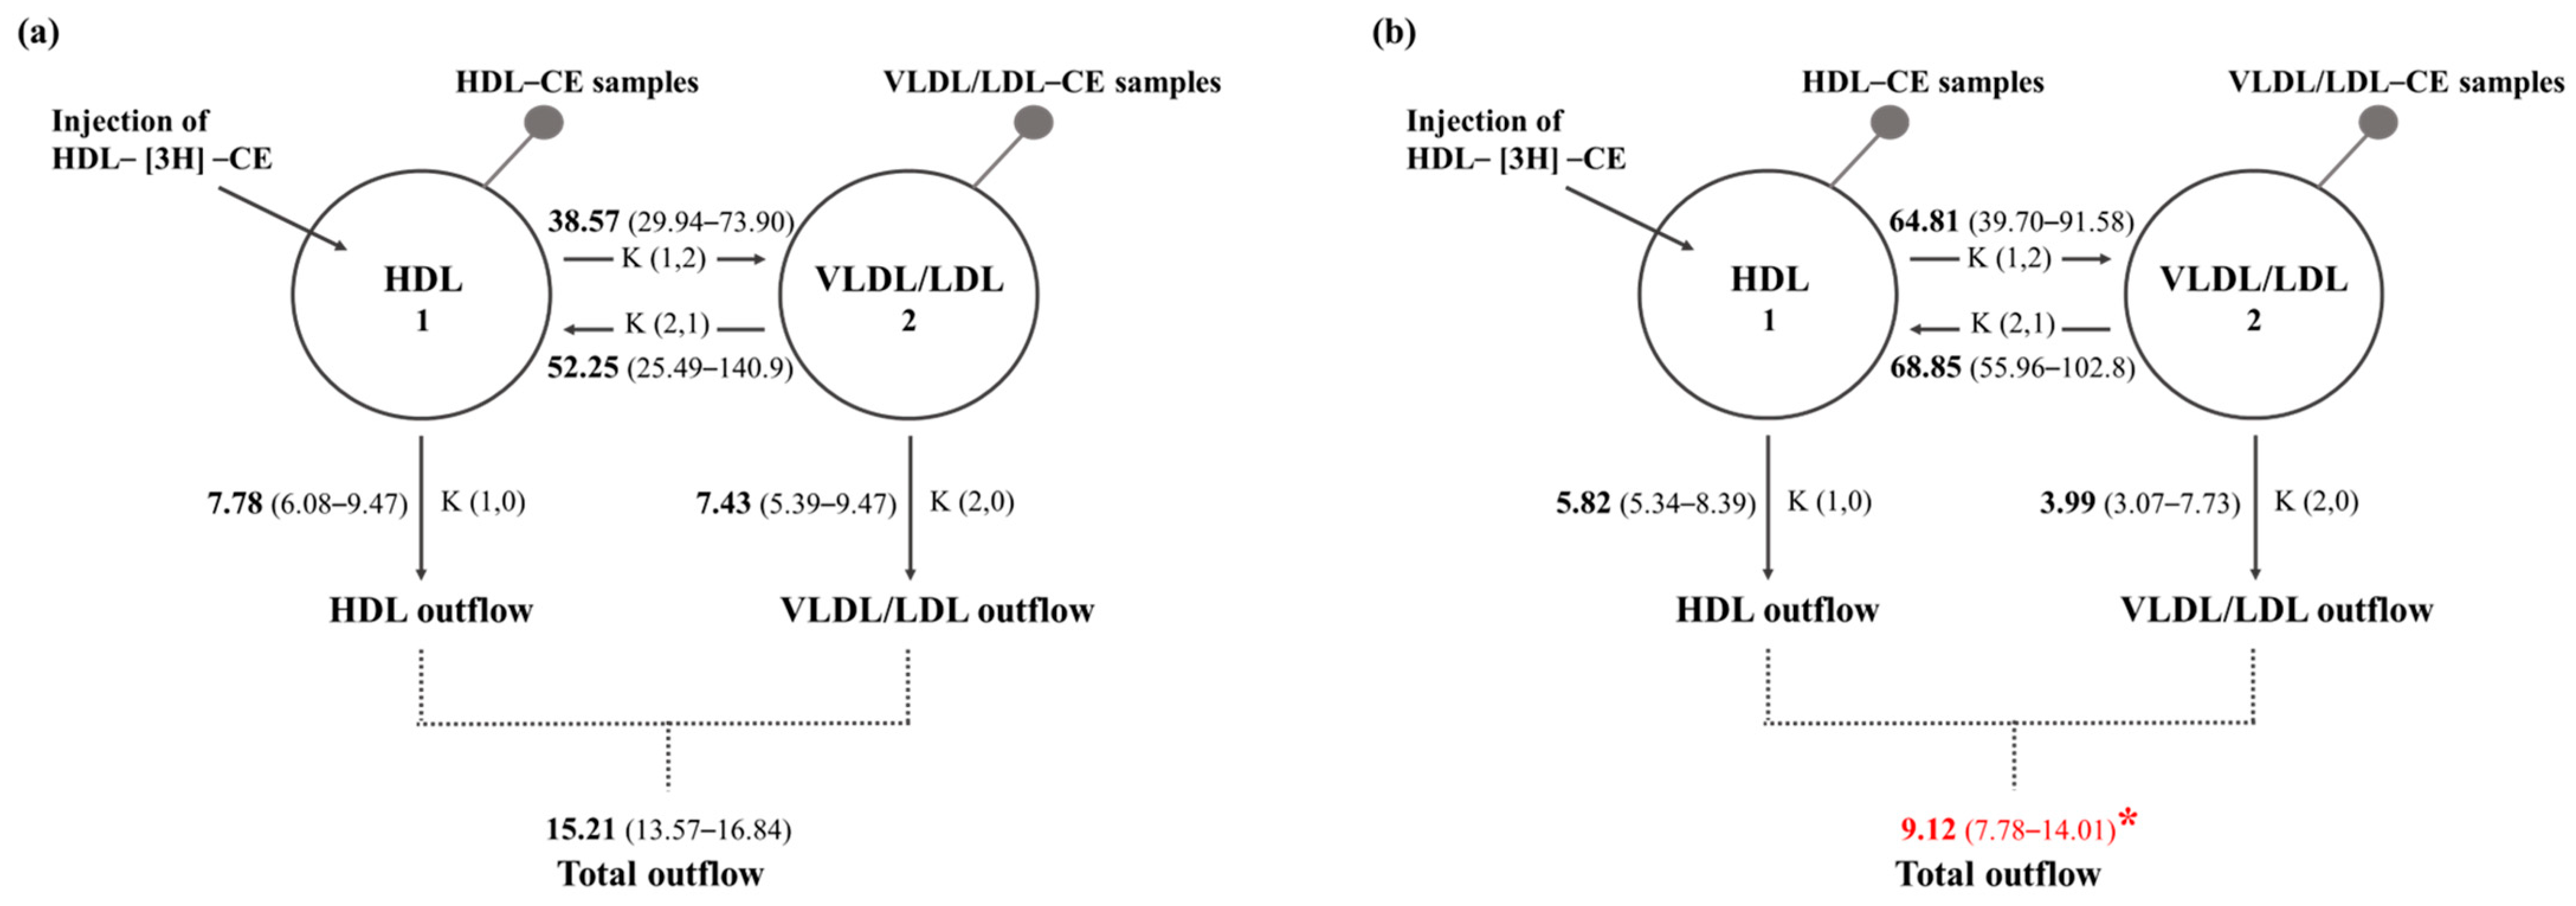
2. Results
3. Discussion
4. Materials and Methods
4.1. Animals
4.2. Sample Collection
4.3. Biochemical Analyses
4.4. Isolation and Characterization of HDL Particles
4.5. Preparation of HDL-Containing [3H] Labeling Cholesteryl Esters and Turnover Studies
4.6. In Vivo HDL-[3H]-CE Kinetic Studies
4.7. Compartmental Modeling
4.8. Statistical Analysis
Supplementary Materials
Author Contributions
Funding
Institutional Review Board Statement
Informed Consent Statement
Data Availability Statement
Acknowledgments
Conflicts of Interest
References
- Sharrett, A.R.; Ballantyne, C.M.; Coady, S.A.; Heiss, G.; Sorlie, P.D.; Catellier, D.; Patsch, W. Atherosclerosis Risk in Communities Study Group. Coronary heart disease prediction from lipoprotein cholesterol levels, triglycerides, lipoprotein(a), apolipoproteins A-I and B, and HDL density subfractions: The Atherosclerosis Risk in Communities (ARIC) Study. Circulation 2001, 104, 1108–1113. [Google Scholar] [CrossRef] [PubMed]
- Curb, J.D.; Abbott, R.D.; Rodriguez, B.L.; Masaki, K.; Chen, R.; Sharp, D.S.; Tall, A.R. A prospective study of HDL-C and cholesteryl ester transfer protein gene mutations and the risk of coronary heart disease in the elderly. J. Lipid Res. 2004, 45, 948–953. [Google Scholar] [CrossRef] [PubMed]
- Rye, K.A.; Barter, P.J. Cardioprotective functions of HDLs. J. Lipid Res. 2014, 55, 168–179. [Google Scholar] [CrossRef] [PubMed]
- Feig, J.E.; Shamir, R.; Fisher, E.A. Atheroprotective effects of HDL: Beyond reverse cholesterol transport. Curr. Drug Targets 2008, 9, 196–203. [Google Scholar] [CrossRef] [PubMed]
- Cockerill, G.W.; Rye, K.A.; Gamble, J.R.; Vadas, M.A.; Barter, P.J. High-density lipoproteins inhibit cytokine-induced expression of endothelial cell adhesion molecules. Arterioscler. Thromb. Vasc. Biol. 1995, 15, 1987–1994. [Google Scholar] [CrossRef] [PubMed]
- Besler, C.; Lüscher, T.F.; Landmesser, U. Molecular mechanisms of vascular effects of High-density lipoprotein: Alterations in cardiovascular disease. EMBO Mol. Med. 2012, 4, 251–268. [Google Scholar] [CrossRef] [PubMed]
- Denimal, D.; Benanaya, S.; Monier, S.; Simoneau, I.; Pais de Barros, J.P.; Le Goff, W.; Bouillet, B.; Vergès, B.; Duvillard, L. Normal HDL Cholesterol Efflux and Anti-Inflammatory Capacities in Type 2 Diabetes Despite Lipidomic Abnormalities. J. Clin. Endocrinol. Metab. 2022, 107, e3816–e3823. [Google Scholar] [CrossRef]
- Lampka, M.; Olszewska-Słonina, D.; Hołyńska-Iwan, I.; Grąbczewska, Z.; Obońska, K.; Cwynar, A.; Stępowska, J.; Szewczyk-Golec, K. Effect of Low High-Density Lipoprotein Level on Endothelial Activation and Prothrombotic Processes in Coronary Artery Disease-A Pilot Study. Int. J. Environ. Res. Public. Health 2022, 19, 8637. [Google Scholar] [CrossRef]
- Kontush, A.; Chantepie, S.; Chapman, M.J. Small, dense HDL particles exert potent protection of atherogenic LDL against oxidative stress. Arterioscler. Thromb. Vasc. Biol. 2003, 23, 1881–1888. [Google Scholar] [CrossRef]
- Li, X.P.; Zhao, S.P.; Zhang, X.Y.; Liu, L.; Gao, M.; Zhou, Q.C. Protective effect of high density lipoprotein on endothelium-dependent vasodilatation. Int. J. Cardiol. 2000, 73, 231–236. [Google Scholar] [CrossRef]
- Tardif, J.C.; Rhainds, D.; Brodeur, M.; Feroz Zada, Y.; Fouodjio, R.; Provost, S.; Boulé, M.; Alem, S.; Grégoire, J.C.; L’Allier, P.L.; et al. Genotype-Dependent Effects of Dalcetrapib on Cholesterol Efflux and Inflammation: Concordance with Clinical Outcomes. Circ. Cardiovasc. Genet. 2016, 9, 340–348. [Google Scholar] [CrossRef] [PubMed]
- Franceschini, G.; Favari, E.; Calabresi, L.; Simonelli, S.; Bondioli, A.; Adorni, M.P.; Zimetti, F.; Gomaraschi, M.; Coutant, K.; Rossomanno, S.; et al. Differential effects of fenofibrate and extended-release niacin on high-density lipoprotein particle size distribution and cholesterol efflux capacity in dyslipidemic patients. J. Clin. Lipidol. 2013, 7, 414–422. [Google Scholar] [CrossRef] [PubMed]
- Nicholls, S.J.; Ruotolo, G.; Brewer, H.B.; Kane, J.P.; Wang, M.D.; Krueger, K.A.; Adelman, S.J.; Nissen, S.E.; Rader, D.J. Cholesterol Efflux Capacity and Pre-Beta-1 HDL Concentrations Are Increased in Dyslipidemic Patients Treated with Evacetrapib. J. Am. Coll. Cardiol. 2015, 66, 2201–2210. [Google Scholar] [CrossRef] [PubMed]
- Williams, P.T.; Krauss, R.M.; Nichols, A.V.; Vranizan, K.M.; Wood, P.D. Identifying the predominant peak diameter of high-density and low-density lipoproteins by electrophoresis. J. Lipid Res. 1990, 31, 1131–1139. [Google Scholar] [CrossRef] [PubMed]
- Cho, K.H. The Current Status of Research on High-Density Lipoproteins (HDL): A Paradigm Shift from HDL Quantity to HDL Quality and HDL Functionality. Int. J. Mol. Sci. 2022, 23, 3967. [Google Scholar] [CrossRef] [PubMed]
- Fisher, E.A.; Feig, J.E.; Hewing, B.; Hazen, S.L.; Smith, J.D. High-density lipoprotein function, dysfunction, and reverse cholesterol transport. Arterioscler. Thromb. Vasc. Biol. 2012, 32, 2813–2820. [Google Scholar] [CrossRef] [PubMed]
- Muñoz-Vega, M.; Massó, F.; Páez, A.; Vargas-Alarcón, G.; Coral-Vázquez, R.; Mas-Oliva, J.; Carreón-Torres, E.; Pérez-Méndez, Ó. HDL-Mediated Lipid Influx to Endothelial Cells Contributes to Regulating Intercellular Adhesion Molecule (ICAM)-1 Expression and eNOS Phosphorylation. Int. J. Mol. Sci. 2018, 19, 3394. [Google Scholar] [CrossRef] [PubMed]
- Sreckovic, I.; Birner-Gruenberger, R.; Obrist, B.; Stojakovic, T.; Scharnagl, H.; Holzer, M.; Scholler, M.; Philipose, S.; Marsche, G.; Lang, U.; et al. Distinct composition of human fetal HDL attenuates its anti-oxidative capacity. Biochim. Biophys. Acta 2013, 1831, 737–746. [Google Scholar] [CrossRef]
- Averna, M.R.; Barbagallo, C.M.; Di Paola, G.; Labisi, M.; Pinna, G.; Marino, G.; Dimita, U.; Notarbartolo, A. Lipids, lipoproteins and apolipoproteins AI, AII, B, CII, CIII and E in newborns. Biol. Neonate 1991, 60, 187–192. [Google Scholar] [CrossRef]
- Stadler, J.T.; Wadsack, C.; Marsche, G. Fetal High-Density Lipoproteins: Current Knowledge on Particle Metabolism, Composition and Function in Health and Disease. Biomedicines 2021, 9, 349. [Google Scholar] [CrossRef]
- Moestrup, S.K.; Nielsen, L.B. The role of the kidney in lipid metabolism. Curr. Opin. Lipidol. 2005, 16, 301–306. [Google Scholar] [CrossRef] [PubMed]
- Glass, C.K.; Pittman, R.C.; Keller, G.A.; Steinberg, D. Tissue sites of degradation of apoprotein A-I in the rat. J. Biol. Chem. 1983, 258, 7161–7167. [Google Scholar] [CrossRef] [PubMed]
- Yang, H.; Fogo, A.B.; Kon, V. Kidneys: Key modulators of high-density lipoprotein levels and function. Curr. Opin. Nephrol. Hypertens. 2016, 25, 174–179. [Google Scholar] [CrossRef] [PubMed]
- Aseem, O.; Smith, B.T.; Cooley, M.A.; Wilkerson, B.A.; Argraves, K.M.; Remaley, A.T.; Argraves, W.S. Cubilin maintains blood levels of HDL and albumin. J. Am. Soc. Nephrol. 2014, 25, 1028–1036. [Google Scholar] [CrossRef] [PubMed]
- Christensen, E.I.; Verroust, P.J.; Nielsen, R. Receptor-mediated endocytosis in renal proximal tubule. Pflugers Arch. 2009, 458, 1039–1048. [Google Scholar] [CrossRef] [PubMed]
- Vaziri, N.D. HDL abnormalities in nephrotic syndrome and chronic kidney disease. Nat. Rev. Nephrol. 2016, 12, 37–47. [Google Scholar] [CrossRef] [PubMed]
- López-Olmos, V.; Carreón-Torres, E.; Luna-Luna, M.; Flores-Castillo, C.; Martínez-Ramírez, M.; Bautista-Pérez, R.; Franco, M.; Sandoval-Zárate, J.; Roldán, F.J.; Aranda-Fraustro, A.; et al. Increased HDL Size and Enhanced Apo A-I Catabolic Rates Are Associated With Doxorubicin-Induced Proteinuria in New Zealand White Rabbits. Lipids 2016, 51, 311–320. [Google Scholar] [CrossRef]
- Soto-Miranda, E.; Carreón-Torres, E.; Lorenzo, K.; Bazán-Salinas, B.; García-Sánchez, C.; Franco, M.; Posadas-Romero, C.; Fragoso, J.M.; López-Olmos, V.; Madero, M.; et al. Shift of high-density lipoprotein size distribution toward large particles in patients with proteinuria. Clin. Chim. Acta 2012, 414, 241–245. [Google Scholar] [CrossRef]
- Toledo-Ibelles, P.; Franco, M.; Carreón-Torres, E.; Luc, G.; Tailleux, A.; Vargas-Alarcón, G.; Fragoso, J.M.; Aguilar-Salinas, C.; Luna-Luna, M.; Pérez-Méndez, O. Normal HDL-apo AI turnover and cholesterol enrichment of HDL subclasses in New Zealand rabbits with partial nephrectomy. Metabolism 2013, 62, 492–498. [Google Scholar] [CrossRef]
- García-Sánchez, C.; Torres-Tamayo, M.; Juárez-Meavepeña, M.; López-Osorio, C.; Toledo-Ibelles, P.; Monter-Garrido, M.; Cruz-Robles, D.; Carreón-Torres, E.; Vargas-Alarcón, G.; Pérez-Méndez, O. Lipid plasma concentrations of HDL subclasses determined by enzymatic staining on polyacrylamide electrophoresis gels in children with metabolic syndrome. Clin. Chim. Acta 2011, 412, 292–298. [Google Scholar] [CrossRef]
- Romagnani, P.; Remuzzi, G.; Glassock, R.; Levin, A.; Jager, K.J.; Tonelli, M.; Massy, Z.; Wanner, C.; Anders, H.J. Chronic kidney disease. Nat. Rev. Dis. Primers 2017, 3, 17088. [Google Scholar] [CrossRef] [PubMed]
- Noels, H.; Lehrke, M.; Vanholder, R.; Jankowski, J. Lipoproteins and fatty acids in chronic kidney disease: Molecular and metabolic alterations. Nat. Rev. Nephrol. 2021, 17, 528–542. [Google Scholar] [CrossRef] [PubMed]
- Brown, M.S.; Goldstein, J.L. A receptor-mediated pathway for cholesterol homeostasis. Science 1986, 232, 34–47. [Google Scholar] [CrossRef] [PubMed]
- Wuttiputhanun, T.; Udomkarnjananun, S.; Hanprathet, N.; Jiamjarasrangsi, W.; Townamchai, N.; Avihingsanon, Y.; Katavetin, P. Metabolic effects of kidney donation: A Bayesian analysis of matched cohorts. Nephrology 2023, 28, 148–153. [Google Scholar] [CrossRef] [PubMed]
- Bowe, B.; Xie, Y.; Xian, H.; Balasubramanian, S.; Al-Aly, Z. Low levels of high-density lipoprotein cholesterol increase the risk of incident kidney disease and its progression. Kidney Int. 2016, 89, 886–896. [Google Scholar] [CrossRef] [PubMed]
- Nam, K.H.; Chang, T.I.; Joo, Y.S.; Kim, J.; Lee, S.; Lee, C.; Yun, H.R.; Park, J.T.; Yoo, T.H. KNOW-CKD (KoreaN Cohort Study for Outcomes in Patients With Chronic Kidney Disease) Investigators; et al. Association Between Serum High-Density Lipoprotein Cholesterol Levels and Progression of Chronic Kidney Disease: Results From the KNOW-CKD. J. Am. Heart Assoc. 2019, 8, e011162. [Google Scholar] [CrossRef] [PubMed]
- Melsom, T.; Norvik, J.V.; Enoksen, I.T.; Stefansson, V.; Rismo, R.; Jenssen, T.; Solbu, M.D.; Eriksen, B.O. Association of High-Density Lipoprotein Cholesterol With GFR Decline in a General Nondiabetic Population. Kidney Int. Rep. 2021, 6, 2084–2094. [Google Scholar] [CrossRef] [PubMed]
- National Research Council (US) Institute for Laboratory Animal Research. Guide for the Care and Use of Laboratory Animals; National Academic Press (USA): Washington, DC, USA, 1996.
- Flores-Castillo, C.; Luna-Luna, M.; Carreón-Torres, E.; López-Olmos, V.; Frías, S.; Juárez-Oropeza, M.A.; Franco, M.; Fragoso, J.M.; Vargas-Alarcón, G.; Pérez-Méndez, Ó. Atorvastatin and Fenofibrate Increase the Content of Unsaturated Acyl Chains in HDL and Modify In Vivo Kinetics of HDL-Cholesteryl Esters in New Zealand White Rabbits. Int. J. Mol. Sci. 2019, 20, 2521. [Google Scholar] [CrossRef]
- Rashid, S.; Uffelman, K.D.; Barrett, P.H.; Lewis, G.F. Effect of atorvastatin on high-density lipoprotein apolipoprotein A-I production and clearance in the New Zealand white rabbit. Circulation 2002, 106, 2955–2960. [Google Scholar] [CrossRef]
- Brousseau, M.E.; Santamarina-Fojo, S.; Zech, L.A.; Bérard, A.M.; Vaisman, B.L.; Meyn, S.M.; Powell, D.; Brewer, H.B., Jr.; Hoeg, J.M. Hyperalphalipoproteinemia in human lecithin cholesterol acyltransferase transgenic rabbits. In vivo apolipoprotein A-I catabolism is delayed in a gene dose-dependent manner. J. Clin. Investig. 1996, 97, 1844–1851. [Google Scholar] [CrossRef]


| Sham (n = 6) | Ntx (n = 6) | |
|---|---|---|
| Total cholesterol (mmol/L) | 1.18 (0.86–1.39) | 1.89 (1.42–2.04) * |
| Triglycerides (mmol/L) | 1.19 (1.0–1.32) | 0.99 (0.80–1.18) |
| HDL-cholesterol (mmol/L) | 0.74 (0.67–0.78) | 1.00 (0.78–1.14) * |
| HDL-free cholesterol (mmol/L) | 0.15 (0.13–0.17) | 0.17 (0.16–0.22) |
| HDL-cholesteryl esters (mmol/L) | 0.59 (0.50–0.63) | 0.80 (0.62–1.04) * |
| HDL-triglycerides (mmol/L) | 0.18 (0.16–0.19) | 0.23 (0.19–0.26) * |
| HDL-phospholipids (mmol/L) | 0.84 (0.63–1.08) | 0.89 (0.85–1.50) |
| Non-HDL-cholesterol (mmol/L) | 0.45 (0.12–0.73) | 0.92 (0.70–1.64) * |
| Glucose (mmol/L) | 7.40 (7.03–7.63) | 6.89 (6.76–7.00) |
| Urea (mg/dL) | 40.22 (35.87–45.49) | 60.85 (56.67–71.69) * |
| Creatinine (mg/dL) | 2.06 (1.95–2.10) | 2.98 (2.61–3.34) * |
| Creatinine clearance (mL/min) | 4.29 (3.19–4.59) | 1.55 (1.26–2.23) * |
| Proteinuria (g/24 h) | 0.13 (0.10–0.28) | 0.19 (0.15–0.26) |
| Lipid | Subclasses | ||||
|---|---|---|---|---|---|
| HDL 2b | HDL 2a | HDL 3a | HDL 3b | HDL 3c | |
| TC/PH Sham | 1.11 (0.53–1.31) | 1–09 (0.85–1.45) | 0.88 (0.63–1.06) | 0.84 (0.66–1.25) | 0.63 (0.58–0.77) |
| TC/PH Ntx | 1.18 (0.96–1.63) | 1.21 (0.89–1.65) | 1.15 (0.87–1.62) | 1.72 (1.27–2.39) * | 1.19 (0.91–1.66) * |
| FC/PH Sham | 0.22 (0.15–0.27) | 0.25 (0.16–0.28) | 0.19 (0.14–0.25) | 0.18 (0.15–0.22) | 0.16 (0.14–0.20) |
| FC/PH Ntx | 0.18 (0.16–0.26) | 0.21 (0.19–0.31) | 0.22 (0.20–0.32) | 0.31 (0.23–0.48) * | 0.20 (0.09–0.30) |
| CE/PH Sham | 0.89 (0.38–1.04) | 0.83 (0.70–1.13) | 0.72 (0.46–0.81) | 0.66 (0.50–1.04) | 0.48 (0.43–0.58) |
| CE/PH Ntx | 1.01 (0.77–1.39) | 1.00 (0.70–1.34) | 0.94 (0.66–1.30) | 1.47 (0.94–1.91) * | 0.99 (0.81–1.33) * |
| TG/PH Sham | 0.25 (0.16–0.28) | 0.22 (0.19–0.31) | 0.18 (0.15–0.23) | 0.21 (0.18–0.28) | 0.23 (0.20–0.25) |
| TG/PH Ntx | 0.21 (0.17–0.33) | 0.20 (0.16–0.33) | 0.22 (0.17–0.35) | 0.33 (0.26–0.60) | 0.33 (0.24–0.41) |
Disclaimer/Publisher’s Note: The statements, opinions and data contained in all publications are solely those of the individual author(s) and contributor(s) and not of MDPI and/or the editor(s). MDPI and/or the editor(s) disclaim responsibility for any injury to people or property resulting from any ideas, methods, instructions or products referred to in the content. |
© 2023 by the authors. Licensee MDPI, Basel, Switzerland. This article is an open access article distributed under the terms and conditions of the Creative Commons Attribution (CC BY) license (https://creativecommons.org/licenses/by/4.0/).
Share and Cite
Luna-Luna, M.; Franco, M.; Carreón-Torres, E.; Pérez-Hernández, N.; Fragoso, J.M.; Bautista-Pérez, R.; Pérez-Méndez, Ó. Total Outflow of High-Density Lipoprotein–Cholesteryl Esters from Plasma Is Decreased in a Model of 3/4 Renal Mass Reduction. Int. J. Mol. Sci. 2023, 24, 17090. https://doi.org/10.3390/ijms242317090
Luna-Luna M, Franco M, Carreón-Torres E, Pérez-Hernández N, Fragoso JM, Bautista-Pérez R, Pérez-Méndez Ó. Total Outflow of High-Density Lipoprotein–Cholesteryl Esters from Plasma Is Decreased in a Model of 3/4 Renal Mass Reduction. International Journal of Molecular Sciences. 2023; 24(23):17090. https://doi.org/10.3390/ijms242317090
Chicago/Turabian StyleLuna-Luna, María, Martha Franco, Elizabeth Carreón-Torres, Nonanzit Pérez-Hernández, José Manuel Fragoso, Rocío Bautista-Pérez, and Óscar Pérez-Méndez. 2023. "Total Outflow of High-Density Lipoprotein–Cholesteryl Esters from Plasma Is Decreased in a Model of 3/4 Renal Mass Reduction" International Journal of Molecular Sciences 24, no. 23: 17090. https://doi.org/10.3390/ijms242317090
APA StyleLuna-Luna, M., Franco, M., Carreón-Torres, E., Pérez-Hernández, N., Fragoso, J. M., Bautista-Pérez, R., & Pérez-Méndez, Ó. (2023). Total Outflow of High-Density Lipoprotein–Cholesteryl Esters from Plasma Is Decreased in a Model of 3/4 Renal Mass Reduction. International Journal of Molecular Sciences, 24(23), 17090. https://doi.org/10.3390/ijms242317090