Article

Plant Metabolites Affect Fusarium proliferatum Metabolism and In Vitro Fumonisin Biosynthesis

by
Justyna Lalak-Kańczugowska
1,†,
Natalia Witaszak
2,†,
Agnieszka Waśkiewicz
3,
Jan Bocianowski
4 and
Łukasz Stępień
2,*
1
Institute of Bioorganic Chemistry, Polish Academy of Sciences, 61-704 Poznań, Poland
2
Institute of Plant Genetics, Polish Academy of Sciences, 60-479 Poznań, Poland
3
Department of Chemistry, Poznań University of Life Sciences, 60-625 Poznań, Poland
4
Department of Mathematical and Statistical Methods, Poznań University of Life Sciences, 60-637 Poznań, Poland
*
Author to whom correspondence should be addressed.
These authors contributed equally to this work.
Int. J. Mol. Sci. 2023, 24(3), 3002; https://doi.org/10.3390/ijms24033002
Submission received: 17 November 2022 / Revised: 18 January 2023 / Accepted: 1 February 2023 / Published: 3 February 2023

Abstract

:
Fusarium proliferatum is a common hemi-biotrophic pathogen that infect a wide range of host plants, often leading to substantial crop loss and yield reduction. F. proliferatum synthesizes various mycotoxins, and fumonisins B are the most prevalent. They act as virulence factors and specific effectors that elicit host resistance. The effects of selected plant metabolites on the metabolism of the F. proliferatum strain were analyzed in this study. Quercetin-3-glucoside (Q-3-Glc) and kaempferol-3-rutinoside (K-3-Rut) induced the pathogen’s growth, while DIMBOA, isorhamnetin-3-O-rutinoside (Iso-3-Rut), ferulic acid (FA), protodioscin, and neochlorogenic acid (NClA) inhibited fungal growth. The expression of seven F. proliferatum genes related to primary metabolism and four FUM genes was measured using RT-qPCR upon plant metabolite addition to liquid cultures. The expression of CPR6 and SSC1 genes was induced 24 h after the addition of chlorogenic acid (ClA), while DIMBOA and protodioscin reduced their expression. The transcription of FUM1 on the third day of the experiment was increased by all metabolites except for Q-3-Glc when compared to the control culture. The expression of FUM6 was induced by protodioscin, K-3-Rut, and ClA, while FA and DIMBOA inhibited its expression. FUM19 was induced by all metabolites except FA. The highest concentration of fumonisin B1 (FB1) in control culture was 6.21 µg/mL. Protodioscin did not affect the FB content, while DIMBOA delayed their synthesis/secretion. Flavonoids and phenolic acids displayed similar effects. The results suggest that sole metabolites can have lower impacts on pathogen metabolism and mycotoxin synthesis than when combined with other compounds present in plant extracts. These synergistic effects require additional studies to reveal the mechanisms behind them.

1. Introduction

Fusarium proliferatum is a common hemi-biotrophic pathogen that infects a wide range of host plants including cereals, legumes, and vegetable and fruit crops and can be persistent for many years [1]. When a pathogen encounters a susceptible plant under favorable conditions, the infection often leads to substantial crop loss and yield reduction [2,3,4]. F. proliferatum is mainly transferred and spread by seeds and crop residues. Infection at early seedling stages kills the plant and at later stages results in poor yield [5]. During the infection, F. proliferatum synthesizes secondary metabolites called mycotoxins that weaken the host defense mechanisms. F. proliferatum synthesizes a plethora of mycotoxins, such as beauvericin, fusaproliferin, moniliformin, fusaric acid, and fusarins, but fumonisin B toxins are the most prevalent among them [6]. Some reports indicate that fumonisin B1 is a virulence factor causing FB1-induced cell death, mediated by ROS activation, phytoalexin accumulation, and PR gene overexpression [7,8]. They also act as specific effectors that elicit host systemic acquired resistance (SAR), which mainly involves the activation of the salicylic acid (SA) signaling pathway [9]. Plant metabolites involved in disease resistance are flavonoids, phenylpropanoids, and polyamines. Phenolic compounds including coumaric acid, coumarin, quercetin, etc., are the largest group of plant antioxidant phytochemicals from which many products are synthesized [10].
Several plant secondary metabolites were found to have growth inhibitory effects on many plant-pathogenic fungi and bacteria. These include polyamines, flavonoids, and phytoalexins [11,12,13,14,15,16]. In contrast, some concentrations of plant phenolic compounds can stimulate the growth of Fusarium fungi [17]. Flavonoids help plants to fight the pathogen through various mechanisms and along with polyamines suppress reactive oxygen species (ROS) produced during the infection [18,19,20]. Additionally, flavonoids have an inhibitory effect on trichothecene synthesis by inhibiting cytochrome P450 monooxygenase, which converts trichodiene to oxygenated trichothecenes [21]. Phenolic compounds such as ferulic acid, p-hydroxybenzoic acid, and vanillic acid are proven to reduce the aurofusarin and zearalenone toxin levels in Fusarium species [17]. Phenylpropanoid antifungal properties result in higher resistance levels of plants with high phenylpropanoid content than those with lower ones [22,23,24].
Plant–pathogen interactions comprise a complex process involving actions and reactions. To understand it fully, it is often necessary to examine detailed changes in both organisms during the infection process. Our previous studies on F. proliferatum indicated that an asparagus extract affected FUM gene expression and changed the biosynthesis of fumonisins [1,25,26]. Interestingly, the original research revealed that host extracts are able to exert generally similar effects on the metabolism of F. proliferatum strains regardless of the origin [1]. Further proteomic analyses showed the proteins induced by the asparagus extract [27]. However, it was not sufficient to ultimately explain the metabolic mechanisms of F. proliferatum. Therefore, the aim of this study was to investigate the effect of plant bioactive compounds on fumonisins production, fungal growth, and primary and secondary metabolism of the Fusarium proliferatum strain. Seven genes related to primary metabolism were chosen based on our previous research on the Fusarium proliferatum response to biotic stress [27]: CPR6 (encoding cytosolic cyclophilin), FeSOD (superoxide dismutase), HSP70, HSP88 and SSC1 (heat shock proteins), SpD (saccharopin dehydrogenase), and UOR (NADH-Q oxidoreductase). Additionally, four genes from the FUM biosynthetic gene cluster (FUM1, FUM6, FUM8 and FUM19) were included.

2. Results

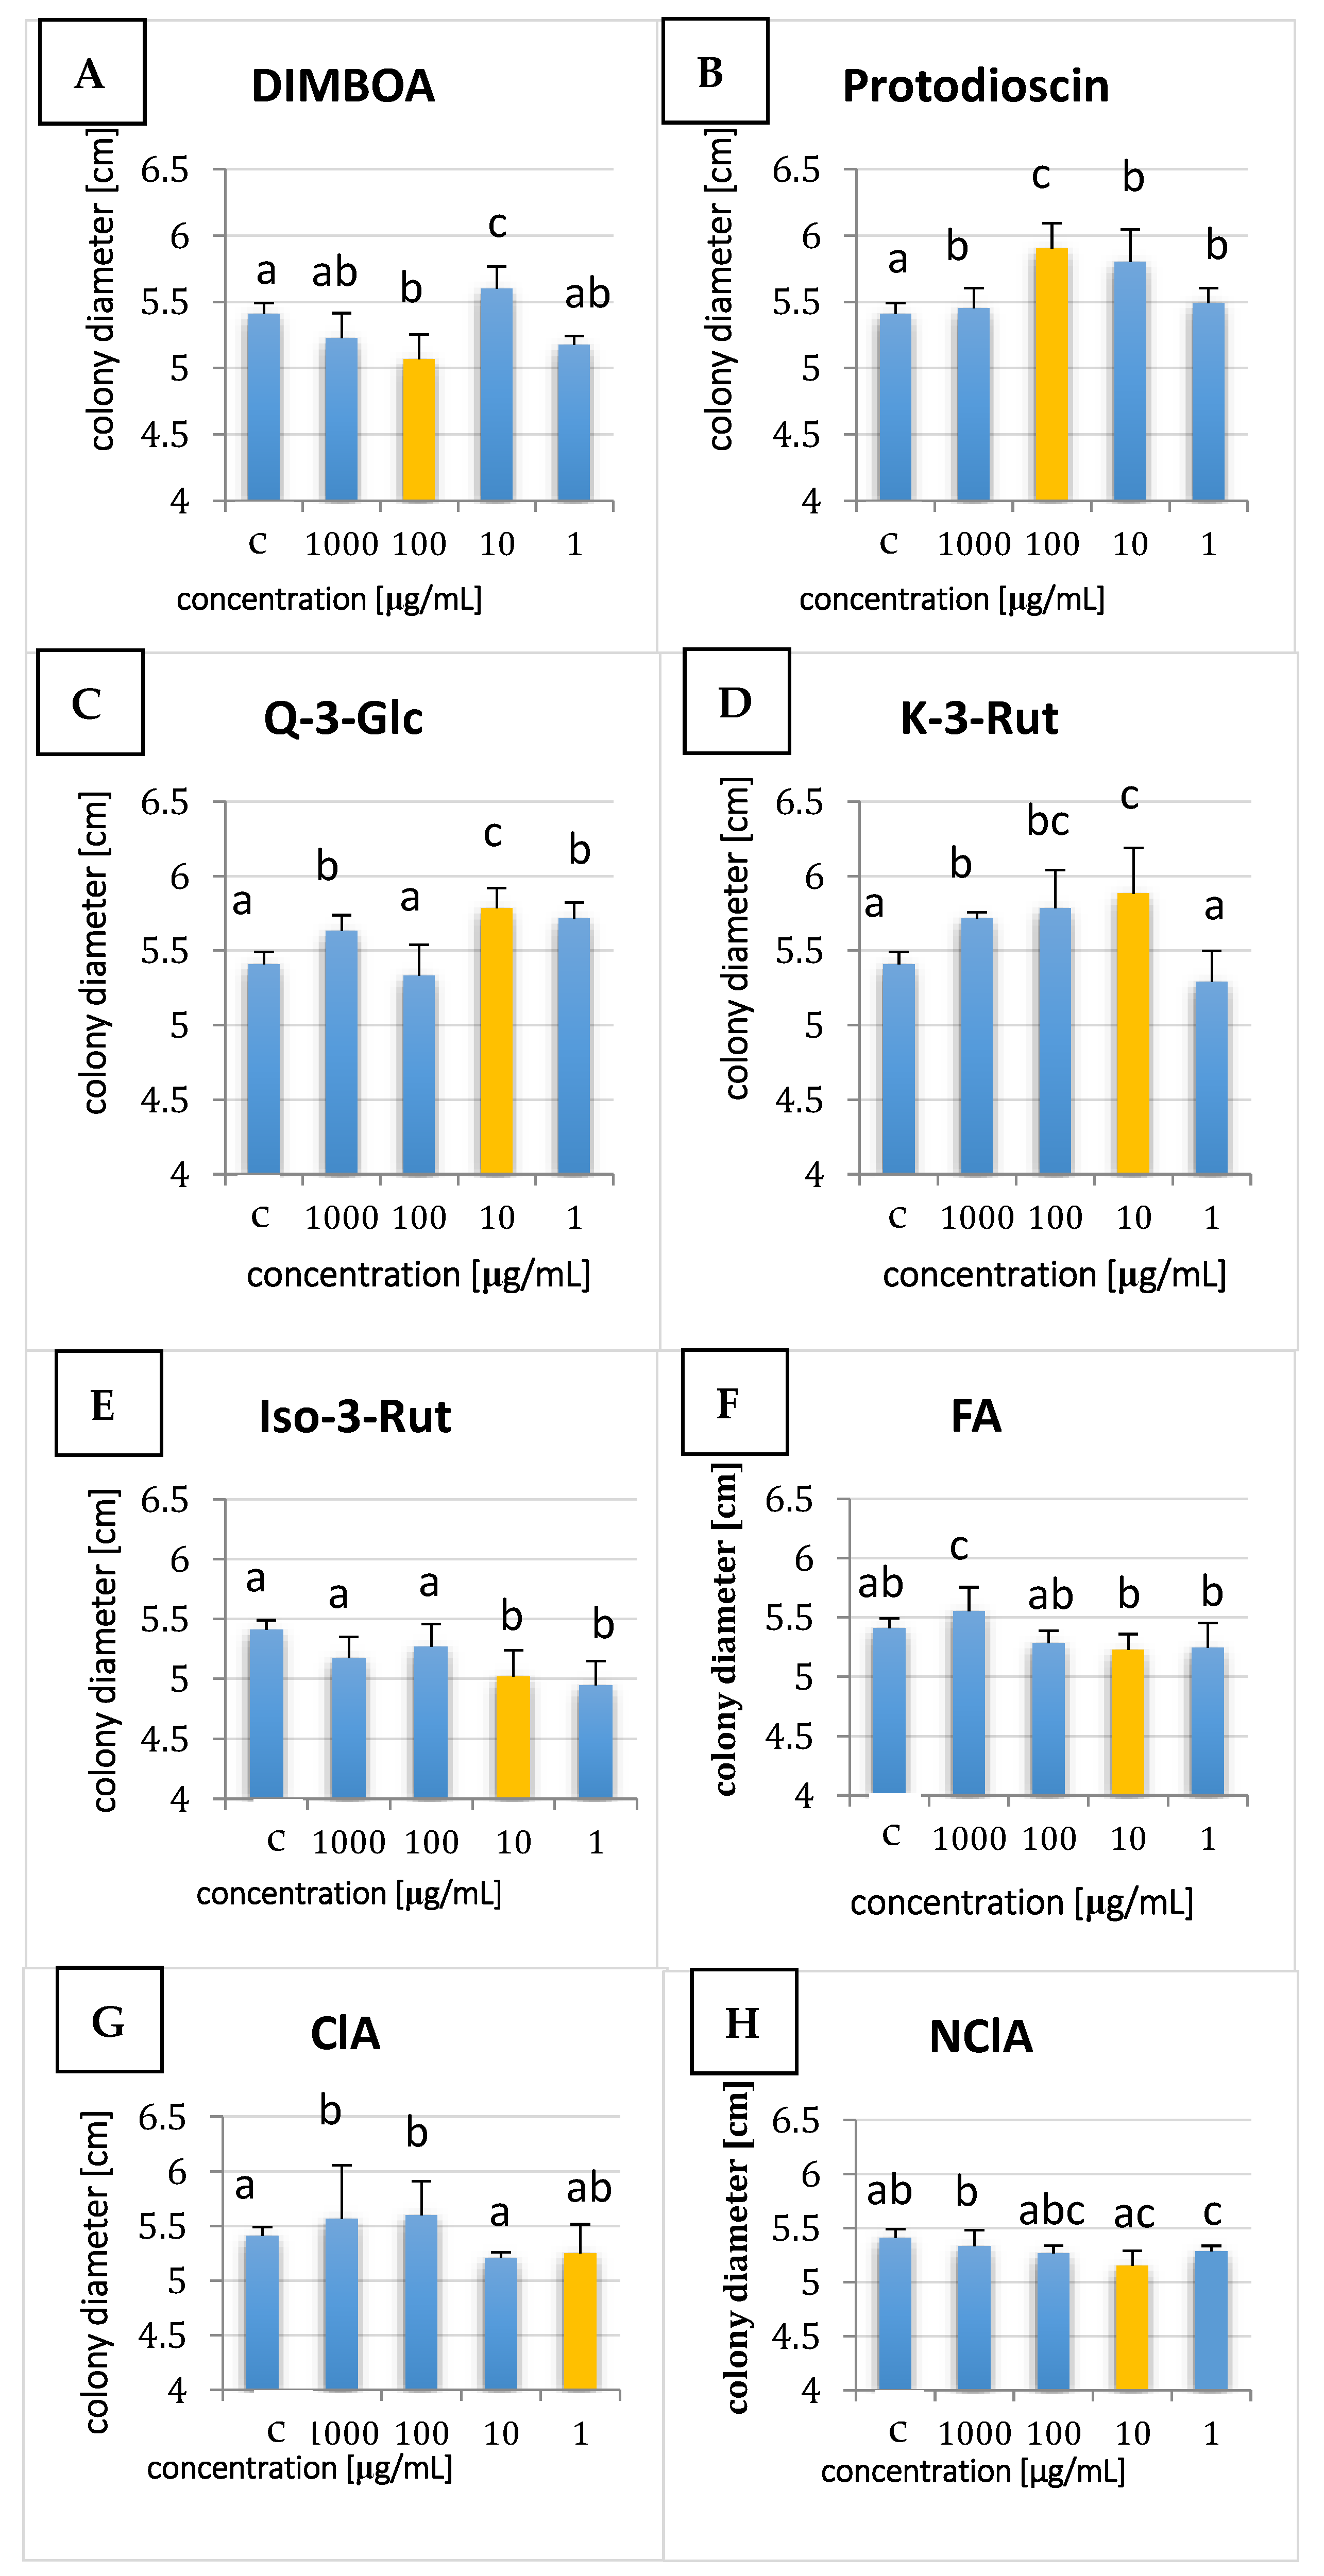
2.1. Effect of Plant Metabolites on Fungal Growth

Eight plant metabolites (Table 1) used in the study were selected on the basis of previous research, as well as based on literature data [28,29,30]. Originally, the metabolites were quantified in asparagus and maize extracts (Figure 1).
Three concentrations were evaluated compared to the control for seven days, and results for the sixth day of culturing are shown in Figure 2. Quercetin-3-glucoside (Q-3-Glc) and kaempferol-3-rutinoside (K-3-Rut) induced growth of KF 3360, but the majority of the metabolites inhibited fungal growth: DIMBOA, isorhamnetin-3-O-rutinoside (Iso-3-Rut), ferulic acid (FA), protodioscin, and neochlorogenic acid (NClA). For chlorogenic acid (ClA), the reaction of the strain was concentration-dependent, and only higher amounts stimulated fungal growth (Figure 2).

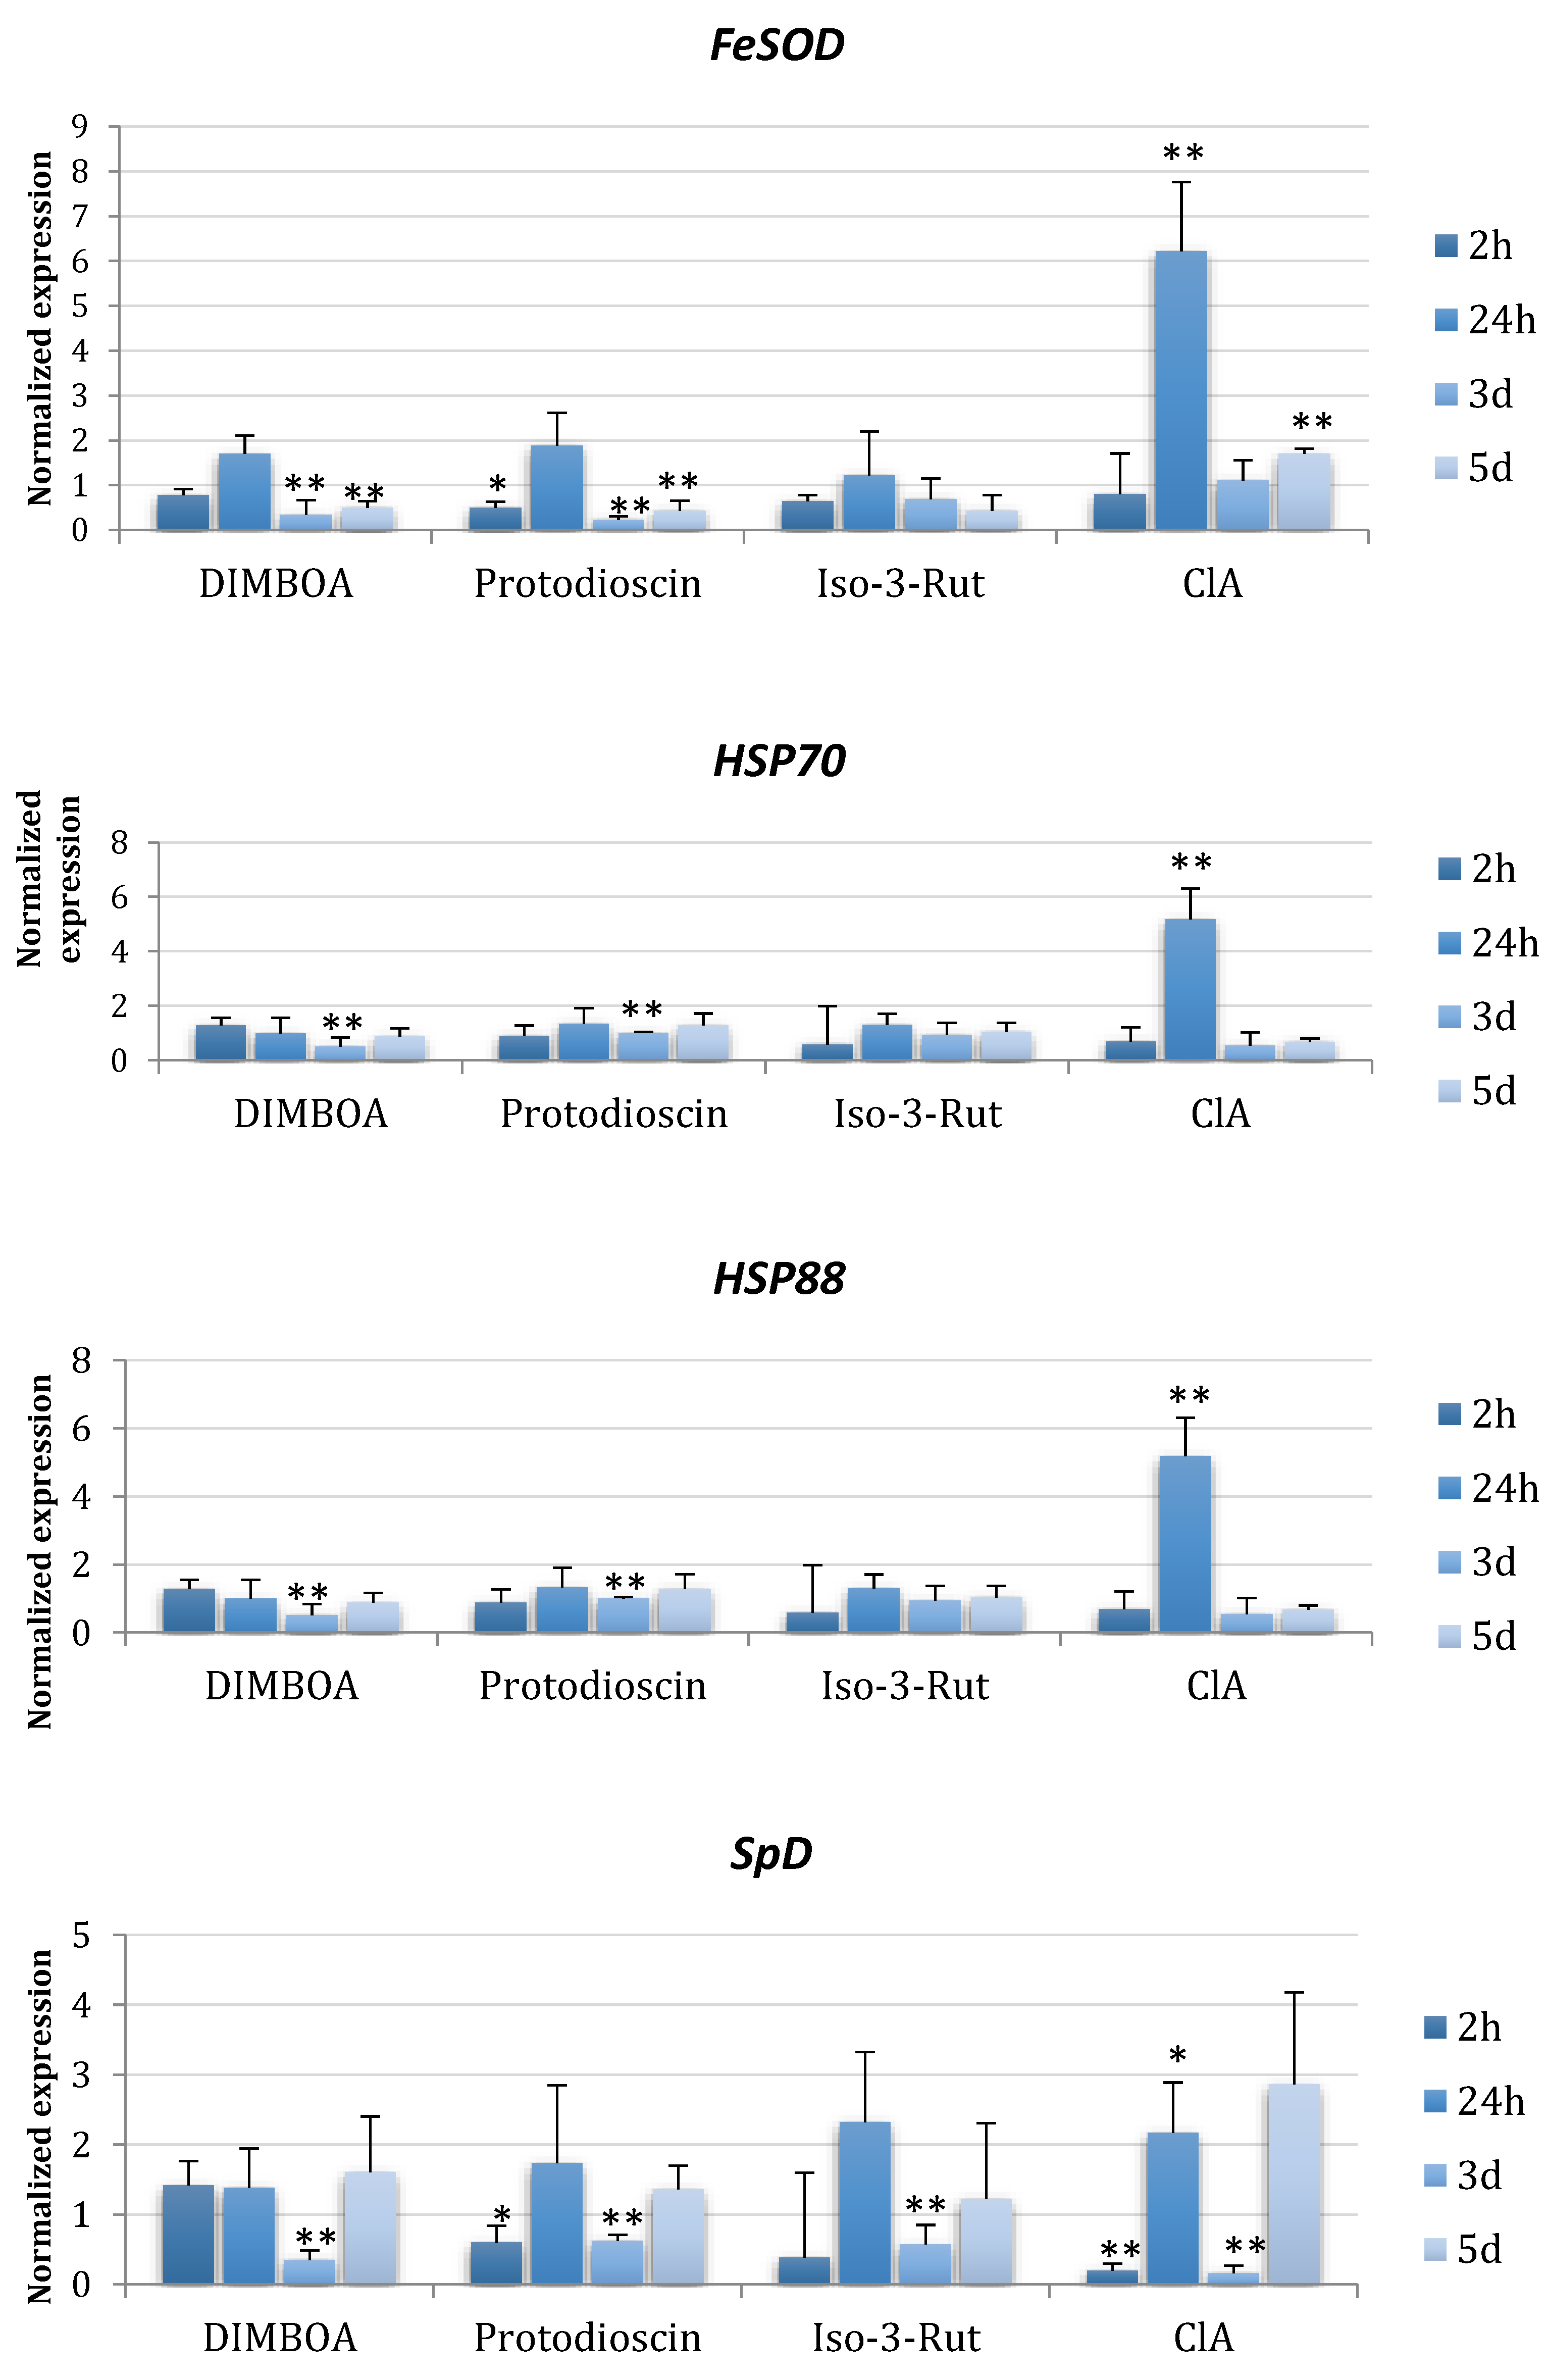
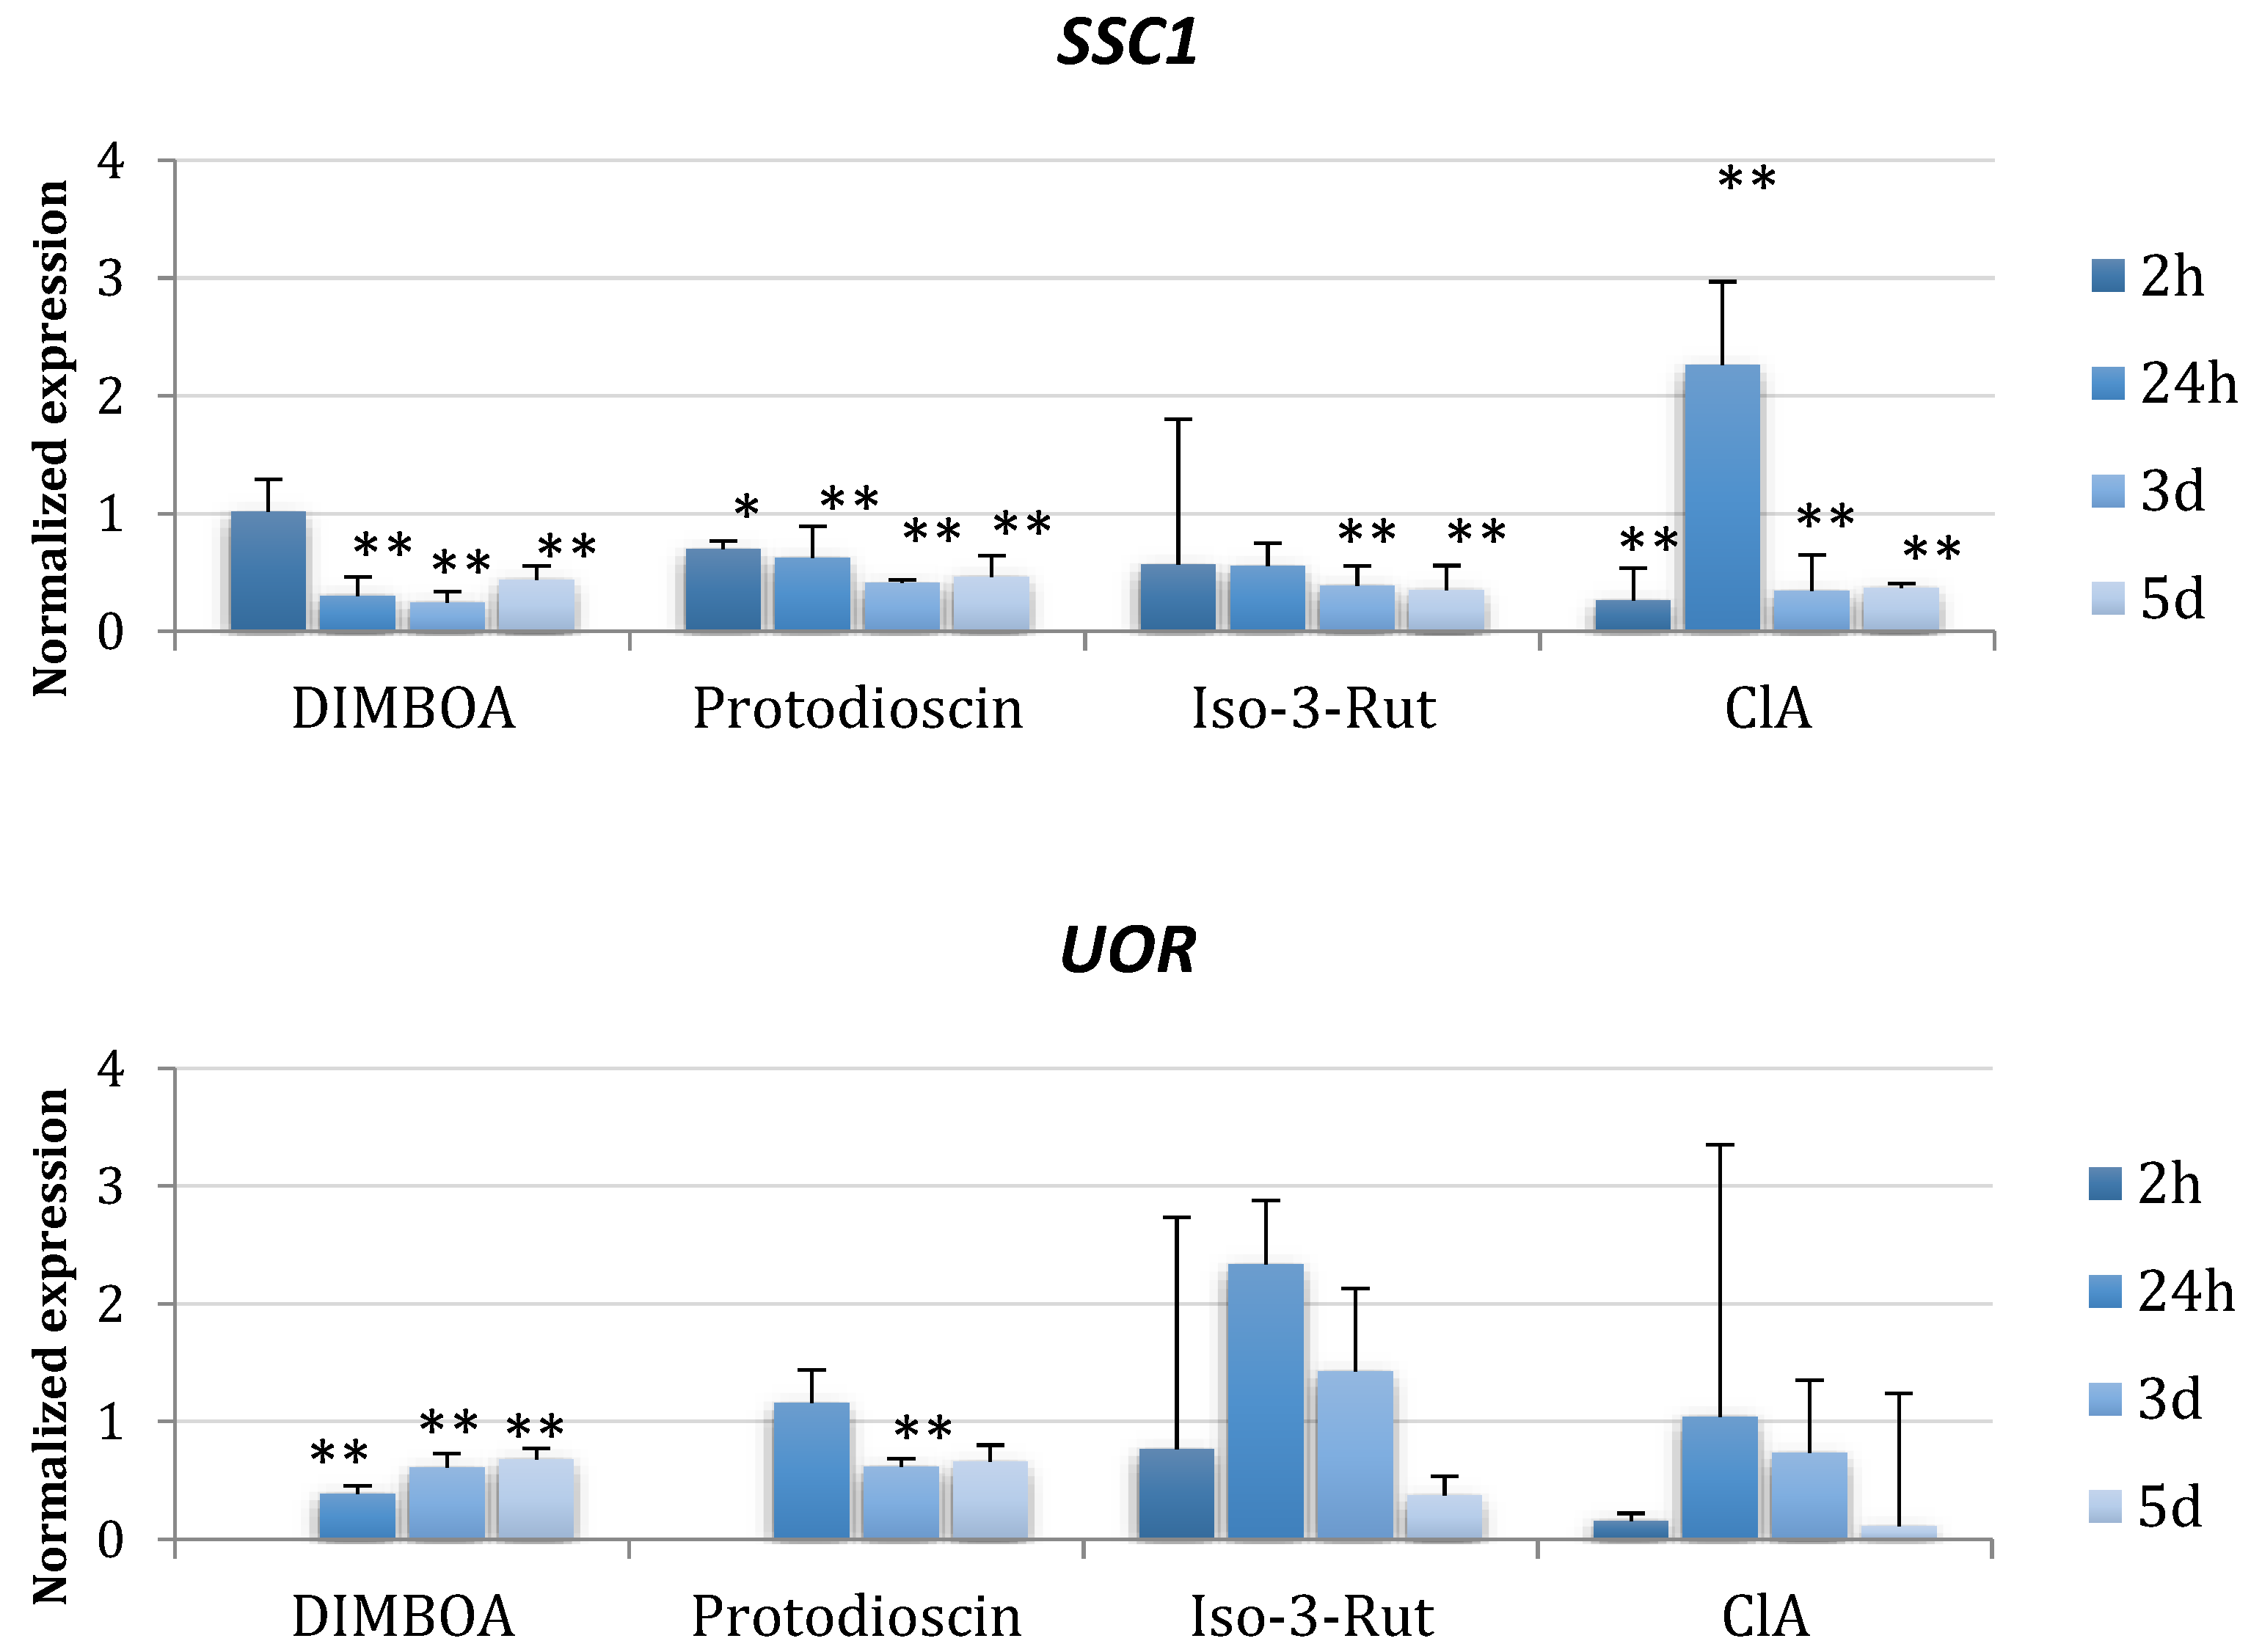
2.2. Expression Changes of Primary Metabolic Genes in the Presence of Plant Metabolites

Expression levels were analyzed for seven F. proliferatum genes related to the primary metabolism (Table 2). Genes were chosen based on previous works [25]. As plant metabolites, protodioscin, isorhamnetin-3-O-rutoside, DIMBOA, and chlorogenic acid were shown here based on fumonisin biosynthesis and FUM gene expression results (see below). For the results obtained using the remaining metabolites, please see Supplementary Tables S1 and S2. For the majority of genes analyzed, the expression levels were lower than the in the control cultures, regardless of the time point (2 h and 1, 3, and 5 days after metabolites were added) (Figure 3, Table S1).
CPR6 and SSC1 genes showed induced expression 24 h after addition of ClA, while DIMBOA and protodioscin reduced their expression (Figure 3). Expression changes induced by chlorogenic acid for FeSOD, HSP88, SpD, and UOR were more evident than for other metabolites. The Hsp88 gene was the least prone to the action of the compounds. Only a slight decrease was observed at day 3 after DIMBOA addition and an increase at day 1 for ClA. Iso-3-Rut did not affect the expression of CPR6, FeSOD, and HSP88 genes substantially. On the other hand, UOR gene expression was lowered by DIMBOA and protodioscin and induced by Iso-3-Rut at day 1 and 3.

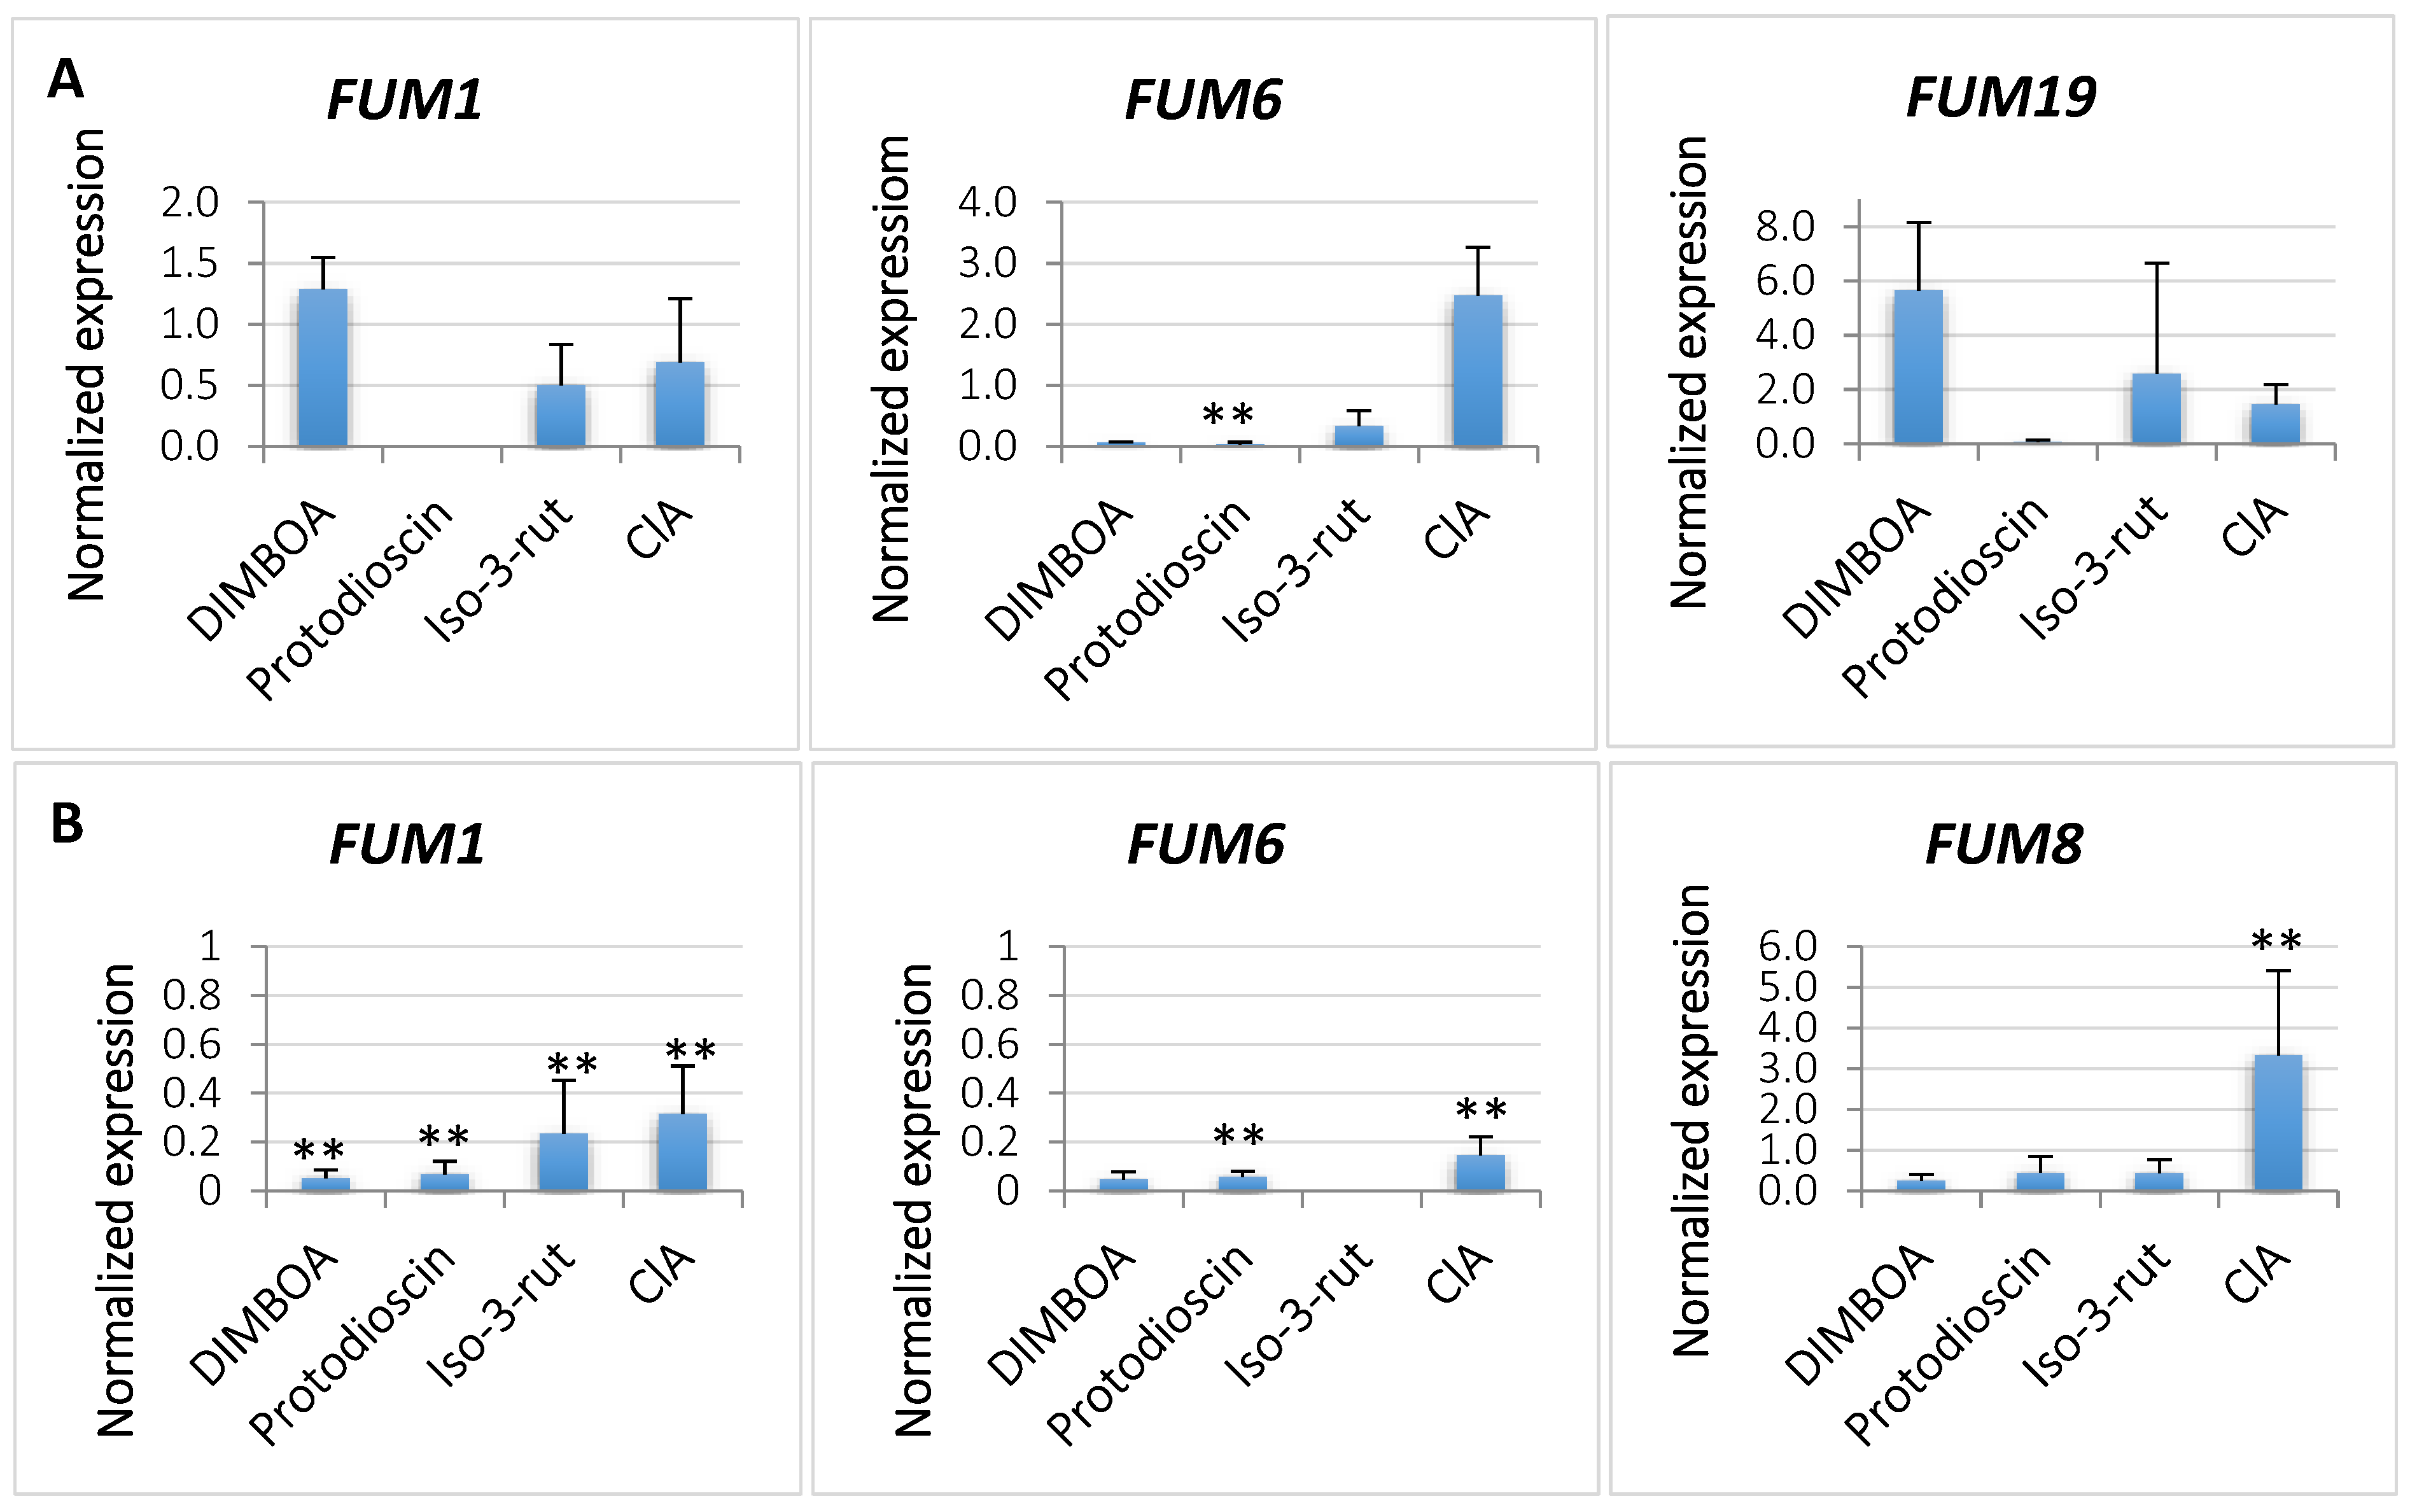
2.3. Expression of FUM Genes Governing Fumonisin Biosynthesis

Samples collected on day 3 and 5 of culturing were subjected to the RT-qPCR analysis of four FUM genes. Transcription of FUM1 on day 3 was increased by all metabolites except Q-3-Glc when compared to the control culture (Figure 4, Supplementary Table S2). For FUM6 the situation was different. It was induced by protodioscin, K-3-Rut, and ClA, while FA and DIMBOA inhibited its expression. FUM19 was induced by all metabolites except FA but only on day 3, because on day 5 the expression was not observed. In general, all FUM genes displayed lower expression on day 5 compared to the controls, except for FUM8 (Figure 4, Supplementary Table S2).

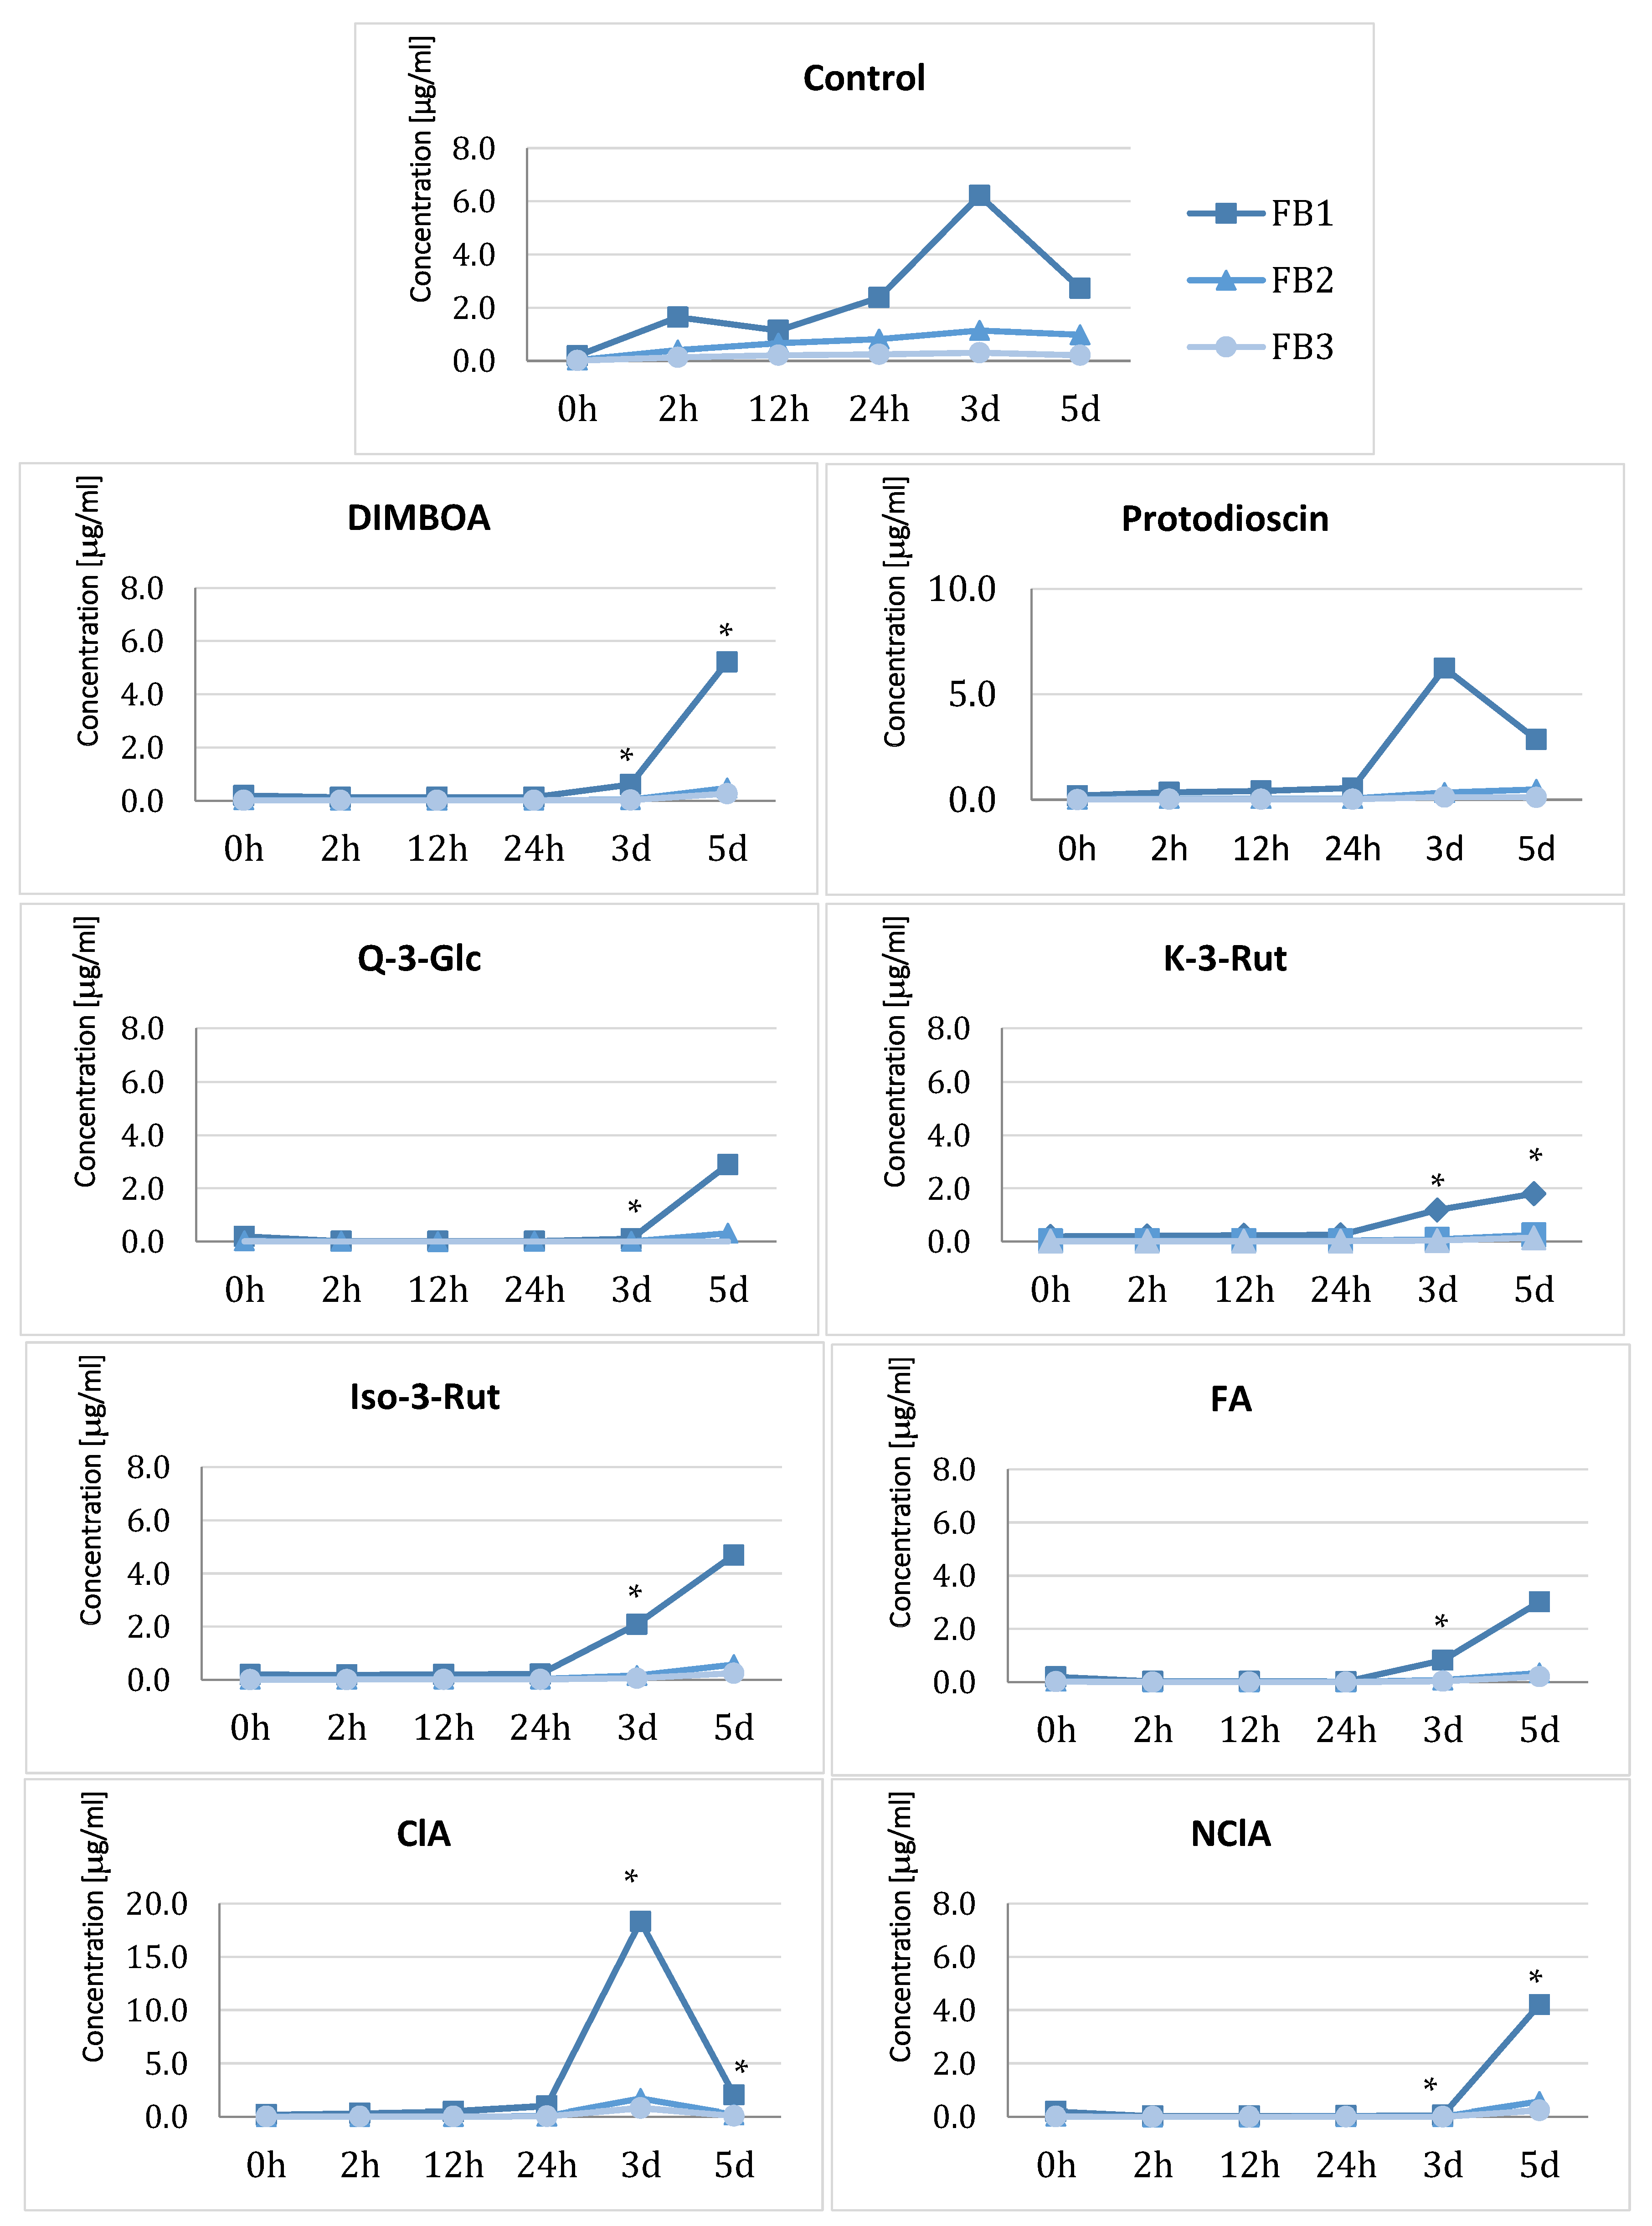
2.4. Effect of Plant Metabolites on Fumonisins Biosynthesis

Fumonisin contents in control culture media increased already 12 h after starting the experiment, and at day 3 the highest concentration of FB1 observed was 6.21 µg/mL (Figure 5). The addition of plant metabolites to the cultures usually gradually increased the content of FBs in the media. In the cases of DIMBOA, kaempferol-3-rutinoside, isorhamnetin-3-O-rutoside, and ferulic acid, the increase was observed after 24 h of metabolite addition, and for quercetin-3-glucoside and neochlorogenic acid after 3 days. The highest mycotoxin content for the majority of the metabolites was in the range of 4–6 µg/mL and was measured in samples collected on the third day of cultivation (Figure 5). The only exception was chlorogenic acid, which induced significantly fumonisin synthesis, however only at the third day of culture when the medium contained almost 20 µg/mL of FB1.

3. Discussion

Fusarium proliferatum is capable of inhabiting a broad spectrum of host plant species, including maize, garlic, asparagus, pineapple, date palm, and onion [1,3], and this list is growing constantly due to climate change. Consequently, plants also evolve mechanisms to identify and respond to new potential pathogens [31,32]. While extensive research on environmentally friendly disease control microorganisms is well-established, recently, plant-derived extracts and bioactive compounds have gained substantial attention in plant protection studies [14,33,34]. In our previous studies we have shown the characteristics of asparagus extract and its fraction concerning the interaction with F. proliferatum strains and their metabolism [25,26]. Here, based on the quantitative analysis of asparagus and maize extracts, individual metabolites were chosen to analyze their influence on fungal growth, metabolism, and fumonisin synthesis. This process is governed by the FUM gene cluster, which was already well-recognized and described for at least three Fusarium species and also other fungal species [35,36,37,38,39]. The function of individual genes were established and confirmed using knock-out mutants of Fusarium verticillioides, which is being considered as a model producer for this group of mycotoxins [35].
Polyamines and phenolic acids (including flavonoids) are known for their antioxidant properties, though members of these two groups vary in anti-oxidative potential due to the structure and number of moieties attached. Glycosylation of flavonoids increases their solubility in water, which facilitates the transport but reduces chemical reactivity at the same time [40]. Double-glycosylated Iso-3-Rut and K-3-Rut show less anti-oxidant ability than single-glycosylated Q-3-Glc.
It was proven that phenolic compounds such as p-hydroxybenzoic acid, rutin, quercetin, and vanillic acid change the metabolism of Fusarium species in a dose-dependent manner, and the fungal response is not species-specific [14]. This, however, was not fully confirmed in our study, as amounts of fungal biomass did not differ significantly in cultures with various concentrations of plant metabolites (Figure 2).
Our previous studies showed that F. proliferatum metabolism changes upon the addition of host plant extracts [1,25,27]. However, individual metabolites present in those extracts were not tested until now. The regulation of primary metabolism is a complex issue; however, it could be proven that F. proliferatum HSP70 and SOD proteins (encoded by the genes studied also in the present study) are expressed differentially in relation to the pH and phenolic compound content in the medium [41].
Fumonisin biosynthesis was differentially affected by the metabolites tested (Figure 5). Although some researchers found a good correlation between FUM gene expression and fumonisin content [42], we were not able to confirm it, possibly due to the methodology used, because the expression of the genes was measured for mycelia, while fumonisins were only quantified in the culture media. It is known that substrate composition is related with the amounts of fumonisins synthesized [43,44,45,46], and it is critical for the comparison of the results of individual studies [47]. Moreover, low concentrations of FBs in the media and simultaneous higher expression of FUM genes may be explained by the inhibition of mycotoxin excretion or their accumulation in intracellular compartments, giving the protection against oxidative stress [47,48]. A similar effect was recorded for F. verticillioides, where plant extract fractions inhibited FB biosynthesis without impairing its growth [49]. The increased accumulation of FBs in mycelia than in media was already observed in our previous studies [25].
In the present study, protodioscin did not affect the FB content compared to the control culture, while DIMBOA delayed their synthesis/secretion. Flavonoids and phenolic acids displayed similar effects. This is in agreement with the results of Ferrochio et al. [16], who found FBs and growth inhibition by ferulic acid at concentrations higher than 20 mM. In addition, in F. sporotrichioides and F. langsethiae, ferulic acid influenced the biosynthesis of T-2 and HT-2 toxins and the expression of the TRI gene cluster responsible for trichothecene biosynthesis [50]. On the other hand, there are reports stating that low concentrations of ferulic, cinnamic, and caffeic acids inhibit fumonisins but not growth of the mycelium [51]. These discrepancies are perhaps due to variation of culture media and metabolite concentrations. It has been suggested that resistance to pathogens may be associated with a higher content of phenylpropanoids [19,20,52,53]. Similarly, a deficit of saponins can lead to lower plant resistance [54]. Phenolic compounds (such as ferulic acid and p-coumaric acid) protect plant cell wall components from being degraded by a pathogen’s hydrolytic enzymes [55], which limits the fungal spread [17,21,56]. Future studies should evaluate the possible synergistic effects of individual metabolites, as well as the action of their derivatives, as a possible role of some of the tested metabolites (such as chlorogenic acid and quercetin) in plant resistance to fungal infection was already suggested [57].

4. Materials and Methods

4.1. Fungal Strain and Culture Conditions

Fusarium proliferatum strain KF3360 was originally isolated from asparagus spear in 2009 in Poland, and it was stored in the KF collection of pathogenic fungi at the Institute of Plant Genetics, Polish Academy of Sciences, Poznań, Poland. The strain was identified using molecular techniques during previous studies [1] and maintained on potato dextrose agar (PDA, Oxoid, Basingstoke, UK) medium at 25 °C for 7 days.

4.2. Plant Extract Preparation

Water extracts were prepared from white asparagus spears and young maize cobs according to the procedure described earlier [1]. Fresh white asparagus spears and young maize cobs without any disease symptoms were frozen overnight at −80 °C and homogenized the next day in a blender. The obtained mass was centrifuged at 6000× g for 15 min at 4 °C. Extracts were filtered through 0.20 μm membrane (Chromafil PET20/15 MS, Macherey-Nagel, Dueren, Germany) and stored at –20 °C.

4.3. Growth Rate Measurement

Fusarium proliferatum KF 3360 strain cultures on solid PDA medium were used to evaluate the efficiency of plant metabolites in reducing the fungal growth in vitro. Four arbitrary concentrations of plant metabolite standards, namely, quercetin-3-glucoside, kaempferol-3-rutinoside, isorhamnetin-3-O-rutinoside, ferulic acid, chlorogenic acid, neochlorogenic acid, protodioscin, DIMBOA (all supplied by Sigma Aldrich, Taufkirchen, Germany) were tested (1000, 100, 10, and 1 μg/mL). Sterile 90 mm Petri plates contained 15 mL of PDA medium and were inoculated with a single PDA plug (1 cm2) of mycelium. The solutions of plant metabolites were then applied onto the plug and then incubated for seven days at room temperature with a 12 h photoperiod. The experiment was conducted in triplicate, and colony diameter was measured daily. For protodioscin and DIMBOA, 100 μg/mL concentration was chosen for liquid cultures and 1 μg/mL for chlorogenic acid, while 10 μg/mL was used for the remaining compounds.

4.4. Liquid Cultures with Plant Metabolite Standards

All cultures were conveyed in vitro in 100 mL flasks containing 45 mL of a fumonisin-inducing liquid medium (25 °C without shaking at 12 h photoperiod) [1]. The medium contained yeast extract 1 g/L, malt extract 0.5 g/L, mycological peptone 1 g/L, KH2PO4 1 g/L, MgSO4 × 7 H2O 0.3 g/L, KCl 0.3 g/L, ZnSO4 × 7 H2O 0.05 g/L, CuSO4 × 5 H2O 0.01 g/L, and D-fructose 20 g/L. About 4 cm2 of mycelium harvested of the PDA plates was used for inoculation. At the 5th day of cultivation, the culture was supplemented with 30 μL of plant metabolite standard solutions at the concentration selected based on the growth measurement experiment. The negative control was supplemented with equal amounts of sterile water. Media samples were collected in the following time points: 0 h, 2 h, 24 h, 72 h, and 120 h after metabolites were added to the cultures and subjected to the quantification of fumonisins. All cultures were done in triplicate.

4.5. Mass Spectrometry Analysis

An Acquity UPLC system (Waters Corporation, Milford, MA, USA) combined with a Q-Exactive high-resolution mass spectrometer (Thermo Fisher, Waltham, MA, USA) with an Orbitrap mass analyzer was used. Samples (5 μL) were injected onto an ACQUITY UPLC BEH Shield RP18 column (150 × 2.1 mm, particle size 1.7 μm) (Waters, Manchester, MA, USA), with a flow rate of 0.35 μL min−1 at 50 °C. Mobile phases contained 0.1% (v/v) formic acid in water (A) (LC-MS grade, Merck, Darmstadt, Germany) and acetonitrile (B) (LC–MS grade, Merck). A multi-step linear gradient was as follows: 5% B—1.5 min, 80% B—10.5 min, 98% B—11.5 min, 5% B—13 min.
Mass spectrometry analysis was performed using heated electrospray ionization (H-ESI) in positive and negative modes. A 3.5 kV and 2.5 kV ion spray voltage was applied for positive and negative ionization, respectively. Ion source temperature was 320 °C. Data were acquired in Full MS/data-dependent MS2 mode in the 100–1500 m/z range. The resolution of Full MS was 70,000 and of ddMS2 17,500. Normalized collision energy in the ddMS2 experiment was set to 30%. Xcalibur software (ThermoFisher Scientific, Waltham, MA, USA) was used for system operation, data acquisition, and data analysis [58].

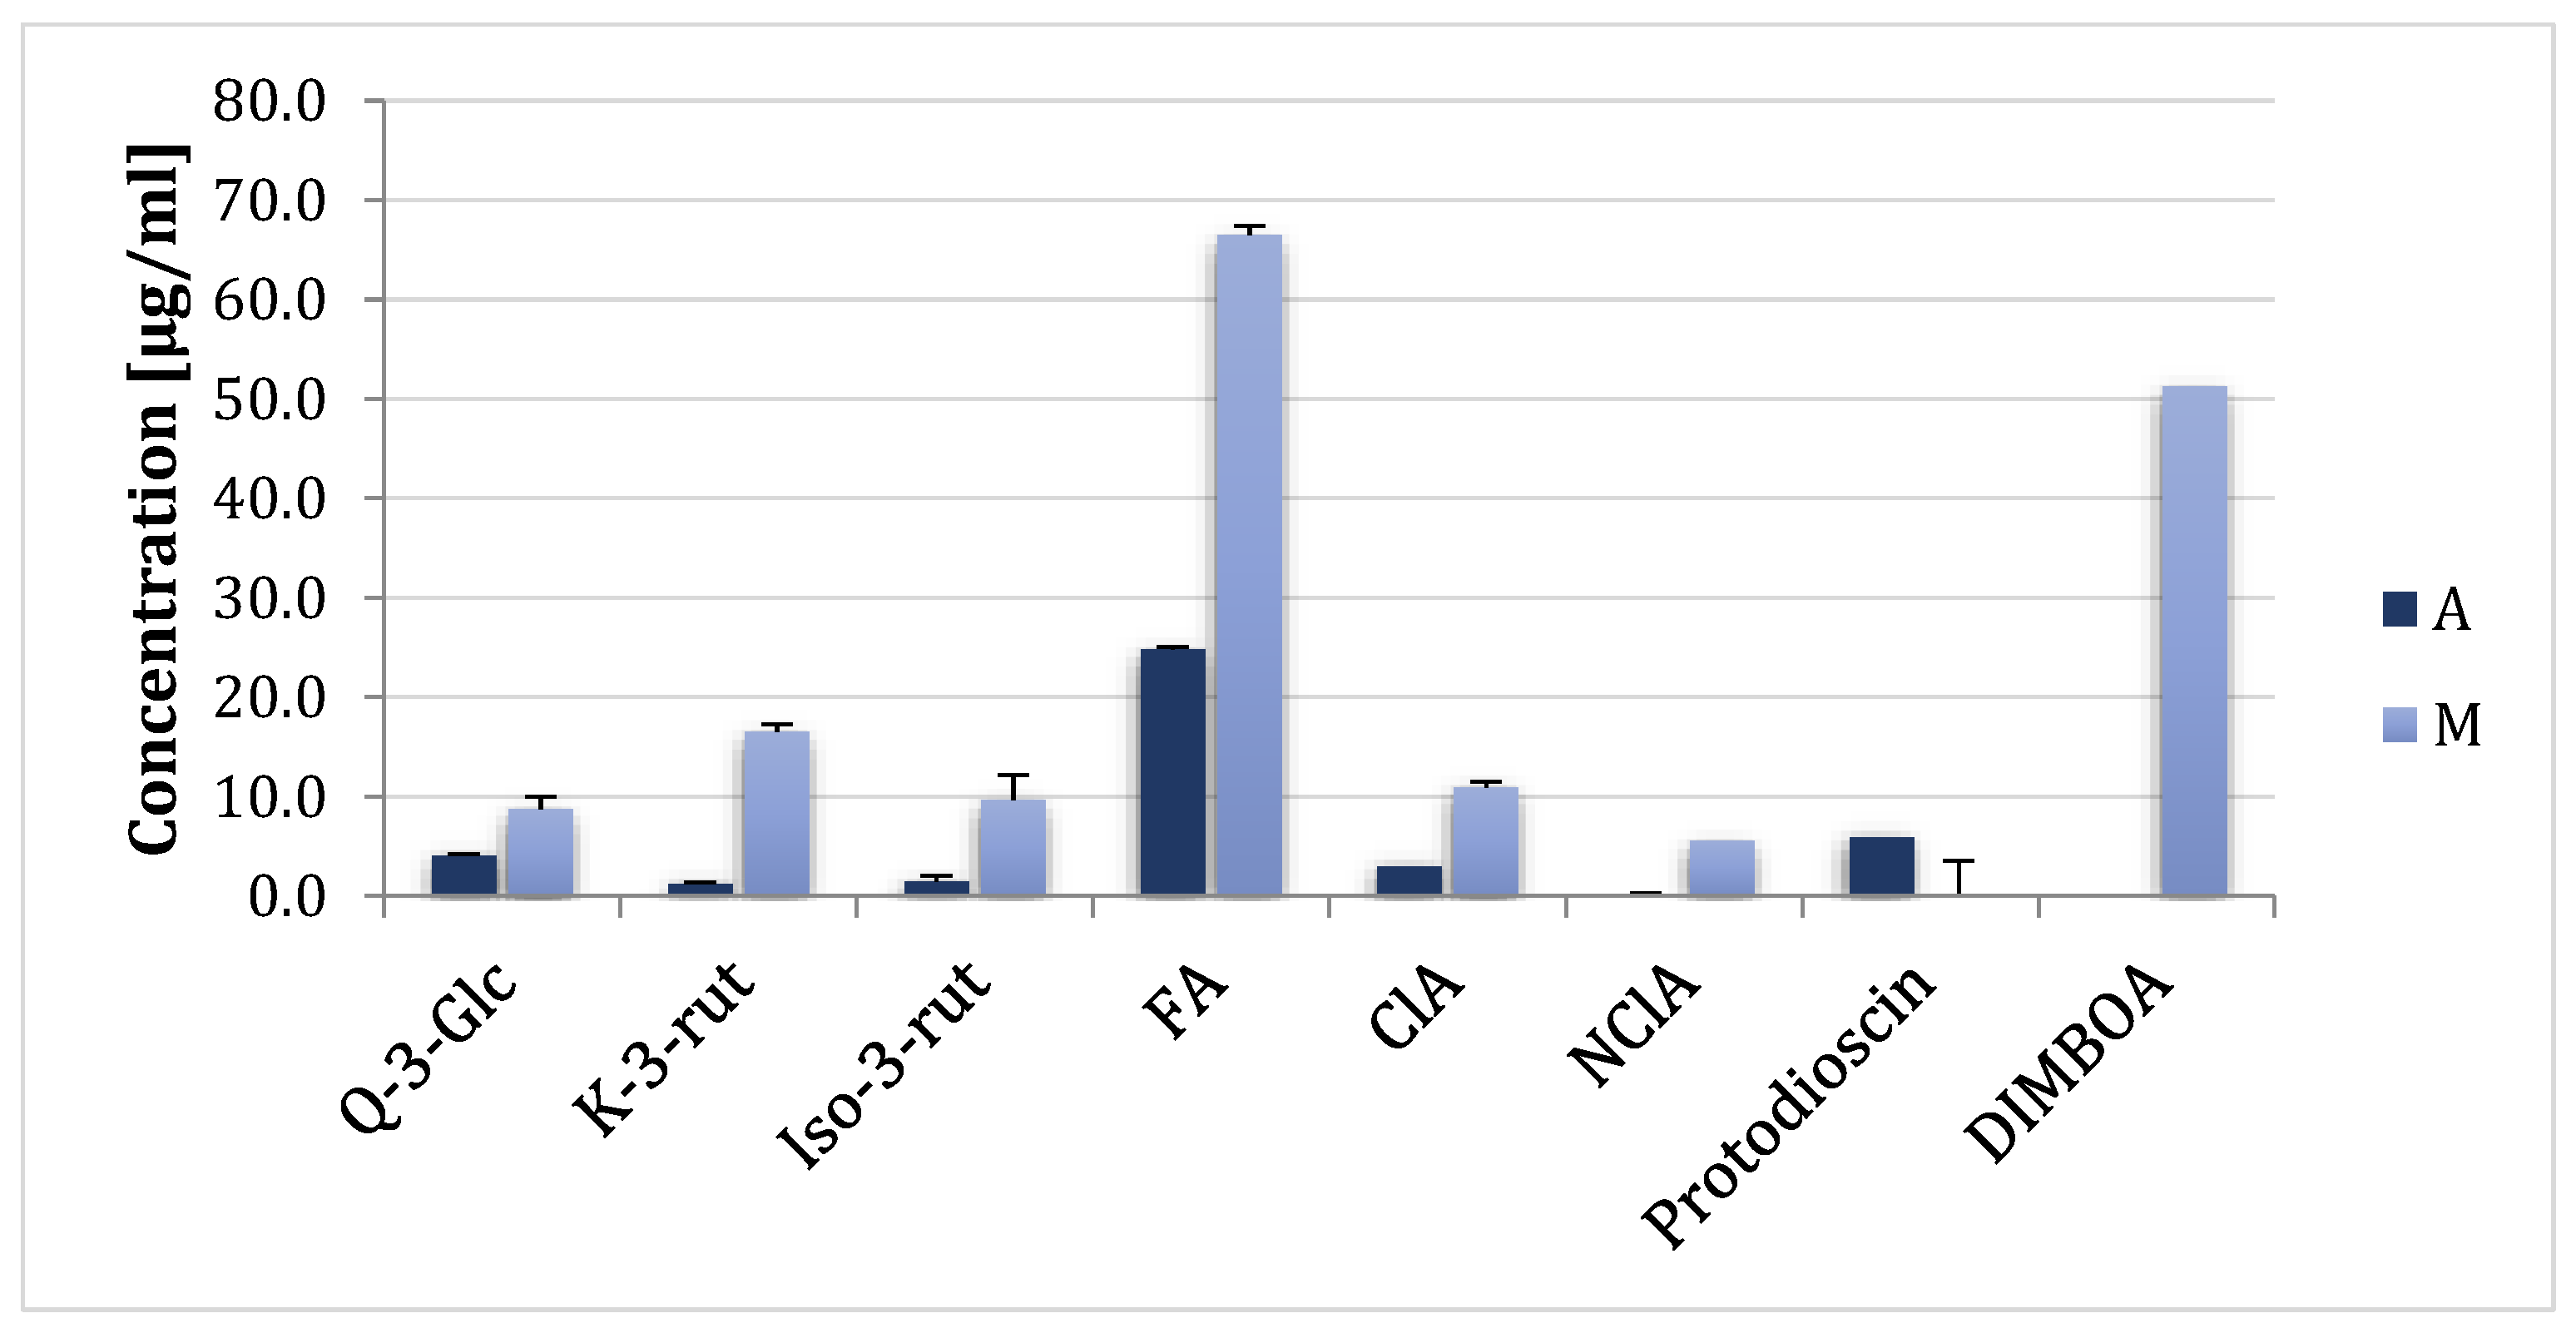
4.6. Plant Metabolite Identification in Asparagus and Maize Extracts

Metabolite identification was done based on accurate mass and ion fragmentation patterns in Xcalibur Qual Browser (ThermoFisher Scientific, Waltham, MA, USA) and statistically analyzed using Perseus (version 1.6.1.3.) [59]. Eight plant metabolites were selected for the present study based on this identification (Table 1).

4.7. Gene Expression Analyses

RT-qPCR was used to analyze the expression of seven primary metabolism genes and four genes from the FUM gene cluster responsible for fumonisin biosynthesis in F. proliferatum after the addition of plant metabolites (Table 2). Samples of mycelia collected after 0 h, 2 h, 24 h, 72 h, and 120 h of culturing were frozen in liquid nitrogen and lyophilized. Then, after homogenization in a ball mill (Retsch-Qiagen, Manchester, UK), total RNA was extracted using a Universal RNA Purification Kit (EURx, Gdańsk, Poland), followed by treatment with RNase-free DNase (Qiagen, Manchester, UK). The RNA concentration was measured using a NanoDrop ND-1000 (Thermo Fisher Scientific, Waltham, MA, USA) and RNA quality and integrity were evaluated on 1% agarose gel (100 V/20 min). Then, 1 μg of total RNA was reverse-transcribed using a High Capacity cDNA Reverse Transcription Kit (Applied Biosystems, Foster City, CA, USA). Reactions were incubated at 25 °C for 10 min, followed by 37 °C for 120 min and 85 °C for 5 min in a C-1000 thermal cycler (Bio-Rad, Hercules, CA, USA). Primers were designed using PrimerQuest (Integrated DNA Technologies) and are listed in Table 2. Originally, three reference genes were tested: TEF-1α, Tub2, and H3. However, only the H3 gene showed stable expression in all conditions. All primers were validated during a preliminary experiment.
The resulting cDNA was used as a template for RT-qPCR (SsoAdvanced Universal SYBR Green Supermix) using the Bio-RadTM CFX96TM system (Bio-Rad, Hercules, CA, USA) with H3 histone as a reference gene used for normalizing the differences in mRNA quantities. Three biological and two technical replicates of each sample were included in each assay. Target sequences were amplified in a 5 μL volume containing 2.5 μL of SsoAdvanced universal SYBR Green supermix, an appropriate amount of each primer, and 2 μL of the cDNA template. The PCR cycling conditions were initial denaturation at 95 °C for 30 s followed by 40 cycles of denaturation at 95 °C for 10 s and annealing at 62–68 °C for 30 s. The melting curve analysis from 65–95 °C with a 0.5 °C increment (5 s per step) confirmed primer pairs specificity. The results were analyzed using CFX Maestro 1.1 software (Bio-Rad, Hercules, CA, USA).

4.8. Fumonisin Quantification

Ultrapure fumonisin standards (FB1–3, 50 μg/mL in acetonitrile: water, 1:1), LC/MS-grade organic solvents, and reagents were supplied by Sigma-Aldrich (Steinheim, Germany). Water was purified using a Milli-Q system (Millipore, Bedford, MA, USA). The analytical system consisted of the Aquity UPLC chromatograph (Waters, Manchester, MA, USA), coupled with an electrospray ionization triple quadrupole mass spectrometer (TQD) (Waters, Manchester, MA, USA). A Waters ACQUITY UPLC HSS T3 (100 × 2.1 mm/ID, with a particle size of 1.8 μm) was used for chromatographic separation with a flow rate of 0.35 mL/min (room temperature). Mobile phases were methanol (A) and water (B), both containing 0.1% formic acid and additionally 2 mM ammonium formate. The following gradient was used: from 1% to 95% A in 10 min, then 95% A for 2 min, and return to initial conditions for 2 min. The injection volume was 3 μL. The mass spectrometer was set to positive ionization mode. The ion source/desolvation temperatures were 150/350 °C, respectively. Nebulizing gas (nitrogen) flow rate was 750 L/min, cone flow rate was 20 L/min. Argon was used as the collision gas, with the energy of 14–22 eV. The metabolites were identified by comparing the retention times, and m/z values were obtained by MS and MS2 with the mass spectra (722.4/352.4, 706.4/336.4, and 706.4/170.4 for FB1, FB2, and FB3, respectively). LOD was 0.1 ng/μL. All samples were analyzed in triplicate. For data processing, EmpowerTM 1 software was used (Waters, Manchester, UK).

4.9. Statistical Analyses

One-way analysis of variance (ANOVA) followed by the Tukey test (HSD) (5% level of significance) was used to evaluate differences of FB1, FB2, and FB3 synthesis between control and cultures with plant metabolites added during the incubation. The results were analyzed using STATISTICA 13.1 software. Mean values (n = 3) and standard errors were calculated. Target gene expression (linked to primary and secondary metabolism) was determined using the 2−∆∆Ct method [60] and normalized against reference genes (H3 histone). All data were analyzed using CFX Maestro 1.1 software (Bio-Rad, Hercules, CA, USA). The differences between samples were evaluated using ANOVA (5% level of significance). The expression was transformed to ln(x), and baseline correction and threshold were set automatically in the CFX Maestro 1.1 software.

5. Conclusions

Bioactive compounds present in plant extracts have been receiving significant attention lately. Plant metabolites can have a huge impact on the growth and metabolism of fungal pathogens, therefore being potential biocontrol agents in modern sustainable agriculture. Plant metabolites used in this study influenced the growth of the Fusarium proliferatum strain and fumonisin biosynthesis in vitro. Consequently, gene expression levels were affected. However, the effects observed were lower than those reported in previous studies analyzing pure extracts or their fractions. Therefore, it is likely that synergistic effects occur between tested compounds and other plant metabolites present in the original extracts.

Supplementary Materials

The supporting information can be downloaded at: https://www.mdpi.com/article/10.3390/ijms24033002/s1.

Author Contributions

N.W., J.L.-K., and Ł.S. conceived and designed the experiments; A.W. performed fumonisin quantification; N.W. and J.L-K. performed the fungal experiments and expression analysis; N.W. and J.L.-K. analyzed the data; J.B. performed statistical analyses; Ł.S. wrote the paper; N.W., J.L.-K., and Ł.S. reviewed and edited the paper. All authors have read and agreed to the published version of the manuscript.

Funding

This research was funded by the National Science Centre project NCN 2015/17/B/NZ9/03577. The APC was funded by the Institute of Plant Genetics, Polish Academy of Sciences, Poznań, Poland.

Institutional Review Board Statement

Not applicable.

Informed Consent Statement

Not applicable.

Data Availability Statement

Not applicable.

Conflicts of Interest

The authors declare no conflict of interest.

References

  1. Stępień, Ł.; Waśkiewicz, A.; Wilman, K. Host extract modulates metabolism and fumonisin biosynthesis by the plant-pathogenic fungus Fusarium proliferatum. Int. J. Food Microbiol. 2015, 193, 74–81. [Google Scholar] [CrossRef] [PubMed]
  2. Marín, S.; Homedes, V.; Sanchis, V.; Ramos, A.J.; Magan, N. Impact of Fusarium moniliforme and F. proliferatum colonisation of maize on calorific losses and fumonisin production under different environmental conditions. J. Stored Prod. Res. 1998, 35, 15–26. [Google Scholar] [CrossRef]
  3. Proctor, R.H.; Desjardins, A.E.; Moretti, A. Biological and chemical complexity of Fusarium proliferartum. In The Role of Plant Pathology in Food Safety and Food Security. Plant Pathology in the 21st Century; Stange, R., Gullino, M., Eds.; Springer: Dordrecht, The Netherlands, 2009. [Google Scholar] [CrossRef]
  4. Ma, L.-J.; Geiser, D.M.; Proctor, R.H.; Rooney, A.P.; O’Donnell, K.; Trail, F.; Gardiner, D.M.; Manners, J.M.; Kazan, K. Fusarium pathogenomics. Annu. Rev. Microbiol. 2013, 67, 399–416. [Google Scholar] [CrossRef]
  5. Munkvold, G.P. Epidemiology of Fusarium diseases and their mycotoxins ears. Eur. J. Plant Pathol. 2003, 109, 705–713. [Google Scholar] [CrossRef]
  6. Stępień, Ł. The use of Fusarium secondary metabolite biosynthetic genes in chemotypic and phylogenetic studies. Crit. Rev. Microbiol. 2014, 40, 176–185. [Google Scholar] [CrossRef]
  7. Lumsangkul, C.; Chiang, H.-I.; Lo, N.-W.; Fan, Y.-K.; Ju, J.C. Developmental Toxicity of Mycotoxin Fumonisin B1 in Animal Embryogenesis: An Overview. Toxins 2019, 11, 114. [Google Scholar] [CrossRef]
  8. Berkey, R.; Bendigeri, D.; Xiao, S. Sphingolipids and Plant Defense/Disease: The “Death” Connection and Beyond. Front. Plant Sci. 2012, 3, 68. [Google Scholar] [CrossRef]
  9. Glazebrook, J. Contrasting Mechanisms of Defense Against Biotrophic and Necrotrophic Pathogens. Annu. Rev. Phytopathol. 2005, 43, 205–227. [Google Scholar] [CrossRef]
  10. Neelam Khatkar, A.; Sharma, K.K. Phenylpropanoids and Its Derivatives: Biological Activities and Its Role in Food, Pharmaceutical and Cosmetic Industries. Crit. Rev. Food Sci. Nutr. 2019, 60, 2655–2675. [Google Scholar] [CrossRef]
  11. Padmavati, M.; Sakthivel, N.; Thara, K.V.; Reddy, A.R. Differential Sensitivity of Rice Pathogens to Growth Inhibition by Flavonoids. Phytochemistry 1997, 46, 499–502. [Google Scholar] [CrossRef]
  12. Parvez, M.M.; Tomita-Yokotani, K.; Fujii, Y.; Konishi, T.; Iwashina, T. Effects of Quercetin and Its Seven Derivatives on the Growth of Arabidopsis thaliana and Neurospora crassa. Biochem. Syst. Ecol. 2004, 32, 631–635. [Google Scholar] [CrossRef]
  13. Bilska, K.; Stuper-Szablewska, K.; Kulik, T.; Buśko, M.; Załuski, D.; Jurczak, S.; Perkowski, J. Changes in Phenylpropanoid and Trichothecene Production by Fusarium culmorum and F. graminearum sensu stricto via Exposure to Flavonoids. Toxins 2018, 10, 110. [Google Scholar] [CrossRef] [PubMed]
  14. Krysenko, S.; Wohlleben, W. Polyamine and Ethanolamine Metabolism in Bacteria as an Important Component of Nitrogen Assimilation for Survival and Pathogenicity. Med. Sci. 2022, 10, 40. [Google Scholar] [CrossRef]
  15. Wojtasik, W.; Kulma, A.; Namysł, K.; Preisner, M.; Szopa, J. Polyamine metabolism in flax in response to treatment with pathogenic and non–pathogenic Fusarium strains. Front. Plant Sci. 2015, 6, 291. [Google Scholar] [CrossRef] [PubMed]
  16. Perincherry, L.; Witaszak, N.; Urbaniak, M.; Waśkiewicz, A.; Stępień, Ł. Effects of secondary metabolites from pea on Fusarium growth and mycotoxin biosynthesis. J. Fungi 2021, 7, 1004. [Google Scholar] [CrossRef] [PubMed]
  17. Schöneberg, T.; Kibler, K.; Sulyok, M.; Musa, T.; Bucheli, T.D.; Mascher, F.; Bertossa, M.; Voegele, R.T.; Vogelgsang, S. Can Plant Phenolic Compounds Reduce Fusarium Growth and Mycotoxin Production in Cereals? Food Addit. Contamin. A 2018, 3, 2455–2470. [Google Scholar] [CrossRef] [PubMed]
  18. Cho, W.K.; Lee, K.M.; Yu, J.; Son, M.; Kim, K.H. Insight into mycoviruses infecting Fusarium species. Adv. Virus Res. 2013, 86, 273–288. [Google Scholar] [CrossRef] [PubMed]
  19. Ferrochio, L.; Cendoya, E.; Farnochi, M.C.; Massad, W.; Ramirez, M.L. Evaluation of ability of ferulic acid to control growth and fumonisin production of Fusarium verticillioides and Fusarium proliferatum on maize based media. Int. J. Food Microbiol. 2013, 167, 215–220. [Google Scholar] [CrossRef]
  20. Reynoso, M.M.; Torres, A.M.; Ramirez, M.L.; Rodríguez, M.I.; Chulze, S.N.; Magan, N. Efficacy of antioxidant mixtures on growth, fumonisisn production and hydrolytic enzyme production by Fusarium verticillioides and F. proliferatum in vitro on maize-based media. Mycol. Res. 2002, 106, 1093–1099. [Google Scholar] [CrossRef]
  21. Gauthier, L.; Atanasova-Penichon, V.; Chéreau, S.; Richard-Forget, F. Metabolomics to Decipher the Chemical Defense of Cereals against Fusarium graminearum and Deoxynivalenol Accumulation. Int. J. Mol. Sci. 2015, 16, 24839–24872. [Google Scholar] [CrossRef]
  22. Assabgui, R.A.; Reid, L.M.; Hamilton, R.I.; Arnason, T. Correlation of kernel (E)-ferulic acid content of maize with resistance to Fusarium graminearum. Phytopatology 1993, 83, 949–953. [Google Scholar] [CrossRef]
  23. McKeehen, J.D.; Busch, R.H.; Fulcher, R.G. Evaluation of wheat (Triticum aesticum L.) phenolic acids during grain development and their contribution to Fusarium resistance. J. Agric. Food Chem. 1999, 47, 1476–1482. [Google Scholar] [CrossRef] [PubMed]
  24. Sampietro, D.A.; Fauguel, C.M.; Vattuone, M.A.; Presello, D.A.; Catalan, C.A.N. Phenylpropanoids from maize pericarp: Resistance factors to kernel infection and fumonisin accumulation by Fusarium verticillioides. Eur. J. Plant Pathol. 2012, 135, 105–113. [Google Scholar] [CrossRef]
  25. Górna, K.; Pawłowicz, I.; Waśkiewicz, A.; Stępień, Ł. Fusarium proliferatum strains change fumonisin biosynthesis and accumulation when exposed to host plant extracts. Fungal Biol. 2016, 120, 884–893. [Google Scholar] [CrossRef] [PubMed]
  26. Witaszak, N.; Lalak-Kańczugowska, J.; Waśkiewicz, A.; Stępień, Ł. The impacts of asparagus extract fractions on growth and fumonisins biosynthesis in Fusarium proliferatum. Toxins 2020, 12, 95. [Google Scholar] [CrossRef] [PubMed]
  27. Górna, K.; Perlikowski, D.; Kosmala, A.; Stępień, Ł. Host extracts induce changes in the proteome of plant pathogen Fusarium proliferatum. Fungal Biol. 2017, 121, 676–688. [Google Scholar] [CrossRef]
  28. Swatek, A.; Staszczak, M. Effect of Ferulic Acid, a Phenolic Inducer of Fungal Laccase, on 26S Proteasome Activities In Vitro. Int. J. Mol. Sci. 2020, 21, 2463. [Google Scholar] [CrossRef]
  29. Jiménez-Sánchez, C.; Lozano-Sánchez, J.; Rodríguez-Pérez, C.; Segura-Carretero, A.; Fernández-Gutiérrez, A. Comprehensive, untargeted, and qualitative RP-HPLC-ESI-QTOF/MS2 metabolite profiling of green asparagus (Asparagus officinalis). J. Food Compos. Anal. 2016, 46, 78–87. [Google Scholar] [CrossRef]
  30. Pegiou, E.; Mumm, R.; Acharya, P.; de Vos, R.C.H.; Hall, R.D. Green and White Asparagus (Asparagus officinalis): A Source of Developmental, Chemical and Urinary Intrigue. Metabolites 2020, 10, 17. [Google Scholar] [CrossRef]
  31. Váry, Z.; Mullins, E.; McElwain, J.C.; Doohan, F.M. The severity of wheat diseases increases when plants and pathogens are acclimatized to elevated carbon dioxide. Glob. Change Biol. 2015, 21, 2661–2669. [Google Scholar] [CrossRef]
  32. Timmusk, S.; Nevo, E.; Ayele, F.; Noe Niinemets, Ü. Fighting Fusarium pathogens in the era of climate change: A conceptual approach. Pathogens 2020, 9, 419. [Google Scholar] [CrossRef] [PubMed]
  33. Uwineza, P.A.; Urbaniak, M.; Bryła, M.; Stępień, Ł.; Modrzewska, M.; Waśkiewicz, A. In vitro Effects of Lemon Balm Extracts in Reducing the Growth and Mycotoxins Biosynthesis of Fusarium culmorum and F. proliferatum. Toxins 2022, 14, 355. [Google Scholar] [CrossRef] [PubMed]
  34. Oufensou, S.; Balmas, V.; Azara, E.; Fabbri, D.; Dettori, M.A.; Schüller, C.; Zehetbauer, F.; Strauss, J.; Delgou, G.; Migheli, Q. Naturally occuring phenols modulate vegetative growth and deoxynivalenol biosynthesis in Fusarium graminearum. ACS Omega 2020, 45, 29407–29415. [Google Scholar] [CrossRef] [PubMed]
  35. Proctor, R.H.; Plattner, R.D.; Desjardins, A.E.; Busman, M.; Butchko, R.A. Fumonisin production in the maize pathogen Fusarium verticillioides: Genetic basis of naturally occurring chemical variation. J. Agric. Food Chem. 2006, 54, 2424–2430. [Google Scholar] [CrossRef]
  36. Proctor, R.H.; Busman, M.; Seo, J.A.; Lee, Y.W.; Plattner, R.D. A fumonisin biosynthetic gene cluster in Fusarium oxysporum strain O-1890 and the genetic basis for B versus C fumonisin production. Fungal Genet. Biol. 2008, 45, 1016–1026. [Google Scholar] [CrossRef]
  37. Brown, D.W.; Cheung, F.; Proctor, R.H.; Butchko, R.A.; Zheng, L.; Lee, Y.; Utterback, T.; Smith, S.; Feldblyum, T.; Glenn, A.E.; et al. Comparative analysis of 87,000 expressed sequence tags from the fumonisin-producing fungus Fusarium verticillioides. Fungal Genet. Biol. 2005, 42, 848–861. [Google Scholar] [CrossRef]
  38. Sun, L.; Chen, X.; Gao, J.; Zhao, Y.; Liu, L.; Hou, Y.; Wang, L.; Huang, S. Effects of Disruption of Five FUM Genes on Fumonisin Biosynthesis and Pathogenicity in Fusarium proliferatum. Toxins 2019, 11, 327. [Google Scholar] [CrossRef]
  39. Massi, F.P.; Sartori, D.; de Souza Ferranti, L.; Iamanaka, B.T.; Taniwaki, M.H.; Vieira, M.L.C.; Fungaro, M.H.P. Prospecting for the incidence of genes involved in ochratoxin and fumonisin biosynthesis in Brazilian strains of Aspergillus niger and Aspergillus welwitschiae. Int. J. Food Microbiol. 2016, 221, 19–28. [Google Scholar] [CrossRef]
  40. Alseekh, S.; de Souza, L.P.; Benina, M.; Fernie, A.R. The style and substance of plant flavonoid decoration: Towards defining both structure and function. Phytochemistry 2020, 174, 112347. [Google Scholar] [CrossRef]
  41. Li, T.; Gong, L.; Jiang, G.; Wang, Y.; Gupta, V.W.; Qu, H.; Duan, X.; Wang, J.; Jiang, Y. Carbon sources influence fumonisin production in Fusarium proliferatum. Proteomics 2017, 17, 1700070. [Google Scholar] [CrossRef]
  42. Rocha, L.O.; Barroso, V.M.; Andrade, L.J.; Pereira, G.H.; Ferreira-Castro, F.L.; Duarte, A.P.; Michelotto, M.D.; Correa, B. FUM Gene Expression Profile and Fumonisin Production by Fusarium verticillioides Inoculated in Bt and Non-Bt Maize. Front. Microbiol. 2016, 6, 1503. [Google Scholar] [CrossRef] [PubMed]
  43. Jurado, M.; Marín, P.; Magan, N.; González-Jaén, M.T. Relationship between solute and matric potential stress, temperature, growth, and FUM1 gene expression in two Fusarium verticillioides strains from Spain. Appl. Environ. Microbiol. 2008, 74, 2032–2036. [Google Scholar] [CrossRef] [PubMed]
  44. Lazzaro, I.; Falavigna, C.; Galaverna, G.; Dall’Asta, C.; Battilani, P. Cornmeal and starch influence the dynamic fumonisin B, A, C production and masking in Fusarium verticillioides and F. proliferatum. Int. J. Food Microbiol. 2013, 166, 21–27. [Google Scholar] [CrossRef] [PubMed]
  45. Medina, A.; Rodriguez, A.; Magan, N. Effect of climate change on Aspergillus flavus and aflatoxin B1 production. Front. Microbiol. 2014, 5, 348. [Google Scholar] [CrossRef] [PubMed]
  46. Wu, Y.; Li, T.; Gong, L.; Wang, Y.; Jiang, Y. Effects of different carbon sources on fumonisin production and FUM gene expression by Fusarium proliferatum. Toxins 2019, 11, 289. [Google Scholar] [CrossRef]
  47. Dozolme, P.M.A.; Moukha, S.M. The in vitro production potentialities of secondary toxic metabolites by the fungal factory Fusarium verticillioides is, fortunately, largely underestimated in fields: Pioneering study on fumonisins. Front. Microbiol. 2020, 11, 562754. [Google Scholar] [CrossRef]
  48. Ponts, N.; Pinson-Gadais, L.; Barreau, C.; Richard-Forget, F.; Ouellet, T. Exogenous H2O2 and catalase treatments interfere with Tri genes expression in liquid cultures of Fusarium graminearum. FEBS Lett. 2007, 581, 443–447. [Google Scholar] [CrossRef]
  49. Atanasova-Penichon, V.; Bernillon, S.; Marchegay, G.; Lornac, A.; Pinson-Gadais, L.; Ponts, N.; Zehraoui, E.; Barreau, C.; Richard-Forget, F. Bioguided isolation, characterization and biotransformation of maize kenrels compounds that inhibit fumonisin production. Mol. Plant-Microbe Inter. 2014, 10, 1148–1158. [Google Scholar] [CrossRef]
  50. Ferruz, E.; Atanasova-Penichon, V.; Bonnin-Verdal, M.-N.; Marchegay, G.; Pinson-Gadais, L.; Ducos, C.; Lorán, S.; Ariño, A.; Barreau, C.; Richard-Forget, F. Effects of phenolic acids on the growth and production of T-2 and HT-2 toxins by Fusarium langsethiae and F. sporotrichioides. Molecules 2016, 21, 449. [Google Scholar] [CrossRef] [Green Version]
  51. Beekrum, S.; Govinden, R.; Padayachee, T.; Odhav, B. Naturally occuring phenols: A detoxification strategy for fumonisin B1. Food Addit. Contamin. 2003, 20, 490–493. [Google Scholar] [CrossRef]
  52. Niggeweg, R.; Michael, A.J.; Martin, C. Engineering plants with increased levels of the antioxidant chlorogenic acid. Nat. Biotechnol. 2004, 22, 746–754. [Google Scholar] [CrossRef] [PubMed]
  53. Atanasova-Perichon, V.; Pons, S.; Pinson-Gadais Picot, A.; Marchegay, G.; Bonnin-Verdal, M.N.; Ducos, C.; Barreau, C.; Roucolle, J.; Sehabiiague, P.; Carolo, P.; et al. Chlorogenic Acid and Maize Ear Rot Resistance: A Dynamic Study Investigating Fusarium graminearum Development, Deoxynivalenol Production, and Phenolic Acid Accumulation. Mol. Plant-Microbe Inter. 2012, 25, 1605–1616. [Google Scholar] [CrossRef] [PubMed]
  54. Papadopolou, K.; Melton, R.E.; Legget, M.; Daniels, M.J.; Osbourn, A.E. Compromised disease resistance in saponin-deficient plants. Proc. Natl. Acad. USA 1999, 96, 12923–12928. [Google Scholar] [CrossRef] [PubMed]
  55. Perincherry, L.; Urbaniak, M.; Pawłowicz, I.; Kotowska, K.; Waśkiewicz, A.; Stępień, Ł. Dynamics of Fusarium Mycotoxins and Lytic Enzymes during Pea Plants’ Infection. Int. J. Mol. Sci. 2021, 22, 9888. [Google Scholar] [CrossRef]
  56. Aboody, M.S.A.; Mickymaray, S. Anti-Fungal Efficacy and Mechanisms of Flavonoids. Antibiotics 2020, 9, 45. [Google Scholar] [CrossRef]
  57. Stępień, Ł.; Koczyk, G.; Waśkiewicz, A. Genetic and phenotypic variation of Fusarium proliferatum isolates from different host species. J. Appl. Genet. 2011, 52, 487–496. [Google Scholar] [CrossRef]
  58. Tsugawa, H.; Cajka, T.; Kind, T.; Ma, Y.; Higgins, B.; Ikeda, K.; Kanazawa, M.; VanderGheynst, J.; Fiehn, O.; Arita, M. MS-DIAL: Data-Independent MS/MS Deconvolution for Comprehensive Metabolome Analysis. Nat. Methods 2015, 12, 523–526. [Google Scholar] [CrossRef]
  59. Tyanova, S.; Temu, T.; Sinitcyn, P.; Carlson, A.; Hein, M.Y.; Geiger, T.; Mann, M.; Cox, J. The Perseus Computational Platform for Comprehensive Analysis of (Prote)Omics Data. Nat. Methods 2016, 13, 731–740. [Google Scholar] [CrossRef]
  60. Livak, K.J.; Schmittgen, T.D. Analysis of relative gene expression data using real-time quantitative PCR and the 2(-Delta Delta C(T)) method. Methods 2001, 25, 402–408. [Google Scholar] [CrossRef]
Figure 1. Concentrations of plant metabolites used in the study in water extracts from asparagus spears and maize ears. A—asparagus, M—maize. Values are means of three repetitions ± standard deviation.
Ijms 24 03002 g001
Figure 2. Colony diameters of the F. proliferatum KF 3360 strain under three concentrations of eight plant metabolites (details in Table 1) after six days of cultivation. Panels (AH) show results for individual metabolites studied. C stands for controls, values are means of three repetitions ± standard deviation (HSD Tukey test, p < 0.05). Yellow bars represent the concentration used for liquid cultures and gene expression analyses.
Ijms 24 03002 g002
Figure 3. Changes in expression of the chosen primary metabolism-linked genes induced by the plant metabolites in liquid Fusarium proliferatum KF 3360 cultures after 2, 24, 72, and 120 h after metabolite addition. Average values of three replicates are shown. Differences statistically significant at * p < 0.05, ** p < 0.01, and standard deviations are shown.
Ijms 24 03002 g003aIjms 24 03002 g003bIjms 24 03002 g003c
Figure 4. Changes in expression of expression of four FUM genes induced by the plant metabolites in liquid Fusarium proliferatum KF 3360 cultures after 3 (A) and 5 days (B) after metabolite addition when compared to the control cultures. Average values of three replicates are shown. Differences statistically significant at ** p < 0.01, and standard deviations are shown.
Ijms 24 03002 g004
Figure 5. Changes in fumonisins concentrations in F. proliferatum KF 3360 cultures after the addition of plant metabolites: —FB1, —FB2, —FB3. * differences statistically significant compared to control at p < 0.05. All analyses were done in triplicate. Detailed information along with SDs are included in Supplementary Table S3.
Ijms 24 03002 g005
Table 1. Plant metabolites selected for the study and parameters used for identification of bioactive compounds.
Plant MetaboliteMolecular FormulaIonization ModeParent Ion [m/z]Product Ions [m/z]
Quercetin-3-glucosideC21H20O12[M-H]-463.1301.0
Kaempferol-3-rutinosideC27H30O15[M-H]-593.1285.0
Isorhamnetin-3-O-rutinosideC28H32016[M-H]-623.2300.0
Ferulic acidC10H10O4[M-H]-193.1177.4
Chlorogenic acidC16H18O9[M-H]-353.1191.1
Neochlorogenic acidC16H18O9[M-H]-353.1191.1; 179.0
ProtodioscinC51H84O22[M + H]+1050.2741.9
DIMBOAC9H9NO5[M-H]-210.0149.0
Table 2. Primer sequences, concentrations, and annealing temperatures used for RT-qPCR analyses in the present study.
Primer NameSequence 5′-3′Concentration [nM]Annealing Temperature [°C]
FeSOD_FTGCCAGAGTTCTTGTCCCTG30064
FeSOD_RATGAGGACTTTGGCTCCTTC
SSC1_FAGGACGCAAGTTCAAGGATG30064
SSC1_RAGGACGAAACCACCAATCTG
HSP88_FTTCAGCTGTGCCATTCTCTC30064
HSP88_RACGTTGCCCTTGTTGAAGAC
HSP70_FTGTCTTCGATGCCAAGTGA30064
HSP70_RCAATCTTGAAGGGCCAAGAC
CPR6_FAATGAGGCTAACACCCTTGC30064
CPR6_RTGTAGGCAGCCTTTTCCTTG
UOR_FCGATATTCGAGTCGAGGAGTG30066
UOR_RCTATGATCTTCGAGAGGCTT
SpD_FGTCGCCATCATGTCTGACTATC25064
SpD_RCAGCATCAACGAGTGTCTTG
FUM1_FTTCTCCCAGCCACTTGTATGC50062
FUM1_RCCATCTCCCTTGTACTGTTGA
FUM6_FATGACCGTTCGCCCAGTAGG50066.4
FUM6_RCGTGTCCTTGATGAAGTCCCA
FUM8_FTCAACAAGCGAGCGACAACACA50068
FUM8_RCCAGCCATACTTCCCATAAGTC
FUM19_FTCTCCCAACGCCCTGCC50062
FUM19_RGGTGAGAAACTGACCGA
H3_FACTAAGCAGACCGCCCGCAGG25062
H3_RGCGGGCGAGCTGGATGTCTT
Disclaimer/Publisher’s Note: The statements, opinions and data contained in all publications are solely those of the individual author(s) and contributor(s) and not of MDPI and/or the editor(s). MDPI and/or the editor(s) disclaim responsibility for any injury to people or property resulting from any ideas, methods, instructions or products referred to in the content.

