
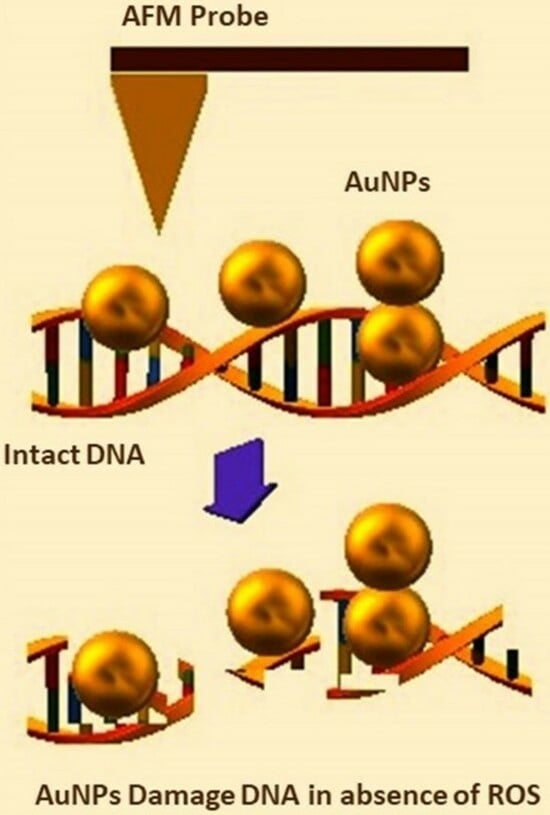
Visualizing the 4D Impact of Gold Nanoparticles on DNA

 , , , and
Abstract
:
1. Introduction
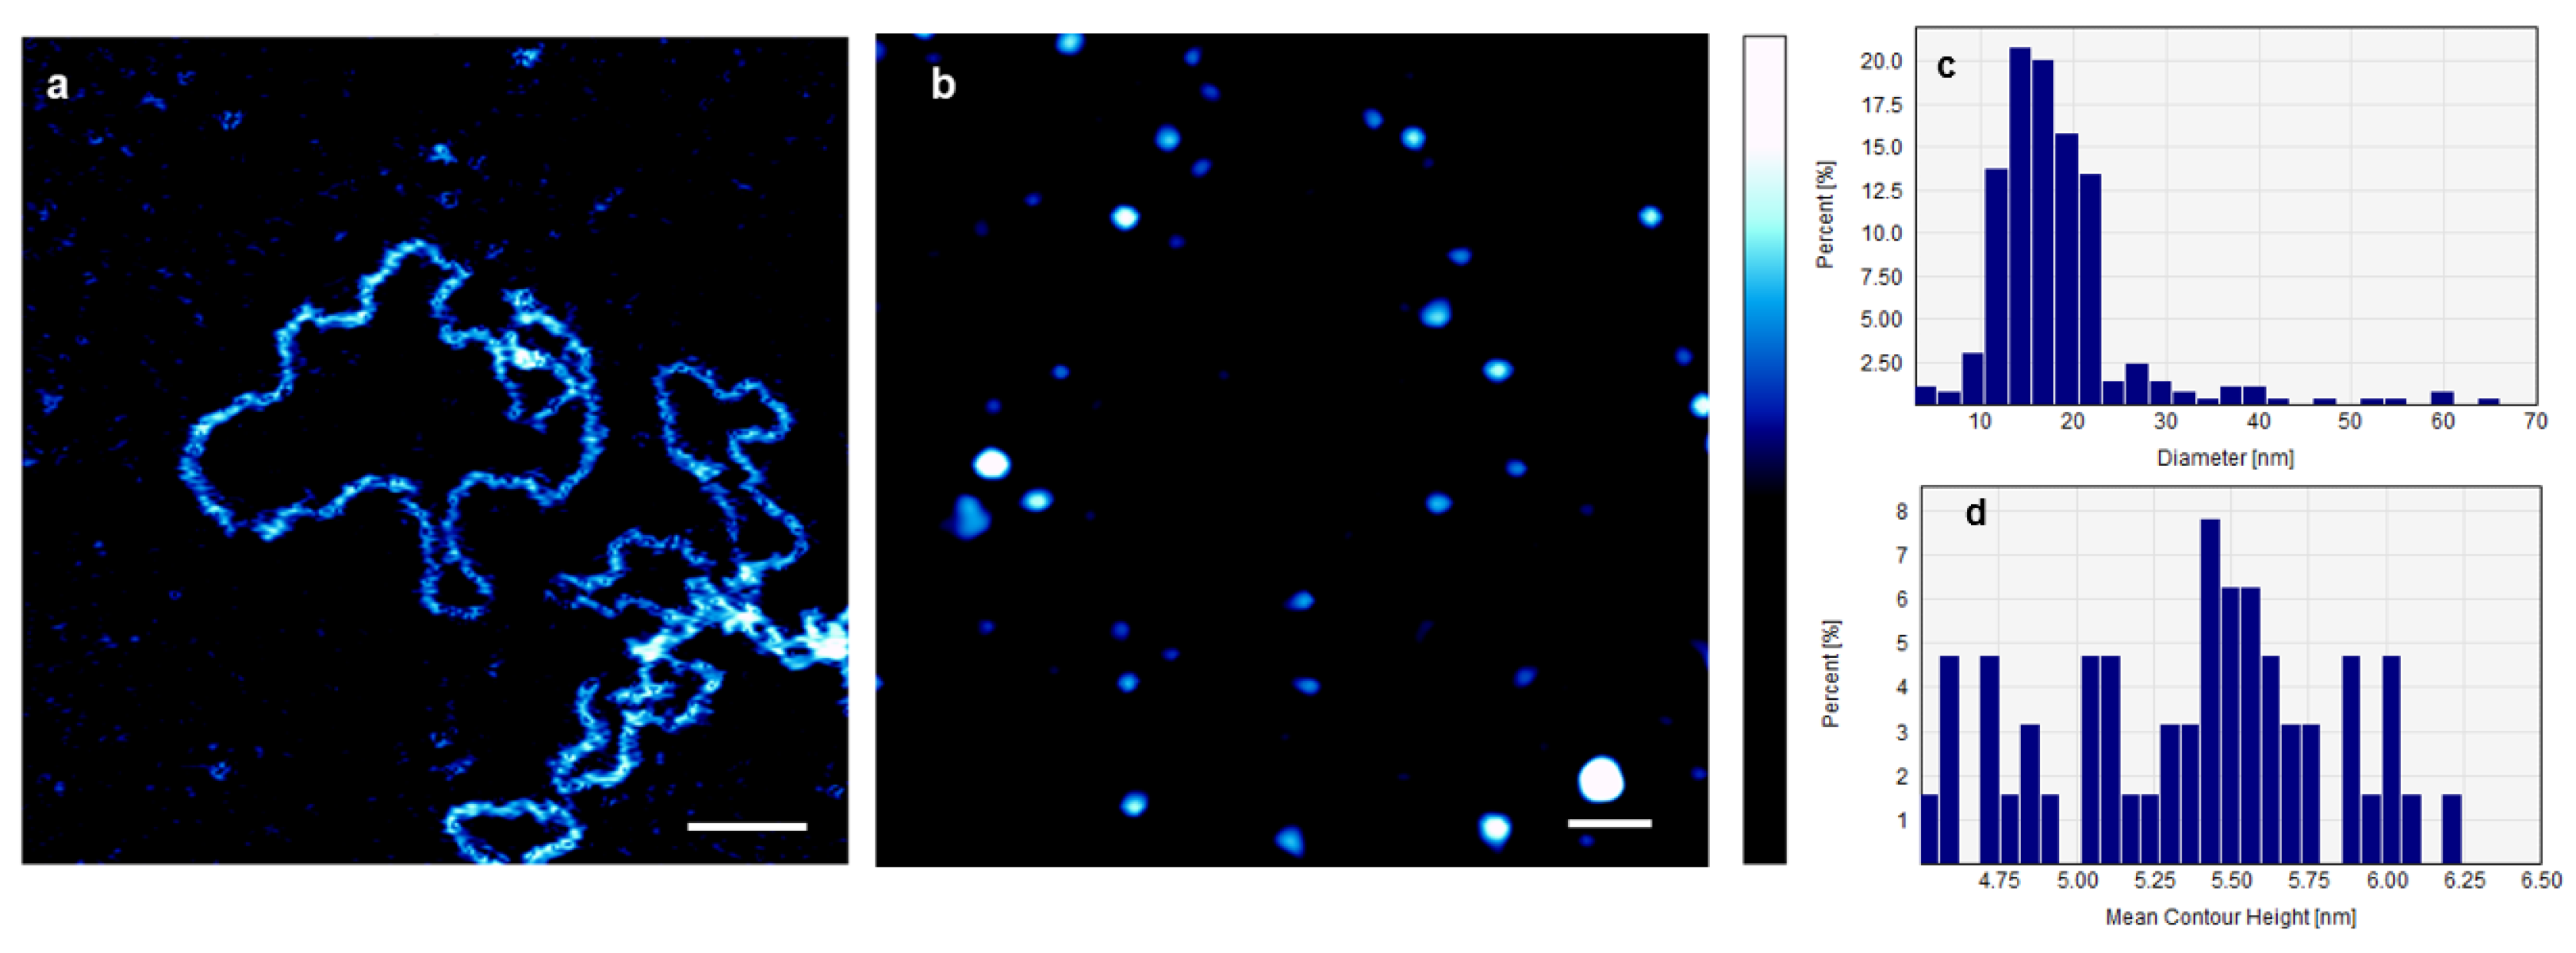
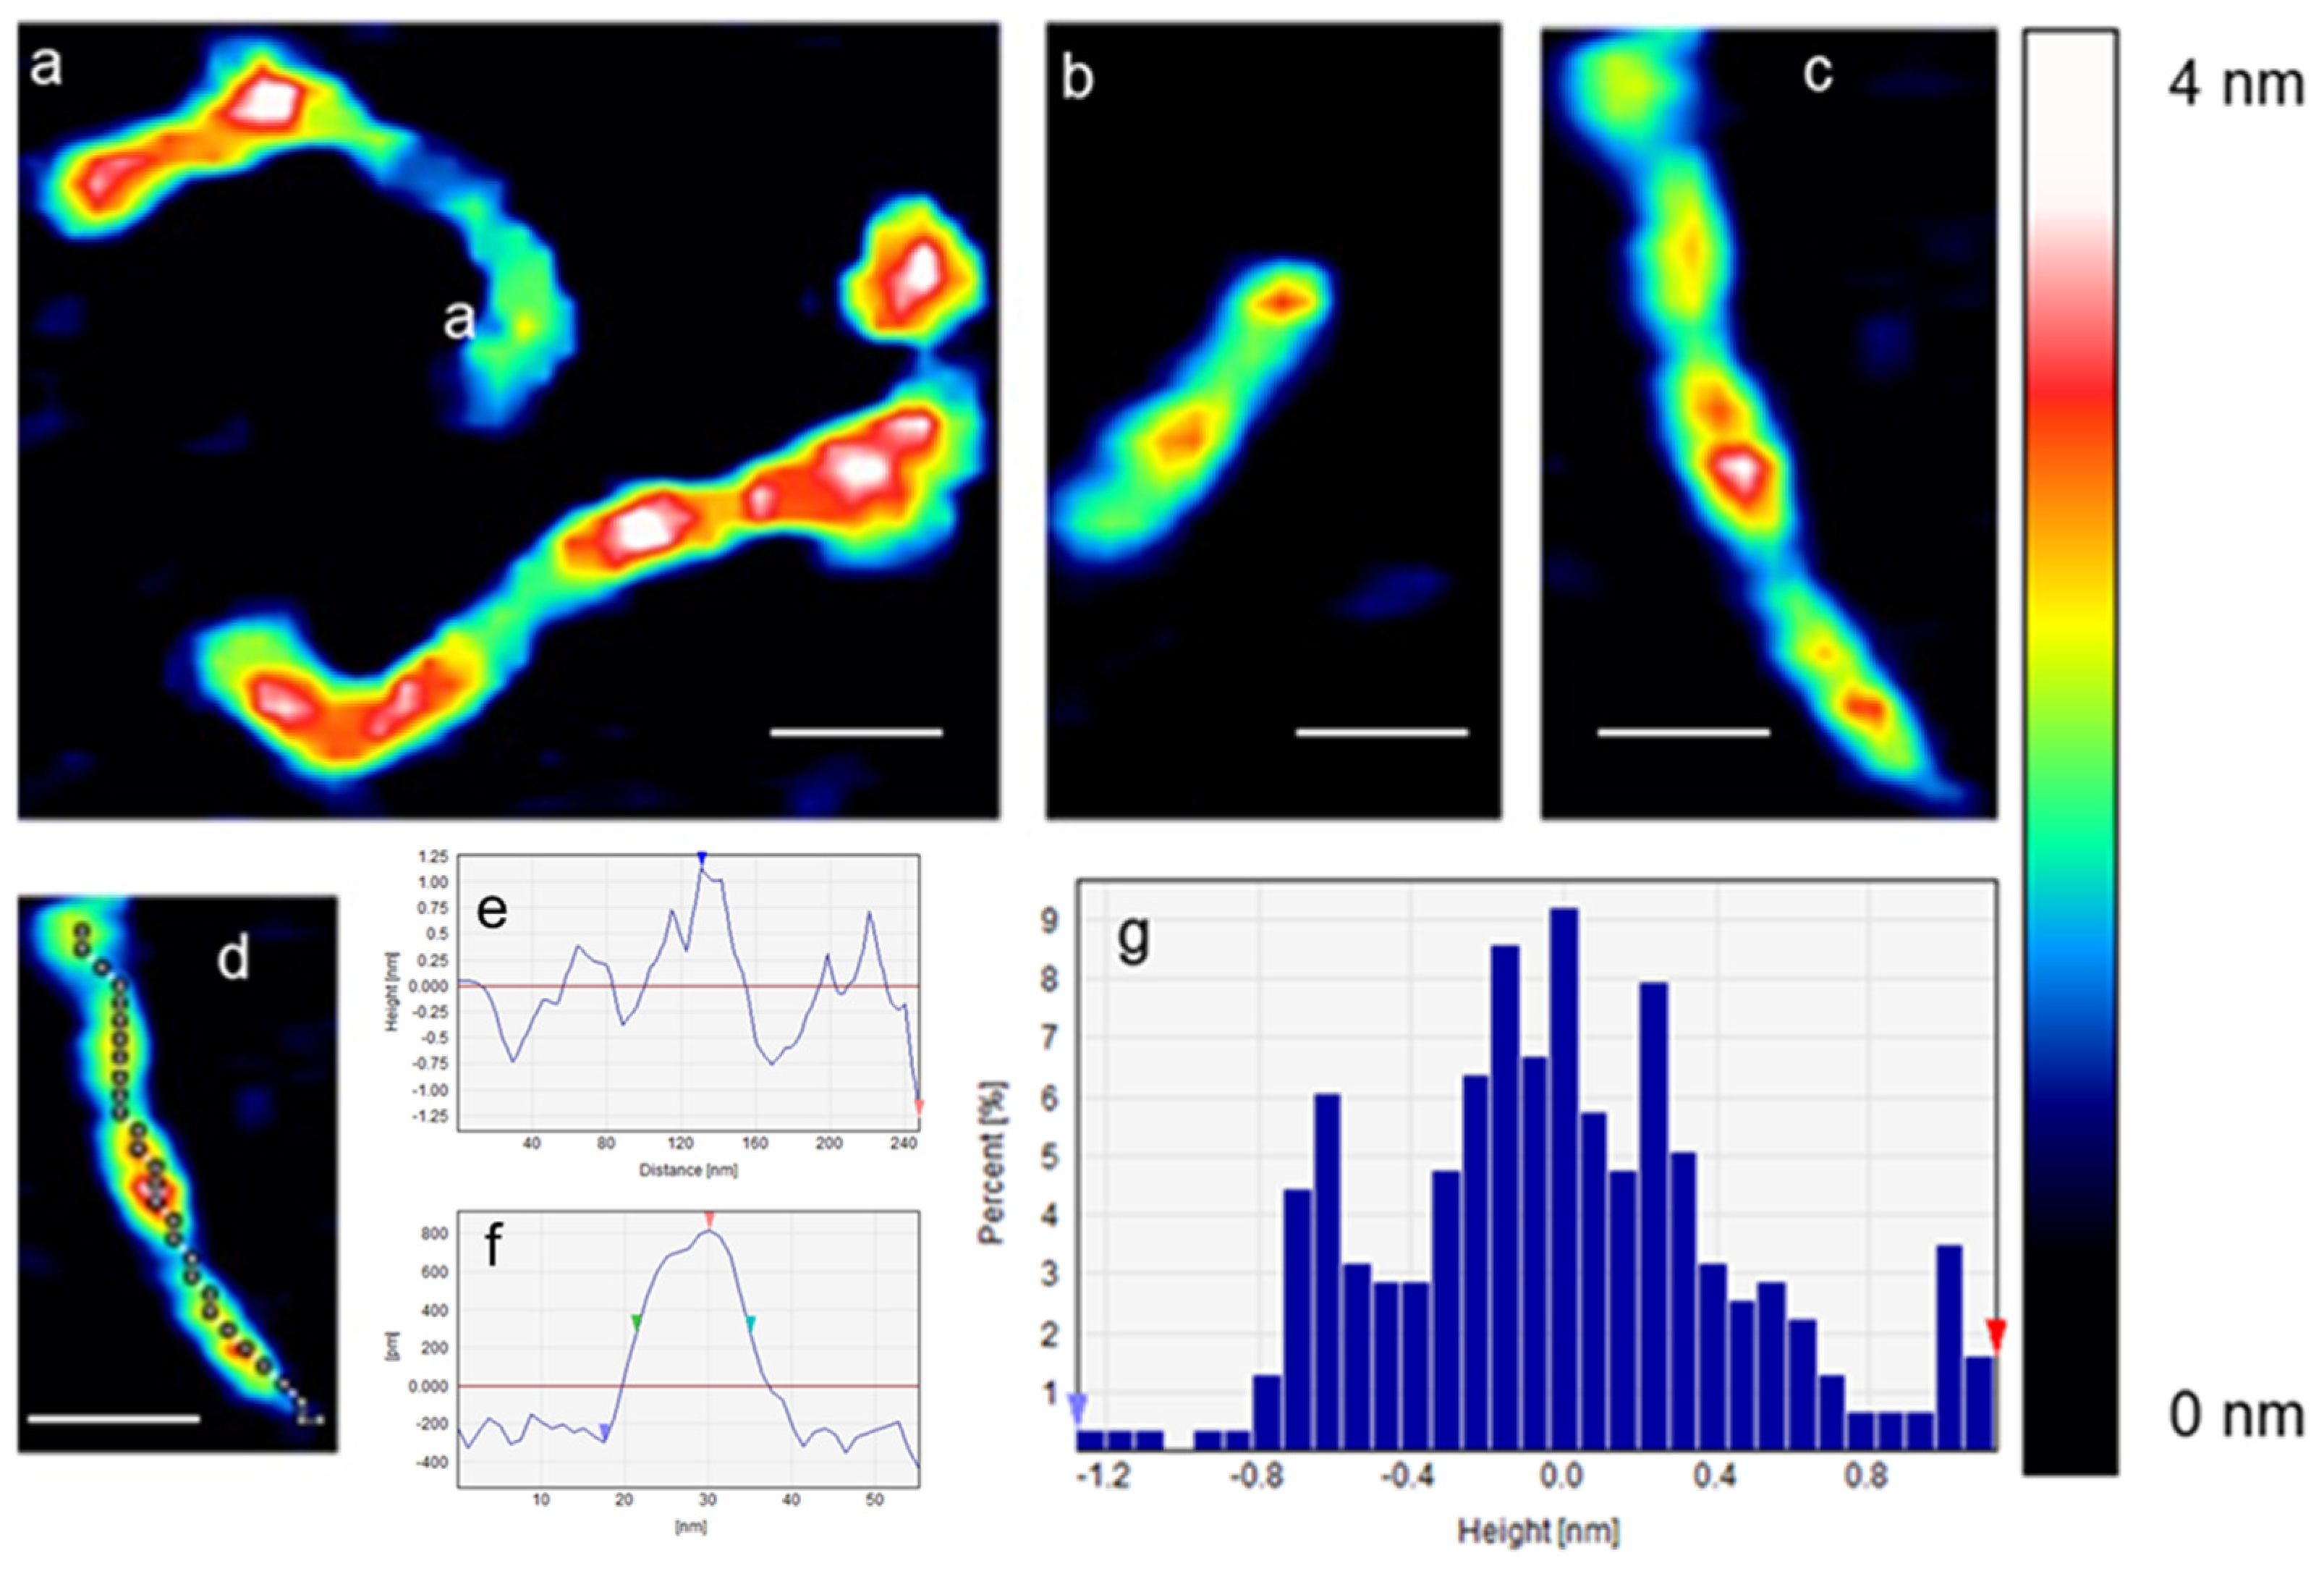
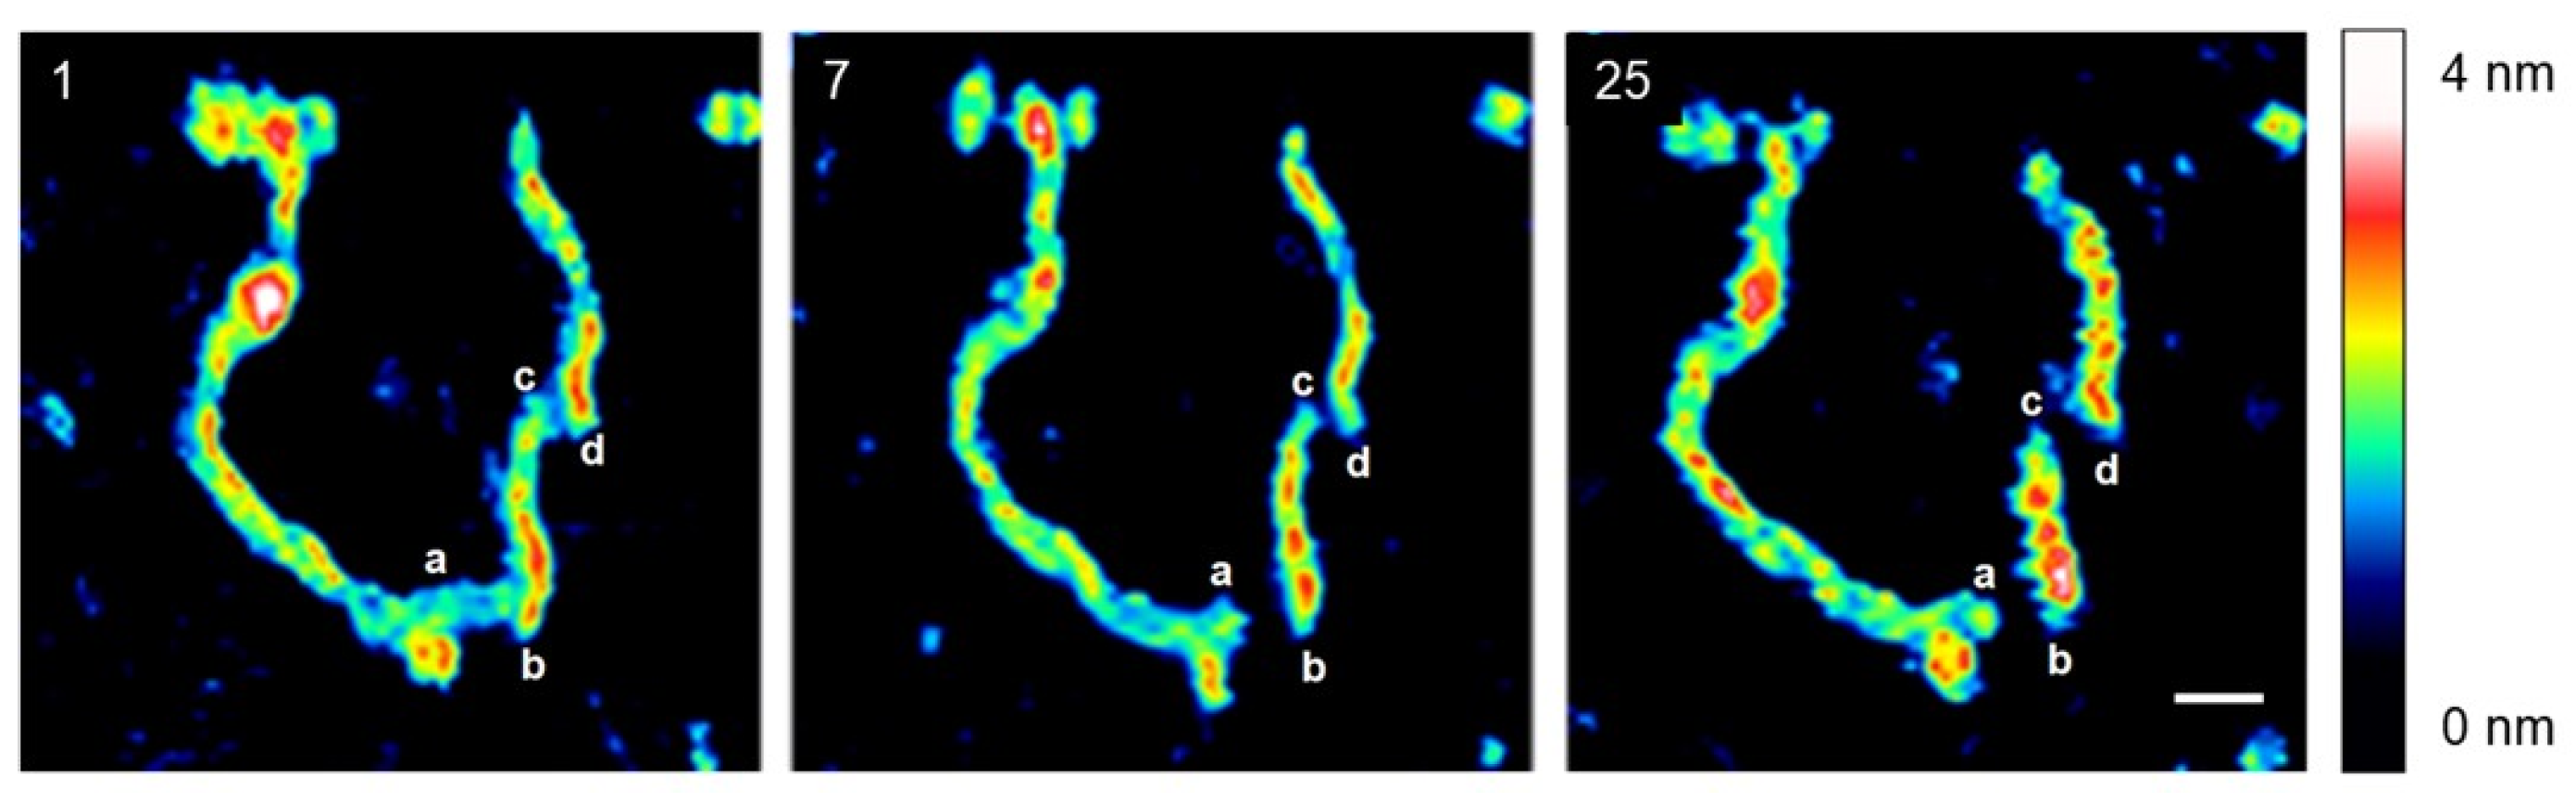
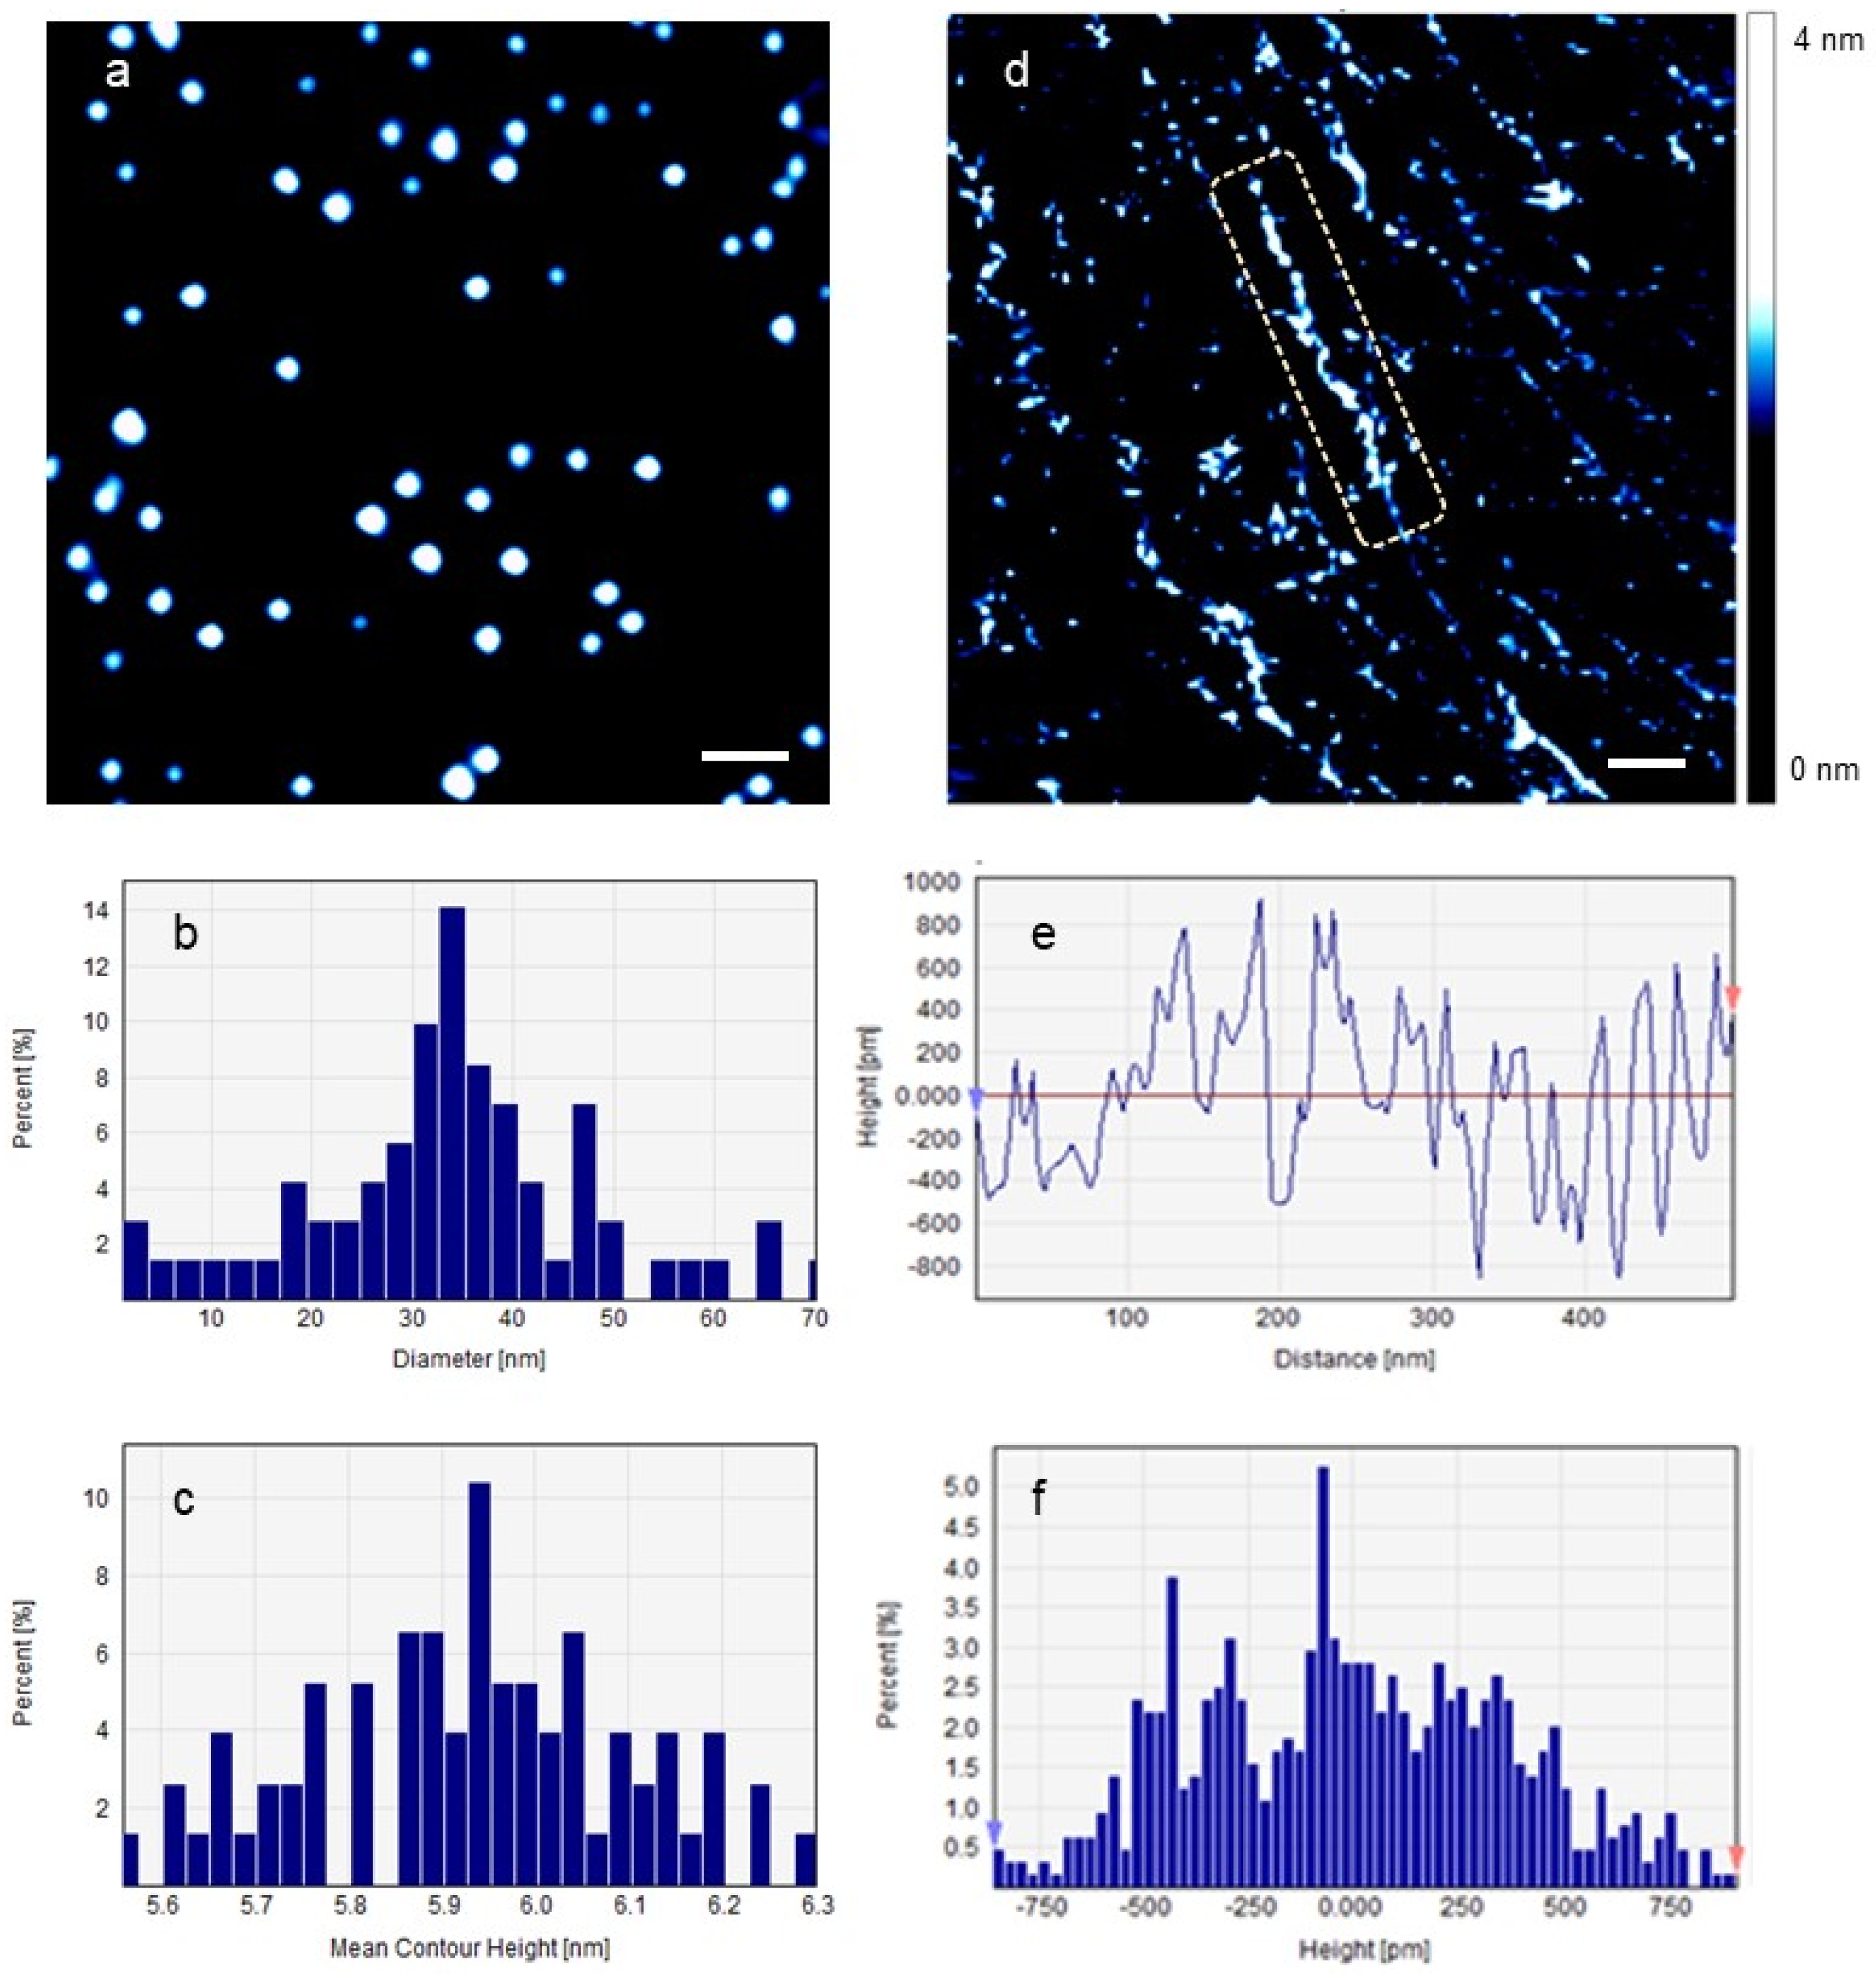
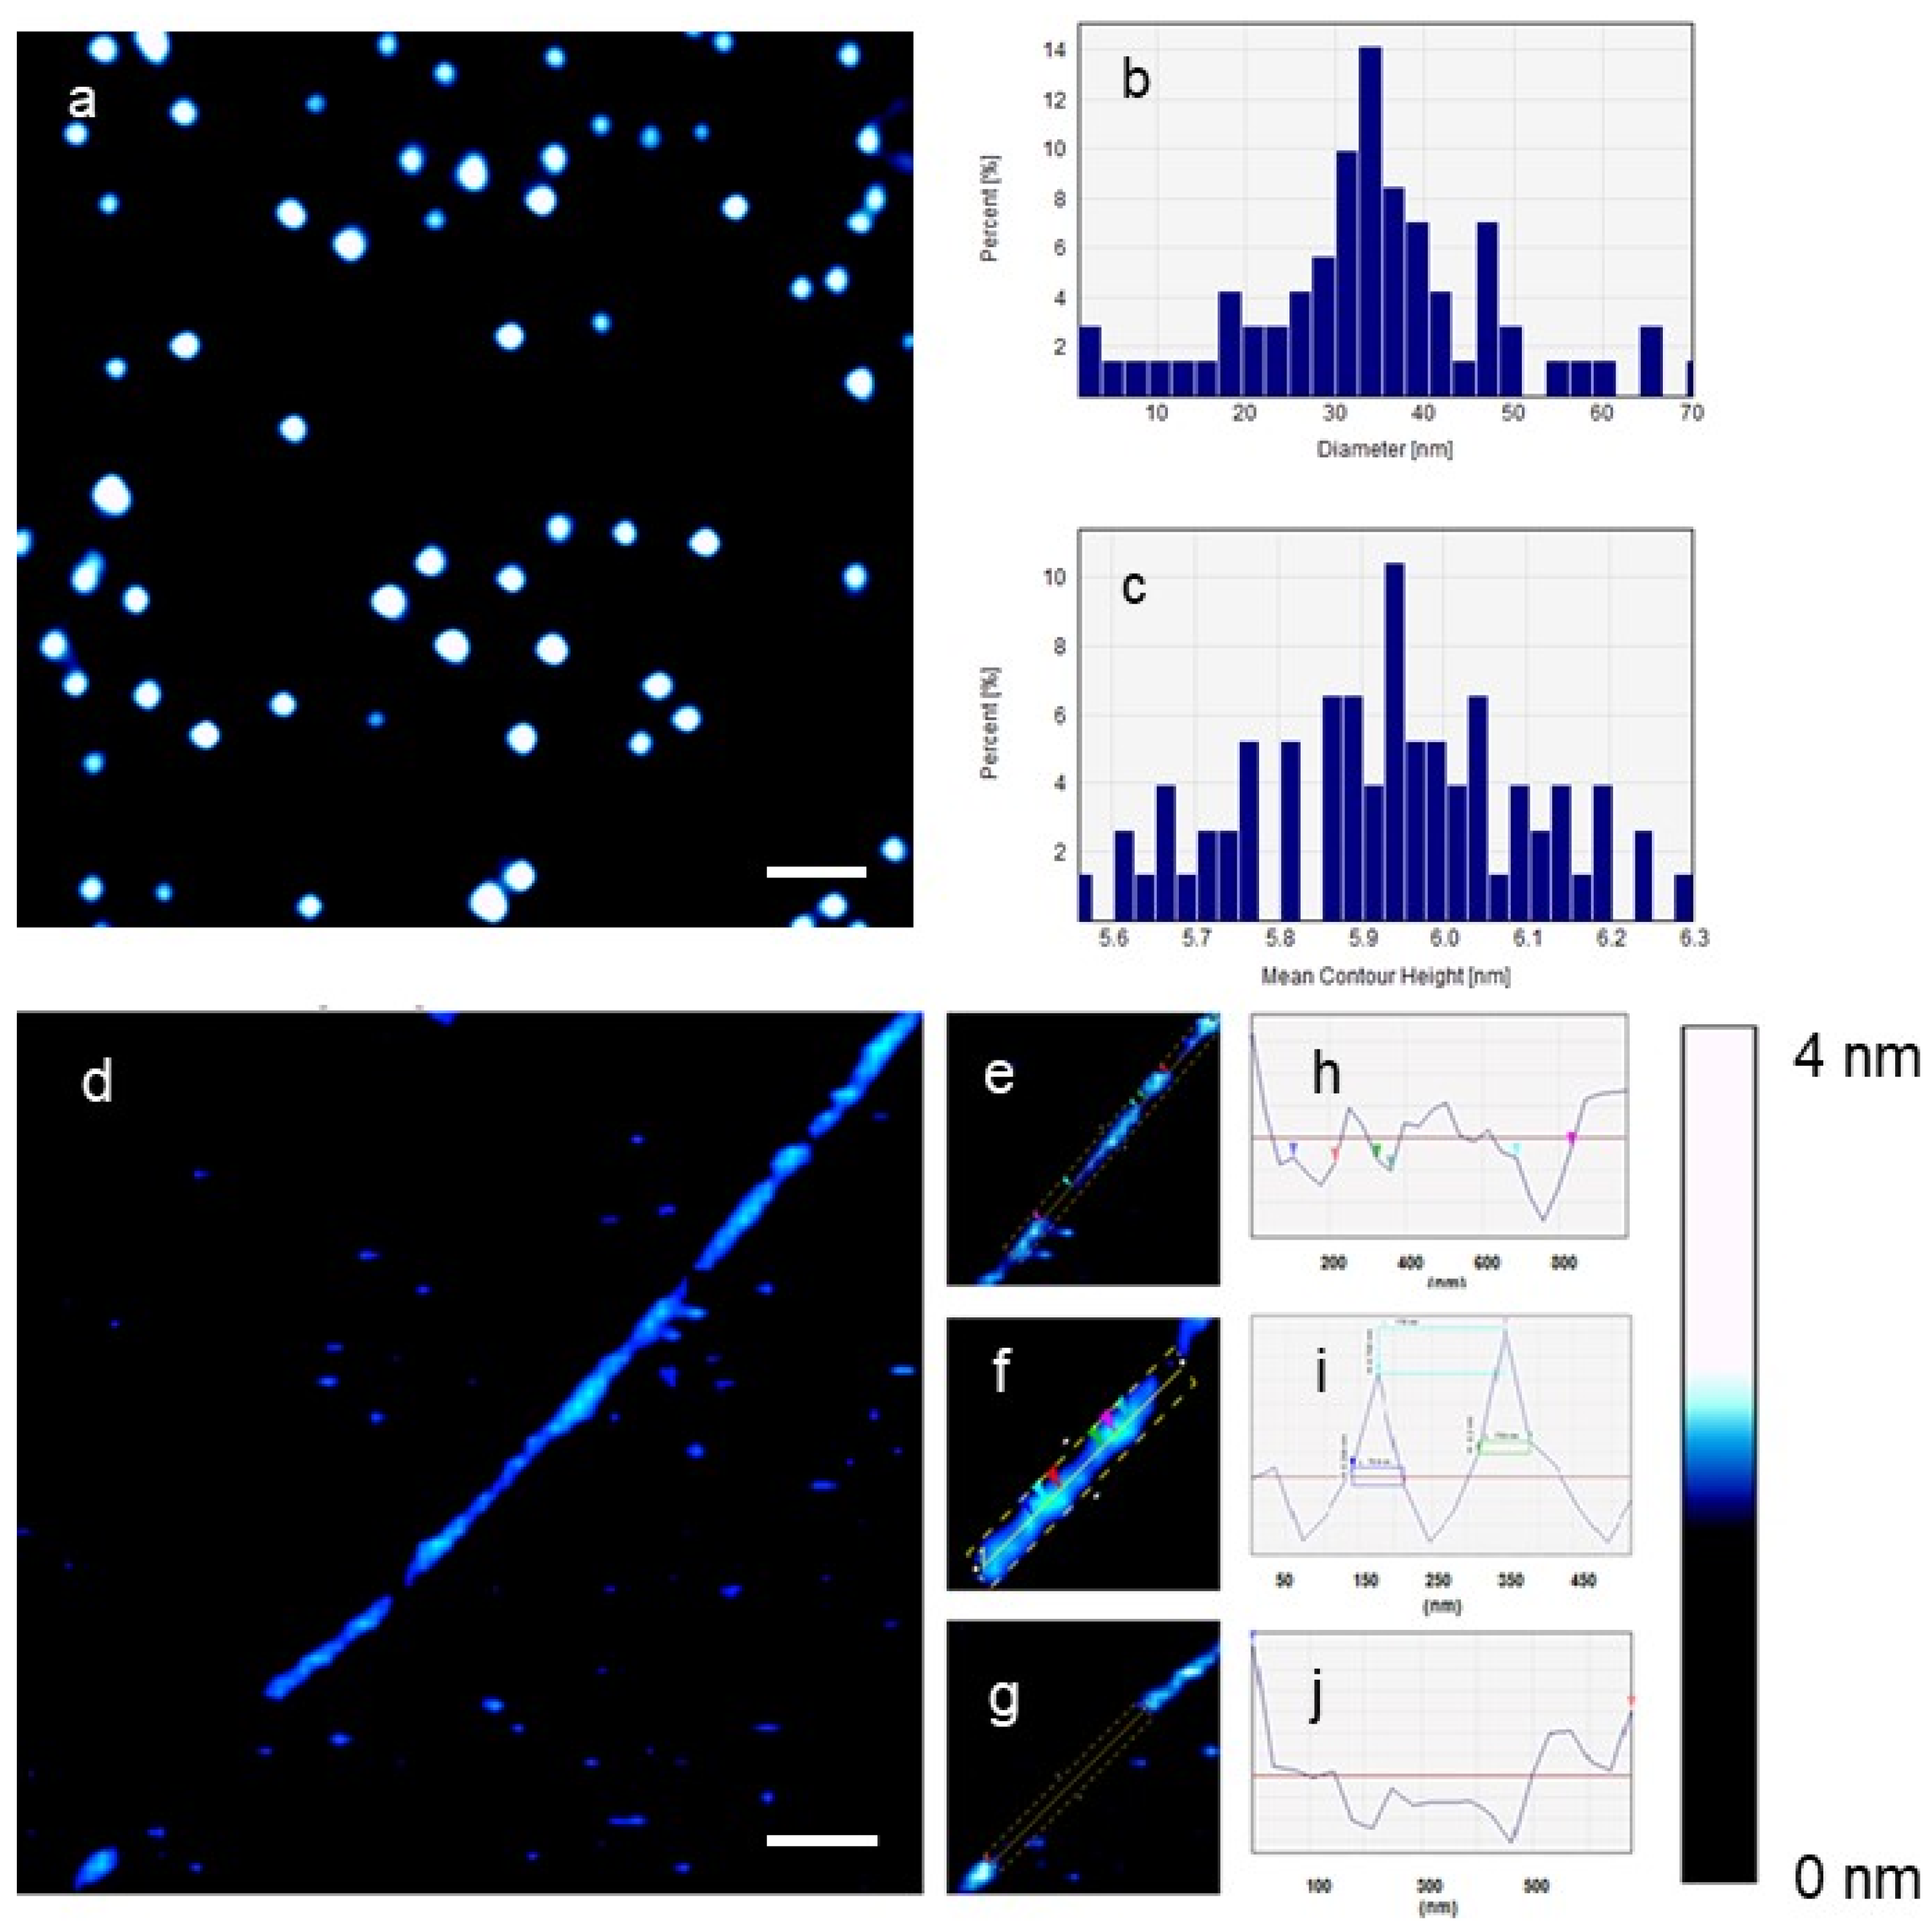
2. Results
3. Discussion
4. Materials and Methods
4.1. Preparation of Gold Nanoparticles (AuNPs)
4.1.1. Non-Functionalized AuNPs
4.1.2. Large Conjugated AuNPs (LCAuNPs)
4.2. Preparation of Naked DNA Solution
4.3. AuNPs Preparation for AFM Imaging in PBS
4.4. AFM Imaging of Individual DNA Molecules
4.5. DAFM Imaging of the Effect of AuNPs on Individual DNA Molecules
4.6. Atomic Force Microscopy
4.7. Data Analysis
5. Conclusions
Author Contributions
Funding
Institutional Review Board Statement
Informed Consent Statement
Data Availability Statement
Acknowledgments
Conflicts of Interest
References
- Chompoosor, A.; Saha, K.; Ghosh, P.S.; MacArthy, D.J.; Miranda, O.R.; Zhu, Z.J.; Arcaro, K.F.; Rotello, V.M. The Role of Surface Functionality on Acute Cytotoxicity, ROS Generation and DNA Damage by Cationic Gold Nanoparticles. Small 2010, 6, 2246–2249. [Google Scholar] [CrossRef] [PubMed]
- Herdt, A.R.; Drawz, S.M.; Kang, Y.; Taton, T.A. DNA Dissociation and Degradation at Gold Nanoparticle Surfaces. Colloids Surf. B Biointerfaces 2006, 51, 130–139. [Google Scholar] [CrossRef] [PubMed]
- Kang, B.; Mackey, M.A.; El-Sayed, M.A. Nuclear Targeting of Gold Nanoparticles in Cancer Cells Induces DNA Damage, Causing Cytokinesis Arrest and Apoptosis. J. Am. Chem. Soc. 2010, 132, 1517–1519. [Google Scholar] [CrossRef] [PubMed]
- Samhadaneh, D.M.; Alqarni, K.A.; Smart, A.; Kuang, M.; Moujaber, O.; Maysinger, D.; Stochaj, U. Gold Nanourchins Induce Cellular Stress, Impair Proteostasis and Damage RNA. Nanomed. Nanotechnol. Biol. Med. 2019, 22, 102083. [Google Scholar] [CrossRef] [PubMed]
- Goodman, C.M.; Chari, N.S.; Han, G.; Hong, R.; Ghosh, P.; Rotello, V.M. DNA-Binding by Functionalized Gold Nanoparticles: Mechanism and Structural Requirements. Chem. Biol. Drug Des. 2006, 67, 297–304. [Google Scholar] [CrossRef] [PubMed]
- Nash, J.A.; Singh, A.; Li, N.K.; Yingling, Y.G. Characterization of Nucleic Acid Compaction with Histone-Mimic Nanoparticles through All-Atom Molecular Dynamics. ACS Nano 2015, 9, 12374–12382. [Google Scholar] [CrossRef] [PubMed]
- Papp, I.; Sieben, C.; Ludwig, K.; Roskamp, M.; Böttcher, C.; Schlecht, S.; Herrmann, A.; Haag, R. Inhibition of Influenza Virus Infection by Multivalent Sialic-Acid- Functionalized Gold Nanoparticles. Small 2010, 6, 2900–2906. [Google Scholar] [CrossRef]
- Huang, Y.-W.; Wu, C.; Aronstam, R.S. Toxicity of Transition Metal Oxide Nanoparticles: Recent Insights from in Vitro Studies. Materials 2010, 3, 4842–4859. [Google Scholar] [CrossRef]
- Sang, Y.; Zhang, L.; Li, Y.F.; Chen, L.Q.; Xu, J.L.; Huang, C.Z. A Visual Detection of Hydrogen Peroxide on the Basis of Fenton Reaction with Gold Nanoparticles. Anal. Chim. Acta 2010, 659, 224–228. [Google Scholar] [CrossRef]
- Yu, Z.; Li, Q.; Wang, J.; Yu, Y.; Wang, Y.; Zhou, Q.; Li, P. Reactive Oxygen Species-Related Nanoparticle Toxicity in the Biomedical Field. Nanoscale Res. Lett. 2020, 15, 115. [Google Scholar] [CrossRef]
- Ozcicek, I.; Aysit, N.; Cakici, C.; Aydeger, A. The Effects of Surface Functionality and Size of Gold Nanoparticles on Neuronal Toxicity, Apoptosis, ROS Production and Cellular/Suborgan Biodistribution. Mater. Sci. Eng. C 2021, 128, 112308. [Google Scholar] [CrossRef] [PubMed]
- Singh, N.; Manshian, B.; Jenkins, G.J.S.; Griffiths, S.M.; Williams, P.M.; Maffeis, T.G.G.; Wright, C.J.; Doak, S.H. NanoGenotoxicology: The DNA Damaging Potential of Engineered Nanomaterials. Biomaterials 2009, 30, 3891–3914. [Google Scholar] [CrossRef] [PubMed]
- Oh, E.; Delehanty, J.B.; Sapsford, K.E.; Susumu, K.; Goswami, R.; Blanco-Canosa, J.B.; Dawson, P.E.; Granek, J.; Shoff, M.; Zhang, Q.; et al. Cellular Uptake and Fate of PEGylated Gold Nanoparticles Is Dependent on Both Cell-Penetration Peptides and Particle Size. ACS Nano 2011, 5, 6434–6448. [Google Scholar] [CrossRef] [PubMed]
- Abdelhady, H.G.; Lin, Y.L.; Sun, H.; ElSayed, M.E.H. Visualizing the Attack of RNase Enzymes on Dendriplexes and Naked RNA Using Atomic Force Microscopy. PLoS ONE 2013, 8, e61710. [Google Scholar] [CrossRef] [PubMed]
- McAllister, C.; Karymov, M.A.; Kawano, Y.; Lushnikov, A.Y.; Mikheikin, A.; Uversky, V.N.; Lyubchenko, Y.L. Protein Interactions and Misfolding Analyzed by AFM Force Spectroscopy. J. Mol. Biol. 2005, 354, 1028–1042. [Google Scholar] [CrossRef] [PubMed]
- Wu, Y.; Cai, J.; Cheng, L.; Wang, C.; Chen, Y. Chromosome Imaging by Atomic Force Microscopy: Influencing Factors and Comparative Evaluation. J. Genet. 2006, 85, 141–145. [Google Scholar] [CrossRef]
- Hansma, H.G.; Vesenka, J.; Siegerist, C.; Kelderman, G.; Morrett, H.; Sinsheimer, R.L.; Elings, V.; Bustamante, C.; Hansma, P.K. Reproducible Imaging and Dissection of Plasmid DNA under Liquid with the Atomic Force Microscope. Science 1992, 256, 1180–1184. [Google Scholar] [CrossRef]
- Abdelhady, H.G.; Allen, S.; Ebbens, S.J.; Madden, C.; Patel, N.; Roberts, C.J.; Zhang, J. Towards Nanoscale Metrology for Biomolecular Imaging by Atomic Force Microscopy. Nanotechnology 2005, 16, 966–973. [Google Scholar] [CrossRef]
- Radman-Livaja, M.; Rando, O.J. Nucleosome Positioning: How Is It Established, and Why Does It Matter? Dev. Biol. 2010, 339, 258–266. [Google Scholar] [CrossRef]
- O’Shaughnessy, B.; Yang, Q. Manning-Oosawa Counterion Condensation. Phys. Rev. Lett. 2005, 94, 048302. [Google Scholar] [CrossRef]
- Strauss, J.K.; Maher, L.J. DNA Bending by Asymmetric Phosphate Neutralization. Science 1994, 266, 1829–1834. [Google Scholar] [CrossRef] [PubMed]
- Bloom, K.S. Beyond the Code: The Mechanical Properties of DNA as They Relate to Mitosis. Chromosoma 2008, 117, 103–110. [Google Scholar] [CrossRef] [PubMed]
- Demurtas, D.; Amzallag, A.; Rawdon, E.J.; Maddocks, J.H.; Dubochet, J.; Stasiak, A. Bending Modes of DNA Directly Addressed by Cryo-Electron Microscopy of DNA Minicircles. Nucleic Acids Res. 2009, 37, 2882–2893. [Google Scholar] [CrossRef] [PubMed]
- Mazur, A.K.; Maaloum, M. DNA Flexibility on Short Length Scales Probed by Atomic Force Microscopy. Phys. Rev. Lett. 2014, 112, 068104. [Google Scholar] [CrossRef] [PubMed]
- Williams, L.D.; Maher, L.J. Electrostatic Mechanisms of DNA Deformation. Annu. Rev. Biophys. Biomol. Struct. 2000, 29, 497–521. [Google Scholar] [CrossRef] [PubMed]
- Crick, F.H.C.; Klug, A. Kinky Helix. Nature 1975, 255, 530–533. [Google Scholar] [CrossRef] [PubMed]
- Yang, J.; Pong, B.-K.; Lee, J.Y.; Too, H.-P. Dissociation of Double-Stranded DNA by Small Metal Nanoparticles. J. Inorg. Biochem. 2007, 101, 824–830. [Google Scholar] [CrossRef]
- Wu, Y.Y.; Bao, L.; Zhang, X.; Tan, Z.J. Flexibility of Short DNA Helices with Finite-Length Effect: From Base Pairs to Tens of Base Pairs. J. Chem. Phys. 2015, 142, 125103. [Google Scholar] [CrossRef]
- Bhatt, N.; Huang, P.J.J.; Dave, N.; Liu, J. Dissociation and Degradation of Thiol-Modified DNA on Gold Nanoparticles in Aqueous and Organic Solvents. Langmuir 2011, 27, 6132–6137. [Google Scholar] [CrossRef]
- Hostetler, M.J.; Templeton, A.C.; Murray, R.W. Dynamics of Place-Exchange Reactions on Monolayer-Protected Gold Cluster Molecules. Langmuir 1999, 15, 3782–3789. [Google Scholar] [CrossRef]
- Kimling, J.; Maier, M.; Okenve, B.; Kotaidis, V.; Ballot, H.; Plech, A. Turkevich Method for Gold Nanoparticle Synthesis Revisited. J. Phys. Chem. B 2006, 110, 15700–15707. [Google Scholar] [CrossRef] [PubMed]
- Austin, L.A.; Ahmad, S.; Kang, B.; Rommel, K.R.; Mahmoud, M.; Peek, M.E.; El-Sayed, M.A. Cytotoxic Effects of Cytoplasmic-Targeted and Nuclear-Targeted Gold and Silver Nanoparticles in HSC-3 Cells-A Mechanistic Study. Toxicol. Vitr. 2015, 29, 694–705. [Google Scholar] [CrossRef] [PubMed]
- Manke, A.; Wang, L.; Rojanasakul, Y. Mechanisms of Nanoparticle-Induced Oxidative Stress and Toxicity. BioMed Res. Int. 2013, 2013, 942916. [Google Scholar] [CrossRef] [PubMed]
- Pope, L.H.; Davies, M.C.; Laughton, C.A.; Roberts, C.J.; Tendler, S.J.; Williams, P.M. Atomic Force Microscopy Studies of Intercalation-Induced Changes in Plasmid DNA Tertiary Structure. J. Biotechnol. 2000, 199, 68–78. [Google Scholar] [CrossRef] [PubMed]
- Zhang, X.D.; Wu, D.; Shen, X.; Liu, P.X.; Yang, N.; Zhao, B.; Zhang, H.; Sun, Y.M.; Zhang, L.A.; Fan, F.Y. Size-Dependent in Vivo Toxicity of PEG-Coated Gold Nanoparticles. Int. J. Nanomed. 2011, 6, 2071–2081. [Google Scholar] [CrossRef]
Disclaimer/Publisher’s Note: The statements, opinions and data contained in all publications are solely those of the individual author(s) and contributor(s) and not of MDPI and/or the editor(s). MDPI and/or the editor(s) disclaim responsibility for any injury to people or property resulting from any ideas, methods, instructions or products referred to in the content. |
© 2023 by the authors. Licensee MDPI, Basel, Switzerland. This article is an open access article distributed under the terms and conditions of the Creative Commons Attribution (CC BY) license (https://creativecommons.org/licenses/by/4.0/).
Share and Cite
Abdelhady, H.; Aleanizy, F.; Alqahtani, F.; Bukhari, A.; Soliman, S.; Sau, S.; Iyer, A. Visualizing the 4D Impact of Gold Nanoparticles on DNA. Int. J. Mol. Sci. 2024, 25, 542. https://doi.org/10.3390/ijms25010542
Abdelhady H, Aleanizy F, Alqahtani F, Bukhari A, Soliman S, Sau S, Iyer A. Visualizing the 4D Impact of Gold Nanoparticles on DNA. International Journal of Molecular Sciences. 2024; 25(1):542. https://doi.org/10.3390/ijms25010542
Chicago/Turabian StyleAbdelhady, Hosam, Fadilah Aleanizy, Fulwah Alqahtani, Abdullah Bukhari, Sahar Soliman, Samaresh Sau, and Arun Iyer. 2024. "Visualizing the 4D Impact of Gold Nanoparticles on DNA" International Journal of Molecular Sciences 25, no. 1: 542. https://doi.org/10.3390/ijms25010542
APA StyleAbdelhady, H., Aleanizy, F., Alqahtani, F., Bukhari, A., Soliman, S., Sau, S., & Iyer, A. (2024). Visualizing the 4D Impact of Gold Nanoparticles on DNA. International Journal of Molecular Sciences, 25(1), 542. https://doi.org/10.3390/ijms25010542