Article

Longitudinal Neuropathological Consequences of Extracranial Radiation Therapy in Mice

1
Department of Veterinary Clinical Sciences, University of Minnesota College of Veterinary Medicine, Saint Paul, MN 55108, USA
2
Masonic Cancer Center, University of Minnesota, Minneapolis, MN 55455, USA
3
Department of Radiation Oncology, University of Minnesota Medical School, Minneapolis, MN 55455, USA
4
The Hormel Institute, University of Minnesota, 801 16th Ave NE, Austin, MN 55912, USA
*
Author to whom correspondence should be addressed.
Current address: Department of Surgical & Radiological Sciences, University of California Davis School of Veterinary Medicine, Davis, CA 95616, USA.
These authors contributed equally to this work.
Int. J. Mol. Sci. 2024, 25(11), 5731; https://doi.org/10.3390/ijms25115731
Submission received: 18 April 2024 / Revised: 22 May 2024 / Accepted: 22 May 2024 / Published: 24 May 2024

Abstract

:
Cancer-related cognitive impairment (CRCI) is a consequence of chemotherapy and extracranial radiation therapy (ECRT). Our prior work demonstrated gliosis in the brain following ECRT in SKH1 mice. The signals that induce gliosis were unclear. Right hindlimb skin from SKH1 mice was treated with 20 Gy or 30 Gy to induce subclinical or clinical dermatitis, respectively. Mice were euthanized at 6 h, 24 h, 5 days, 12 days, and 25 days post irradiation, and the brain, thoracic spinal cord, and skin were collected. The brains were harvested for spatial proteomics, immunohistochemistry, Nanostring nCounter® glial profiling, and neuroinflammation gene panels. The thoracic spinal cords were evaluated by immunohistochemistry. Radiation injury to the skin was evaluated by histology. The genes associated with neurotransmission, glial cell activation, innate immune signaling, cell signal transduction, and cancer were differentially expressed in the brains from mice treated with ECRT compared to the controls. Dose-dependent increases in neuroinflammatory-associated and neurodegenerative-disease-associated proteins were measured in the brains from ECRT-treated mice. Histologic changes in the ECRT-treated mice included acute dermatitis within the irradiated skin of the hindlimb and astrocyte activation within the thoracic spinal cord. Collectively, these findings highlight indirect neuronal transmission and glial cell activation in the pathogenesis of ECRT-related CRCI, providing possible signaling pathways for mitigation strategies.

1. Introduction

Cancer patients often suffer from a syndrome of neurocognitive dysfunction termed cancer-related cognitive impairment (CRCI) [1,2]. Chemotherapy and extracranial radiation therapy (ECRT) have been associated with long-standing CRCI [1,2,3]. CRCI affects the quality of life by decreasing functional independence in an estimated 75% of cancer survivors [4,5]. CRCI has been reported in cancer survivors following treatment for solid tumors including breast, lung, intestinal, ovarian, prostate, and testicular tumors [1,2,4,5]. Women with breast cancer are the most well documented to suffer from CRCI and report cognitive impairment up to 10 years following treatment with chemotherapy and/or radiation therapy [1,6].
Breast cancer survivors treated with extracranial radiation therapy (ECRT) alone have shown cognitive impairment months to years following treatment [7,8,9,10,11]. ECRT is a standard-of-care treatment for multiple cancers; indeed, over 60% of all newly diagnosed cancer patients or over 12 million people will receive ECRT at some point during their treatment [12]. Clinical signs of CRCI following ECRT as a sole treatment include memory loss, fatigue, and impairment of concentration that can be sustained for years after the completion of treatment [1,2]. While the association between radiation therapy and CRCI is strong, the mechanism by which ECRT causes CRCI is unknown which makes prevention and treatment strategies of ECRT-induced CRCI challenging [4].
The effects of direct radiation therapy on the normal brain are well known and include brain damage and neuroinflammation that lead to neurocognitive decline [13,14,15]. However, less is understood about the effects of ECRT-induced injury on the brain. One proposed mechanism is that radiation induces inflammation at the irradiated site creating proinflammatory cytokines in circulation leading to cognitive deficits via neuroinflammation in cancer patients [1,3,8,16]. One study demonstrated that memory deficits in breast cancer patients up to 7 months following treatment with ECRT was partially mediated by elevated plasma IL-6 levels [16]. Several studies have shown that breast cancer patients who received ECRT have subsequent impairment in multiple cognitive domains, including complex cognition, attention, memory, and executive function [1,2,7]. According to the 2022 GLOBOCAN cancer burden survey, there were an estimated 20 million new cancer cases worldwide in 2022, and this number is increasing every year [17,18]. With the increase in cancer incidence, there will be an increased number of cancer survivors at risk for ECRT-induced CRCI. It is imperative to further understand the mechanisms of ECRT-induced CRCI to shed light on mitigation strategies to improve cancer survivors’ quality of life.
Limited in-vivo studies have shown that ECRT in mouse models leads to neuroinflammation evident by the activation of microglia and astrocytes [1,2,3]. The severity of this neuroinflammation is comparable to mice exposed to chemotherapy agents of methotrexate or doxorubicin [1,2,3]. Our prior work showed that SKH1 mice treated with ECRT caused focal dermatitis and hippocampal dependent memory deficits comparable to SKH1 mice treated with doxorubicin, a potent broad-spectrum anti-cancer drug known to induce cognitive deficits [3,19]. There is a limited understanding as to the clinical cognitive impact of ECRT and the mechanism(s) that link CRCI and radiation prescribed to anatomic sites distant from the brain. We previously characterized an SKH1 mouse model of ECRT-induced CRCI, and this model allows us to investigate the crucial mechanisms by which ECRT triggers neuroinflammatory pathology [3,20]. Because breast cancer survivors are over-represented in populations with ECRT-induced CRCI, acute dermatitis is the most common radiation-induced acute adverse event in breast cancer patients, and our prior work demonstrating the occurrence of CRCI following radiation in SKH1 mice, our studies utilize this strain to examine the effects of ECRT on the central nervous system over time [1,2,3,7,16,21]. SKH1 mice are outbred, immunologically competent, and commonly used for dermatologic studies due to the similarities in their skin composition with that of humans [12,22]. In this study, we evaluated brain and spinal cord changes following two distinct radiation doses capable of causing subclinical and clinically evident dermatitis, respectively.

2. Results

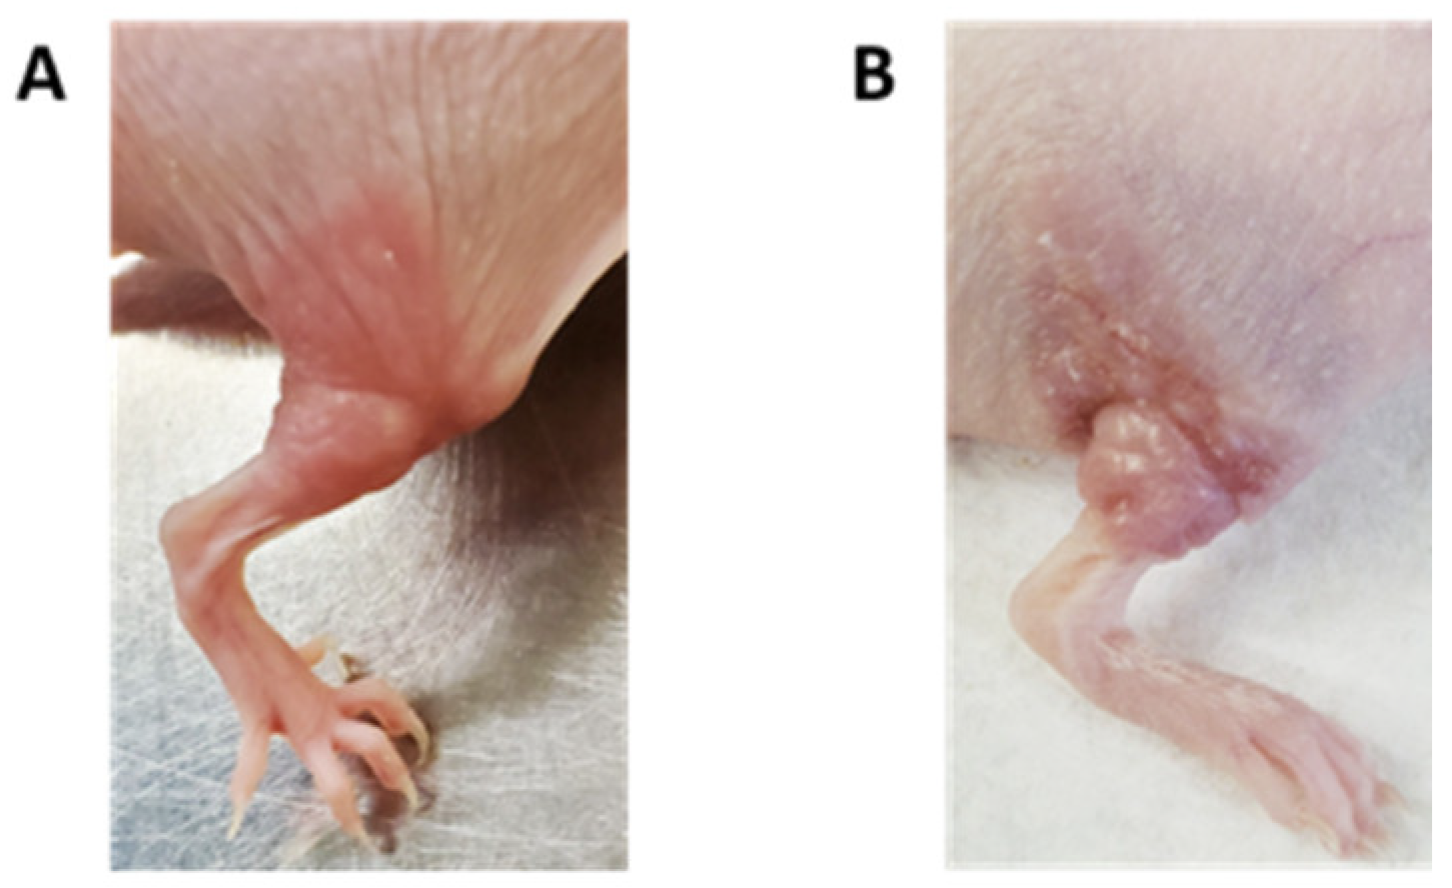
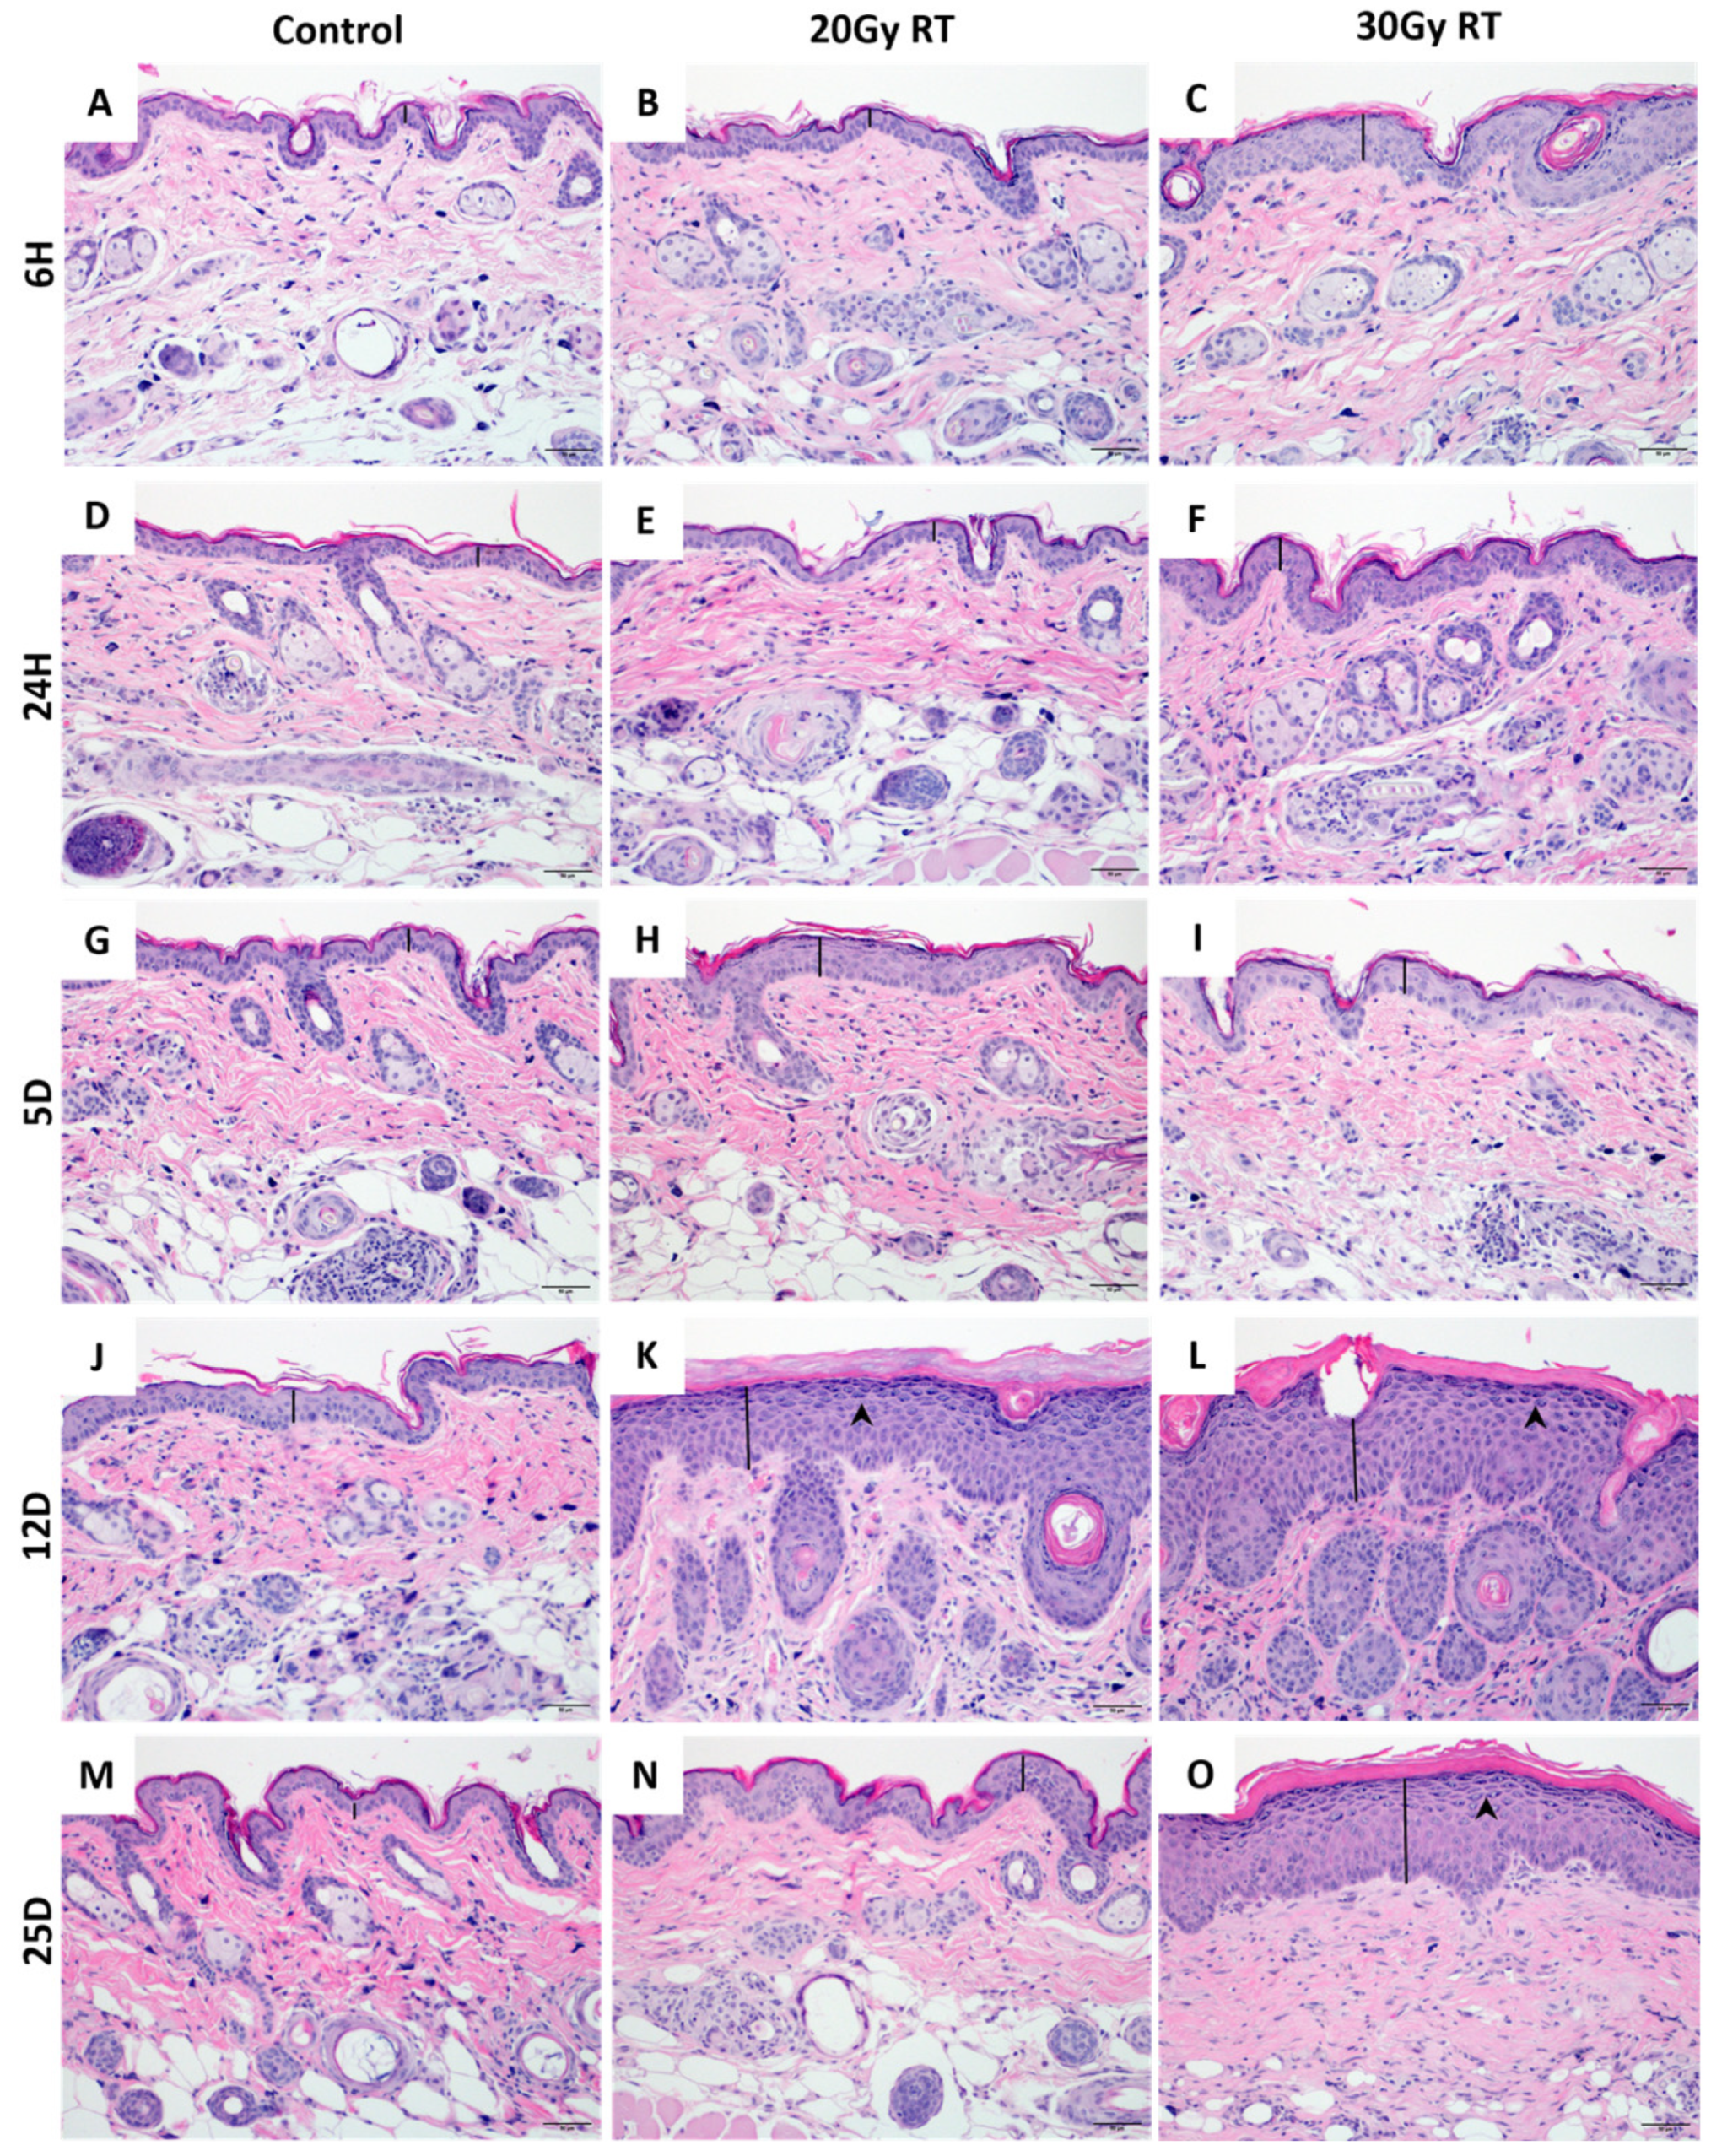
2.1. Extracranial Radiation Therapy Causes Acute Toxicity in the Skin of Mice

Acute radiation-induced dermatitis is a common side effect of RT, affecting up to 90% of cancer patients who undergo radiation therapy treatment [23,24]. Cutaneous erythema was visible in mice treated with 30 Gy starting at day 10 (Figure 1A) with progression to confluent moist dermatitis or ulceration by day 12 (Figure 1B). To characterize the severity of radiation dermatitis, the irradiated skin in each mouse was evaluated for histological changes over time. Mice receiving either 20 Gy or 30 Gy radiation to their hindlimb had significant pathological dermal and epidermal changes (Figure 2). Marked histological changes in all irradiated mice including thickening, parakeratosis, and intracellular edema in the epidermis (Figure 2K,L) were compared to the control mice on day 12. The skin from 20 Gy and 30 Gy treated mice on day 12 showed dermal hyperpigmentation (Figure 2K,L). Histologic changes were more severe and protracted in the mice treated with 30 Gy compared to 20 Gy (Figure 2K,L,N,O).

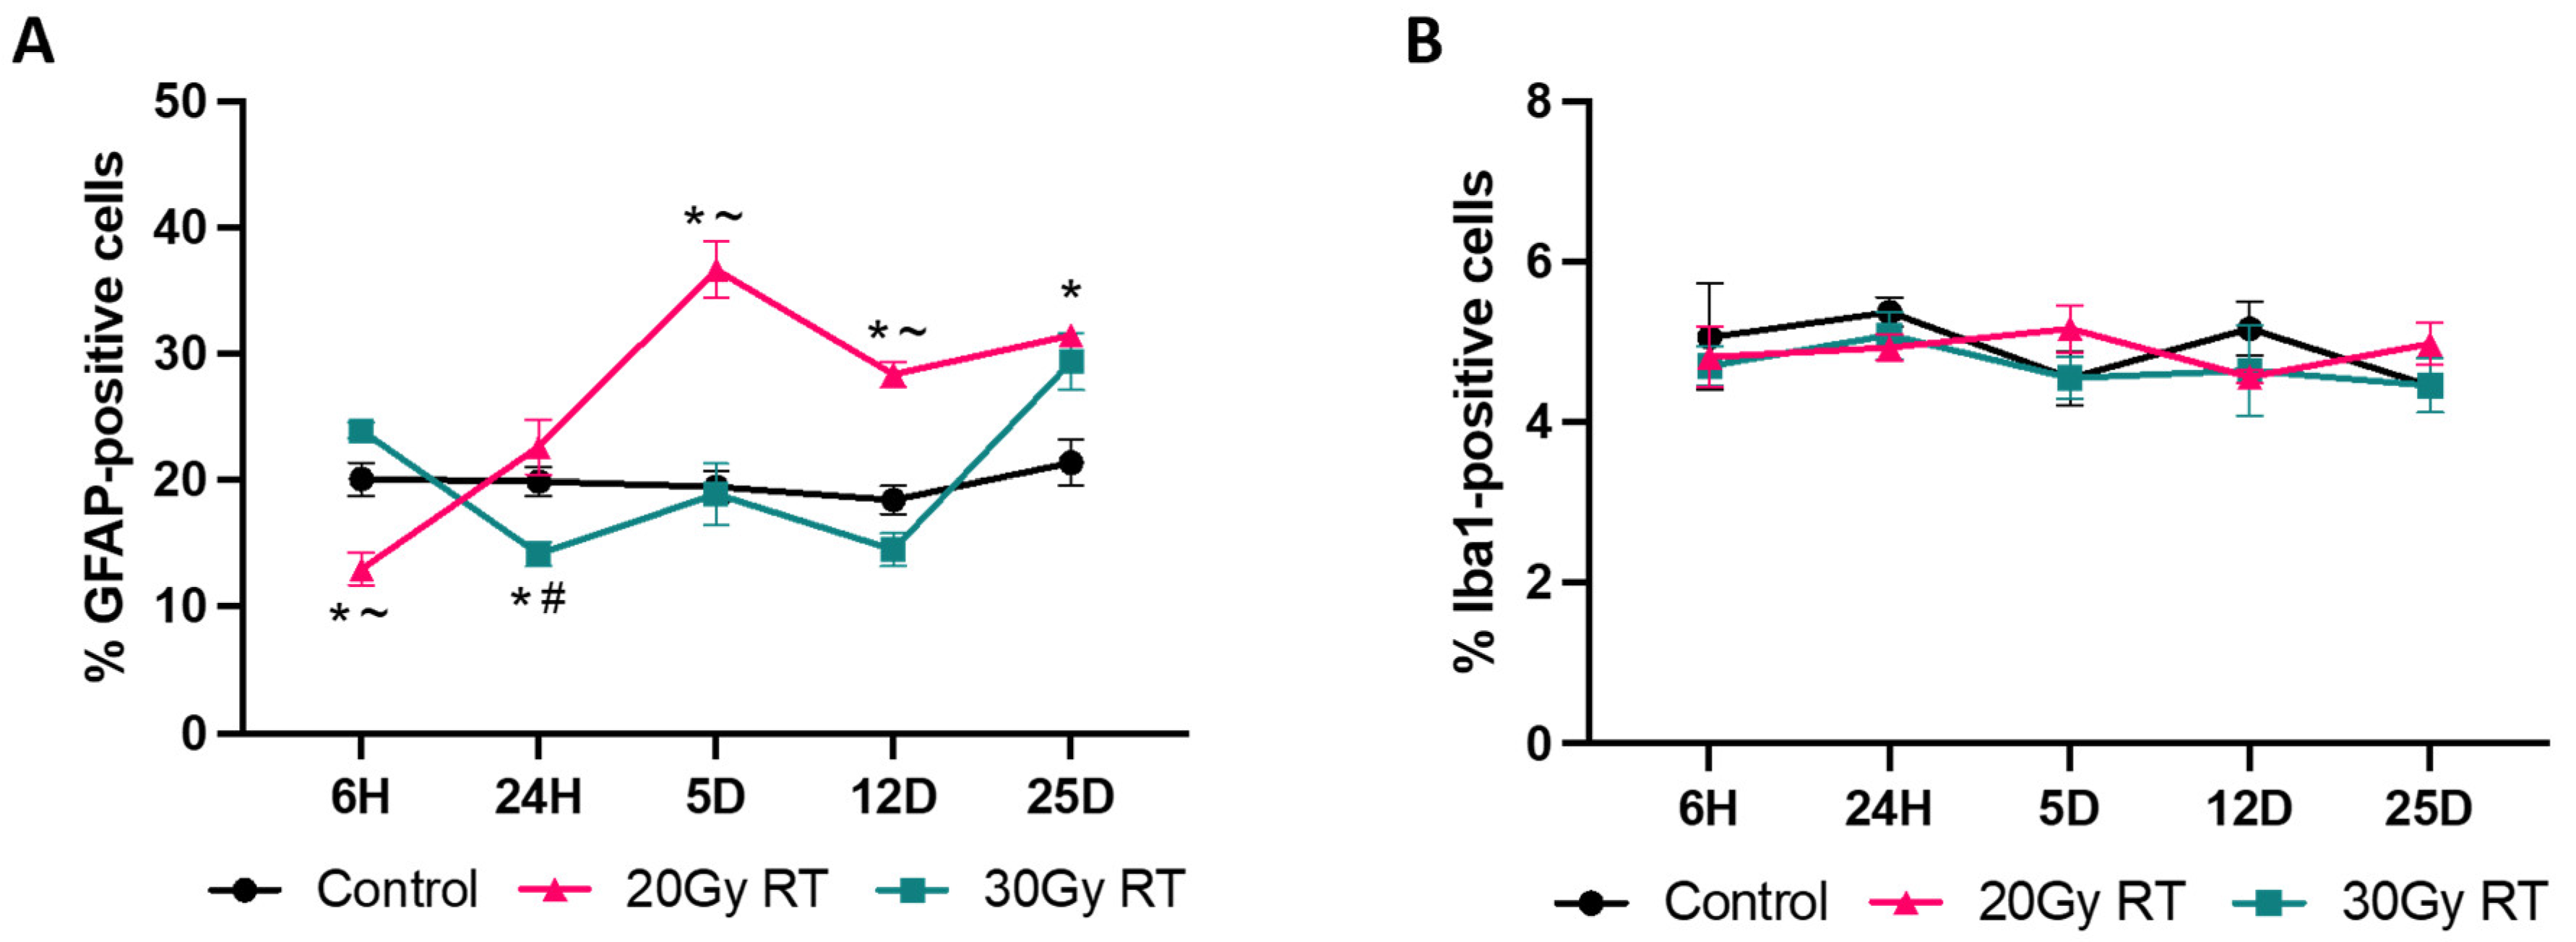
2.2. Extracranial Radiation Increases Activation of Astrocytes in the Thoracic Spinal Cord of Mice

Previous studies have shown that ECRT causes increased activation of astrocytes and microglia in the brain of mice following treatment [1,3]. In our study, the right hindlimb was abducted from the body for treatment, and the lumbar spinal cord was actively shielded from the radiation field, confirmed by in vivo dosimetric measurements of the skin over the cord. The thoracic spinal cord was evaluated to assess if ECRT induced glial cell activation similar to that in the brain, or if neuroinflammation was limited to the brain. The mice treated with 20 Gy had a significantly reduced GFAP expression in the thoracic spinal cord 6 h post treatment (Figure 3B and Figure 4A) compared to the control mice (Figure 3A and Figure 4A). The mice treated with 20 Gy had a significant increase in activated astrocytes in the thoracic spinal cord 5 days (Figure 3H and Figure 4A), 12 days (Figure 3K and Figure 4A), and 25 days (Figure 3N and Figure 4A) post radiation treatment compared to the control mice (Figure 3G,J,M and Figure 4A). The mice treated with 30 Gy had a significantly reduced GFAP expression in the thoracic spinal cord 24 h post treatment (Figure 3F and Figure 4A) compared to the control mice (Figure 3D and Figure 4A). However, these mice subsequently had a significant increase in their GFAP expression in the thoracic spinal cord 25 days (Figure 3O and Figure 4A) post radiation treatment compared to the control mice (Figure 3M and Figure 4A). The mice treated with 20 Gy had a significant increase in activated astrocytes in the thoracic spinal cord 24 h (Figure 3E and Figure 4A), 5 days (Figure 3H and Figure 4A), and 12 days (Figure 3K and Figure 4A) compared to the mice treated with 30 Gy (Figure 3F,I,L and Figure 4A). There was no significant change in the microglial Iba1 expression between the groups throughout this study (Figure 4B).

2.3. Extracranial Causes Significant Glial Cell Activation in the Striatum

The striatum is involved in memory and learning which are two cognitive domains that are impaired in cancer survivors suffering from CRCI [3,25]. Since previous studies have shown increased expressions of the GFAP and IBA1 protein within the striatum of the mice after ECRT, we investigated the effect of ECRT on additional glial cell activation proteins within this region of the brain [1,3]. The mice treated with 20 Gy had significant upregulations of several proteins 12 days following treatment compared to the control mice, including CD11b (Table S1 and Figure 5B), GPNMB (Table S1 and Figure 5F), Ki-67 (Table S1 and Figure 5G), MAP2 (Table S1 and Figure 5H), and MHCII (Table S1 and Figure 5J). At 25 days post treatment, this 20 Gy group had upregulations of CD163 (Table S1 and Figure 5C), CD40 (Table S1 and Figure 5D), GPNMB (Table S1 and Figure 5F), and Ki-67 (Table S1 and Figure 5G) proteins compared to the control mice. Significantly decreased levels of the S100B (Table S1 and Figure 5L) protein were measured in the mice treated with 20 Gy compared to the controls 24 h post treatment.
The mice treated with 30 Gy had a significant upregulation of Aldh1l1 (Table S1 and Figure 5A) protein and significantly decreased levels of the Mertk (Table S1 and Figure 5I) protein in their striatum compared to the control mice at 6 h post treatment. At 5 days post treatment, these mice had significant upregulations of the Aldh1l1 (Table S1 and Figure 5A) and GFAP (Table S1 and Figure 5E) proteins compared to the control mice. At 12 days post treatment, a significant upregulation of the MHCII (Table S1 and Figure 5J) protein and significant downregulations of the NeuN (Table S2 and Figure 5K) and TMEM119 (Table S1 and Figure 5N) proteins were measured in the striatum from the mice treated with 30 Gy compared to that from the control mice. Finally, at 25 days post 30 Gy, the murine striatum had significant upregulations of the Aldh1l1 (Table S1 and Figure 5A), GFAP (Table S1 and Figure 5E), and synaptophysin (Table S1 and Figure 5M) proteins compared to that of the control mice.

2.4. Extracranial Causes Significant Glial Cell Activation in the Retrosplenial Cortex

Upregulations of both the IBA1 and GFAP proteins in the caudal cortex, where the retrosplenial cortex is located, have been previously documented [1,3]. We investigated the effect of ECRT on glial cell activation within the retrosplenial cortex region because memory loss occurs following injury to this region [3,26]. Five days following 20 Gy to the hindlimb, there was a significant upregulation of the SPP1 (Table S2 and Figure 6M) protein in the retrosplenial cortex compared to that of the control mice. At 12 days following 20 Gy, there were significant upregulations of the CD11b (Table S2 and Figure 6B), CD39 (Table S2 and Figure 6D), CD9 (Table S2 and Figure 6E), GPNMB (Table S2 and Figure 6G), Ki-67 (Table S2 and Figure 6H), MAP2 (Table S2 and Figure 6I), and MHCII (Table S2 and Figure 6J) proteins compared to those of the controls. At 25 days post treatment, the retrosplenial cortex from the mice treated with 20 Gy had upregulations of the CD163 (Table S2 and Figure 6C), GPNMB (Table S2 and Figure 6G), and Ki-67 (Table S2 and Figure 6H) proteins compared to those of the control mice.
At 6 h following 30 Gy to the hindlimb, there were significant upregulations of Aldh1l1 (Table S2 and Figure 6A) and GFAP (Table S2 and Figure 6F) proteins compared to those of the control mice. At 24 h post treatment, the Aldh1l1 (Table S2 and Figure 6A) protein remained significantly upregulated compared to that of the control mice. At 5 days post 30 Gy, there was significant upregulation of the Aldh1l1 (Table S2 and Figure 4A), GFAP (Table S2 and Figure 6F), S100B (Table S2 and Figure 6L), SPP1 (Table S2 and Figure 6M), and synaptophysin (Table S2 and Figure 6N) proteins compared to those of the control mice. At 12 days, the mice had significant upregulation of the MAP2 (Table S2 and Figure 6I) and MHCII (Table S2 and Figure 6J) and downregulation of the NeuN (Table S2 and Figure 6K) and TMEM119 (Table S2 and Figure 6O) proteins compared to those of the control mice. Finally, at 25 days following 30 Gy, the retrosplenial cortex had a significant upregulation of the Aldh1l1 (Table S2 and Figure 6A) protein compared to that of the control mice.

2.5. Extracranial Causes Significant Glial Cell Activation in the Hippocampus

The hippocampus is involved with integral aspects of memory and learning, which are critical functions that are disrupted after ECRT [3,27]. Previous studies have shown that ECRT causes upregulations of both the IBA1 and GFAP proteins within the hippocampus of mice [1,3]. Therefore, we wanted to investigate the effect of ECRT on additional hippocampal glial cell activation proteins. In the hippocampus six hours post 20 Gy, significantly increased IBA1 (Table S3 and Figure 7F) proteins and significantly decreased CSF1R (Table S3 and Figure 7B) and Vimentin (Table S3 and Figure 7P) proteins were measured compared to those of the control mice. At 24 h post 20 Gy, the mice had significant upregulations of the CD39 (Table S3 and Figure 7A), MSR1 (Table S3 and Figure 7K), and TMEM119 (Table S3 and Figure 7O) proteins compared to those of the control mice. At 5 days post 20 Gy, the mice had a significant upregulation of the Ctsd (Table S3 and Figure 7C) protein and significant downregulation of the GFAP (Table S3 and Figure 7D) protein compared to those of the control mice. Significant increases in the CSF1R (Table S3 and Figure 5B), GPNMB (Table S3 and Figure 7E), Ki-67 (Table S3 and Figure 7G), MAP2 (Table S3 and Figure 7H), Mertk (Table S3 and Figure 7I), MHCII (Table S3 and Figure 7J), neurofilament light chain (Table S3 and Figure 7M), and SPP1 (Table S3 and Figure 7N) proteins were measured 12 days post 20 Gy compared to the control. At 25 days post 20 Gy, the mice had upregulations of the GPNMB (Table S3 and Figure 7E) and Ki-67 (Table S3 and Figure 7G) proteins compared to those of the control mice.
The hippocampus tissue from the mice treated with 30 Gy similarly had changes in multiple protein levels compared to those of the control tissue. A significant upregulation of the GPNMB (Table S3 and Figure 7E) protein was measured 6 h post 30 Gy compared to that of the control mice. At 12 days post 30 Gy, the mice had significant upregulations of the MAP2 (Table S3 and Figure 7H) and MHCII (Table S3 and Figure 7J) proteins and a significant downregulation of the NeuN (Table S3 and Figure 7L) protein compared to those of the control mice. There was a significant upregulation of the GFAP (Table S3 and Figure 7D) protein at 25 days post 30 Gy compared to that of the control mice.

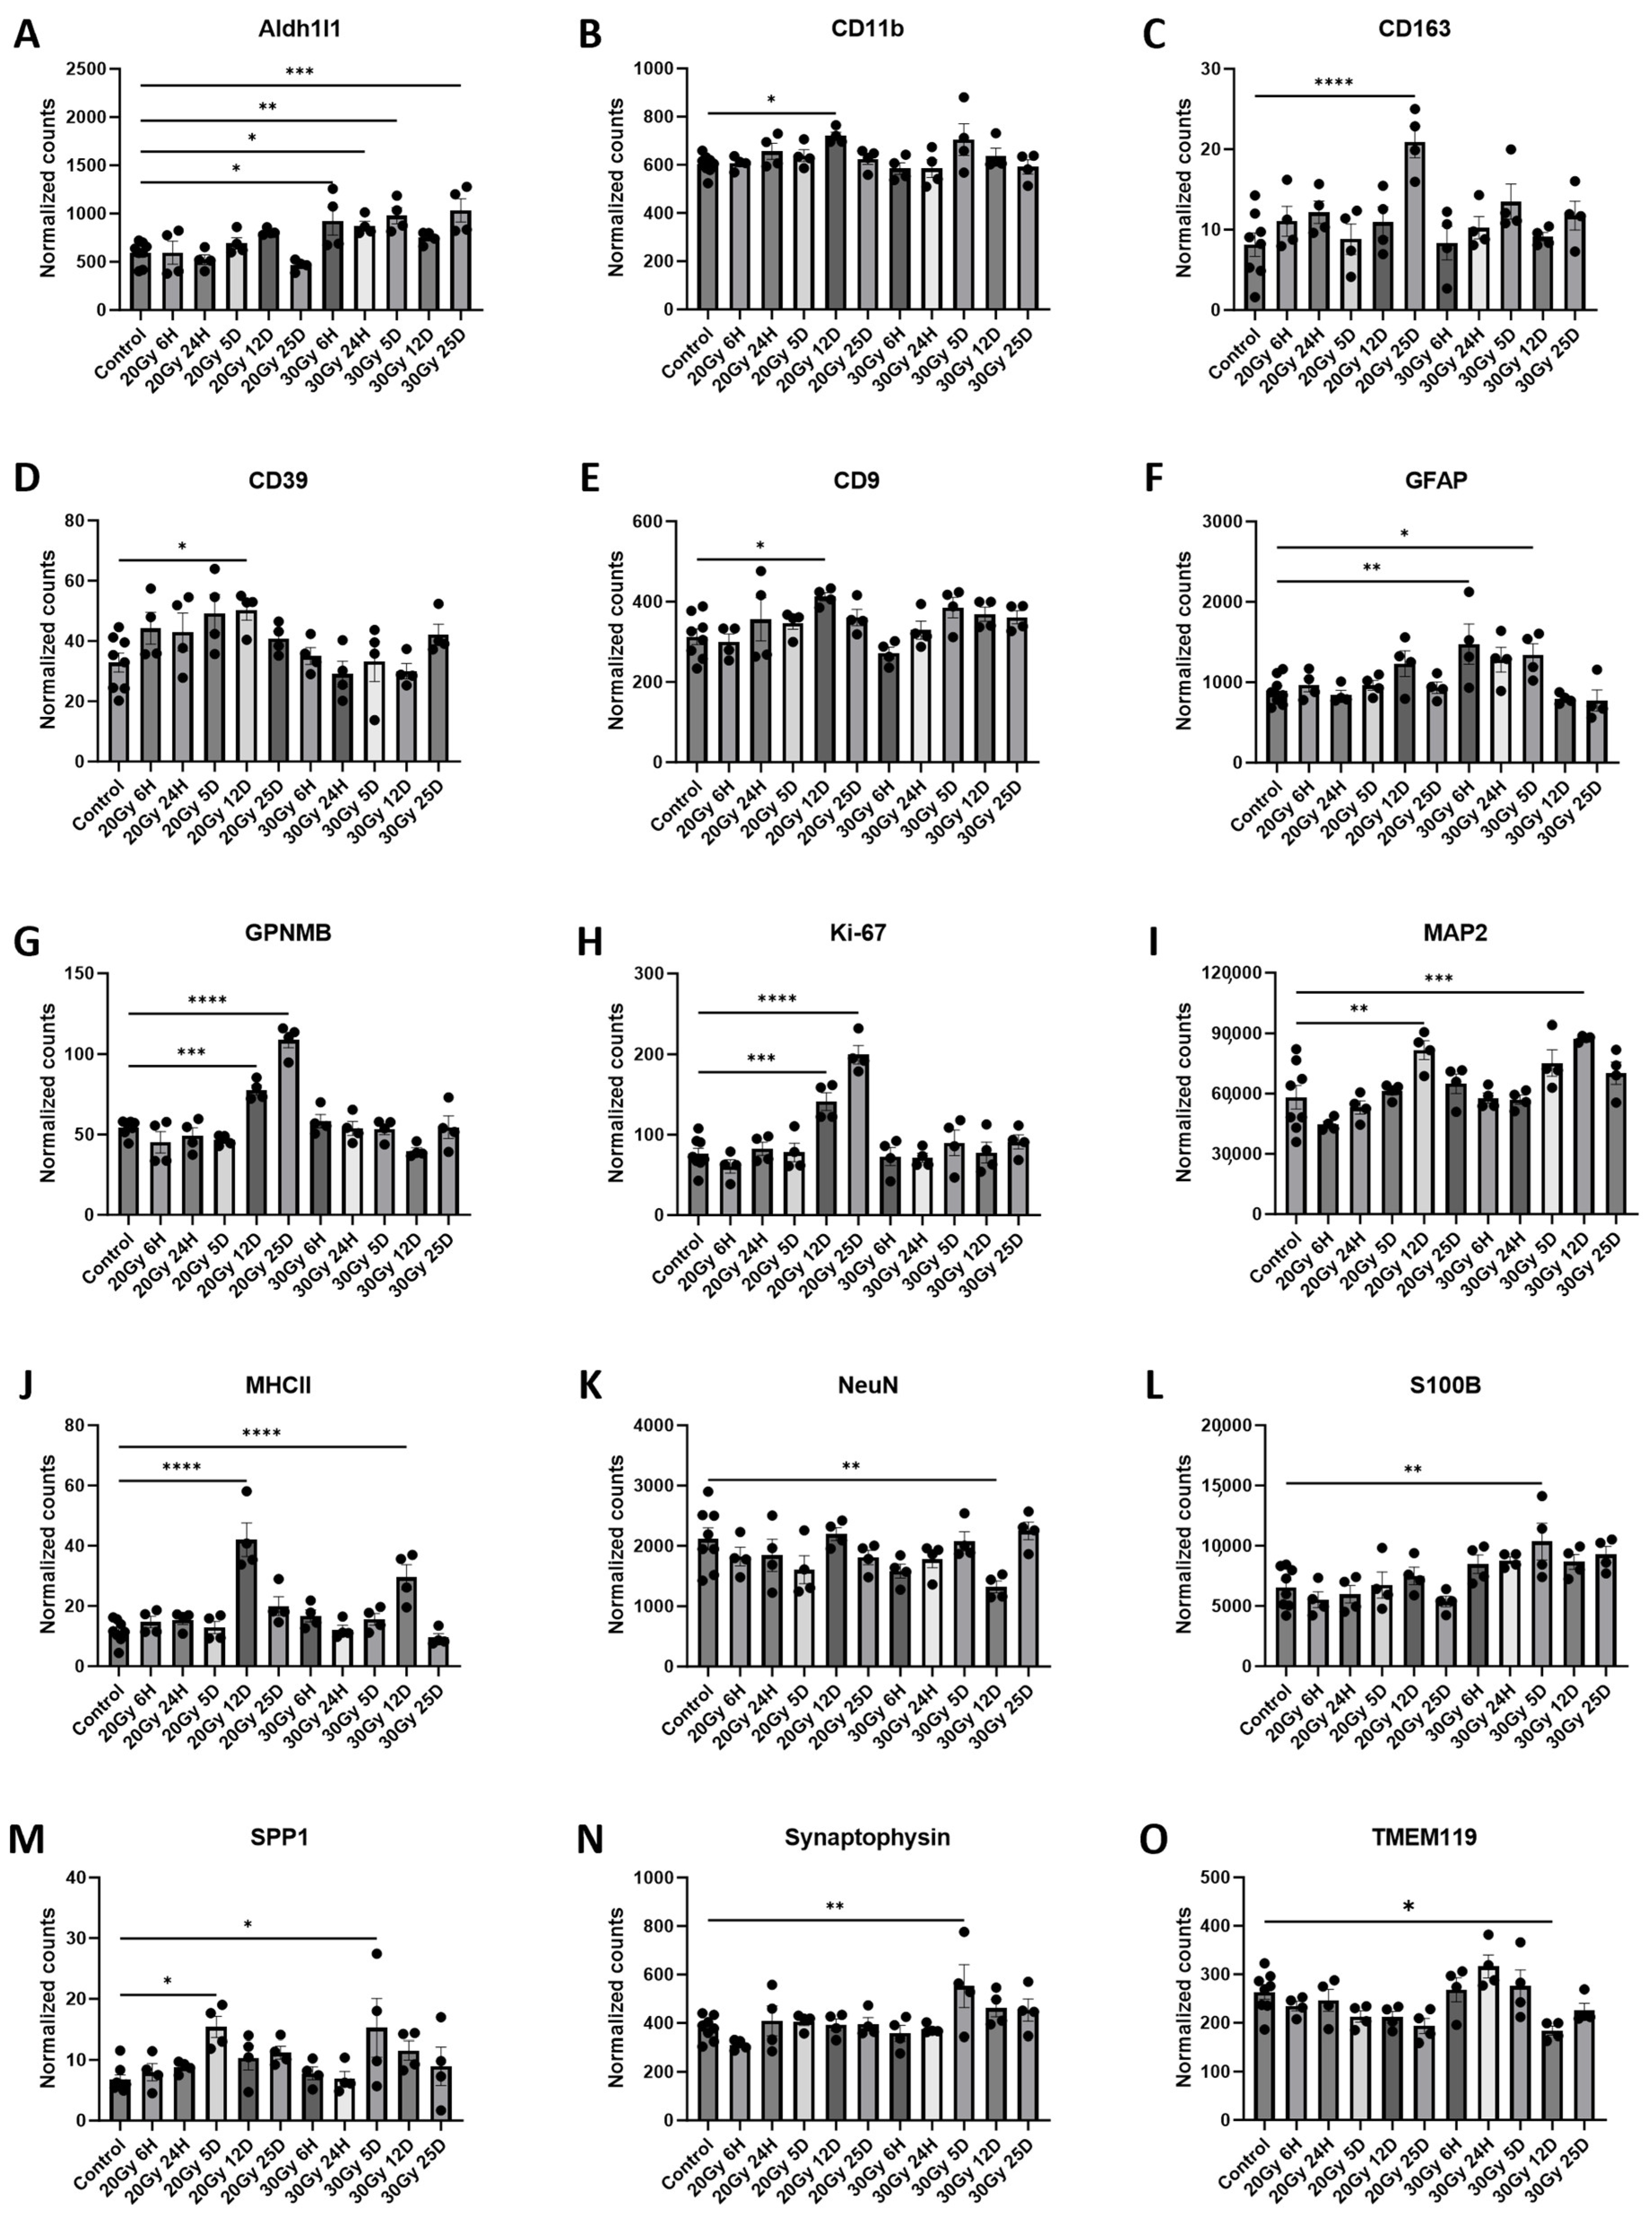
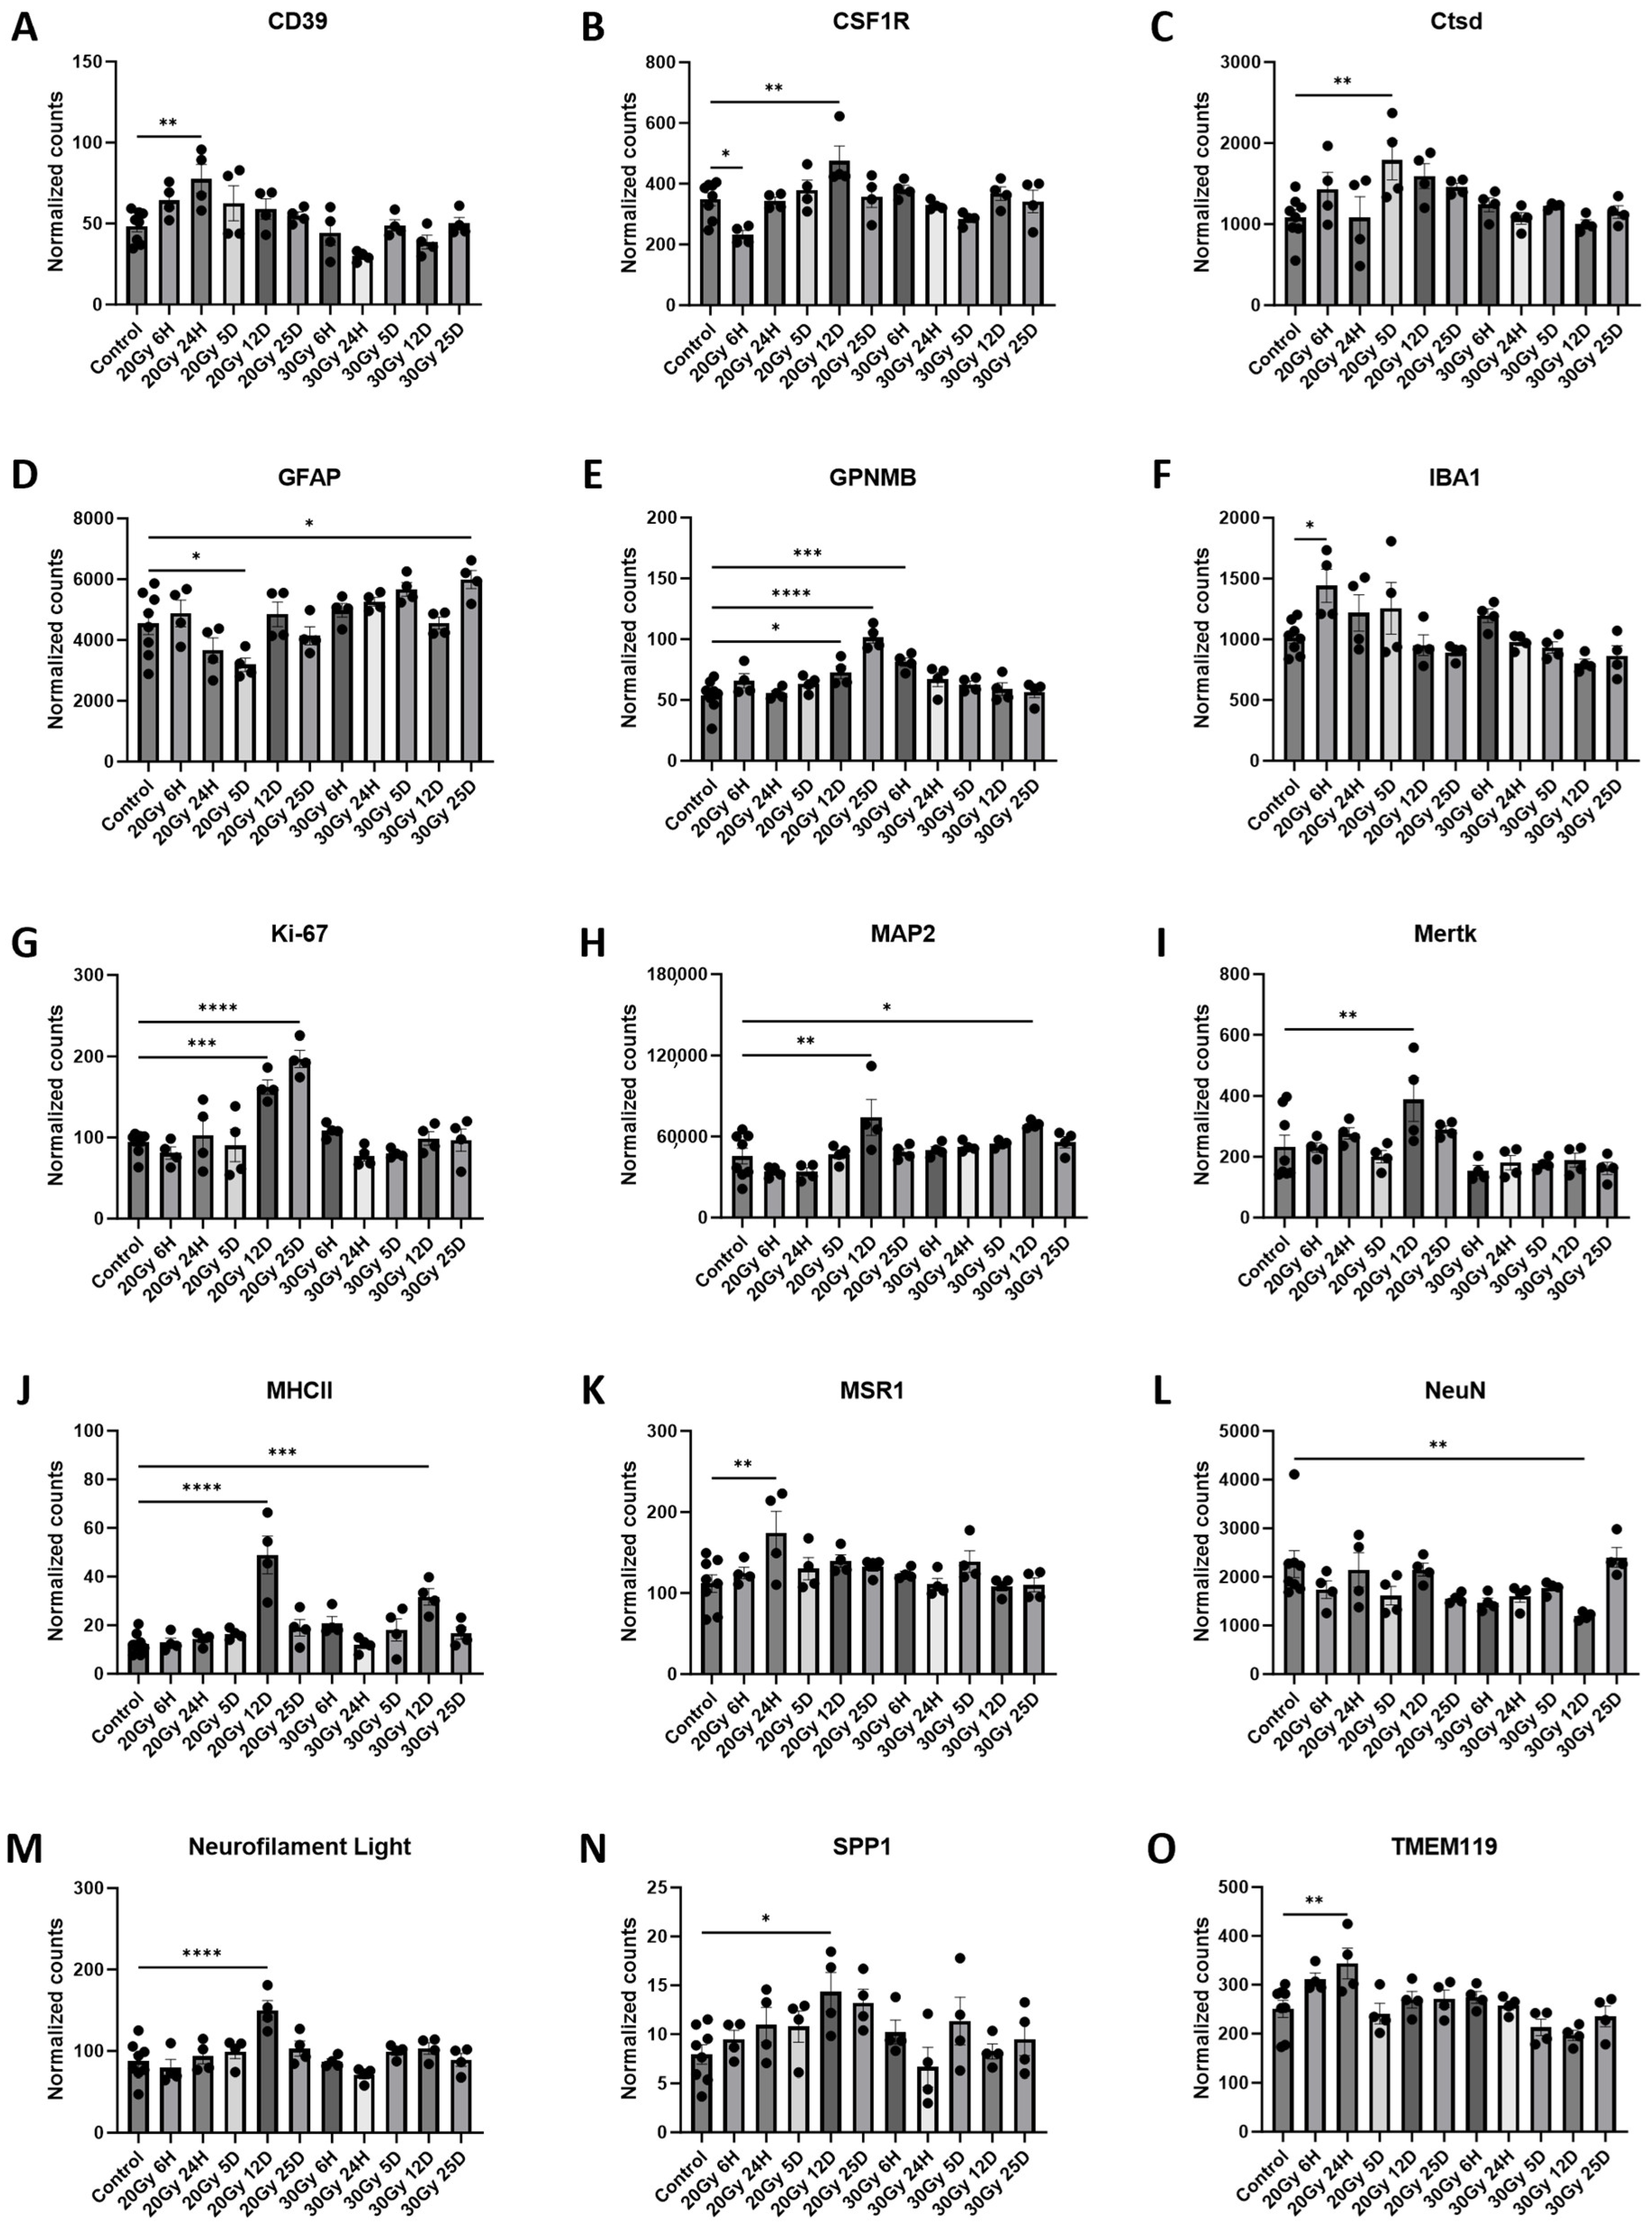
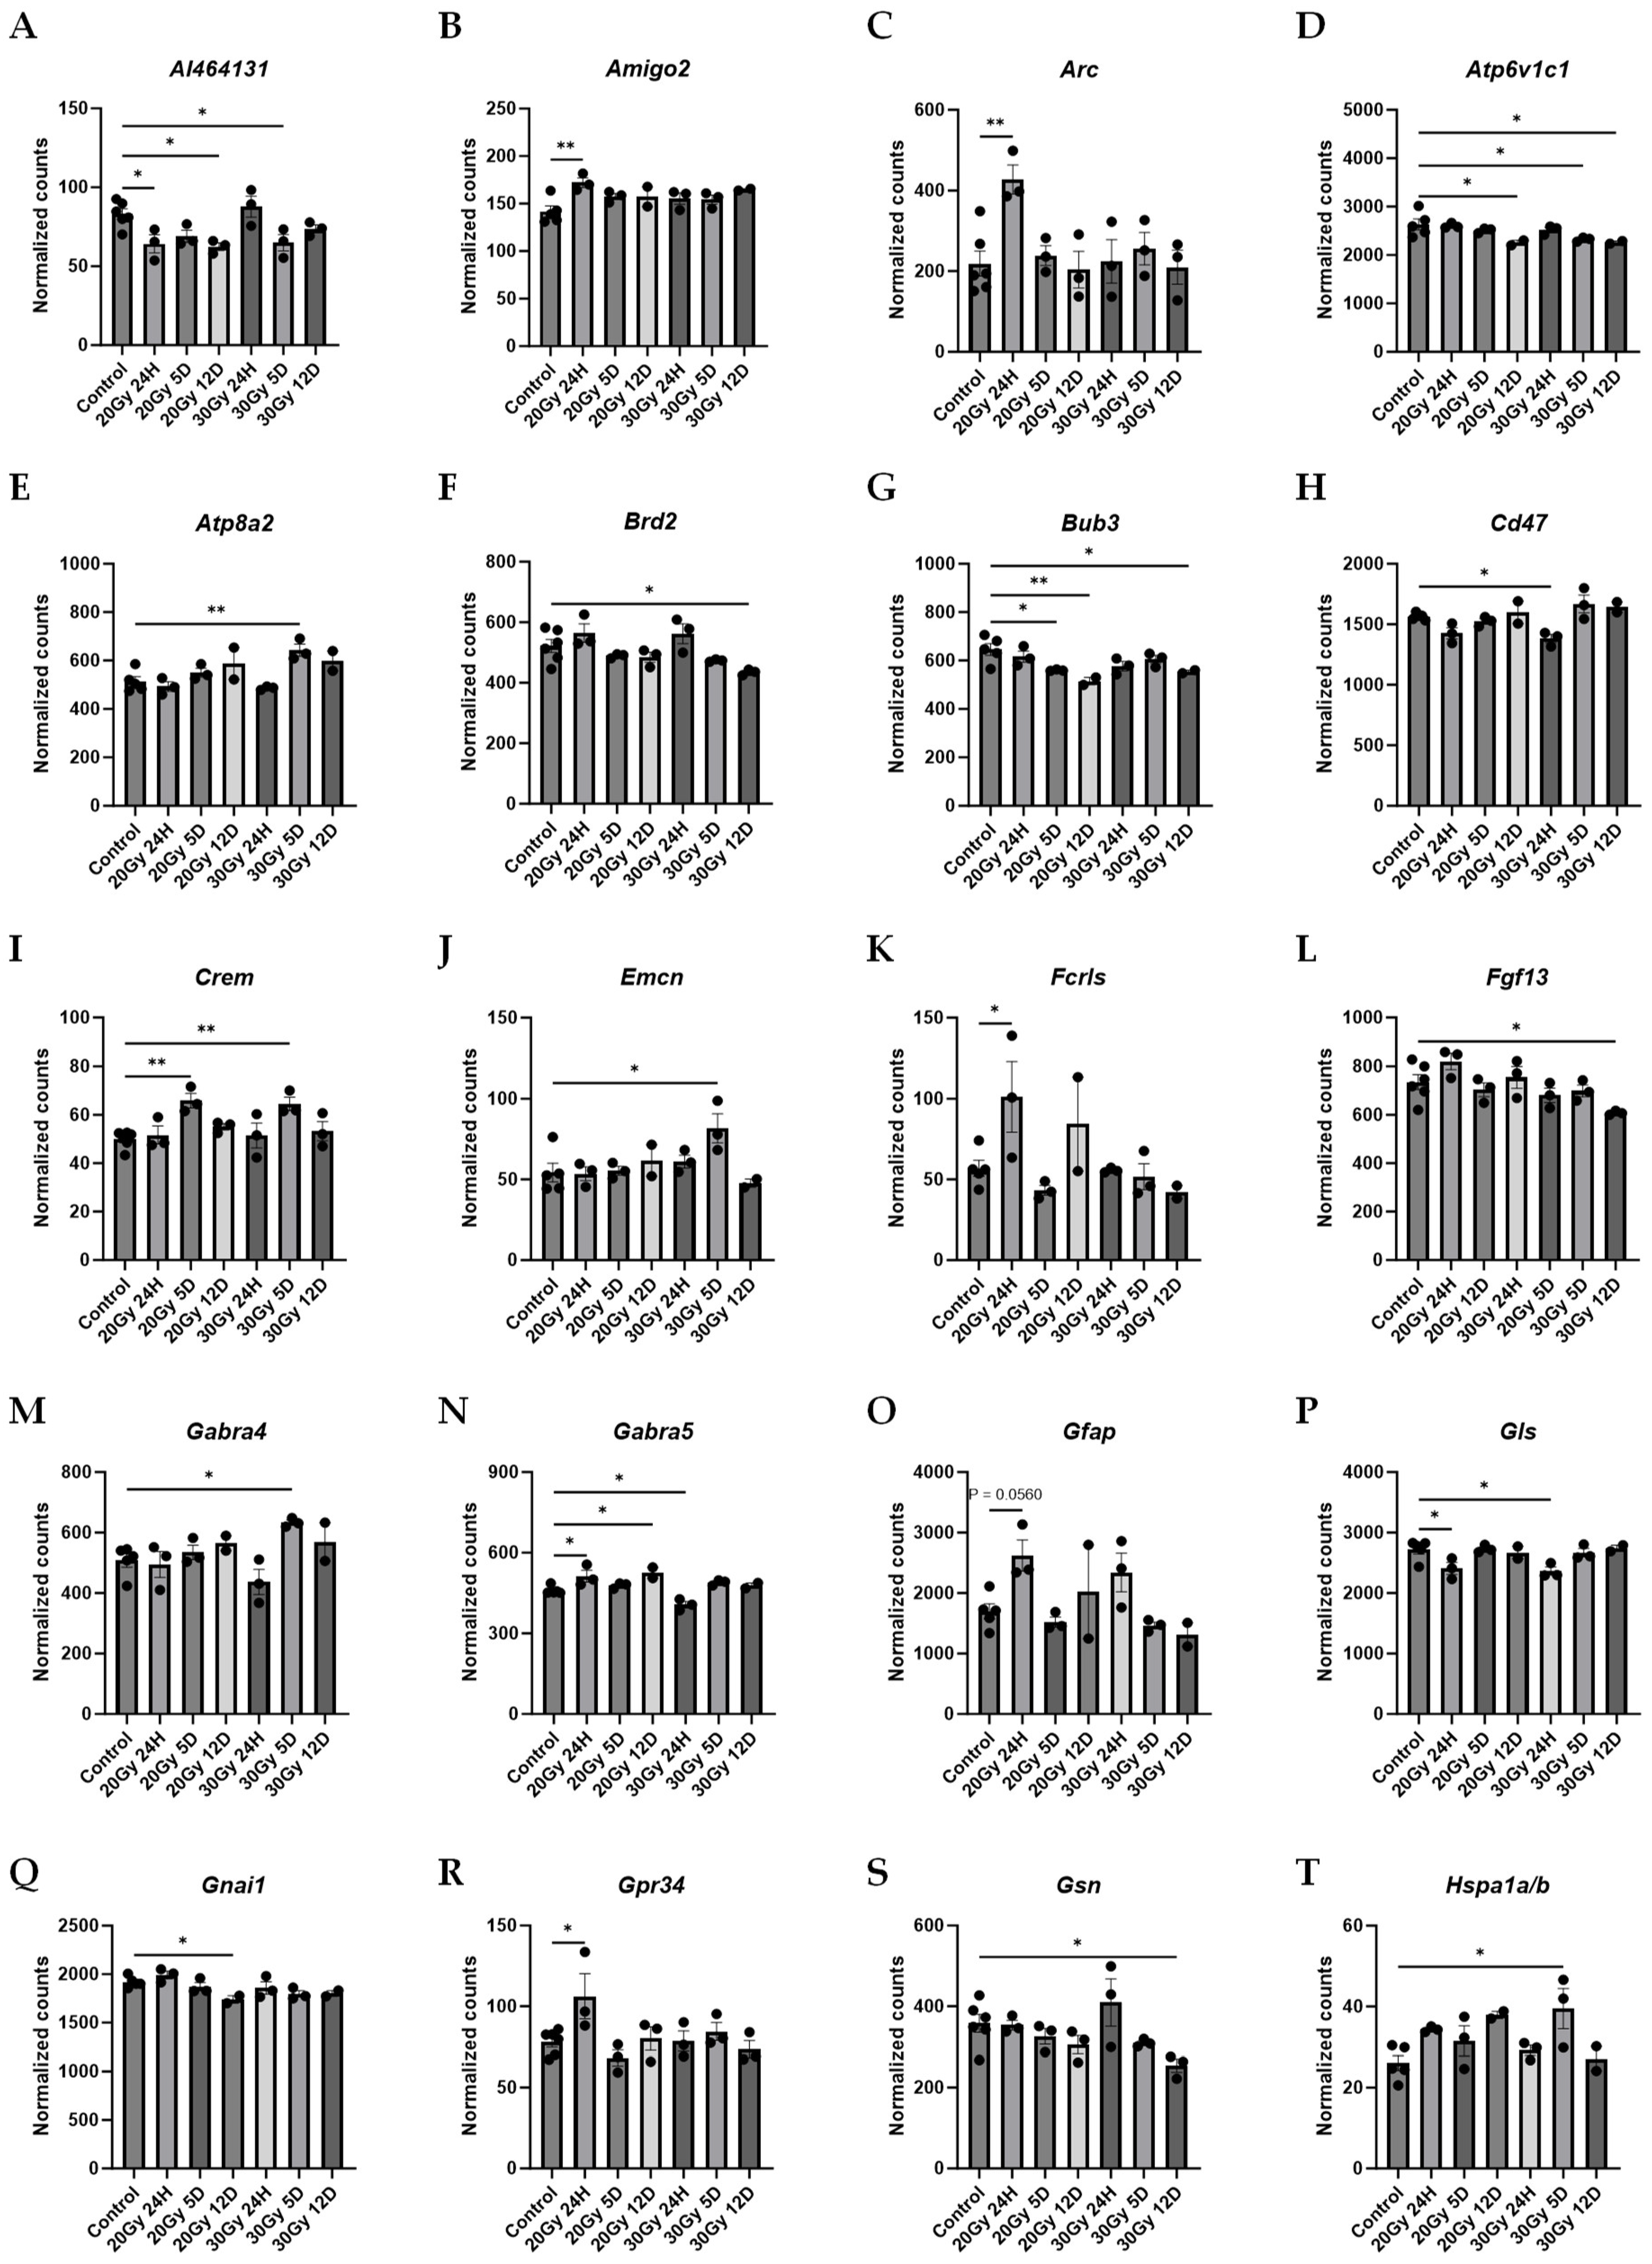
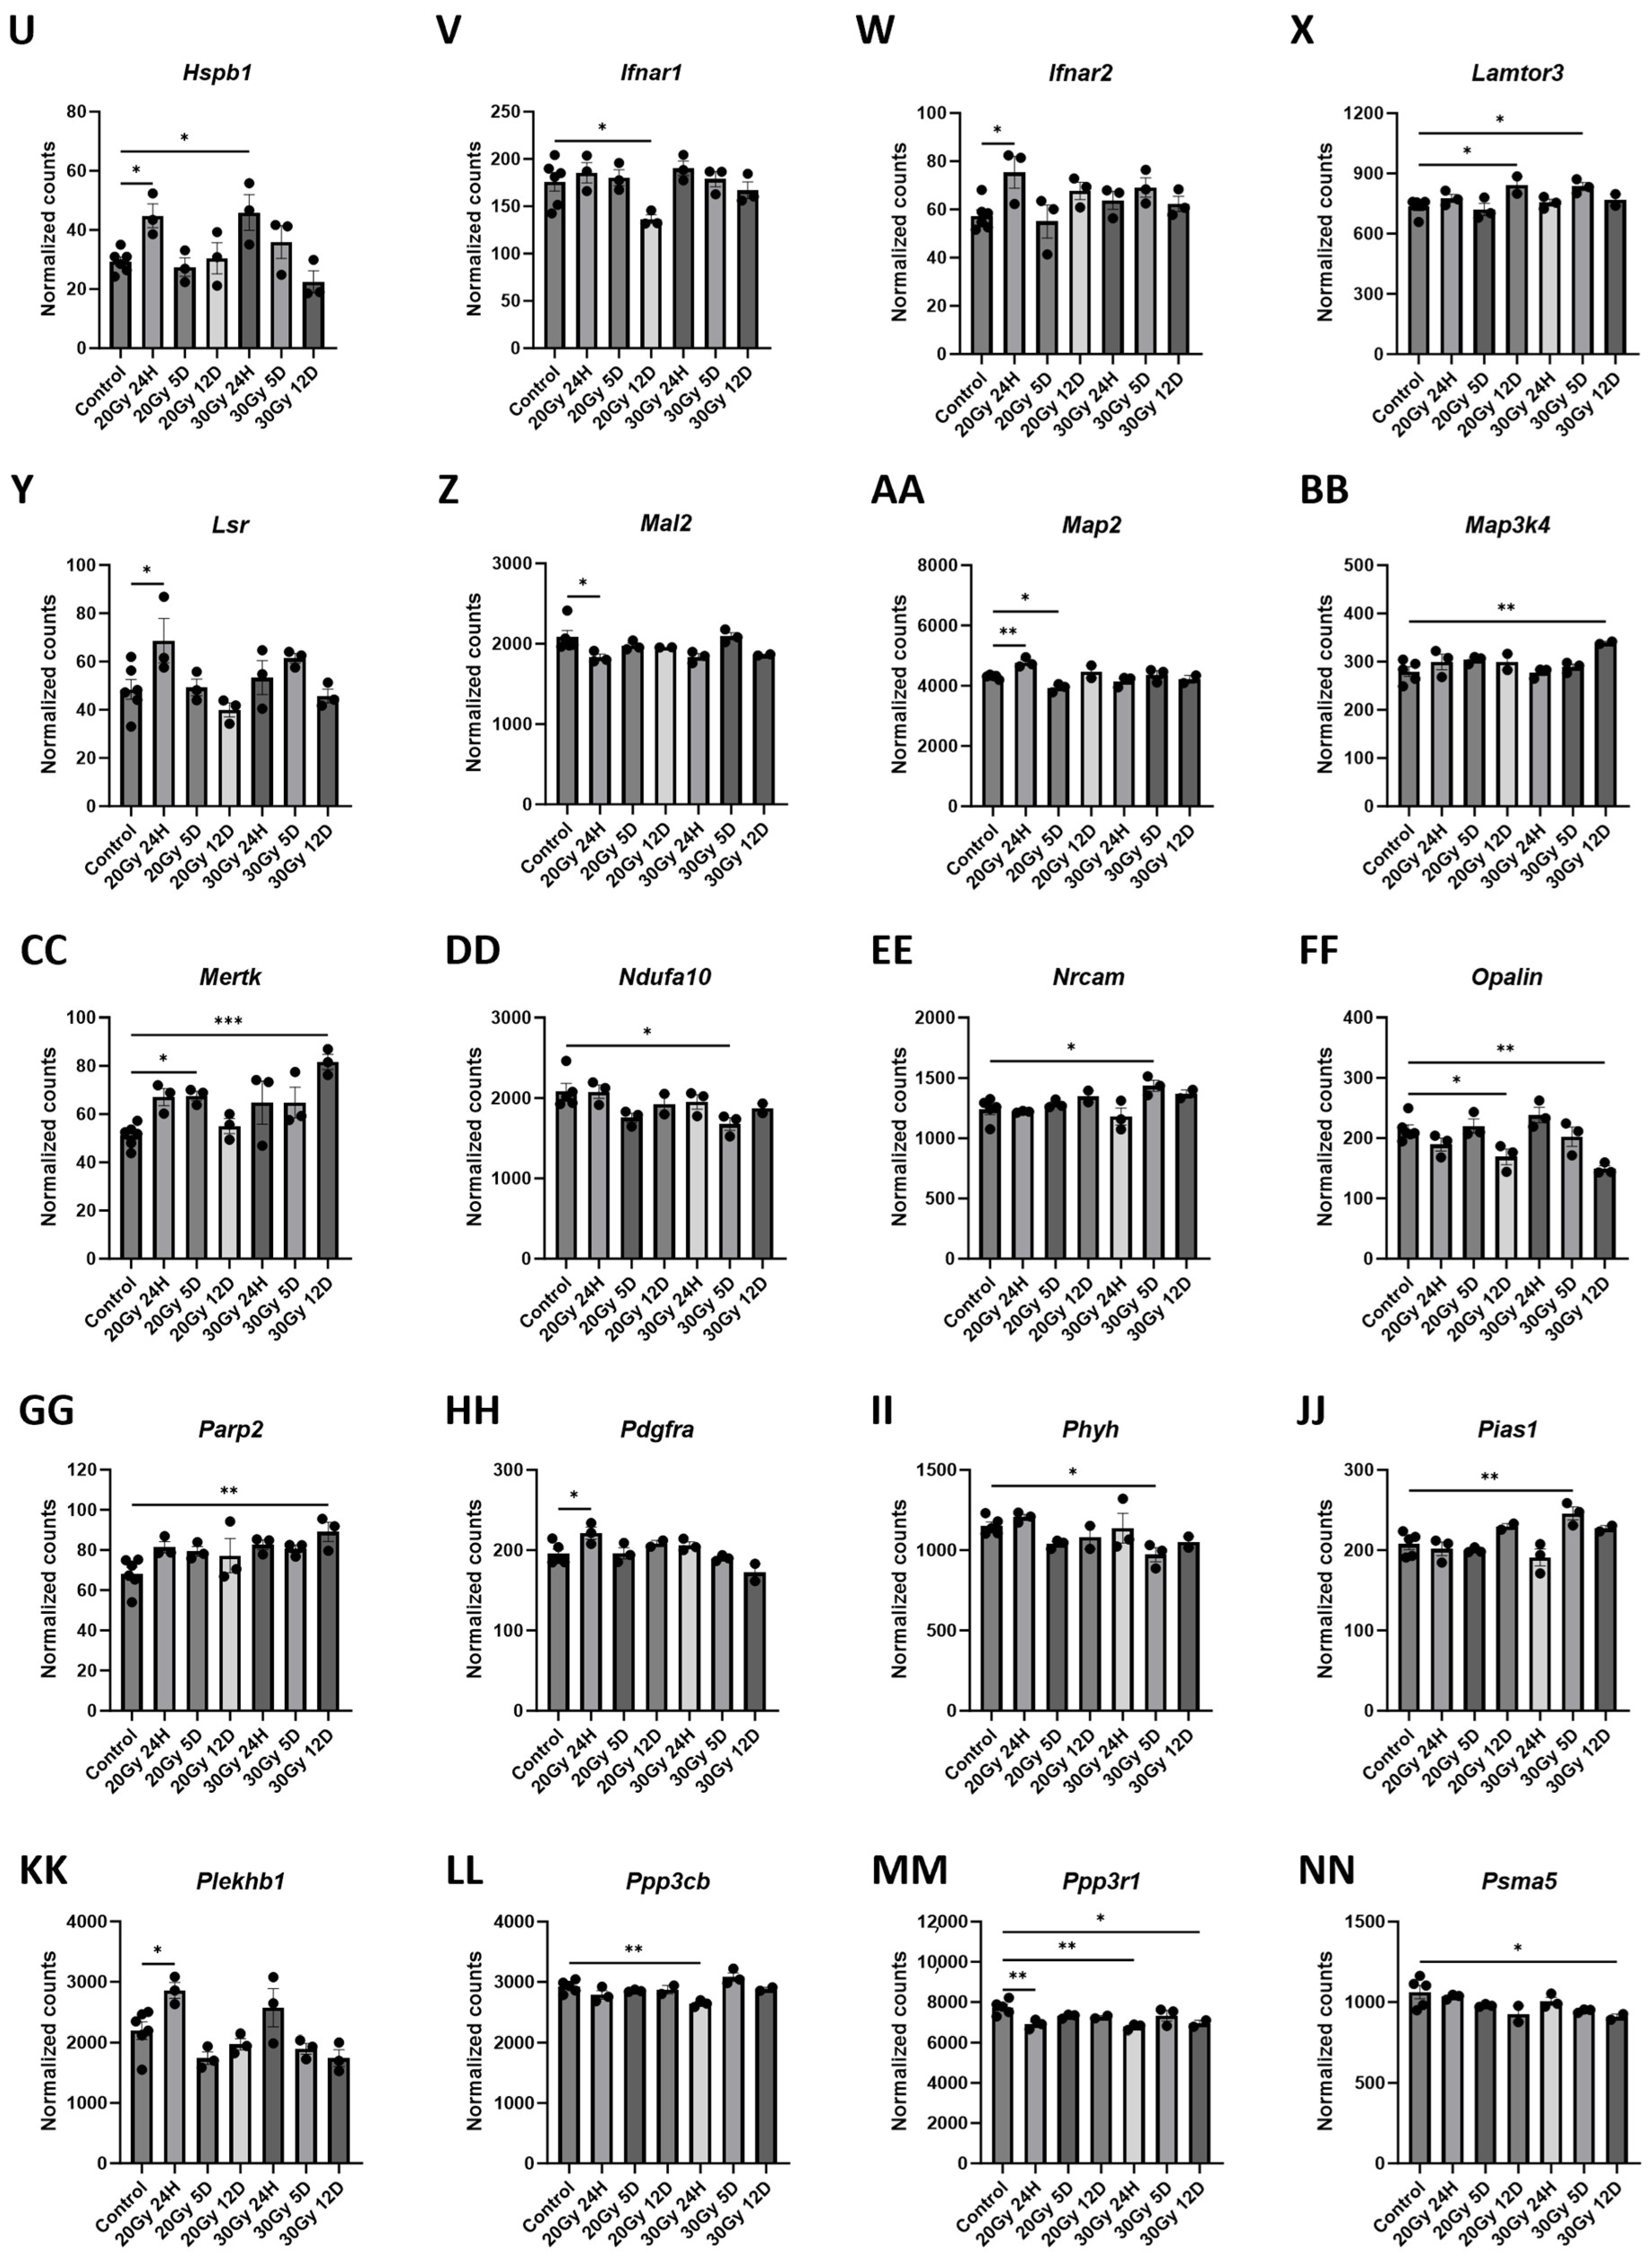
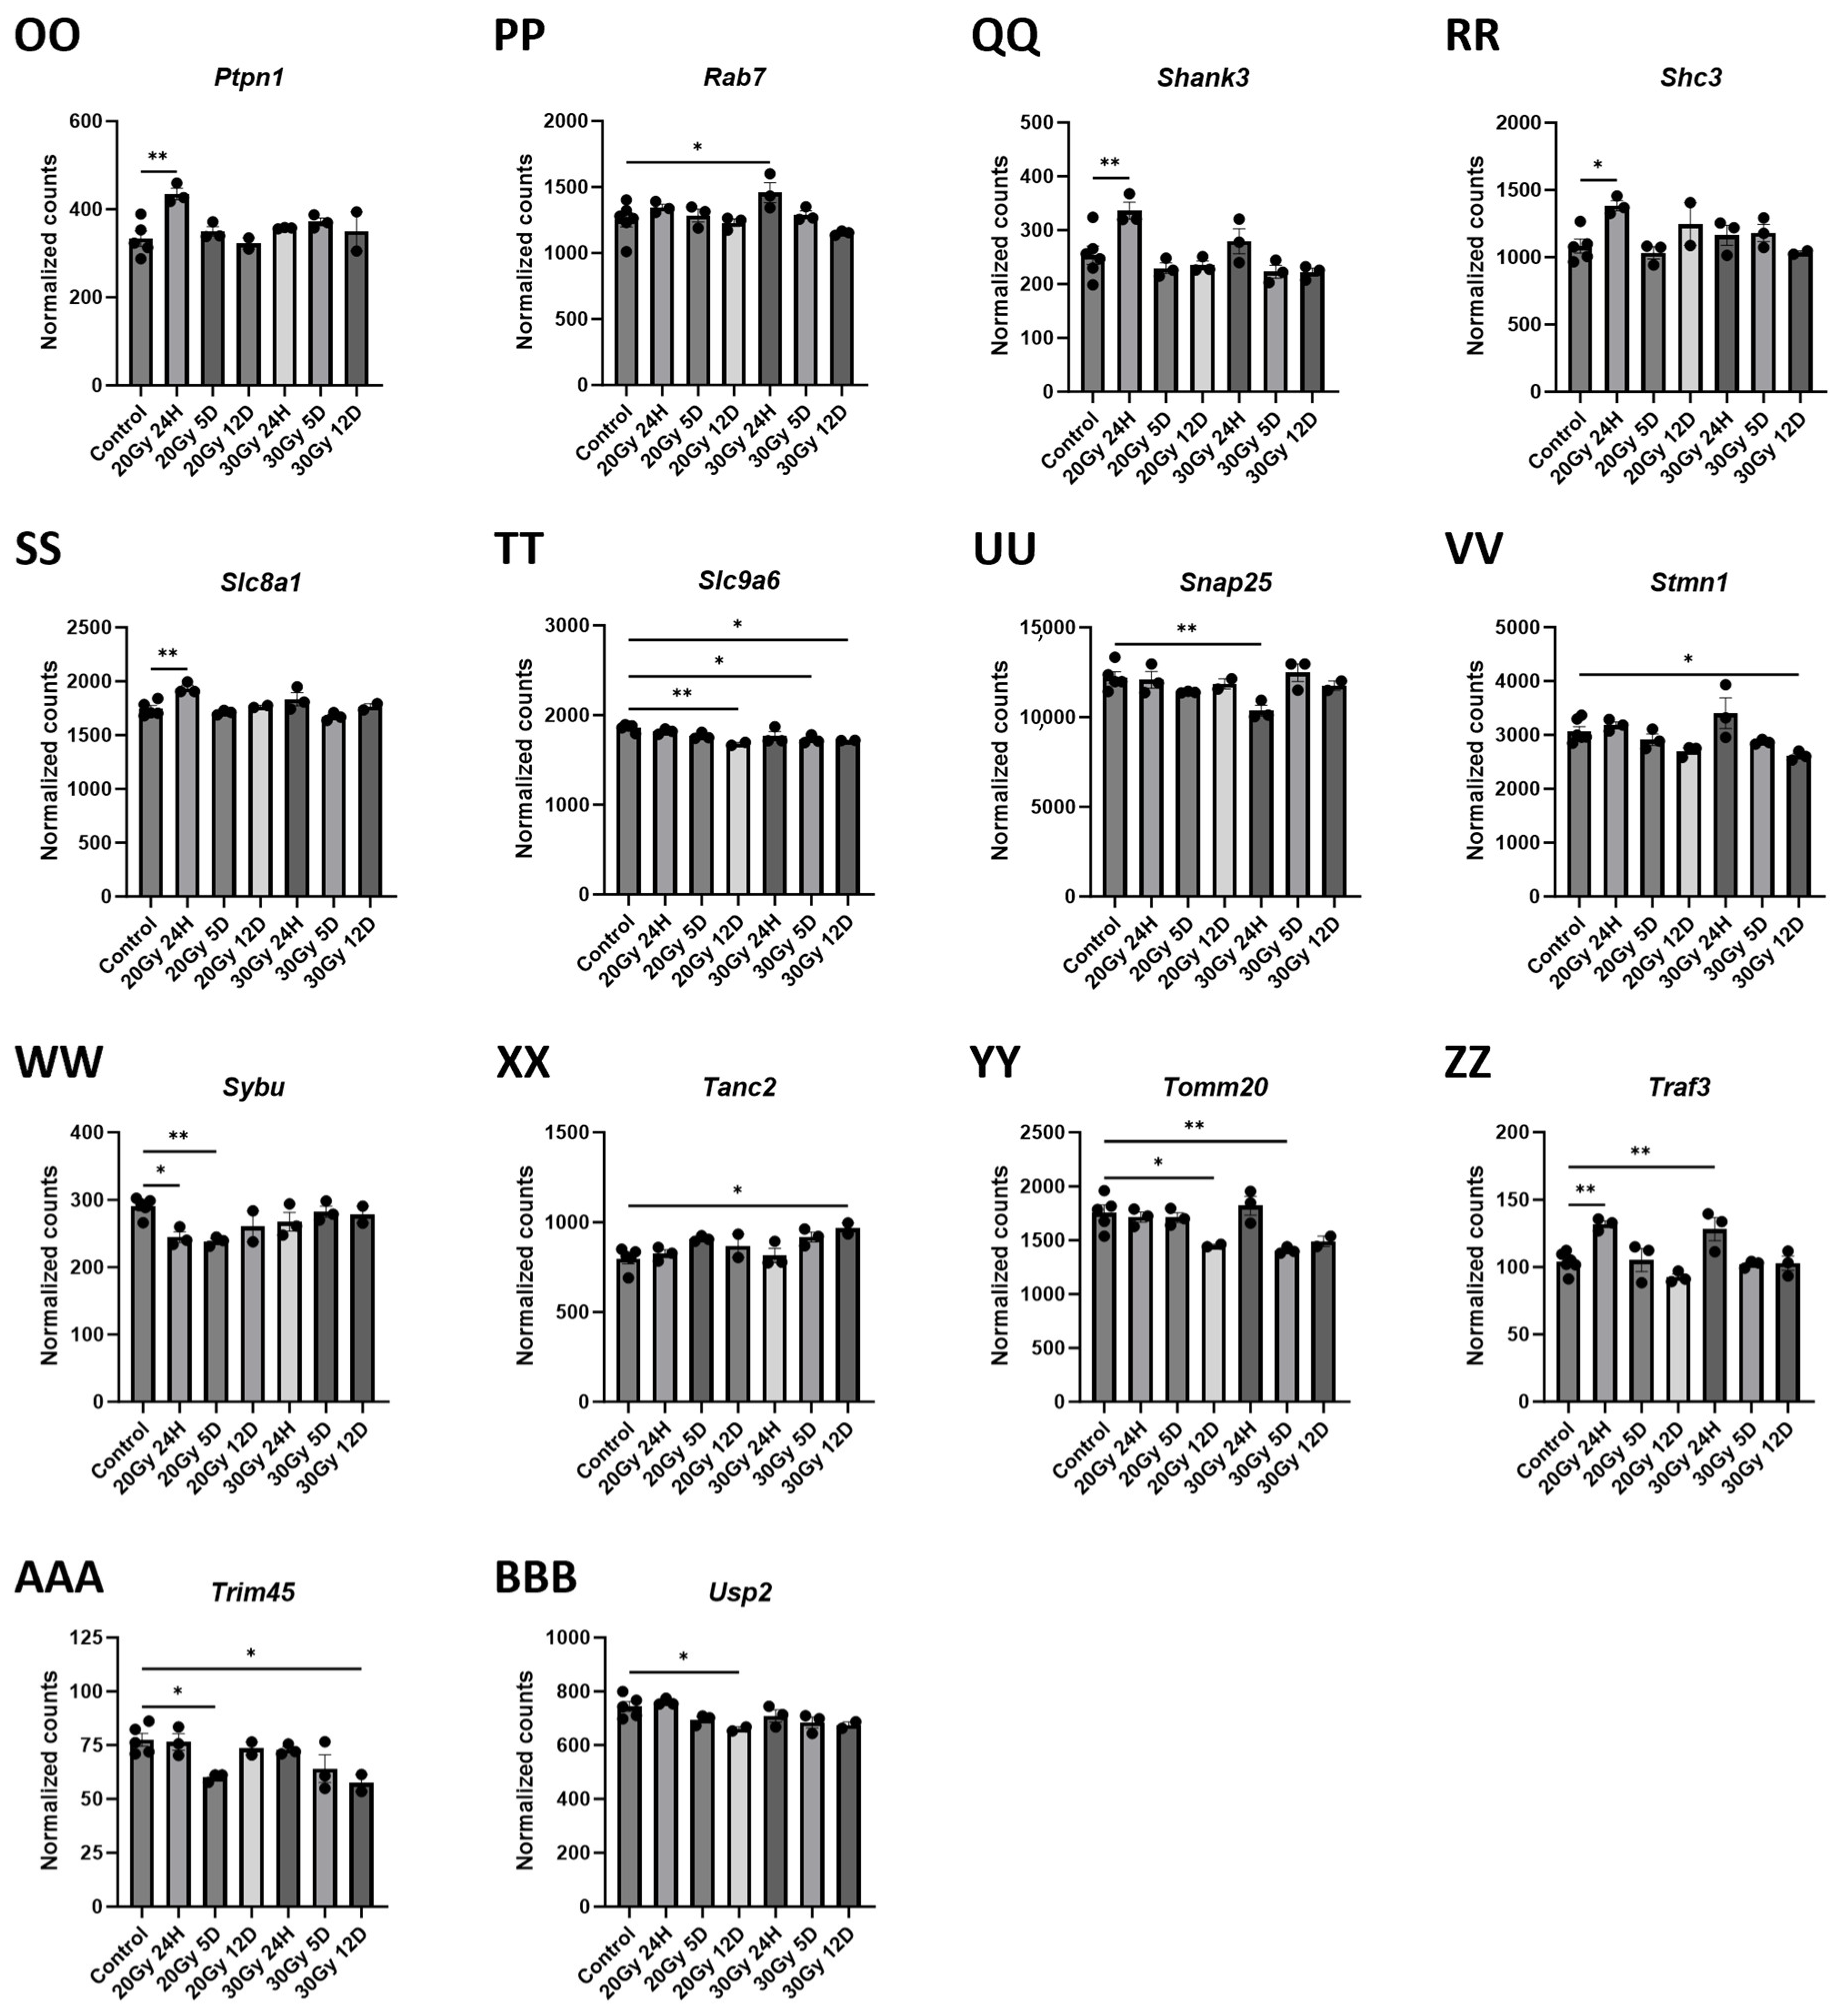
2.6. Extracranial Radiation Causes Molecular Changes in the Normal Brain

Neuroinflammation is associated with cognitive impairment and markers of neuron survival in cancer patients after cancer therapy [28]. We used the Nanostring nCounter® (Seatle, WA, USA) glial profiling panel and neuroinflammation panel to characterize the gene expression patterns related to glial cell activation and neuroinflammation in the brains of the control mice compared to those of the mice treated with 20 Gy or 30 Gy to one hindlimb. Unsupervised hierarchical clustering of the normalized gene expression data for all the mice (Figure S1A,B) and the heat map of gene pathway cluster scores (Figure S1C,D) demonstrate distinct changes in the mice treated with either 20 Gy or 30 Gy.
The brain tissue from the mice 24 h post 20 Gy demonstrated significant upregulations in Amigo2 (Table S4 and Figure 8B), Arc (Table S4 and Figure 8C), Fcrls (Table S4 and Figure 8K), Gabra5 (Table S4 and Figure 8N), Gfap (Figure 8O), Gpr34 (Table S4 and Figure 8R), Hspb1 (Table S4 and Figure 8U), Ifnar2 (Table S4 and Figure 8W), Lsr (Table S4 and Figure 8Y), Map2 (Table S4 and Figure 8AA), Pdgfra (Table S4 and Figure 8HH), Plekhb1 (Table S4 and Figure 8KK), Ptpn1 (Table S4 and Figure 8OO), Shank3 (Table S4 and Figure 8QQ), Shc3 (Table S4 and Figure 8RR), Slc8a1 (Table S4 and Figure 8SS), and Traf3 (Table S4 and Figure 8ZZ) compared to those of the control. At 24 h post 20 Gy, the brains had significant downregulations in Al464131 (Table S4 and Figure 8A), Gls (Table S4 and Figure 8P), Mal2 (Table S4 and Figure 8Z), Ppp3r1 (Table S4 and Figure 8MM) and Sybu (Table S4 and Figure 8WW) gene expressions compared to those of the control brains. The brain tissue acquired 5 days post 20 Gy demonstrated significant upregulations in Crem (Table S4 and Figure 8I) and Mertk (Table S4 and Figure 8CC) compared to those of the control mice. At 5 days post 20 Gy, the brains had significant downregulations in Bub3 (Table S4 and Figure 8G), Map2 (Table S4 and Figure 8AA), Sybu (Table S4 and Figure 8WW), and Trim45 (Table S4 and Figure 8AAA) gene expressions compared to those of the control brains. The brain tissue from 12 days post 20 Gy demonstrated significant upregulations in Gabra5 (Table S4 and Figure 8N) and Lamtor3 (Table S4 and Figure 8X) compared to those of the control. At 12 days post 20 Gy, significant downregulations in Al464131 (Table S4 and Figure 8A), Atp6v1c1 (Table S4 and Figure 8D), Bub3 (Table S4 and Figure 8G), Gnai1 (Table S4 and Figure 8Q), Ifnar1 (Table S4 and Figure 8V), Opalin (Table S4 and Figure 8FF), Slc9a6 (Table S4 and Figure 8TT), Tomm20 (Table S4 and Figure 8YY), and Usp2 (Table S4 and Figure 8BBB) gene expressions were measured, compared to those of the control brains.
The brain tissue from the mice 24 h post 30 Gy demonstrated significant upregulations in the Hspb1 (Table S4 and Figure 8U), Rab7 (Table S4 and Figure 8PP), and Traf3 (Table S4 and Figure 8ZZ) compared to those of the control. At 24 h post 30 Gy, the brains had significant downregulations in Cd47 (Table S4 and Figure 8H), Gabra5 (Table S4 and Figure 8N), Gls (Table S4 and Figure 8P), Ppp3cb (Table S4 and Figure 8LL), Ppp3r1 (Table S4 and Figure 8MM), and Snap25 (Table S4 and Figure 8UU) gene expressions compared to those of the control brains. The brain tissue from the mice 5 days post 30 Gy demonstrated significant upregulations in Atp8a2 (Table S4 and Figure 8E), Crem (Table S4 and Figure 8I), Emcn (Table S4 and Figure 8J), Gabra4 (Table S4 and Figure 8M), Hspa1a/b (Table S4 and Figure 8T), Lamtor3 (Table S4 and Figure 8X), Nrcam (Table S4 and Figure 8EE), and Pias1 (Table S4 and Figure 8JJ) compared to those of the control mice. At 5 days post 30 Gy, the brains had significant downregulations in Al464131 (Table S4 and Figure 8A), Atp6v1c1 (Table S4 and Figure 8D), Ndufa10 (Table S4 and Figure 8DD), Phyh (Table S4 and Figure 8II), Slc9a6 (Table S4 and Figure 8TT), and Tomm20 (Table S4 and Figure 8YY) gene expressions compared to those of the control brains. The brain tissue 12 days post 30 Gy demonstrated significant upregulations in Map3k4 (Table S4 and Figure 8BB), Mertk (Table S4 and Figure 8CC), Parp2 (Table S4 and Figure 8GG), and Tanc2 (Table S4 and Figure 8XX) compared to those of the control. At 12 days post 30 Gy, there were significant downregulations in Atp6v1c1 (Table S4 and Figure 8D), Brd2 (Table S4 and Figure 8F), Bub3 (Table S4 and Figure 8G), Fgf13 (Table S4 and Figure 8L), Gsn (Table S4 and Figure 8S), Opalin (Table S4 and Figure 8FF), Ppp3r1 (Table S4 and Figure 8MM), Psma5 (Table S4 and Figure 8NN), Slc9a6 (Table S4 and Figure 8TT), Stmn1 (Table S4 and Figure 8VV), and Trim45 (Table S4 and Figure 8AAA) gene expressions compared to those of the control brains.

2.7. Gene Changes Caused by Extracranial Radiation Therapy Are Associated with Neuronal Transmission

A pathway enrichment analysis was performed on the 54 differentially expressed genes in murine brain following either 20 Gy or 30 Gy ECRT compared to brains from the control, unirradiated mice (Table 1). The 40 pathway enrichments included 13 associated with neuronal transmission, 13 associated with immune cells, 8 associated with cell signal transduction, and 1 associated with cancer. Other functions included in the enrichment analysis were insulin signaling, cytoskeleton regulation, and oxidative stress, infections, and osteoclast differentiation.

3. Discussion

This study demonstrated radiation dose-dependent changes in protein and gene expressions in the brains of the mice following ECRT. Differentially expressed genes in the brains of the ECRT mice were associated with neurotransmission, glial cell activation, innate immune cell signaling, MAPK signaling, lipid metabolism, cell cytoskeleton, DNA damage, cancer, and epigenetic regulation [29,30,31,32,33].
Our previous study demonstrated significant increases in activated microglia and astrocytes within a variety of regions of the brain of SKH1 mice after hindlimb radiation [3]. Because it is unclear how hindlimb irradiation affects brain tissue, we evaluated the activation of microglia and astrocytes within the thoracic spinal cord to determine if a similar pathology develops or if the response was unique to unirradiated brains. Interestingly, compared to those of the control mice, the mice treated with 20 Gy had a significant upregulation of the GFAP protein within the astrocytes 5 days after treatment, but this change did not occur until 25 days after treatment in the mice treated with 30 Gy. This could have been due to inflammatory mediators localizing in the irradiated skin since substantial microscopic and macroscopic skin toxicity had begun 10 days post 30 Gy. Cytokines including Il-1, Il-6, TNF-α, and TGF-β are produced by fibroblasts, keratinocytes, endothelial cells, and immune cells at the irradiated site to recruit immune cells to this site [34]. Studies in rodent skin demonstrate a dose-dependent increase in TGF-β following irradiation that lasts days following treatment [19,35]. TGF-β can recruit inflammatory cells to the skin and is involved in the tissue repair process following radiation treatment [35]. It is possible that persistent local inflammation within the skin following the 30 Gy mice caused a delay in astrocytosis in this group, compared to the mice treated with 20 Gy.
Following 20 Gy, increased disease-associated microglia proteins, including SPP1, GPNMB, and CD9, were increased in the striatum, retrosplenial cortex, and hippocampus, all of which contribute to memory functions [26,36,37]. Increases in these proteins are also reported in neurodegenerative diseases and intracranial cancer [38,39,40,41,42]. In contrast, only GPNMB was overexpressed in the hippocampus in murine brains following 30 Gy. The brains from this group exhibited increases in astrocyte-associated proteins, including GFAP and Aldh1l1, in the striatum, retrosplenial cortex, and hippocampus, supporting astrocytic neuroinflammation as opposed to microglial inflammation [43]. These differences highlight that radiation does not uniformly induce the same out-of-field effects, and other factors (e.g., local field-related factors) may be important contributors to neuroinflammation. Further work needs to specify and verify radiation doses in the study of neuroinflammation to avoid confounding results.
Few proteins were upregulated in both groups similarly. MHC proteins are rare in normal brains, and the MHCII protein has been shown to be upregulated with neuroinflammation and multiple neurodegenerative diseases [44]. Indeed, murine brains had significantly upregulated MHCII in the striatum, retrosplenial cortex, and hippocampus, regardless of radiation dose. Therapies that downregulate MHCII may have a role in mitigating CRCI in cancer survivors [45,46]. Microtubule-associated protein 2 (MAP2), expressed in reactive astrocytes after brain injury potentially to stabilize the cytoskeleton [47,48,49], was upregulated 20 Gy or 30 Gy in the retrosplenial cortex and hippocampus compared to those of the controls. This may be a response or repair mechanism, and future studies may examine if changes in MAP2 are associated with the duration of cognitive dysfunction.
Proliferation, as measured by Ki-67, was upregulated within the striatum, retrosplenial cortex, and hippocampus following 20 Gy. While there is a radiation dose-dependent effect on proliferation within irradiated tumors and irradiated brains [50,51], we are the first to show an increased proliferation in distinct structural regions of an unirradiated organ. Increased Ki-67 has also been associated with Alzheimer’s disease, Down’s syndrome, and dementia [52]. Because Ki-67 can be assessed relatively inexpensively through immunohistochemical means, it may be a reasonable, measurable target to evaluate in interventional studies seeking to minimize the neuroinflammatory effects of cancer therapy. Also following 20 Gy, the neurofilament light chain (NFL) protein, a biomarker of neurodegeneration [53], was increased in the hippocampus at the time of peak dermatitis. Importantly, serum NFL may reflect histological changes in neurodegenerative diseases, suggesting a possible serum protein to measure in patients to identify the risk or severity of CRCI during and after treatment [54].
Cellular reactions within the brain are commonly measured via evaluation of neuron-specific nuclear protein (NeuN) or synaptophysin. Interestingly, decreased NeuN and increased synaptophysin occurred only in the mice treated with 30 Gy at the timepoints assessed. NeuN is a universal marker for neurons and its expression is decreased in several pathological conditions including cerebral ischemia, hypoxia, and trauma [55]. It is possible that NeuN downregulation was simply due to a high degree of astrocytosis and microgliosis as we have previously noted in these regions after ECRT [3]. Increased synaptophysin occurs in brain injury models in rodents [56] and is a marker of neuron damage [57]; it is unclear why synaptophysin was increased early (5 days following irradiation) only in mice treated with 30 Gy.
A diverse set of gene changes occurred in mice treated with either 20 Gy or 30 Gy ECRT compared to the control mice. The genes involved with microglia function including Cd47, Mertk, Fcrls, Gpr34, Stmn1, Atp6v1c1, Hspa1a/b, and Usp2 were significantly different between the irradiated and control mice. The Cd47 Mertk, and Stmn1 genes have been shown to be involved in microglia activation [58,59]. The changes seen in these genes in this study supports microglia activation following ECRT. Both Fcrls and Gpr34 were significantly upregulated in the brain at 24 h post 20 Gy, which is the same timepoint that multiple microglia-activated proteins were upregulated. This supports that 20 Gy ECRT induces early microgliosis [42,60,61]. It is not clear why 30 Gy does not induce this same finding, although it is possible this may occur at an altered timepoint not captured. The Atp6v1c1 gene has been shown to be downregulated in multiple neurodegenerative diseases including Alzheimer’s, Parkinson’s, and dementia [62,63]. The Atp6v1c1 gene was downregulated in the brain following both 20 Gy and 30 Gy. Interestingly, a reduction in the expression of the Atp6v1c1 gene in the hippocampus was reported after whole-body irradiation in mice [64], as opposed to that after focal hindlimb irradiation. Hspa1a/b encodes for heat shock protein 70 (HSP70-1a and HSP70-1b) that directs proteins for lysosome degradation in the microglia, and this gene has been shown to be upregulated in neurodegenerative diseases [65,66,67]. Hspa1a/b was significantly upregulated in murine brains following 30 Gy, which could indicate microglia cellular stress [67]. Usp2 downregulation is associated with stress-induced spatial memory retrieval impairment in rats [68]. There was a significant decrease in Usp2 expression within the brain post 20 Gy, which could contribute to cognitive impairment. Notably, we previously showed in separate experiments that cognitive impairment occurred in SKH1 mice 14 days post 20 Gy to the right hindlimb [3].
The genes involved with astrocyte function including Amigo2, Gfap, Al464131, Hspb1, and Nrcam were significantly changed between the mice prescribed ECRT and the control mice. Amigo2 is an A1-neurtoxic-associated gene in astrocytes and is involved in regulating cell survival, adhesion, neurite development, axon tract formation, and angiogenesis [69,70,71]. In a prior study, mice treated with brain irradiation had a significantly upregulated Amigo2 expression in the hippocampus from 24 h to 1 week post treatment [69]. Our data also support that the Amigo2 upregulation is an early change, occurring 24 h post 20 Gy. Early-onset astrocytosis was also supported by increases in the Gfap gene expression 24 h post 20 Gy [3]. The Al464131 gene has been shown to be downregulated in activated astrocytes in an ischemic stroke rodent model, and in this study, it was also downregulated in the brain following 20 Gy or 30 Gy, again supporting astrocyte activation [72,73]. Hspb1 is upregulated in response to oxidative stress, brain injury, and neurodegenerative diseases [74]. This gene was upregulated in the brain following 20 Gy or 30 Gy which could indicate oxidative stress in the brain. The Nrcam gene is involved with GABAergic synapse transmission and was upregulated in the brain following 30 Gy which could indicate increased inhibitory GABAergic synapse transmission [75,76].
Genes involved with neurotransmission and neuronal development that could negatively impact memory and cognition, including Arc, Atp8a2, Crem, Shank3, Gabra4, Gabra5, Gls, Gnai1, Ndufa10, Shc3, Slc8a1, Slc9a6, Snap25, Mal2, Map2, and Fgf13, were significantly changed in the ECRT mice compared to the control mice. The Arc gene plays a crucial role in the synaptic plasticity of neurons and has been shown to be increased in neuron activation associated with learning and memory [77,78]. Significant Arc upregulation, which is suggestive of increased neuron activation [78] occurred in the brains from the mice that received 20 Gy but not 30 Gy. The Atp8a2 gene involved in neuron development and function has been shown when overexpressed in mice to enhance neurite outgrowth in rat hippocampal neurons [79,80]. The brain expression of Atp8a2 increased following 30 Gy ECRT, which could be a sign of neuronal response to neuroinflammation. The Crem gene is involved in a variety of processes in the brain including neurogenesis, the shaping of synaptic plasticity, neurodegeneration, learning, and memory [81]. The Crem gene was upregulated in the brains of the irradiated mice post 20 Gy or 30 Gy, further supporting that radiation induces neuronal activation. Shank3 regulates glutamatergic synapses and with its increased expression it causes increased functional neurotransmitter release [82]. Shank3 gene expression was significantly increased following 20 Gy, which could suggest increased neurotransmission [82]. Gabra4 and Gabra5 both contribute to inhibitory synapses signaling in neurons [83,84] and affect mood and memory; both Gabra4 and Gabra5 were increased after irradiation, although the former was only increased following 30 Gy. The Gls gene, which encodes for the glutaminase that is the main glutamate-producer enzyme in the brain, was downregulated in the mice treated with either 20 Gy or 30 Gy, similar to other findings in neurodegenerative disease [85,86]. The Gnai1 gene plays a role in cholinergic and GABAnergic synaptic pathways [87]. At 20 Gy ECRT, the significantly downregulated Gnai1 gene could imply ECRT effects on cholinergic synaptic transmission. The Ndufa10 gene downregulation in the brains of patients suffering from Alzheimer’s has been correlated with a higher degree of dementia [88]. A significant downregulation of Ndufa10 was noted following 30 Gy, which could exert a negative effect on memory. The Shc3 gene is involved in neurotrophic pathways controlling neuronal metabolism, learning, and memory through the regulation of NMDA receptor function in the hippocampus [89]. Early increased Shc3 following 20 Gy could be linked to the memory deficits in these mice. The upregulation of the Slc8a1 gene expressed in neurons and in rodent models of neurodegenerative diseases has been demonstrated to mediate microglia activation [90,91]. The early, upregulated Slc8a1 expression following 20 Gy adds further support of early-onset microglia activation. The Slc9a6 is found to be downregulated in both Parkinson’s and Alzheimer’s disease [92,93]. This gene was downregulated following either 20 Gy or 30 Gy ECRT. Snap25 encodes for synaptosome-associated protein 25 (SNAP-25) which facilitates the fusion of synaptic vesicles and neurotransmitter release [94]. Snap25 deficiency has been implicated in a variety of cognitive disorders, and it was significantly decreased early post 30 Gy [95]. Mal2 is involved in glutamatergic neurotransmission and is downregulated in the brains of patients suffering from Alzheimer’s disease [96,97,98]. Mal2 was significantly reduced in the brains early after 20 Gy treatment which could indicate decreased glutamatergic neurotransmission. The Map2 gene is essential for the assembly of microtubules involved in dendritic plasticity [99,100]. Map2 expression was significantly increased early post 20 Gy. Interestingly, MAP2 protein expression was increased 12 days post 20 Gy in multiple regions of the brain, which could be related to cognitive decline since the upregulation of Map2 expression has been shown to be correlated with cognitive decline in aging rodents [100,101]. The Fgf13 gene promotes neuronal polarization, neurite outgrowth, and neuron migration, and the loss of FGF13 is associated with a decrease in memory and learning capacity [102,103]. FGF13 expression was significantly decreased in the brains of the mice post 30 Gy, which could be associated with a reduced memory capacity [103].
Collectively, our data support neuroinflammation that occurs in mice treated with localized irradiation to a distant limb. Distinct protein and gene expression changes occur early and within 30 days of radiation; these unique patterns are attributable to different radiation doses. Many proteins and genes altered in the brains from the irradiated mice are upregulated in a variety of devastating neurodegenerative diseases that affect cognitive function. Our data support combined efforts to study these signaling pathways as they contribute to memory and cognition. Limitations in this study can be addressed in future studies. First, the mice were treated with a single radiation treatment using a high dose. This resulted in significant molecular changes in the brains of these mice. While this is applicable to human patients treated with single-fraction SRS or palliative radiation to extracranial sites, many humans are treated with lower doses of radiation for multiple treatments. In future studies, we will use multidose-radiation protocols similar to those prescribed to human cancer patients, as well as low total doses to delineate dose–response relationships in particular signaling pathways. The number of mice was small due to this being a pilot study to identify specific timepoints post treatment where there were significant molecular changes in the brain. This may have led to a type II error, particularly as we identified decreases in protein and gene expression changes that did not reach significance. Finally, while whole-brain-hemisphere gene expression changes identified key alterations following ECRT, further work is needed to identify gene changes within specific anatomic regions. Future studies will use spatial transcriptomics to evaluate gene expression in specific regions of the brain involved in memory formation in ECRT-treated mice.

4. Materials and Methods

4.1. Experimental Animals

Nine-to-thirteen-week-old female SKH1 mice were purchased from Charles River Laboratories (Wilmington, MA, USA). Female mice were used for this study since female breast cancer survivors are disproportionately affected by ECRT-induced CRCI [7,8,10,11,16,104]. The mice were assigned groups according to body weight with 4 mice per group. The mice groups are summarized in Table 2. This study was performed with approval by and in accordance with the University of Minnesota Institutional Animal Care and Use Committee (UMN-IACUC). The mice were euthanized (E) at 6 h, 24 h, 5 days, 12 days, and 25 days post irradiation by carbon dioxide proceeded by exsanguination in accordance the UMN-IACUC Criteria for Carbon Dioxide Euthanasia Guidelines. The timepoints were selected because prior work demonstrated behavioral and histopathological changes [3]. After euthanasia, the brain, thoracic spinal cord, and skin from the right hindlimb were collected from each mouse.

4.2. Radiation Treatment

The mice were treated with a dose of 20 Gy or 30 Gy radiation to the skin surface of the right hindlimb using 6 MeV electrons (Varian 2100 iX; Varian Medical Systems, Inc., Palo Alto, CA, USA). The dose was selected based on our prior work which demonstrated that 30 Gy induces severe dermatitis and gliosis [19] in SKH-1 mice, whereas 20 Gy is associated with low grade (hair loss) cutaneous changes [105]. The radiation treatment protocol was identical to that previously published [3]. For immobilization, the mice were administered intraperitoneal (IP) ketamine (93–95 mg/kg) and xylazine (3–5 mg/kg). The control mice were anesthetized with the same dose of xylazine and ketamine. The mice treated with 30 Gy dose of radiation developed dermatitis on day 10. Therefore, the 30 Gy 25D mice were given carprofen subcutaneously at a dose of 1 mg/mL (~8 mg/kg) starting on day 10 once a day for 4 days to treat the dermatitis.

4.3. Hematoxylin and Eosin (H&E) Stain

The irradiated skin from the right hindlimb of each mouse (n = 4 from each group) was fixed in 10% neutral-buffered formalin and paraffin-embedded. Five-micron sagittal tissue sections were deparaffinized in xylene and then rehydrated in graded alcohol. Slides were stained with Harris Modified Hematoxylin with acetic acid (EXPREDIA, Kalamazoo, MI, USA, Cat# 7221). The slides were dipped into acid water (0.15% HCL, Acros Organics, Fair Lawn, NJ, USA, Cat# NJAC124210010) followed by running tap water. The slides were then dipped in ammonium water (2.8% of ammonium hydroxide 28–30%, Newcomer Supply, Middleton, WI, USA, Cat# 1006A). The slides were counterstained with Eosin (Leica Biosystems, Deer Park, IL, USA, Cat# 3801600). The slides were dehydrated in graded alcohol and xylene, and then, coverslips were placed using permount mounting media (Leica Biosystems, Deer Park, IL, USA, Cat# 3801731).

4.4. Immunohistochemistry (IHC)

The mouse thoracic spinal cords (n = 4 from each group) were collected, including the spinal columns, and were fixed in 10% neutral-buffered formalin and then decalcified in 10% ethylenediaminetetraacetic acid (Fisher Scientific UK, Loughborough, UK, Cat# 118430010) in 1X PBS (MP Biomedicals, Inc NO, Solon, OH, USA, Cat# 092810305) at pH 6 for 5 days. Three-four sections of the thoracic spinal cord from each mouse were paraffin-embedded and sectioned onto slides. Five-micron tissue sections on slides were baked overnight at 60 °C. Then, the tissue sections were deparaffinized in xylene and then rehydrated in graded alcohol. Antigen retrieval took place in a Biocare Decloaking Chamber (Biocare Medical, Concord, CA, USA) at 80 °C for 1 h with sodium citrate buffer at pH 6. The tissue sections were blocked with Biocare Background Punisher (Biocare Medical, Concord, CA, USA, Cat# 50-823-79) for 30 min in a humidity chamber at room temperature. The sections were immunostained for activated microglia (rabbit polyclonal anti-Iba1; Abcam, Cambridge, MA, CAT# ab178847-100UL; 1:100 in TBS) overnight and activated astrocytes (rabbit polyclonal anti-GFAP; Abcam, Cambridge, MA, USA, Cat# ab7260-50UL; 1:2500 in PBS) for 2 h. Tissue sections were subsequently stained with a secondary antibody, goat anti-rabbit Alexa-Fluor 488 (Invitrogen, Molecular Probes, Inc., Eugene, OR, USA, Cat# A11008; 1:250 in TBS). The slides were stained, omitting the primary antibody for the negative controls. The slides were counterstained with 4′,6-Diamidino-2-Phenylindole, Dihydrochloride (DAPI, Invitrogen, Molecular Probes, Inc., Eugene, OR, USA; 1:500 in PBS) for 20 min in the dark.

4.5. IHC Analysis

Two thoracic spinal cords from each slide were analyzed. Using an upright microscope (Olympus BX53 microscope with Olympus DP73 camera, Olympus America Inc., Center Valley, PA, USA), 4–6 consecutive, nonoverlapping, adjacent images were acquired at 200× magnification on a DAPI filter and fluorescein isothiocyanate (FITC) filter. The corresponding DAPI and FITC images were overlaid using Photoshop 2021 version 22.5.1 (Adobe, San Jose, CA, USA). The images were analyzed using ImageJ (ImageJ 1.53e, Wayne Rashband, and contributors, National Institutes of Health, Bethesda, MD, USA, https://imagej.net/ij/ 20 August 2023). The multi-point tool was used to manually count the Dapi nuclei, Iba1+ cells, and GFAP+ cells in each consecutive image to evaluate microgliosis and astrocytosis [3]. The percentage of Iba1+ cells or percentage of GFAP+ cells was calculated by the following formula: the number of Iba1+ cells or GFAP+ cells counted/the number of Dapi nuclei counted in the same image × 100. The percentage of Iba1+ cells or percentage of GFAP+ cells from each consecutive image of the spinal cord were averaged for each mouse.

4.6. Tissue Preparation for Nanostring GeoMx Assay

The Nanostring GeoMx Assay was used to analyze tissue from the following treatment groups (n = 4 from each group) and timepoints: control 6 h, control 25 day, 20 Gy 6 h, 20 Gy 24 h, 20 Gy 5 day, 20 Gy 12 day, 20 Gy 25 day, 30 Gy 6 h, 30 Gy 24 h, 30 Gy 5 day, 30 Gy 12 day, and 30 Gy 25 day. Formalin-fixed paraffin-embedded blocks were made containing the left hemisphere of brains from 4 mice from the same group. The tissues from the FFPE blocks were sectioned at a thickness of 5 microns and mounted on Superfrost Plus Microscope Slides (Fisherbrand, Pittsburgh, PA, USA, Cat# 12-550-15). The sections were placed within the central 36.2 mm × 14.6 mm area of the slides to ensure the tissues fit within the gasketed GeoMx slide holder. The mounted tissues were dried in a hood overnight at room temperature. The slides were processed and stained using the Nanostring GeoMx Protein slide preparation protocol. DEPC-treated water (ThermoFisher, Carlsbad, CA, USA, Cat# AM9922) was used to make all solutions. The slides were baked for approximately 60 min at 60 °C. After baking, the tissue was deparaffinized and rehydrated with Citrisolv (Fisher Scientific, Cat# 04-355-121), H2O, and EtOH. Antigen retrieval was performed with a citrate antigen retrieval buffer (Sigma-Aldrich, St. Louis, MO, USA, Cat# C9999-100 ML, pH 6.0). The slides were placed into a TintoRetriever pressure cooker (Bio SB, Goleta, CA, USA, BSB 7008) and target retrieval was performed at a high temperature and high pressure for 15 min. After the pressure was released, the slides were cooled at room temperature for 30 min. The slides were blocked with Buffer W (Nanostring Technologies, Seattle, DC, USA, Cat# 121300313) at room temperature for 1 h.

4.7. Probe Incubation and Morphology Marker Staining

The prepared tissues were flooded with panels of antibody probes (Mouse neural cell profiling protein core, Mouse glial cell subtyping protein module, Nanostring Technologies, Cat# GMX-PROCO-NCT-MNCP-12 & GMX-PROMOD-NCT-MGCS-12) conjugated to oligonucleotide barcodes via photocleavable linkers. Additionally, immunofluorescence was performed to label the microglia by adding a fluorescently conjugated antibody against Iba1 (Clone E4O4W; Cell Signaling Technology, Danvers, MA, USA, Cat# 17198) to the probe mix. The slides were covered overnight at 4 °C in a humidity chamber (Simport, Quebec, Canada, Cat# M920-2). Following incubation, unbound antibodies were washed away in 3 washes of 1X TBS-T for 10 min each. Post-labeling fixation was performed with a 30 min incubation with 4% paraformaldehyde. The nuclei were stained with SYTO 13 green fluorescent nucleic acid stain (5uM, ThermoFisher, Carlsbad, CA, USA, Cat# S7575). The slides were washed in 2XSSC and loaded into the GeoMx DSP instrument slide holder.

4.8. GeoMx DSP AOI Selection and Barcode Collection

The GeoMx DSP instrument performs multiplexed wide-field immunofluorescence microscopy and utilizes an ultraviolet (UV) laser to release oligonucleotide barcodes from a specific area of illumination (AOI). Fluorescently labeled morphology markers enable the precise selection of regions within a tissue based on fluorescent intensity. The GeoMx instrument has a complement of four fluorescence imaging channels with the following specifications (Channel, Excitation (peak/bandwidth), Emission (peak/bandwidth)): FITC, 480/28 nm, 516/23 nm; Cy3, 538/19 nm, 564/15 nm; Texas Red, 588/19 nm, 623/30 nm; Cy5, 645/19 nm, 683/30 nm. Only the selected areas were illuminated by the UV light, thereby photocleaving the linker molecule and liberating the oligonucleotide barcodes in specific regions within the regions of interest (ROI). The thresholds can be adjusted for each segment and for each fluorescent channel and corresponding fluorescently labeled morphology marker.
The slides were loaded and scanned in the Nanostring GeoMx DSP instrument. Exposure times for each channel were optimized for each instrument run. The exposure time was set to 75 ms for the nuclei channel (FITC) and 200 ms for the Iba1 channel (Cy5). The ROIs were drawn on the resulting images, utilizing brain architecture for guidance. Circular ROIs 500 um in diameter were placed on the striatum and retrosplenial cortex, and rectangular ROIs 500 × 675 um were placed on the hippocampus. This ROI placement strategy was replicated on each tissue section. The ROIs encompassed 500–900 cells. A total of 144 AOIs were selected. Areas of illumination (AOI) were illuminated by the UV laser in the GeoMx instrument, and the photocleaved barcodes were collected and deposited into a 96-well microplate by the instrument’s onboard microfluidics system. The collection plates were sealed to prevent contamination and stored at −80 °C prior to nCounter® Readout (Nanostring Technologies). The barcodes were counted by the nCounter® Analysis System (Nanostring Technologies) following Nanostring’s manufacturer protocol. The counted barcodes were imported into the GeoMx DSP platform and integrated with the ROIs selected on the slides.

4.9. GeoMX DSP Analysis

The mouse neural cell profiling protein core and mouse glial cell subtyping protein module included 35 proteins with 3 housekeeping proteins and 3 negative controls (Table S5). The data were analyzed on the GeoMX DSP platform (version 2.40.421, Nanostring, GEOMX-0087) [106]. The three internal housekeeping protein probes were used to normalize the raw data following the Introduction to GeoMx Normalization: Protein manual (MK2593, Nanostring). Differential expressed proteins were determined using a linear mixed model.

4.10. Nanostring Gene Expression Profiling Assay

For gene expression profiling, brain tissue from the right hemisphere was processed from three mice from the following groups: Control 24 h, 20 Gy 24 h, 30 Gy 24 h, 20 Gy 5 day, 30 Gy 5 day, Control 12 day, 20 Gy 12 day, and 30 Gy 12 day. RNA was extracted using the RNeasy Plus Universal Mini kit (Qiagen, Germantown, MD, USA, Cat# 73404) according to manufacturer’s instructions, except that instead of using gDNA eliminator solution, the wash step was split into two with RWT buffer (included in the kit), and between the wash steps, on-column DNase digestion was performed. A total of 100 ng of RNA from each sample was used to evaluate its gene expression by the nCounter® glial profiling panel from Nanostring (Nanostring Technologies, Seattle, WA, USA, Cat# 115000436). Three samples were removed from the analysis from the nCounter® glial profiling panel due to high binding densities (over 2.8) which was causing suppressed counts in lower-expressed genes. The manufacturer recommended using half of the amount of RNA to correct for the high binding density. Therefore, a total of 50 ng of RNA from each sample was used to evaluate gene expression by the nCounter® neuroinflammation panel from Nanostring (Nanostring Technologies, Cat# 115000237). The RNA was hybridized to the codesets following the manufacturer’s protocol (nCounter® XT Assay User Manual, MAN-10023-11, Nanostring Technologies, Inc., Seattle, WA, USA). The nCounter® Prep station 5s was then used to prepare samples post-hybridization for data collection following manufacturer’s instructions (nCounter® GEN2 Prep Station User Manual, MAN-C0020-04, Nanostring Technologies, Inc., Seattle, WA, USA). The barcodes were counted in each sample using the nCounter® Analysis System following the manufacturer’s directions (nCounter® Analysis System User Manual, MAN-C0035-07, Nanostring Technologies, Inc., Seattle, WA, USA).

4.11. Nanostring Gene Expression Profiling Analysis

The nSolver™ Analysis Software version 4.0 (Nanostring Technologies, Seattle, WA, USA) quality control parameters were used to assess the quality of imaging, binding density, positive control linearity and positive control limit of detection. All the samples analyzed for the nCounter® neuroinflammation panel passed quality control [107,108]. Eleven samples in the nCounter® glial profiling panel had binding density alerts, and three of the samples were removed from the analysis due to their binding densities being above 2.8. The nSolver™ Analysis Software Advanced Analysis Module (version 2.0.134) was used to analyze the gene expression data, including gene normalization [109]. The Advanced Analysis Module was used to normalize the raw gene data for each sample to the geometric mean of the endogenous housekeeping genes using the geNorm algorithm to obtain normalized gene counts [107,108].

4.12. Enrichr Analysis

A pathway enrichment analysis was performed using Enrichr on the genes differentially expressed in the brains of the mice treated with ECRT compared to the control mice for both the gene panels (nCounter® Glial Profiling Panel and Neuroinflammation Panel) [31,32,33]. The databases included were BioPlanet 2019, WikiPathway 2023 Human, KEGG 2021 Human, and Elsevier Pathway Collection. The top ten significant p-value enrichment results were reported for each database.

4.13. Data Analysis

The data were analyzed using Prism 10.1.2 (GraphPad Software, San Diego, CA, USA). Descriptive data were used to present the data as mean ± SEM. One-way analysis of variance (ANOVA) with the Dunnett post hoc test was used to evaluate differences between the control and treatment groups for the Nanostring nCounter® gene panels and GeoMx protein panels. Two-way ANOVA with the Tukey post hoc test was used to evaluate differences between the groups for the GFAP and Iba1 protein expressions in the thoracic spinal cord data.

5. Conclusions

The data demonstrate there is a radiation-dose-dependent glial activation profile and differentially expressed genes in the brains of mice following ECRT to the hindlimb. Future studies that investigate regional gene expression changes in the brain after ECRT may build upon the results presented here. Collectively, our findings highlight indirect neuronal transmission and glial cell activation in the pathogenesis of ECRT-related CRCI, providing possible signaling pathways for mitigation strategies.

Supplementary Materials

The following supporting information can be downloaded at: https://www.mdpi.com/article/10.3390/ijms25115731/s1.

Author Contributions

Conceptualization, K.D.-D., J.L., L.H.H. and D.S.; methodology, K.D.-D., J.L., J.C., A.M., C.F., L.H.H. and D.S.; software, K.D.-D., J.L., J.C., A.M., C.F. and D.S.; validation, K.D.-D., J.L., J.C., A.M., C.F. and D.S.; formal analysis, K.D.-D., J.L. and D.S.; investigation, K.D.-D., J.L., J.C., A.M., C.F. and D.S.; resources, K.D.-D., J.L., J.C., A.M., C.F. and D.S.; data curation, K.D.-D., J.L., J.C., A.M., C.F. and D.S.; writing—original draft preparation, K.D.-D., J.L. and D.S.; writing—review and editing, K.D.-D., J.L., J.C., A.M., C.F., L.H.H. and D.S.; visualization, K.D.-D., J.L. and D.S.; supervision, K.D.-D., J.L., J.C., A.M., C.F. and D.S.; project administration, K.D.-D., J.L., J.C., A.M., C.F. and D.S.; funding acquisition, K.D.-D., J.L. and D.S. All authors have read and agreed to the published version of the manuscript.

Funding

This research was funded by the University of Minnesota Masonic Cancer Center Spatial Grant and NanoString nCounter Neuroscience Grant Program.

Institutional Review Board Statement

The animal study protocol was approved by the Institutional Animal Care and Use Committee of the University of Minnesota (UMN-IACUC) (protocol code 1912-37733A, approval date: 29 December 2021.

Informed Consent Statement

Not applicable.

Data Availability Statement

The data presented in this study are openly available in the GEO repository at https://www.ncbi.nlm.nih.gov/geo/query/acc.cgi?acc=GSE264126 (accessed on 21 May 2024), https://www.ncbi.nlm.nih.gov/geo/query/acc.cgi?acc=GSE264127 (accessed on 23 May 2023), reference numbers (GSE264126, GSE264127).

Acknowledgments

We thank the University of Minnesota Genomics Core for their assistance in processing our samples for the Nanostring nCounter® glial profiling panel and neuroinflammation panel. We also thank the University of Minnesota Imaging Center and Genomics Core for their assistance in processing our samples for the GeoMx NanoString mouse neural cell profiling protein and mouse glial cell subtyping protein panels.

Conflicts of Interest

The authors declare no conflicts of interest.

References

  1. Feiock, C.; Yagi, M.; Maidman, A.; Rendahl, A.; Hui, S.; Seelig, D. Central Nervous System Injury—A Newly Observed Bystander Effect of Radiation. PLoS ONE 2016, 11, e0163233. [Google Scholar] [CrossRef] [PubMed]
  2. Santos, J.C.; Pyter, L.M. Neuroimmunology of Behavioral Comorbidities Associated With Cancer and Cancer Treatments. Front. Immunol. 2018, 9, 1195. [Google Scholar] [CrossRef] [PubMed]
  3. Demos-Davies, K.; Lawrence, J.; Rogich, A.; Lind, E.; Seelig, D. Cancer treatment induces neuroinflammation and behavioral deficits in mice. Front. Behav. Neurosci. 2022, 16, 1067298. [Google Scholar] [CrossRef] [PubMed]
  4. Demos-Davies, K.; Lawrence, J.; Seelig, D. Cancer related cognitive impairment: A downside of cancer treatment. Front. Oncol. 2024, 14, 1387251. [Google Scholar] [CrossRef] [PubMed]
  5. Janelsins, M.C.; Kohli, S.; Mohile, S.G.; Usuki, K.; Ahles, T.A.; Morrow, G.R. An update on cancer- and chemotherapy-related cognitive dysfunction: Current status. Semin. Oncol. 2011, 38, 431–438. [Google Scholar] [CrossRef] [PubMed]
  6. McDonald, B.C.; Conroy, S.K.; Ahles, T.A.; West, J.D.; Saykin, A.J. Gray matter reduction associated with systemic chemotherapy for breast cancer: A prospective MRI study. Breast Cancer Res. Treat. 2010, 123, 819–828. [Google Scholar] [CrossRef] [PubMed]
  7. Jim, H.S.; Donovan, K.A.; Small, B.J.; Andrykowski, M.A.; Munster, P.N.; Jacobsen, P.B. Cognitive functioning in breast cancer survivors: A controlled comparison. Cancer 2009, 115, 1776–1783. [Google Scholar] [CrossRef] [PubMed]
  8. Noal, S.; Levy, C.; Hardouin, A.; Rieux, C.; Heutte, N.; Ségura, C.; Collet, F.; Allouache, D.; Switsers, O.; Delcambre, C.; et al. One-year longitudinal study of fatigue, cognitive functions, and quality of life after adjuvant radiotherapy for breast cancer. Int. J. Radiat. Oncol. Biol. Phys. 2011, 81, 795–803. [Google Scholar] [CrossRef] [PubMed]
  9. Donovan, K.A.; Small, B.J.; Andrykowski, M.A.; Schmitt, F.A.; Munster, P.; Jacobsen, P.B. Cognitive functioning after adjuvant chemotherapy and/or radiotherapy for early-stage breast carcinoma. Cancer 2005, 104, 2499–2507. [Google Scholar] [CrossRef]
  10. Kohli, S.; Griggs, J.J.; Roscoe, J.A.; Jean-Pierre, P.; Bole, C.; Mustian, K.M.; Hill, R.; Smith, K.; Gross, H.; Morrow, G.R. Self-reported cognitive impairment in patients with cancer. J. Oncol. Pract. 2007, 3, 54–59. [Google Scholar] [CrossRef]
  11. Phillips, K.M.; Jim, H.S.; Small, B.J.; Laronga, C.; Andrykowski, M.A.; Jacobsen, P.B. Cognitive functioning after cancer treatment: A 3-year longitudinal comparison of breast cancer survivors treated with chemotherapy or radiation and noncancer controls. Cancer 2012, 118, 1925–1932. [Google Scholar] [CrossRef] [PubMed]
  12. Cho, S.K.; Kim, W.D. Early diagnosis of radiodermatitis using lactate dehydrogenase isozymes in hairless mice (SKH1-hr). Lab. Anim. Res. 2012, 28, 239–244. [Google Scholar] [CrossRef] [PubMed]
  13. Cuccurullo, V.; Di Stasio, G.D.; Cascini, G.L.; Gatta, G.; Bianco, C. The Molecular Effects of Ionizing Radiations on Brain Cells: Radiation Necrosis vs. Tumor Recurrence. Diagnostics 2019, 9, 127. [Google Scholar] [CrossRef] [PubMed]
  14. Lumniczky, K.; Szatmári, T.; Sáfrány, G. Ionizing Radiation-Induced Immune and Inflammatory Reactions in the Brain. Front. Immunol. 2017, 8, 517. [Google Scholar] [CrossRef] [PubMed]
  15. Gibson, E.M.; Monje, M. Microglia in Cancer Therapy-Related Cognitive Impairment. Trends Neurosci. 2021, 44, 441–451. [Google Scholar] [CrossRef] [PubMed]
  16. Shibayama, O.; Yoshiuchi, K.; Inagaki, M.; Matsuoka, Y.; Yoshikawa, E.; Sugawara, Y.; Akechi, T.; Wada, N.; Imoto, S.; Murakami, K.; et al. Association between adjuvant regional radiotherapy and cognitive function in breast cancer patients treated with conservation therapy. Cancer Med. 2014, 3, 702–709. [Google Scholar] [CrossRef] [PubMed]
  17. Sung, H.; Ferlay, J.; Siegel, R.L.; Laversanne, M.; Soerjomataram, I.; Jemal, A.; Bray, F. Global Cancer Statistics 2020: GLOBOCAN Estimates of Incidence and Mortality Worldwide for 36 Cancers in 185 Countries. CA Cancer J. Clin. 2021, 71, 209–249. [Google Scholar] [CrossRef] [PubMed]
  18. Bray, F.; Laversanne, M.; Sung, H.; Ferlay, J.; Siegel, R.L.; Soerjomataram, I.; Jemal, A. Global cancer statistics 2022: GLOBOCAN estimates of incidence and mortality worldwide for 36 cancers in 185 countries. CA Cancer J. Clin. 2024, 74, 229–263. [Google Scholar] [CrossRef] [PubMed]
  19. Lawrence, J.; Seelig, D.; Demos-Davies, K.; Ferreira, C.; Ren, Y.; Wang, L.; Alam, S.K.; Yang, R.; Guedes, A.; Craig, A.; et al. Radiation dermatitis in the hairless mouse model mimics human radiation dermatitis. bioRxiv 2024, 5, 595074. [Google Scholar] [CrossRef]
  20. Demos-Davies, K.; Lawrence, J.; Ferreira, C.; Seelig, D. The Distant Molecular Effects on the Brain by Cancer Treatment. Brain Sci. 2023, 14, 22. [Google Scholar] [CrossRef]
  21. Hu, S.C.; Hou, M.F.; Luo, K.H.; Chuang, H.Y.; Wei, S.Y.; Chen, G.S.; Chiang, W.; Huang, C.J. Changes in biophysical properties of the skin following radiotherapy for breast cancer. J. Dermatol. 2014, 41, 1087–1094. [Google Scholar] [CrossRef] [PubMed]
  22. Benavides, F.; Oberyszyn, T.M.; VanBuskirk, A.M.; Reeve, V.E.; Kusewitt, D.F. The hairless mouse in skin research. J. Dermatol. Sci. 2009, 53, 10–18. [Google Scholar] [CrossRef] [PubMed]
  23. Kumar, S.; Juresic, E.; Barton, M.; Shafiq, J. Management of skin toxicity during radiation therapy: A review of the evidence. J. Med. Imaging Radiat. Oncol. 2010, 54, 264–279. [Google Scholar] [CrossRef] [PubMed]
  24. Richardson, B.N.; Lin, J.; Buchwald, Z.S.; Bai, J. Skin Microbiome and Treatment-Related Skin Toxicities in Patients with Cancer: A Mini-Review. Front. Oncol. 2022, 12, 924849. [Google Scholar] [CrossRef] [PubMed]
  25. Albouy, G.; King, B.R.; Maquet, P.; Doyon, J. Hippocampus and striatum: Dynamics and interaction during acquisition and sleep-related motor sequence memory consolidation. Hippocampus 2013, 23, 985–1004. [Google Scholar] [CrossRef] [PubMed]
  26. Vann, S.D.; Aggleton, J.P.; Maguire, E.A. What does the retrosplenial cortex do? Nat. Rev. Neurosci. 2009, 10, 792–802. [Google Scholar] [CrossRef] [PubMed]
  27. Eichenbaum, H.; Dudchenko, P.; Wood, E.; Shapiro, M.; Tanila, H. The hippocampus, memory, and place cells: Is it spatial memory or a memory space? Neuron 1999, 23, 209–226. [Google Scholar] [CrossRef]
  28. Schroyen, G.; Blommaert, J.; Van Weehaeghe, D.; Sleurs, C.; Vandenbulcke, M.; Dedoncker, N.; Hatse, S.; Goris, A.; Koole, M.; Smeets, A.; et al. Neuroinflammation and Its Association with Cognition, Neuronal Markers and Peripheral Inflammation after Chemotherapy for Breast Cancer. Cancers 2021, 13, 4198. [Google Scholar] [CrossRef]
  29. Zhang, S.; Xiao, M.; Liu, Z.; Mo, Y.; Liu, H.; Xu, B. The functional significance of ATM phosphorylation of Bub3 on Serine 135 in sensitivity to DNA damaging agents. J. Clin. Oncol. 2021, 39, e15048. [Google Scholar] [CrossRef]
  30. Silva, P.M.A.; Bousbaa, H. BUB3, beyond the Simple Role of Partner. Pharmaceutics 2022, 14, 1084. [Google Scholar] [CrossRef]
  31. Chen, E.Y.; Tan, C.M.; Kou, Y.; Duan, Q.; Wang, Z.; Meirelles, G.V.; Clark, N.R.; Ma’ayan, A. Enrichr: Interactive and collaborative HTML5 gene list enrichment analysis tool. BMC Bioinform. 2013, 14, 128. [Google Scholar] [CrossRef]
  32. Kuleshov, M.V.; Jones, M.R.; Rouillard, A.D.; Fernandez, N.F.; Duan, Q.; Wang, Z.; Koplev, S.; Jenkins, S.L.; Jagodnik, K.M.; Lachmann, A.; et al. Enrichr: A comprehensive gene set enrichment analysis web server 2016 update. Nucleic Acids Res. 2016, 44, W90–W97. [Google Scholar] [CrossRef] [PubMed]
  33. Xie, Z.; Bailey, A.; Kuleshov, M.V.; Clarke, D.J.B.; Evangelista, J.E.; Jenkins, S.L.; Lachmann, A.; Wojciechowicz, M.L.; Kropiwnicki, E.; Jagodnik, K.M.; et al. Gene Set Knowledge Discovery with Enrichr. Curr. Protoc. 2021, 1, e90. [Google Scholar] [CrossRef]
  34. Müller, K.; Meineke, V. Radiation-induced alterations in cytokine production by skin cells. Exp. Hematol. 2007, 35, 96–104. [Google Scholar] [CrossRef] [PubMed]
  35. de Andrade, C.B.V.; Ramos, I.P.R.; de Moraes, A.C.N.; do Nascimento, A.L.R.; Salata, C.; Goldenberg, R.C.D.S.; de Carvalho, J.J.; de Almeida, C.E.V. Radiotherapy-Induced Skin Reactions Induce Fibrosis Mediated by TGF-β1 Cytokine. Dose Response 2017, 15, 1559325817705019. [Google Scholar] [CrossRef]
  36. Todd, T.P.; Bucci, D.J. Retrosplenial Cortex and Long-Term Memory: Molecules to Behavior. Neural Plast. 2015, 2015, 414173. [Google Scholar] [CrossRef] [PubMed]
  37. Alexander, A.S.; Robinson, J.C.; Dannenberg, H.; Kinsky, N.R.; Levy, S.J.; Mau, W.; Chapman, G.W.; Sullivan, D.W.; Hasselmo, M.E. Neurophysiological coding of space and time in the hippocampus, entorhinal cortex, and retrosplenial cortex. Brain Neurosci. Adv. 2020, 4, 2398212820972871. [Google Scholar] [CrossRef]
  38. Saade, M.; Araujo de Souza, G.; Scavone, C.; Kinoshita, P.F. The Role of GPNMB in Inflammation. Front. Immunol. 2021, 12, 674739. [Google Scholar] [CrossRef] [PubMed]
  39. Hüttenrauch, M.; Ogorek, I.; Klafki, H.; Otto, M.; Stadelmann, C.; Weggen, S.; Wiltfang, J.; Wirths, O. Glycoprotein NMB: A novel Alzheimer’s disease associated marker expressed in a subset of activated microglia. Acta Neuropathol. Commun. 2018, 6, 108. [Google Scholar] [CrossRef]
  40. Keren-Shaul, H.; Spinrad, A.; Weiner, A.; Matcovitch-Natan, O.; Dvir-Szternfeld, R.; Ulland, T.K.; David, E.; Baruch, K.; Lara-Astaiso, D.; Toth, B.; et al. A Unique Microglia Type Associated with Restricting Development of Alzheimer’s Disease. Cell 2017, 169, 1276–1290.e17. [Google Scholar] [CrossRef]
  41. Song, W.M.; Colonna, M. The identity and function of microglia in neurodegeneration. Nat. Immunol. 2018, 19, 1048–1058. [Google Scholar] [CrossRef]
  42. Butovsky, O.; Weiner, H.L. Microglial signatures and their role in health and disease. Nat. Rev. Neurosci. 2018, 19, 622–635. [Google Scholar] [CrossRef] [PubMed]
  43. Preston, A.N.; Cervasio, D.A.; Laughlin, S.T. Visualizing the brain’s astrocytes. Methods Enzymol. 2019, 622, 129–151. [Google Scholar] [CrossRef]
  44. Guzman-Martinez, L.; Maccioni, R.B.; Andrade, V.; Navarrete, L.P.; Pastor, M.G.; Ramos-Escobar, N. Neuroinflammation as a Common Feature of Neurodegenerative Disorders. Front. Pharmacol. 2019, 10, 1008. [Google Scholar] [CrossRef] [PubMed]
  45. Maurya, S.K.; Bhattacharya, N.; Mishra, S.; Bhattacharya, A.; Banerjee, P.; Senapati, S.; Mishra, R. Microglia Specific Drug Targeting Using Natural Products for the Regulation of Redox Imbalance in Neurodegeneration. Front. Pharmacol. 2021, 12, 654489. [Google Scholar] [CrossRef]
  46. Liu, C.Y.; Wang, X.; Liu, C.; Zhang, H.L. Pharmacological Targeting of Microglial Activation: New Therapeutic Approach. Front. Cell. Neurosci. 2019, 13, 514. [Google Scholar] [CrossRef] [PubMed]
  47. Popa-Wagner, A.; Schröder, E.; Schmoll, H.; Walker, L.C.; Kessler, C. Upregulation of MAP1B and MAP2 in the rat brain after middle cerebral artery occlusion: Effect of age. J. Cereb. Blood Flow Metab. 1999, 19, 425–434. [Google Scholar] [CrossRef]
  48. Geisert, E.E.; Johnson, H.G.; Binder, L.I. Expression of microtubule-associated protein 2 by reactive astrocytes. Proc. Natl. Acad. Sci. USA 1990, 87, 3967–3971. [Google Scholar] [CrossRef]
  49. Lin, R.C.; Matesic, D.F. Immunohistochemical demonstration of neuron-specific enolase and microtubule-associated protein 2 in reactive astrocytes after injury in the adult forebrain. Neuroscience 1994, 60, 11–16. [Google Scholar] [CrossRef]
  50. Nakano, T.; Oka, K. Transition of Ki-67 index of uterine cervical tumors during radiation therapy. Immunohistochemical study. Cancer 1991, 68, 517–523. [Google Scholar] [CrossRef]
  51. Kang, J.O.; Hong, S.E.; Kim, S.K.; Kim, C.J.; Lee, T.H.; Chang, H.K.; Shin, M.S.; Kim, H. Adaptive responses induced by low dose radiation in dentate gyrus of rats. J. Korean Med. Sci. 2006, 21, 1103–1107. [Google Scholar] [CrossRef]
  52. Nagy, Z.; Esiri, M.M.; Smith, A.D. Expression of cell division markers in the hippocampus in Alzheimer’s disease and other neurodegenerative conditions. Acta Neuropathol. 1997, 93, 294–300. [Google Scholar] [CrossRef]
  53. Budelier, M.M.; He, Y.; Barthelemy, N.R.; Jiang, H.; Li, Y.; Park, E.; Henson, R.L.; Schindler, S.E.; Holtzman, D.M.; Bateman, R.J. A map of neurofilament light chain species in brain and cerebrospinal fluid and alterations in Alzheimer’s disease. Brain Commun. 2022, 4, fcac045. [Google Scholar] [CrossRef]
  54. Dietmann, A.S.; Kruse, N.; Stork, L.; Gloth, M.; Brück, W.; Metz, I. Neurofilament light chains in serum as biomarkers of axonal damage in early MS lesions: A histological-serological correlative study. J. Neurol. 2023, 270, 1416–1429. [Google Scholar] [CrossRef] [PubMed]
  55. Unal-Cevik, I.; Kilinç, M.; Gürsoy-Ozdemir, Y.; Gurer, G.; Dalkara, T. Loss of NeuN immunoreactivity after cerebral ischemia does not indicate neuronal cell loss: A cautionary note. Brain Res. 2004, 1015, 169–174. [Google Scholar] [CrossRef] [PubMed]
  56. Liu, J.; Dan, Q.-Q.; Zhao, N.; Li, J.-Y.; Li, J.; Chang, Q.; Su, P.; Cen, J.-C. Functional implication of synaptophysin upregulation with traumatic brain injury adult rats. Ibrain 2016, 2, 1–6. [Google Scholar] [CrossRef]
  57. Gudi, V.; Gai, L.; Herder, V.; Tejedor, L.S.; Kipp, M.; Amor, S.; Sühs, K.W.; Hansmann, F.; Beineke, A.; Baumgärtner, W.; et al. Synaptophysin Is a Reliable Marker for Axonal Damage. J. Neuropathol. Exp. Neurol. 2017, 76, 109–125. [Google Scholar] [CrossRef]
  58. Brown, G.C.; Neher, J.J. Microglial phagocytosis of live neurons. Nat. Rev. Neurosci. 2014, 15, 209–216. [Google Scholar] [CrossRef] [PubMed]
  59. Adrian, M.; Weber, M.; Tsai, M.C.; Glock, C.; Kahn, O.I.; Phu, L.; Cheung, T.K.; Meilandt, W.J.; Rose, C.M.; Hoogenraad, C.C. Polarized microtubule remodeling transforms the morphology of reactive microglia and drives cytokine release. Nat. Commun. 2023, 14, 6322. [Google Scholar] [CrossRef]
  60. Butovsky, O.; Jedrychowski, M.P.; Moore, C.S.; Cialic, R.; Lanser, A.J.; Gabriely, G.; Koeglsperger, T.; Dake, B.; Wu, P.M.; Doykan, C.E.; et al. Identification of a unique TGF-β-dependent molecular and functional signature in microglia. Nat. Neurosci. 2014, 17, 131–143. [Google Scholar] [CrossRef]
  61. Schöneberg, T.; Meister, J.; Knierim, A.B.; Schulz, A. The G protein-coupled receptor GPR34—The past 20 years of a grownup. Pharmacol. Ther. 2018, 189, 71–88. [Google Scholar] [CrossRef] [PubMed]
  62. Santpere, G.; Garcia-Esparcia, P.; Andres-Benito, P.; Lorente-Galdos, B.; Navarro, A.; Ferrer, I. Transcriptional network analysis in frontal cortex in Lewy body diseases with focus on dementia with Lewy bodies. Brain Pathol. 2018, 28, 315–333. [Google Scholar] [CrossRef] [PubMed]
  63. Li, H.; Wei, M.; Ye, T.; Liu, Y.; Qi, D.; Cheng, X. Identification of the molecular subgroups in Alzheimer’s disease by transcriptomic data. Front. Neurol. 2022, 13, 901179. [Google Scholar] [CrossRef] [PubMed]
  64. Kempf, S.J.; Moertl, S.; Sepe, S.; von Toerne, C.; Hauck, S.M.; Atkinson, M.J.; Mastroberardino, P.G.; Tapio, S. Low-dose ionizing radiation rapidly affects mitochondrial and synaptic signaling pathways in murine hippocampus and cortex. J. Proteome Res. 2015, 14, 2055–2064. [Google Scholar] [CrossRef] [PubMed]
  65. Vavilova, J.D.; Boyko, A.A.; Troyanova, N.I.; Ponomareva, N.V.; Fokin, V.F.; Fedotova, E.Y.; Streltsova, M.A.; Kust, S.A.; Grechikhina, M.V.; Shustova, O.A.; et al. Alterations in Proteostasis System Components in Peripheral Blood Mononuclear Cells in Parkinson Disease: Focusing on the HSP70 and p62 Levels. Biomolecules 2022, 12, 493. [Google Scholar] [CrossRef] [PubMed]
  66. Dong, Y.; Li, T.; Ma, Z.; Zhou, C.; Wang, X.; Li, J. HSPA1A, HSPA2, and HSPA8 Are Potential Molecular Biomarkers for Prognosis among HSP70 Family in Alzheimer’s Disease. Dis. Markers 2022, 2022, 9480398. [Google Scholar] [CrossRef] [PubMed]
  67. Gerrits, E.; Brouwer, N.; Kooistra, S.M.; Woodbury, M.E.; Vermeiren, Y.; Lambourne, M.; Mulder, J.; Kummer, M.; Möller, T.; Biber, K.; et al. Distinct amyloid-β and tau-associated microglia profiles in Alzheimer’s disease. Acta Neuropathol. 2021, 141, 681–696. [Google Scholar] [CrossRef] [PubMed]
  68. Li, C.; Zhang, J.; Xu, H.; Chang, M.; Lv, C.; Xue, W.; Song, Z.; Zhang, L.; Zhang, X.; Tian, X. Retigabine ameliorates acute stress-induced impairment of spatial memory retrieval through regulating USP2 signaling pathways in hippocampal CA1 area. Neuropharmacology 2018, 135, 151–162. [Google Scholar] [CrossRef] [PubMed]
  69. Markarian, M.; Krattli, R.P.; Baddour, J.D.; Alikhani, L.; Giedzinski, E.; Usmani, M.T.; Agrawal, A.; Baulch, J.E.; Tenner, A.J.; Acharya, M.M. Glia-Selective Deletion of Complement. Cancer Res. 2021, 81, 1732–1744. [Google Scholar] [CrossRef]
  70. Park, H.; Lee, S.; Shrestha, P.; Kim, J.; Park, J.A.; Ko, Y.; Ban, Y.H.; Park, D.Y.; Ha, S.J.; Koh, G.Y.; et al. AMIGO2, a novel membrane anchor of PDK1, controls cell survival and angiogenesis via Akt activation. J. Cell. Biol. 2015, 211, 619–637. [Google Scholar] [CrossRef]
  71. Reid, M.M.; Kautzmann, M.I.; Andrew, G.; Obenaus, A.; Mukherjee, P.K.; Khoutorova, L.; Ji, J.X.; Roque, C.R.; Oria, R.B.; Habeb, B.F.; et al. NPD1 Plus RvD1 Mediated Ischemic Stroke Penumbra Protection Increases Expression of Pro-homeostatic Microglial and Astrocyte Genes. Cell. Mol. Neurobiol. 2023, 43, 3555–3573. [Google Scholar] [CrossRef]
  72. Ma, H.; Zhou, Y.; Li, Z.; Zhu, L.; Li, H.; Zhang, G.; Wang, J.; Gong, H.; Xu, D.; Hua, W.; et al. Single-Cell RNA-Sequencing Analyses Revealed Heterogeneity and Dynamic Changes of Metabolic Pathways in Astrocytes at the Acute Phase of Ischemic Stroke. Oxidative Med. Cell. Longev. 2022, 2022, 1817721. [Google Scholar] [CrossRef]
  73. McMorran, B.J.; McCarthy, F.E.; Gibbs, E.M.; Pang, M.; Marshall, J.L.; Nairn, A.V.; Moremen, K.W.; Crosbie-Watson, R.H.; Baum, L.G. Differentiation-related glycan epitopes identify discrete domains of the muscle glycocalyx. Glycobiology 2016, 26, 1120–1132. [Google Scholar] [CrossRef] [PubMed]
  74. Dukay, B.; Walter, F.R.; Vigh, J.P.; Barabási, B.; Hajdu, P.; Balassa, T.; Migh, E.; Kincses, A.; Hoyk, Z.; Szögi, T.; et al. Neuroinflammatory processes are augmented in mice overexpressing human heat-shock protein B1 following ethanol-induced brain injury. J. Neuroinflamm. 2021, 18, 22. [Google Scholar] [CrossRef] [PubMed]
  75. Demyanenko, G.P.; Mohan, V.; Zhang, X.; Brennaman, L.H.; Dharbal, K.E.; Tran, T.S.; Manis, P.B.; Maness, P.F. Neural cell adhesion molecule NrCAM regulates Semaphorin 3F-induced dendritic spine remodeling. J. Neurosci. 2014, 34, 11274–11287. [Google Scholar] [CrossRef]
  76. Takano, T.; Wallace, J.T.; Baldwin, K.T.; Purkey, A.M.; Uezu, A.; Courtland, J.L.; Soderblom, E.J.; Shimogori, T.; Maness, P.F.; Eroglu, C.; et al. Chemico-genetic discovery of astrocytic control of inhibition in vivo. Nature 2020, 588, 296–302. [Google Scholar] [CrossRef]
  77. Kedrov, A.V.; Durymanov, M.; Anokhin, K.V. The Arc gene: Retroviral heritage in cognitive functions. Neurosci. Biobehav. Rev. 2019, 99, 275–281. [Google Scholar] [CrossRef]
  78. Rosi, S.; Andres-Mach, M.; Fishman, K.M.; Levy, W.; Ferguson, R.A.; Fike, J.R. Cranial irradiation alters the behaviorally induced immediate-early gene arc (activity-regulated cytoskeleton-associated protein). Cancer Res. 2008, 68, 9763–9770. [Google Scholar] [CrossRef] [PubMed]
  79. Xu, Q.; Yang, G.Y.; Liu, N.; Xu, P.; Chen, Y.L.; Zhou, Z.; Luo, Z.G.; Ding, X. P4-ATPase ATP8A2 acts in synergy with CDC50A to enhance neurite outgrowth. FEBS Lett. 2012, 586, 1803–1812. [Google Scholar] [CrossRef]
  80. Deng, J.; Song, L.; Yang, Z.; Zheng, S.; Du, Z.; Luo, L.; Liu, J.; Jin, X.; Yang, J. Neonatal LPS exposure reduces ATP8A2 level in the prefrontal cortex in mice via increasing IFN-γ level. Brain Res. Bull. 2021, 171, 103–112. [Google Scholar] [CrossRef]
  81. Bernstein, H.-G.; Kirches, E.; Bogerts, B.; Lendeckel, U.; Keilhoff, G.; Zempeltzi, M.; Steiner, J.; Tenbrock, K.; Dobrowolny, H.; Kyttaris, V.C.; et al. Wide distribution of CREM immunoreactivity in adult and fetal human brain, with an increased expression in dentate gyrus neurons of Alzheimer’s as compared to normal aging brains. Amino Acids 2013, 45, 1373–1383. [Google Scholar] [CrossRef] [PubMed]
  82. Vyas, Y.; Montgomery, J.M. The role of postsynaptic density proteins in neural degeneration and regeneration. Neural Regen. Res. 2016, 11, 906–907. [Google Scholar] [CrossRef] [PubMed]
  83. Vogel, F.D.; Krenn, M.; Westphal, D.S.; Graf, E.; Wagner, M.; Leiz, S.; Koniuszewski, F.; Augé-Stock, M.; Kramer, G.; Scholze, P.; et al. A de novo missense variant in GABRA4 alters receptor function in an epileptic and neurodevelopmental phenotype. Epilepsia 2022, 63, e35–e41. [Google Scholar] [CrossRef]
  84. Janeczek, P.; Colson, N.; Dodd, P.R.; Lewohl, J.M. Sex Differences in the Expression of the α5 Subunit of the GABA. Alcohol. Clin. Exp. Res. 2020, 44, 423–434. [Google Scholar] [CrossRef]
  85. Márquez, J.; Martín-Rufián, M.; Segura, J.A.; Matés, J.M.; Campos-Sandoval, J.A.; Alonso, F.J. Brain glutaminases. Biomol. Concepts 2010, 1, 3–15. [Google Scholar] [CrossRef] [PubMed]
  86. Griffin, J.W.D.; Liu, Y.; Bradshaw, P.C.; Wang, K. In Silico Preliminary Association of Ammonia Metabolism Genes GLS, CPS1, and GLUL with Risk of Alzheimer’s Disease, Major Depressive Disorder, and Type 2 Diabetes. J. Mol. Neurosci. 2018, 64, 385–396. [Google Scholar] [CrossRef] [PubMed]
  87. Jia, E.; Pan, M.; Liu, Z.; Zhou, Y.; Zhao, X.; Dong, J.; Bai, Y.; Ge, Q. Transcriptomic profiling of differentially expressed genes and related pathways in different brain regions in Parkinson’s disease. Neurosci. Lett. 2020, 732, 135074. [Google Scholar] [CrossRef] [PubMed]
  88. Yang, L.; Pang, X.; Guo, W.; Zhu, C.; Yu, L.; Song, X.; Wang, K.; Pang, C. An Exploration of the Coherent Effects between METTL3 and NDUFA10 on Alzheimer’s Disease. Int. J. Mol. Sci. 2023, 24, 10111. [Google Scholar] [CrossRef] [PubMed]
  89. Lv, Y.; Sun, Y.; Wang, G.Y.; Yin, J.; Li, C.J.; Luo, Y.Y.; Luan, Z.L. Positive Association of Human SHC3 Gene with Schizophrenia in a Northeast Chinese Han Population. Psychiatry Investig. 2020, 17, 934–940. [Google Scholar] [CrossRef]
  90. Valsecchi, V.; Laudati, G.; Cuomo, O.; Sirabella, R.; Del Prete, A.; Annunziato, L.; Pignataro, G. The hypoxia sensitive metal transcription factor MTF-1 activates NCX1 brain promoter and participates in remote postconditioning neuroprotection in stroke. Cell Death Dis. 2021, 12, 423. [Google Scholar] [CrossRef]
  91. Sirabella, R.; Sisalli, M.J.; Costa, G.; Omura, K.; Ianniello, G.; Pinna, A.; Morelli, M.; Di Renzo, G.M.; Annunziato, L.; Scorziello, A. NCX1 and NCX3 as potential factors contributing to neurodegeneration and neuroinflammation in the A53T transgenic mouse model of Parkinson’s Disease. Cell Death Dis. 2018, 9, 725. [Google Scholar] [CrossRef]
  92. Lee, U.; Choi, C.; Ryu, S.H.; Park, D.; Lee, S.E.; Kim, K.; Kim, Y.; Chang, S. SCAMP5 plays a critical role in axonal trafficking and synaptic localization of NHE6 to adjust quantal size at glutamatergic synapses. Proc. Natl. Acad. Sci. USA 2021, 118, e2011371118. [Google Scholar] [CrossRef] [PubMed]
  93. Prasad, H.; Rao, R. The Na+/H+ exchanger NHE6 modulates endosomal pH to control processing of amyloid precursor protein in a cell culture model of Alzheimer disease. J. Biol. Chem. 2015, 290, 5311–5327. [Google Scholar] [CrossRef] [PubMed]
  94. Kivisäkk, P.; Carlyle, B.C.; Sweeney, T.; Quinn, J.P.; Ramirez, C.E.; Trombetta, B.A.; Mendes, M.; Brock, M.; Rubel, C.; Czerkowicz, J.; et al. Increased levels of the synaptic proteins PSD-95, SNAP-25, and neurogranin in the cerebrospinal fluid of patients with Alzheimer’s disease. Alzheimer’s Res. Ther. 2022, 14, 58. [Google Scholar] [CrossRef]
  95. Hoerder-Suabedissen, A.; Korrell, K.V.; Hayashi, S.; Jeans, A.; Ramirez, D.M.O.; Grant, E.; Christian, H.C.; Kavalali, E.T.; Wilson, M.C.; Molnár, Z. Cell-Specific Loss of SNAP25 from Cortical Projection Neurons Allows Normal Development but Causes Subsequent Neurodegeneration. Cereb. Cortex 2019, 29, 2148–2159. [Google Scholar] [CrossRef] [PubMed]
  96. Giovagnoni, C.; Ali, M.; Eijssen, L.M.T.; Maes, R.; Choe, K.; Mulder, M.; Kleinjans, J.; Del Sol, A.; Glaab, E.; Mastroeni, D.; et al. Altered sphingolipid function in Alzheimer’s disease; a gene regulatory network approach. Neurobiol. Aging 2021, 102, 178–187. [Google Scholar] [CrossRef] [PubMed]
  97. Zhu, M.; Jia, L.; Li, F.; Jia, J. Identification of KIAA0513 and Other Hub Genes Associated With Alzheimer Disease Using Weighted Gene Coexpression Network Analysis. Front. Genet. 2020, 11, 981. [Google Scholar] [CrossRef] [PubMed]
  98. Grønborg, M.; Pavlos, N.J.; Brunk, I.; Chua, J.J.; Münster-Wandowski, A.; Riedel, D.; Ahnert-Hilger, G.; Urlaub, H.; Jahn, R. Quantitative comparison of glutamatergic and GABAergic synaptic vesicles unveils selectivity for few proteins including MAL2, a novel synaptic vesicle protein. J. Neurosci. 2010, 30, 2–12. [Google Scholar] [CrossRef]
  99. Konar, A.; Thakur, M.K. Neuropsin Expression Correlates with Dendritic Marker MAP2c Level in Different Brain Regions of Aging Mice. Mol. Neurobiol. 2015, 51, 1130–1138. [Google Scholar] [CrossRef]
  100. Benice, T.S.; Rizk, A.; Kohama, S.; Pfankuch, T.; Raber, J. Sex-differences in age-related cognitive decline in C57BL/6J mice associated with increased brain microtubule-associated protein 2 and synaptophysin immunoreactivity. Neuroscience 2006, 137, 413–423. [Google Scholar] [CrossRef]
  101. VanGuilder, H.D.; Farley, J.A.; Yan, H.; Van Kirk, C.A.; Mitschelen, M.; Sonntag, W.E.; Freeman, W.M. Hippocampal dysregulation of synaptic plasticity-associated proteins with age-related cognitive decline. Neurobiol. Dis. 2011, 43, 201–212. [Google Scholar] [CrossRef] [PubMed]
  102. Tfilin, M.; Turgeman, G. Interleukine-17 Administration Modulates Adult Hippocampal Neurogenesis and Improves Spatial Learning in Mice. J. Mol. Neurosci. 2019, 69, 254–263. [Google Scholar] [CrossRef] [PubMed]
  103. Alam, R.; Mrad, Y.; Hammoud, H.; Saker, Z.; Fares, Y.; Estephan, E.; Bahmad, H.F.; Harati, H.; Nabha, S. New insights into the role of fibroblast growth factors in Alzheimer’s disease. Mol. Biol. Rep. 2022, 49, 1413–1427. [Google Scholar] [CrossRef]
  104. Wefel, J.S.; Kesler, S.R.; Noll, K.R.; Schagen, S.B. Clinical characteristics, pathophysiology, and management of noncentral nervous system cancer-related cognitive impairment in adults. CA Cancer J. Clin. 2015, 65, 123–138. [Google Scholar] [CrossRef] [PubMed]
  105. Jang, W.H.; Shim, S.; Wang, T.; Yoon, Y.; Jang, W.S.; Myung, J.K.; Park, S.; Kim, K.H. In vivo characterization of early-stage radiation skin injury in a mouse model by two-photon microscopy. Sci. Rep. 2016, 6, 19216. [Google Scholar] [CrossRef]
  106. Merritt, C.R.; Ong, G.T.; Church, S.E.; Barker, K.; Danaher, P.; Geiss, G.; Hoang, M.; Jung, J.; Liang, Y.; McKay-Fleisch, J.; et al. Multiplex digital spatial profiling of proteins and RNA in fixed tissue. Nat. Biotechnol. 2020, 38, 586–599. [Google Scholar] [CrossRef]
  107. Vider, J.; Croaker, A.; Cox, A.J.; Raymond, E.; Rogers, R.; Adamson, S.; Doyle, M.; O’Brien, B.; Cripps, A.W.; West, N.P. Comparison of skin biopsy sample processing and storage methods on high dimensional immune gene expression using the Nanostring nCounter system. Diagn. Pathol. 2020, 15, 57. [Google Scholar] [CrossRef]
  108. Wu, X.; Nelson, M.; Basu, M.; Srinivasan, P.; Lazarski, C.; Zhang, P.; Zheng, P.; Sandler, A.D. MYC oncogene is associated with suppression of tumor immunity and targeting Myc induces tumor cell immunogenicity for therapeutic whole cell vaccination. J. Immunother. Cancer 2021, 9, e001388. [Google Scholar] [CrossRef]
  109. Ma, C.; Hunt, J.B.; Kovalenko, A.; Liang, H.; Selenica, M.B.; Orr, M.B.; Zhang, B.; Gensel, J.C.; Feola, D.J.; Gordon, M.N.; et al. Myeloid Arginase 1 Insufficiency Exacerbates Amyloid-β Associated Neurodegenerative Pathways and Glial Signatures in a Mouse Model of Alzheimer’s Disease: A Targeted Transcriptome Analysis. Front. Immunol. 2021, 12, 628156. [Google Scholar] [CrossRef]
Figure 1. Acute skin radiation toxicity in mice treated with hindlimb radiation. (A) Representative image of the irradiated right hindlimb from a mouse treated with 30 Gy. Focal erythema and mild dermatitis started on day 10 post treatment. (B) Representative image of severe, ulcerative dermatitis within the irradiated right hindlimb of a mouse treated with 30 Gy. Changes shown developed on day 12 post treatment.
Ijms 25 05731 g001
Figure 2. Histologic evidence of radiation-induced dermatitis in the hindlimb skin of SKH-1 mice at various timepoints after irradiation. Control skin was obtained from unirradiated right hindlimb skin from age-matched SKH-1 mice at the following timepoints: 6 h (A), 24 h (D), 5 days (G), 12 days (J), and 25 days (M). Representative images from skin on the right hindlimb following 20 Gy at 6 h (B), 24 h (E), 5 days (H), 12 days (K), and 25 days (N) post radiation treatment. Representative images from skin on the right hindlimb following 30 Gy at 6 h (C), 24 h (F), 5 days (I), 12 days (L), and 25 days (O) post radiation treatment. Hyperpigmentation (arrow heads) and epidermal thickening (black line) was evident following 20 Gy at 12 days (K) and following 30 Gy at 12 days (L) and 25 days (O). Images shown at 200×. n = 4; Control = control mice group; 20 Gy RT = mice treated with 20 Gy to hindlimb; 30 Gy RT = mice treated with 30 Gy to hindlimb. H&E.
Ijms 25 05731 g002
Figure 3. The expression of GFAP within the thoracic spinal cord after ECRT in mice. Representative images depict activated astrocytes (GFAP+ cells) in the thoracic spinal cord from control mice at 6 h (A), 24 h (D), 5 days (G), 12 days (J), and 25 days (M). Representative images depict activated astrocytes (GFAP+ cells) in the thoracic spinal cord from mice treated with 20 Gy at 6 h (B), 24 h (E), 5 days (H), 12 days (K), and 25 days (N) post radiation treatment. Representative images depict activated astrocytes (GFAP+ cells) in the thoracic spinal cord from mice treated with 30 Gy at 6 h (C), 24 h (F), 5 days (I), 12 days (L), and 25 days (O) post radiation treatment. Images shown are at 200×. Control = control mice group; 20 Gy RT = mice treated with 20 Gy to hindlimb; 30 Gy RT = mice treated with 30 Gy to hindlimb.
Ijms 25 05731 g003
Figure 4. The expression changes in GFAP and Iba1 within the thoracic spinal cord after ECRT in mice. Line graph (A) depicting the percentage of astrocytes (GFAP+ cells) over time across treatment groups. Line graph (B) depicting the percentage of microglia (Iba1+ cells) over time across treatment groups. Data represent the mean and SEM (n = 4 mice from each group). * p-value < 0.05 compared to control group; # p-value < 0.05 compared to 20 Gy RT group; ~ p-value < 0.05 compared to 30 Gy RT group.
Ijms 25 05731 g004
Figure 5. Glial cell activation in the striatum of ECRT-treated mice. Mice treated with 20 Gy demonstrated significant upregulation of CD11b (B), CD163 (C), CD40 (D), GPNMB (F), Ki-67 (G), MAP2 (H), and MHCII (J). Mice treated with 20 Gy demonstrated significant downregulation of S100B (L). Mice treated with 30 Gy demonstrated significant upregulation of Aldh1l1 (A), GFAP (E), MHCII (J), and Synaptophysin (M). Mice treated with 30 Gy demonstrated significant downregulation of Mertk (I), NeuN (K), and TMEM119 (N). Data represent the mean ± SEM and black dots represent individual values (n = 4–8 mice per group). Control = control mice that were euthanized at 6 h and 25 days. 20 Gy = mice treated with 20 Gy to hindlimb; 30 Gy = mice treated with 30 Gy to hindlimb. * p < 0.05; ** p < 0.01; *** p = 0.01–0.001; **** p < 0.001.
Ijms 25 05731 g005
Figure 6. Glial cell activation in the retrosplenial cortex of ECRT-treated mice. Retrosplenial cortex from mice treated with 20 Gy demonstrated significant upregulation of CD11b (B), CD163 (C), CD39 (D), CD9 (E), GPNMB (G), Ki-67 (H), MAP2 (I), MHCII (J), and SPP1 (M). Mice treated with 30 Gy demonstrated significant upregulation of Aldh1l1 (A), GFAP (F), MAP2 (I), MHCII (J), S100B (L), SPP1 (M), and Synaptophysin (N). Mice treated with 30 Gy demonstrated significant downregulation of NeuN (K) and TMEM119 (O). Data represent the mean ± SEM and black dots represent individual values (n = 4–8 mice per group). Control = control mice that were euthanized at 6 h and 25 days. 20 Gy RT = mice treated with 20 Gy to hindlimb; 30 Gy RT = mice treated with 30 Gy to hindlimb. * p < 0.05; ** p < 0.01; *** p = 0.01–0.001; **** p < 0.001.
Ijms 25 05731 g006
Figure 7. Glial cell activation in the hippocampus of ECRT-treated mice. Hippocampus from mice treated with 20 Gy demonstrated significant upregulation of CD39 (A), CSF1R (B), Ctsd (C), GPNMB (E), IBA1 (F), Ki-67 (G), MAP2 (H), Mertk (I), MHCII (J), MSR1 (K), neurofilament light chain (M), SPP1 (N), and TMEM119 (O). Mice treated with 20 Gy demonstrated significant downregulation of CSF1R (B), GFAP (D), and Vimentin (P). Hippocampus from mice treated with 30 Gy demonstrated significant upregulation of GFAP (D), GPNMB (E), MAP2 (H), and MHCII (J). Mice treated with 30 Gy demonstrated significant downregulation of NeuN (L). Data represent the mean ± SEM and black dots represent individual values (n = 4–8 mice per group). Control = control mice that were euthanized at 6 h and 25 days. 20 Gy RT = mice treated with 20 Gy radiation to hindlimb; 30 Gy RT = mice treated with 30 Gy radiation to hindlimb. * p < 0.05; ** p < 0.01; *** p = 0.01–0.001; **** p < 0.001.
Ijms 25 05731 g007aIjms 25 05731 g007b
Figure 8. Extracranial radiation causes significant gene changes in the brain of mice. Mice treated with 20 Gy demonstrated significant upregulation of Amigo2 (B), Arc (C), Crem (I), Fcrls (K), Gabra5 (N), Gfap (O), Gpr34 (R), Hspb1 (U), Ifnar2 (W), Lamtor3 (X), Lsr (Y), Map2 (AA), Mertk (CC), Pdgfra (HH), Plekhb1 (KK), Ptpn1 (OO), Shank3 (QQ), Shc3 (RR), Slc8a1 (SS), and Traf3 (ZZ). Mice treated with 20 Gy demonstrated significant downregulation of Al464131 (A), Atp6v1c1 (D), Bub3 (G), Gls (P), Gnai1 (Q), Ifnar1 (V), Mal2 (Z), Map2 (AA), Opalin (FF), Ppp3r1 (MM), Slc9a6 (TT), Sybu (WW), Tomm20 (YY), Trim45 (AAA), and Usp2 (BBB). Mice treated with 30 Gy demonstrated significant upregulation of Atp8a2 (E), Crem (I), Emcn (J), Gabra4 (M), Hspa1a/b (T), Hspb1 (U), Lamtor3 (X), Map3k4 (BB), Mertk (CC), Nrcam (EE), Parp2 (GG), Pias1 (JJ), Rab7 (PP), Tanc2 (XX), and Traf3 (ZZ). Mice treated with 30 Gy demonstrated significant downregulation of Al464131 (A), Atp6v1c1 (D), Brd2 (F), Bub3 (G), Cd47 (H), Fgf13 (L), Gabra5 (N), Gls (P), Gsn (S), Ndufa10 (DD), Opalin (FF), Phyh (II), Ppp3cb (LL), Ppp3r1 (MM), Psma5 (NN), Slc9a6 (TT), Snap25 (UU), Stmn1 (VV), Tomm20 (YY), and Trim45 (AAA). Data represent the mean ± SEM and black dots represent individual values (n = 2–3 mice per group). Control = control mice that were euthanized at 24 h and 12 days. 20 Gy RT = mice treated with 20 Gy radiation to hindlimb; 30 Gy RT = mice treated with 30 Gy radiation to hindlimb. * p < 0.05; ** p < 0.01; *** p = 0.01–0.001. NanoString nCounter® glial profiling panel and neuroinflammation panel.
Ijms 25 05731 g008aIjms 25 05731 g008bIjms 25 05731 g008c
Table 1. Pathway enrichment for the 54 genes differentially expressed in the brains of mice after extracranial radiation therapy.
Pathway SourcePathway Namep-ValueAdjusted
p-Value
Odds RatioCombined ScoreGenes Included in Pathway
BioPlanet 2019MAPK signaling pathway1.478 × 10−70.0000502612.88202.56PDGFRA, PPP3CB, PPP3R1, MAP2, STMN1, HSPB1, FGF13, LAMTOR3, MAP3K4
WikiPathway 2023 HumanMAPK signaling pathway WP3820.0000042320.000715312.28151.95PPP3CB, PPP3R1, STMN1, HSPB1, FGF13, LAMTOR3, MAP3K4
KEGG 2021 HumanMAPK signaling pathway0.000013540.00103210.20114.36PDGFRA, PPP3CB, PPP3R1, STMN1, HSPB1, LAMTOR3, MAP3K4
KEGG 2021 HumanGlutamatergic synapse0.000013940.00103218.57207.63PPP3CB, PPP3R1, SHANK3, GNAI1, GLS
KEGG 2021 HumanNatural killer cell mediated cytotoxicity0.000027300.00134716.05168.68IFNAR2, PPP3CB, PPP3R1, SHC3, IFNAR1
WikiPathway 2023 HumanImmune response to tuberculosis WP41970.000027630.00233561.69647.58IFNAR2, PIAS1, IFNAR1
BioPlanet 2019Natural killer cell-mediated cytotoxicity0.000033850.00348715.32157.67IFNAR2, PPP3CB, PPP3R1, SHC3, IFNAR1
BioPlanet 2019CD8/T cell receptor downstream pathway0.000034000.00348724.85255.71IFNAR2, PPP3CB, PPP3R1, IFNAR1
BioPlanet 2019Interferon alpha signaling regulation0.000041030.00348753.27538.12IFNAR2, PTPN1, IFNAR1
WikiPathway 2023 HumanRegulatory circuits of the STAT3 signaling pathway WP45380.000058380.00245921.48209.43IFNAR2, PDGFRA, STMN1, IFNAR1
WikiPathway 2023 HumanSARS coronavirus and innate immunity WP49120.000071730.00245943.40414.11IFNAR2, TRAF3, IFNAR1
KEGG 2021 HumanJAK-STAT signaling pathway0.000075230.00278412.86122.12IFNAR2, PDGFRA, PIAS1, IFNAR1, GFAP
WikiPathway 2023 HumanType I interferon induction and signaling during SARS-CoV-2 infection WP48680.000079270.00245941.84395.12IFNAR2, TRAF3, IFNAR1
WikiPathway 2023 HumanHost pathogen interaction of human coronaviruses interferon induction WP48800.000087300.00245940.40377.58IFNAR2, TRAF3, IFNAR1
KEGG 2021 HumanGABAergic synapse0.000097750.00289318.69172.59GABRA5, GABRA4, GNAI1, GLS
BioPlanet 2019EGF receptor (ErbB1) signaling pathway0.00011450.00778936.61332.19PTPN1, GSN, GNAI1
WikiPathway 2023 HumanmBDNF and proBDNF regulation of GABA neurotransmission WP48290.00014680.00354433.46295.37GABRA5, GABRA4, CREM
BioPlanet 2019Transmission across chemical synapses0.00015920.00901910.9095.32SNAP25, GABRA5, GABRA4, GNAI1, GLS
KEGG 2021 HumanKaposi sarcoma-associated herpesvirus infection0.00017120.00422310.7293.00IFNAR2, PPP3CB, PPP3R1, TRAF3, IFNAR1
Elsevier Pathway CollectionCochlear hair cell synapse proteins mutations (age-related/congenital)0.00025450.01874109.55906.71SNAP25, GNAI1
Elsevier Pathway CollectionHRH1/3 -> synaptic transmission0.00025450.01874109.55906.71SNAP25, GNAI1
Elsevier Pathway CollectionAXL receptor tyrosine kinase signaling0.00027740.0187426.61217.92IFNAR2, HSPB1, IFNAR1
BioPlanet 2019Interferon-alpha signaling pathway0.00031750.0137595.86772.11IFNAR2, IFNAR1
KEGG 2021 HumanOsteoclast differentiation0.00038360.00811012.89101.42IFNAR2, PPP3CB, PPP3R1, IFNAR1
BioPlanet 2019Cardiac protection against reactive oxygen species0.00038740.0137585.20669.33GABRA5, GABRA4
Elsevier Pathway CollectionHistamine in arousal regulation0.00038740.0187485.20669.33SNAP25, GNAI1
BioPlanet 2019GABA A and B receptor activation0.00039610.0137523.41183.36GABRA5, GABRA4, GNAI1
WikiPathway 2023 HumanInterferon type I signaling pathways WP5850.00041860.00884422.95178.49IFNAR2, PIAS1, IFNAR1
Elsevier Pathway CollectionDendritic cell activation in systemic lupus erythematosis0.00044200.0187422.50173.83IFNAR2, TRAF3, IFNAR1
BioPlanet 2019GABA (A) receptor activation0.00046410.0137576.68588.52GABRA5, GABRA4
Elsevier Pathway CollectionDRD2/4 -> membrane transport0.00046410.0187476.68588.52SNAP25, GNAI1
Elsevier Pathway CollectionEndocannabinoids role in sleep regulation0.00046410.0187476.68588.52SNAP25, GNAI1
Elsevier Pathway CollectionMicrotubule cytoskeleton0.00046410.0187476.68588.52MAP2, STMN1
KEGG 2021 HumanVEGF signaling pathway0.00054350.0100520.89157.06PPP3CB, PPP3R1, HSPB1
Elsevier Pathway CollectionDopamine mediated glutamate release/uptake circle in neuron in migraine0.00054760.0196569.70523.47SNAP25, GLS
Elsevier Pathway CollectionGRM2-4/6-8 (presynaptic) -> glutamate release attenuation0.00063770.0206063.89470.09SNAP25, GNAI1
KEGG 2021 HumanRetrograde endocannabinoid signaling0.00068310.0106011.0080.19GABRA5, GABRA4, NDUFA10, GNAI1
WikiPathway 2023 HumanSARS CoV 2 innate immunity evasion and cell specific immune response WP50390.00075490.0141818.56133.46IFNAR2, TRAF3, IFNAR1
KEGG 2021 HumanHepatitis C0.00085170.0106010.3573.15IFNAR2, TRAF3, PIAS1, IFNAR1
WikiPathway 2023 HumanInsulin signaling WP4810.00091390.0154510.1571.02SNAP25, PTPN1, SHC3, MAP3K4
Table 2. Mouse group names including treatment and timepoint euthanized. RT, radiation treatment.
GroupTreatmentTimepoint
Control 6 HNone6 h
20 Gy RT 6 H20 Gy RT6 h
30 Gy RT 6 H30 Gy RT6 h
Control 24 HNone24 h
20 Gy RT 24 H20 Gy RT24 h
30 Gy RT 24 H30 Gy RT24 h
Control 5 DNone5 days
20 Gy RT 5 D20 Gy RT5 days
30 Gy RT 5 D30 Gy RT5 days
Control 12 DNone12 days
20 Gy RT 12 D20 Gy RT12 days
30 Gy RT 12 D30 Gy RT12 days
Control 25 DNone25 days
20 Gy RT 25 D20 Gy RT25 days
30 Gy RT 25 D30 Gy RT25 days
Disclaimer/Publisher’s Note: The statements, opinions and data contained in all publications are solely those of the individual author(s) and contributor(s) and not of MDPI and/or the editor(s). MDPI and/or the editor(s) disclaim responsibility for any injury to people or property resulting from any ideas, methods, instructions or products referred to in the content.

