Abstract
In this study, our primary aim was to explore the genomic landscape of Barka cattle, a breed recognized for high milk production in a semi-arid environment, by focusing on genes with known roles in milk production traits. We employed genome-wide analysis and three selective sweep detection methods (ZFST, θπ ratio, and ZHp) to identify candidate genes associated with milk production and composition traits. Notably, ACAA1, P4HTM, and SLC4A4 were consistently identified by all methods. Functional annotation highlighted their roles in crucial biological processes such as fatty acid metabolism, mammary gland development, and milk protein synthesis. These findings contribute to understanding the genetic basis of milk production in Barka cattle, presenting opportunities for enhancing dairy cattle production in tropical climates. Further validation through genome-wide association studies and transcriptomic analyses is essential to fully exploit these candidate genes for selective breeding and genetic improvement in tropical dairy cattle.
1. Introduction
Cattle, one of the most economically significant livestock species globally, continue to play a vital role in agriculture and various cultural practices. Their domestication has driven a complex interplay of natural and artificial selection, shaping their adaptive traits and breed specialization [1]. Influenced by diverse ecosystems and climates, natural selection drove cattle to acquire unique adaptive characteristics. Concurrently, artificial selection refined these breeds for enhanced productivity and specific functions [2,3]. These dual processes have created diverse cattle breeds, finely specialized for distinct regions, exhibiting various adaptations, production capacities, and other phenotypic traits.
The African continent is widely acknowledged as a primary reservoir of cattle diversity [4,5]. Unlike commercially selected Western breeds, natural selection has predominantly influenced African cattle genomes [4,6]. Consequently, despite their adaptive traits, indigenous breeds’ production and reproduction performances remain poorly characterized [7]. Although African cattle breeds have often been regarded as less productive when compared to the intensively selected commercial breeds, some African breeds have the potential for improvement in dairy and beef traits, alongside their notable adaptability [8]. For example, recent genomic studies have pinpointed genes associated with milk production, composition traits, and meat attributes in various African indigenous cattle breeds [6,9,10]. These insights lay the basis for further in-depth research into the genomic characteristics of African cattle breeds for production traits.
Understanding the genetic potential of locally adapted dairy cattle breeding and improvement is crucial for sustainable milk production. This is particularly significant as temperate dairy breeds are more vulnerable to changing climates and environments, making their introduction to low-input systems less sustainable. Milk production, a complex polygenic trait, is influenced by multiple genes [11] and environmental factors. Identifying candidate genes and genomic regions that modulate milk production traits is essential for enhancing milk-related characteristics [12]. To date, various genomic regions and candidate genes linked to milk production and composition traits have been identified through different approaches, including the candidate gene approach [13,14,15], whole genome sequencing [6,16,17], validation through GWAS [18,19,20], as well as expression profiling [21,22,23].
Among Ethiopia’s 28 recognized cattle populations [24,25], the Barka cattle, alternatively called Begait, is native to the hot and semi-arid part of northwestern Ethiopia and Southern Eritrea [8]. Besides its unique adaptive attributes, this cattle population is characterized by a well-developed udder, long teats, and relatively high milk production performance [26,27]. Under an improved management system, it has been reported to achieve a daily milk yield of 12 L [28]. While the Barka cattle breed exhibits promising potential for milk production traits, genomic studies on this cattle breed have primarily emphasized genomic diversity and adaptive significance [29,30,31], with limited focus on its production potential. Thus, understanding the genetic determinants underlying milk production traits in Barka cattle is immensely important for sustainable dairy production, particularly in regions with typical hot climates and limited feed availability. We conducted a comparative analysis of Barka cattle as our focal test population with other breeds identified as low milk production yielders, including Ankole (2.2 L per day [32]) and the N’Dama breeds (1.5 L per day [33]). This study aims to identify the candidate genomic regions related to milk production and composition traits of Barka cattle in Ethiopia.
2. Results
2.1. Sequencing and Alignment Statistics
The individual genomes of 70 Ethiopian indigenous cattle breeds, namely Abigar (ABI), Barka (BAR), Boran (BOR), Fellata (FEL), Fogera (FOG), and Horro (HOR), were sequenced to an average coverage of approximately 14×. These genomes were then subjected to joint genotyping alongside publicly available genomic data from African Sanga (Ankole), African taurine (N’Dama), and a commercial cattle breed (Holstein) for comparative analysis (Tables S1 and S2). Burrows-Wheeler Aligner with Maximal Exact Matches algorithm (BWA MEM) [34] was employed for read alignment against the taurine reference genome sequence ARS-UCD1.2. The alignment process achieved an average alignment rate of 97.04%, covering 98.49% of the reference genome (Table S2).
2.2. Population Structure and Relationships
Principal component (PC) and admixture analysis were employed to investigate the genetic structure of Ethiopian cattle breeds compared to reference populations, including Holstein, N’Dama, and Ankole cattle. PC1 and PC2 explained 13.49% and 3.86% of the total variation, respectively (Figure 1A). Regardless of their geographic location, the Ethiopian cattle populations demonstrated a notable genetic relationship, forming a distinct cluster within the analysis. On the other hand, Holstein and N’Dama cattle breeds exhibited separate and well-defined genetic clusters, with the Ankole breed positioned between the taurine (Holstein and N’Dama) and the Ethiopian cattle populations. This suggests possible genetic admixture or shared ancestry between Ankole cattle and the taurine and zebu populations. In line with the PCA plot, the admixture analysis revealed that Ethiopian cattle populations exhibited distinct differences from N’Dama and Holstein cattle breeds when the number of ancestral populations (K) was set to 2. However, at the lowest cross-validation error (K = 4) (Figure S1), Barka cattle showed some level of unique patterns of admixtures (Figure 1B). Furthermore, the unrooted NJ tree also corroborated the results obtained from the PC and admixture analysis (Figure 1C).
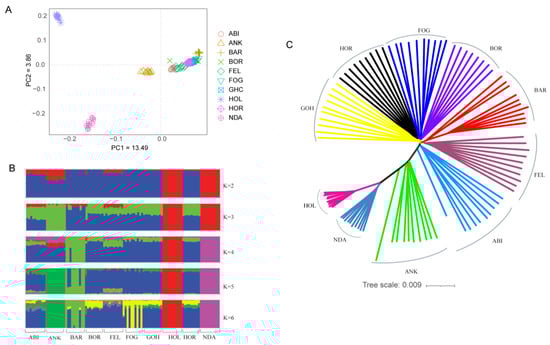
Figure 1.
Population structure and relationships of Ethiopian cattle. (A) PCA plot. (B) Admixture plot showing breed proportions at K = 2–6. (C) Neighbor-joining tree constructed based on genetic distance.
2.3. Genetic Diversity and Linkage Disequilibrium Decay
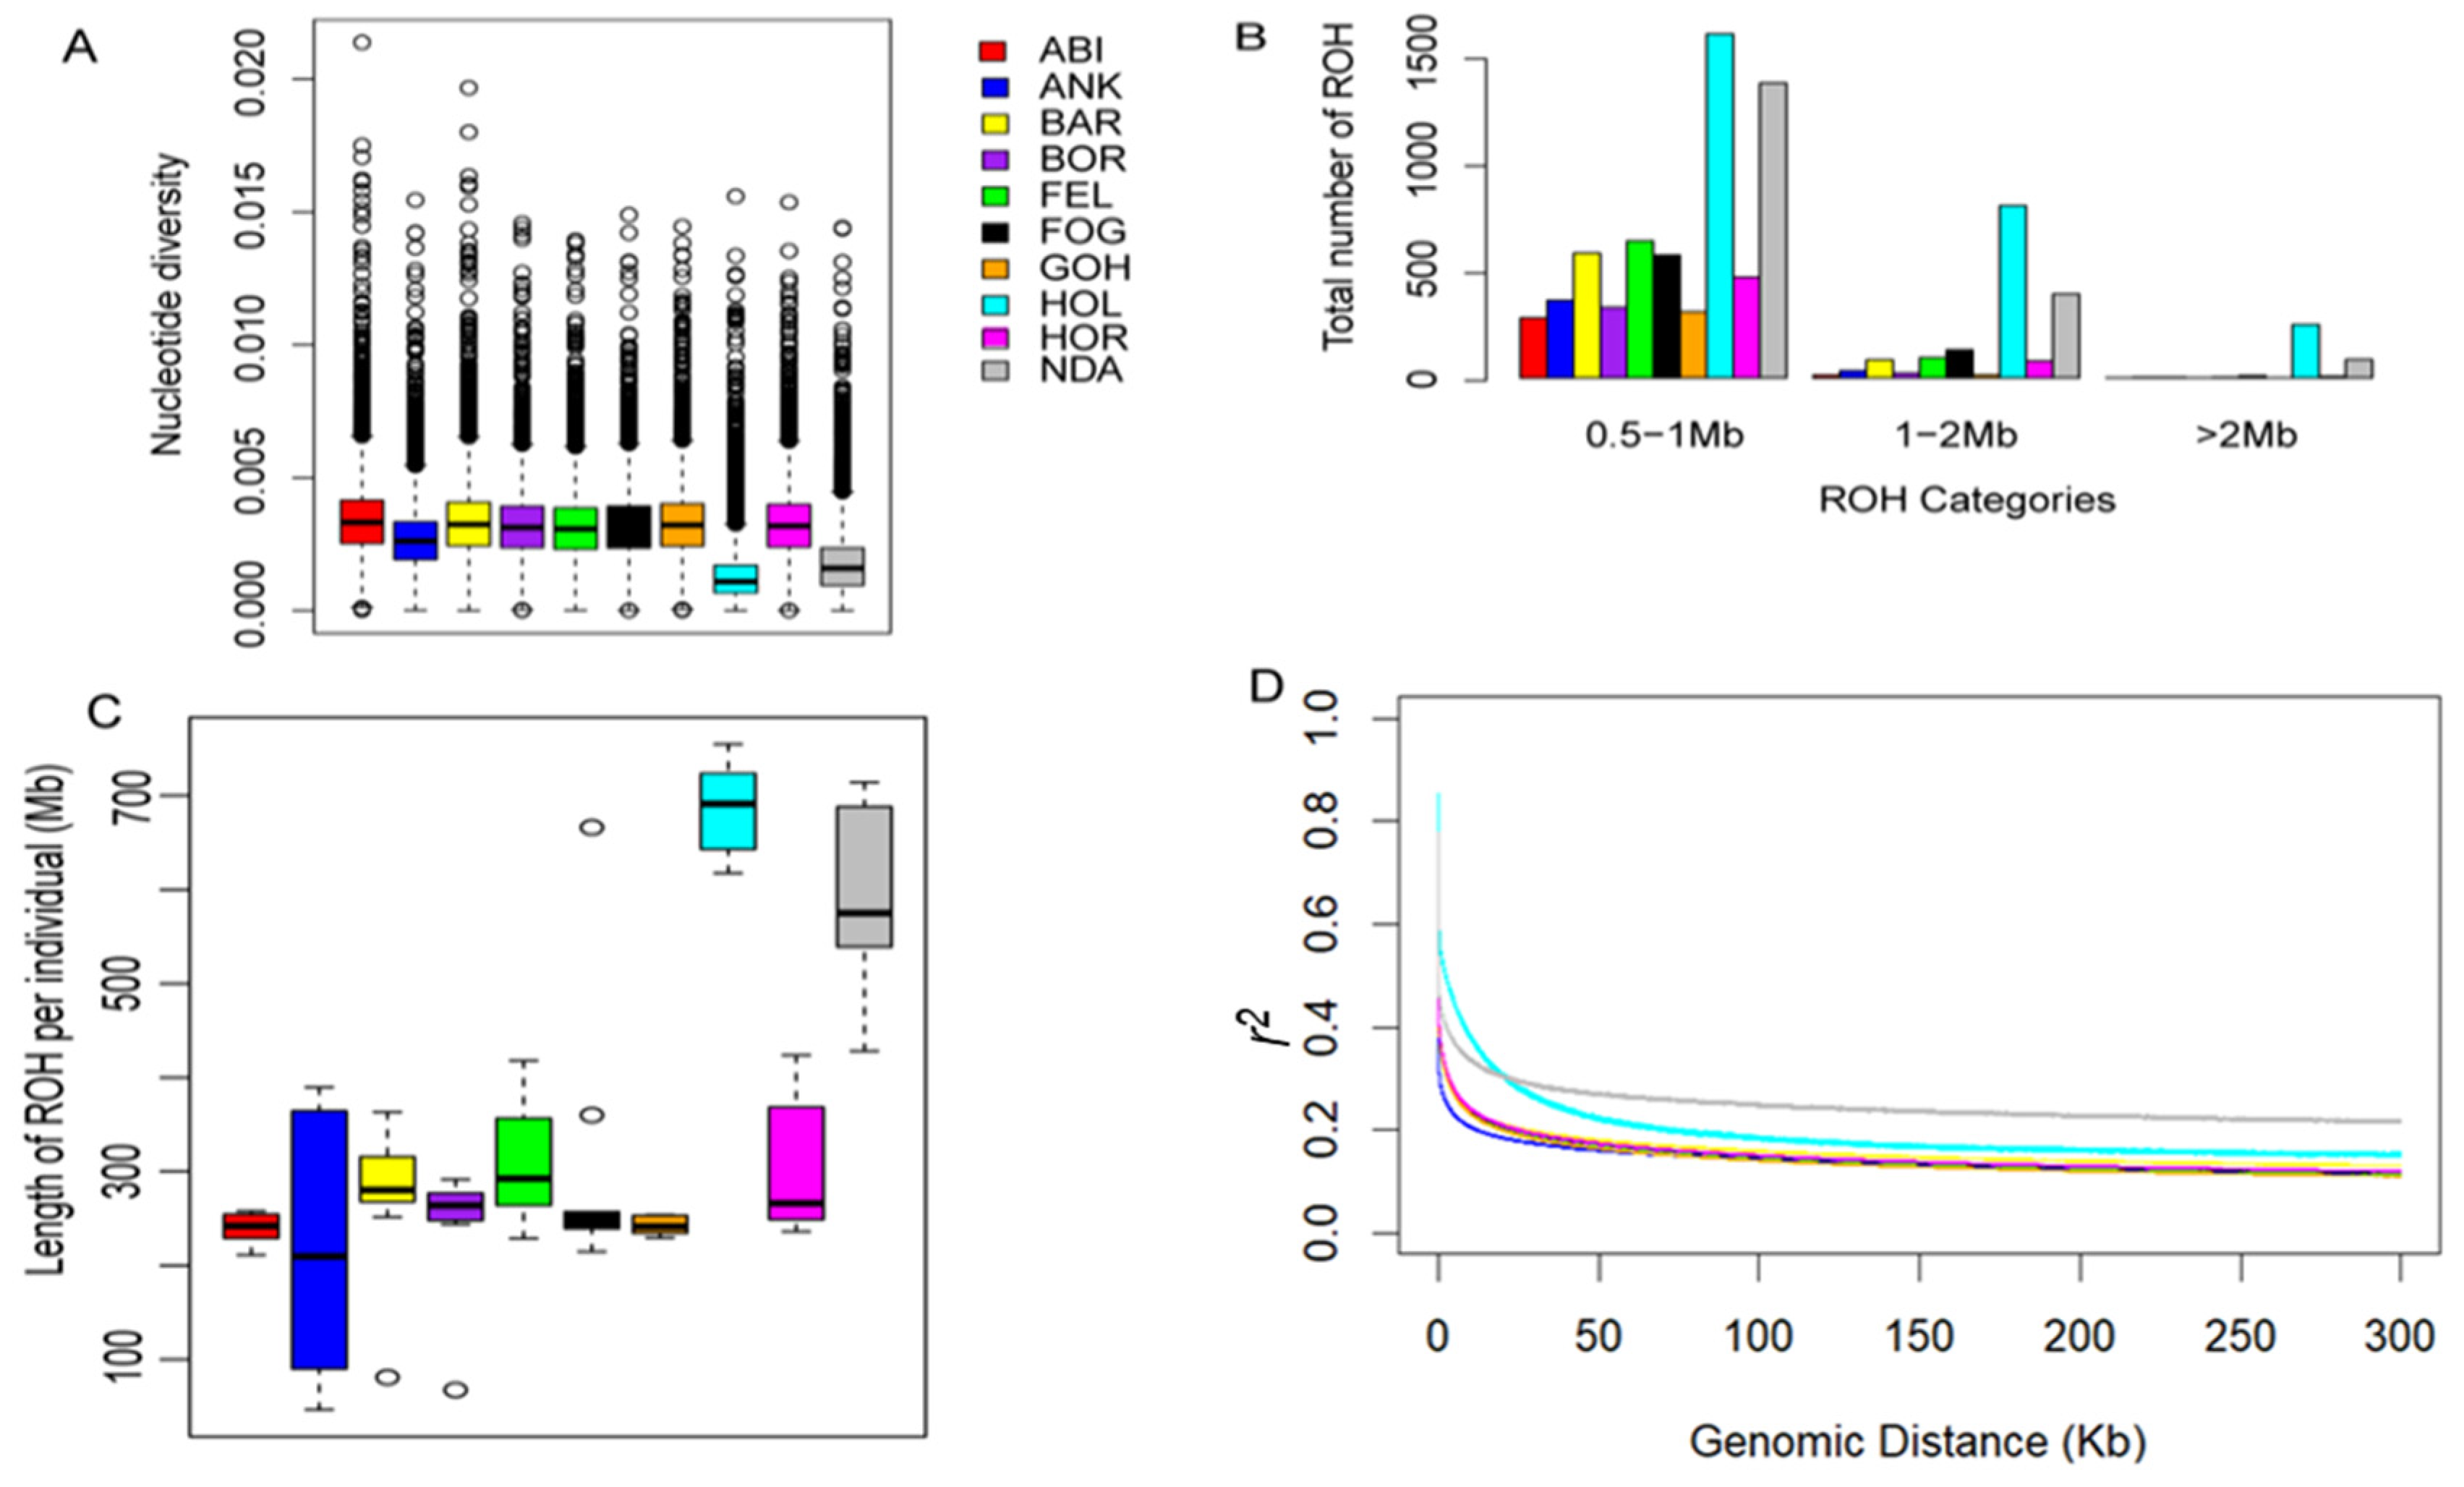
Our analysis revealed that the levels of nucleotide diversity within the Ethiopian cattle populations were comparable to one another yet notably higher when compared to the reference populations (Figure 2A). This finding underscores the substantial genetic diversity present in Ethiopian cattle in contrast to the reference breeds. To evaluate the ROH patterns of Ethiopian cattle, the length of ROH was classified into three size classes: 0.5–1 Mb, 1–2 Mb, and >2 Mb. Ethiopian zebus primarily exhibited ROHs ranging from 0.5 to 1 Mb, while taurine breeds displayed higher ROH levels across all size categories (Figure 2B). Similarly, the length of ROH was higher in taurine breeds than in Ethiopian zebus (Figure 2C). In all cattle breeds, the highest r2 values were observed at short distances (<10 kb) with a gradual decrease as the physical distance between SNPs increased (up to 200 kb). Beyond the 200 kb threshold, a stable pattern of r2 values was consistently observed (Figure 2D). These observations align with the ROH results, where taurine breeds exhibited the highest r2 values, potentially influenced by a combination of artificial selection and reduction in effective population size. Conversely, the lower ROH length and r2 values in Ethiopian cattle support the greater genomic diversity, as indicated by the higher nucleotide diversity (Figure 2A). Furthermore, despite their phenotypic and geographic variations, population differentiation within Ethiopian cattle populations was consistently lower than the differentiation observed among non-Ethiopian cattle populations (Table 1).
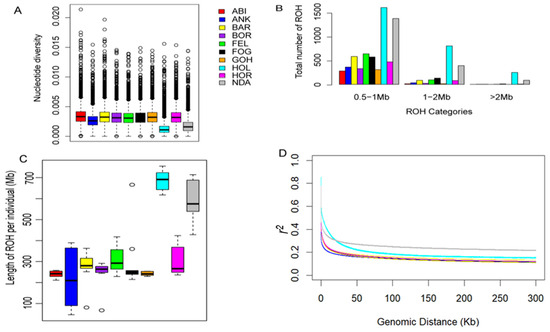
Figure 2.
Summary of genomic variation statistics. (A) Genome-wide nucleotide diversity distribution of each breed in 100 kb windows with 50 kb increments. (B) The distributions of ROH categories in each breed. (C) The length of ROH in each breed. (D) Genome-wide LD decay of each breed.

Table 1.
Population differentiation (FST) between Ethiopian and reference cattle breeds.
2.4. Signatures of Selection in Barka Cattle
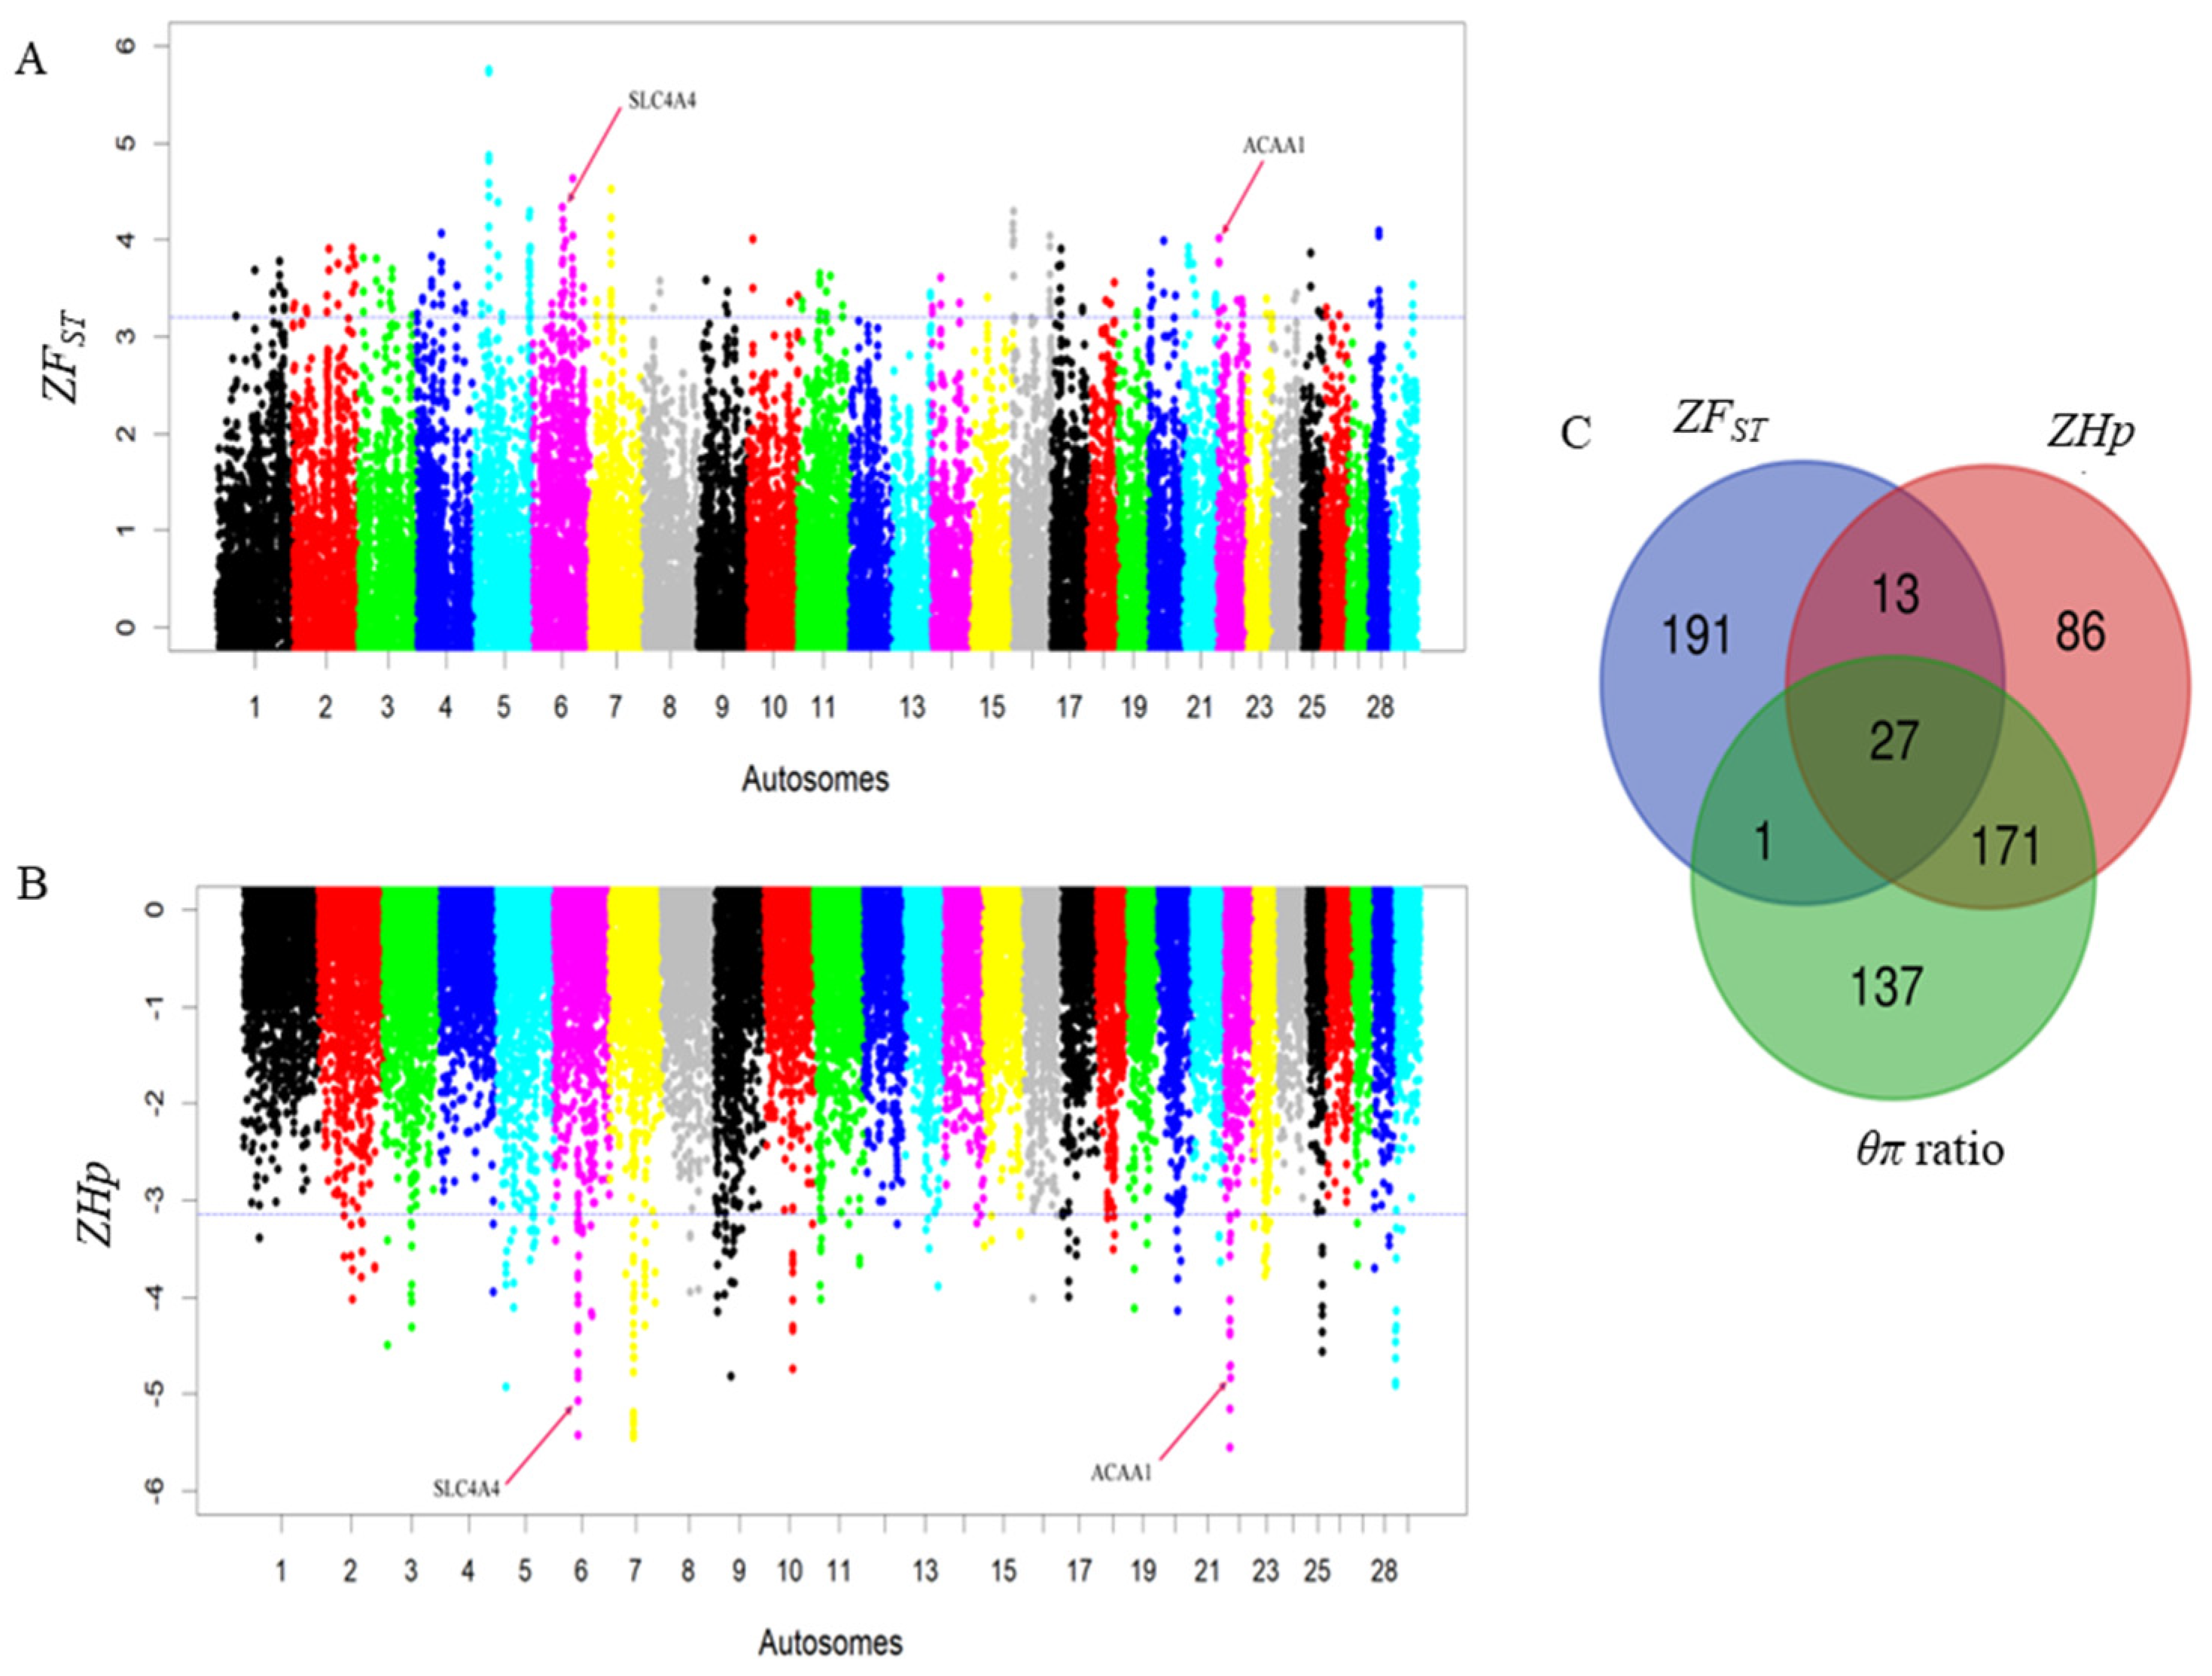
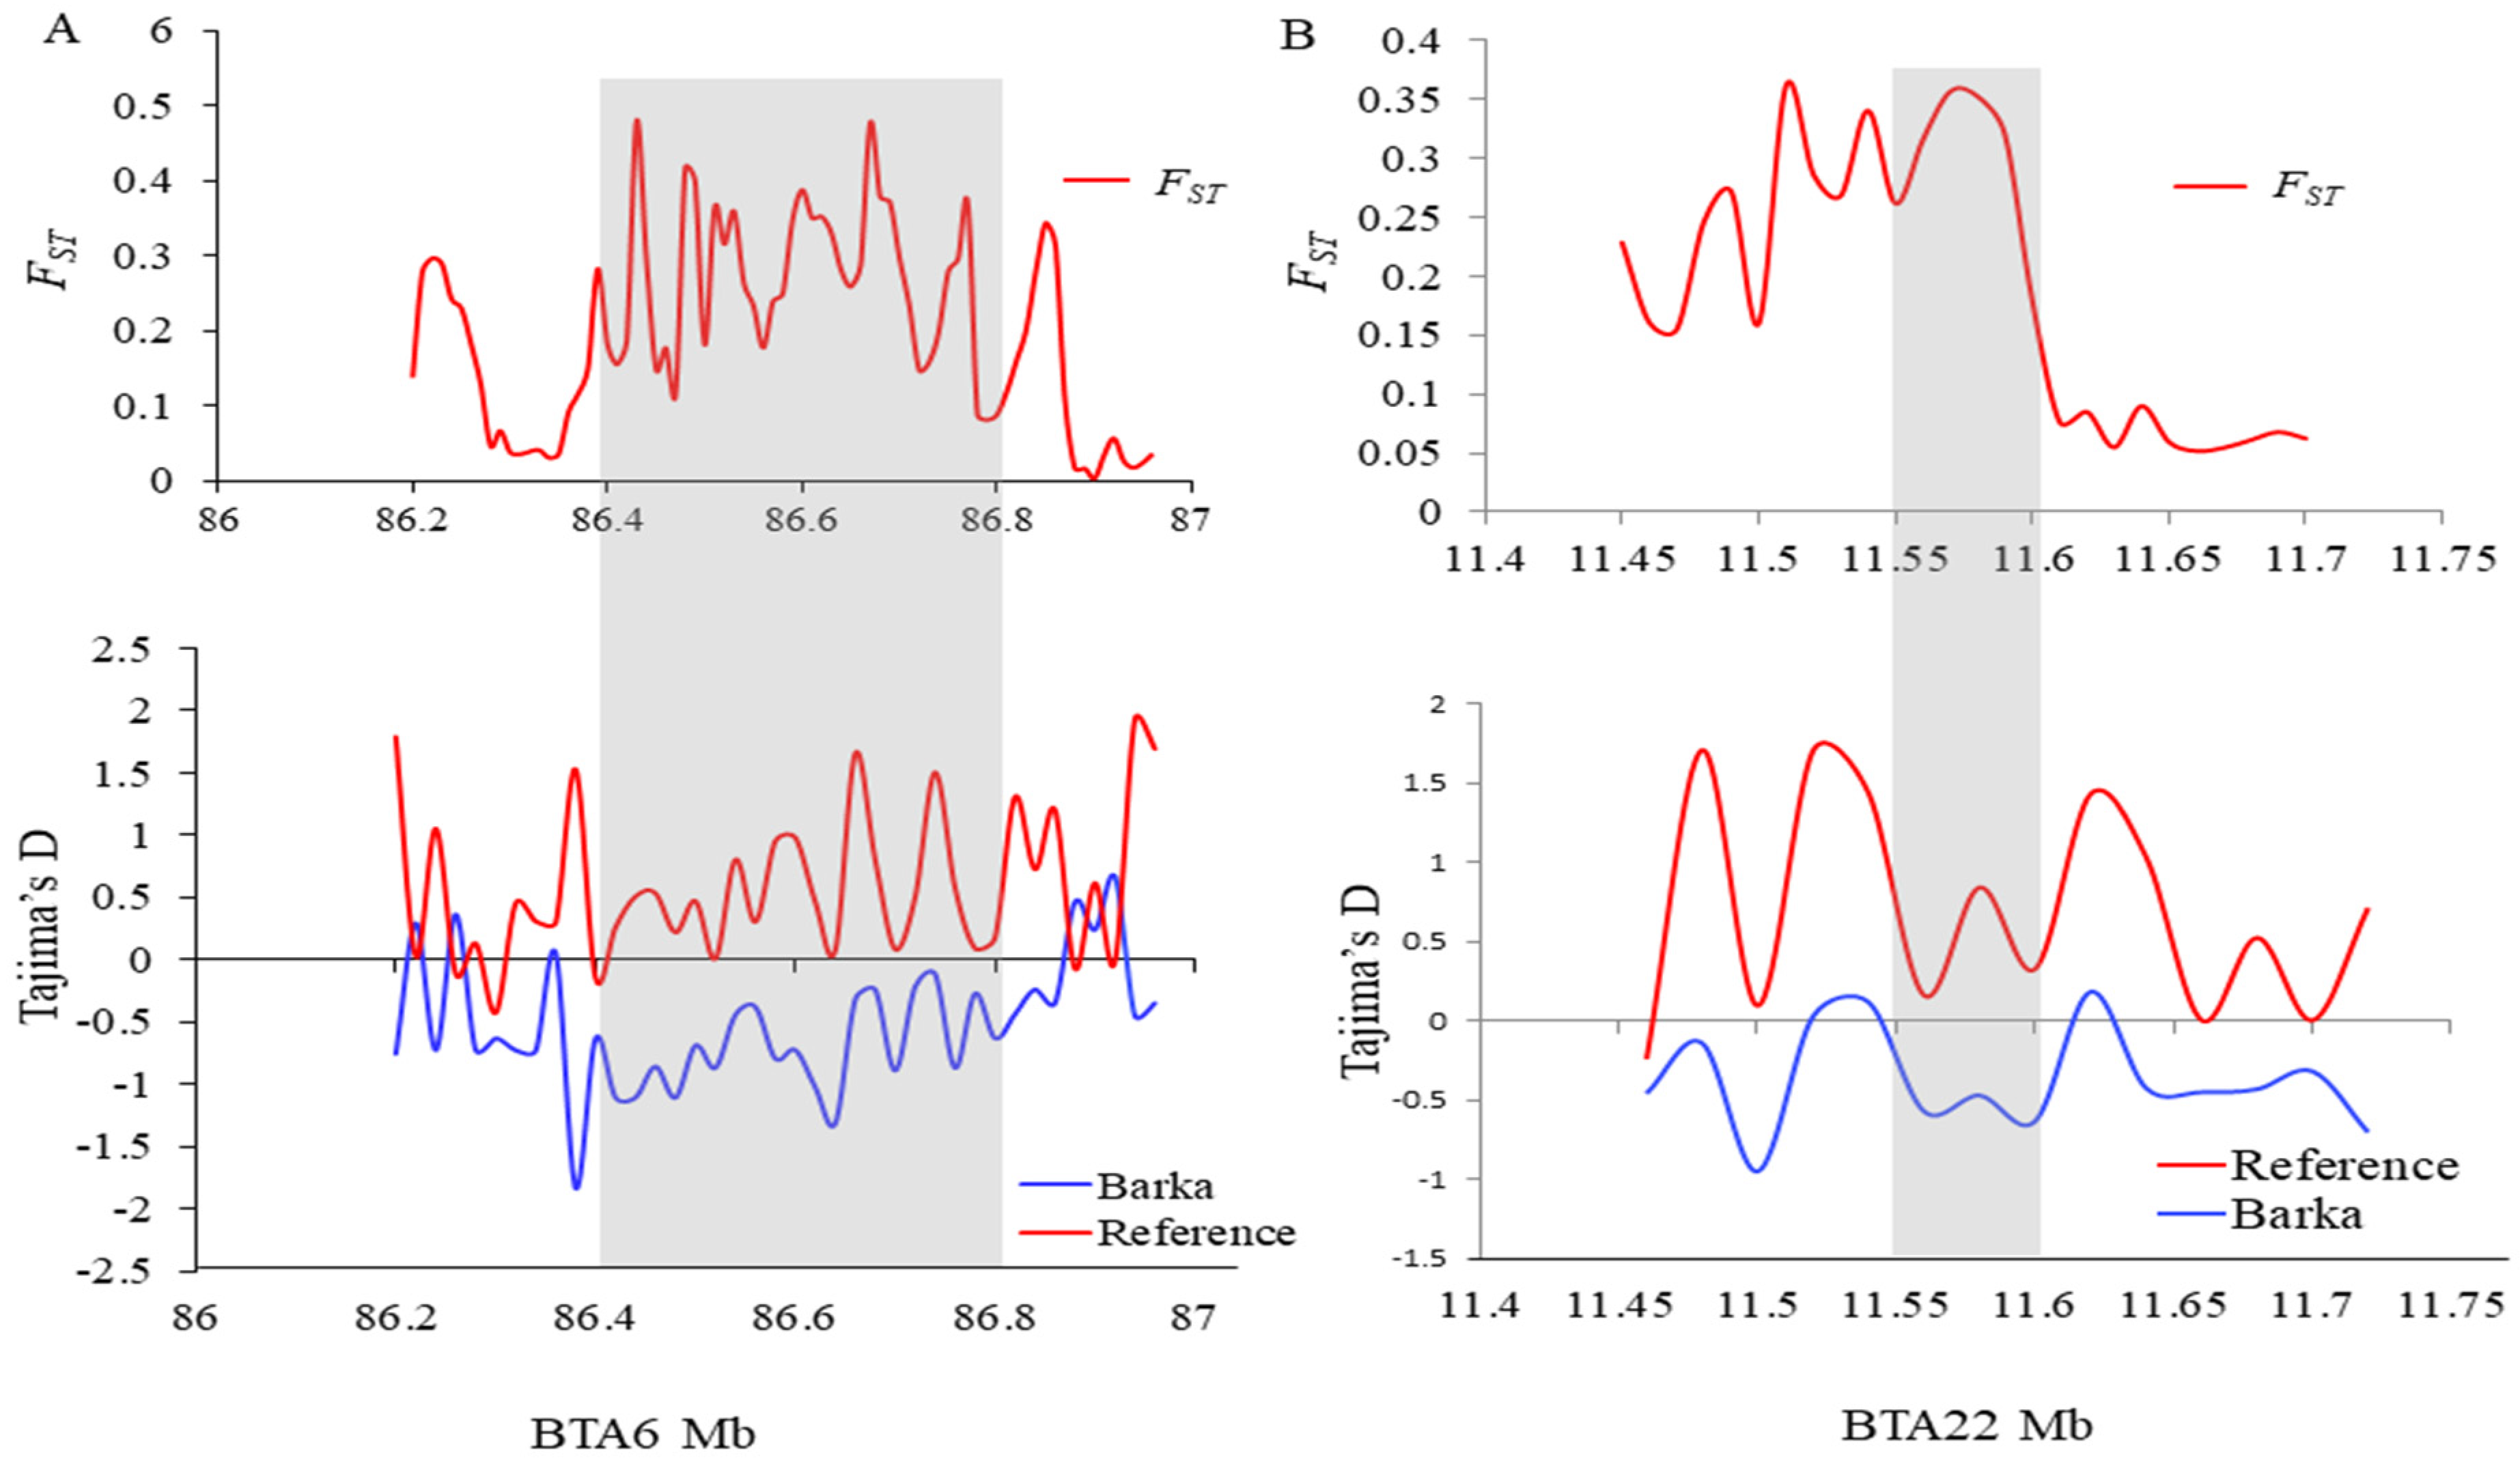
To elucidate selective sweeps likely associated with milk traits in Barka cattle, we compared Barka with reference breeds abroad. In this particular study, Barka cattle were considered the test population. In contrast, Ankole and N’Dama cattle breeds were used as reference populations to detect selection signatures associated with milk production traits despite their differences in adaptation and other characteristics. A total of 232, 297, and 336 protein-coding genes were detected in Barka cattle using ZFST (Table S3), ZHp (Table S4), and θπ ratio (Table S5) analyses, respectively. Across all selection scan analyses, 27 protein-coding genes were found to be shared (Figure 3C), among which three genes (ACAA1, P4HTM, and SLC4A4) were potentially associated with milk production and composition traits (Table 2, Figure 3A,B). Evidence for negative Tajima’s D scores and high FST signals of SLC4A4 (Figure 4A) and ACAA1 genes (Figure 4B) suggested a strong positive selection of Barka cattle in these genomic regions.

Figure 3.
Genomic landscape depicting signatures of positive selection in the Barka cattle breed. (A) Pooled heterozygosity (Hp) at the threshold of ZHp = −3.14. (B) Population differentiation (FST) at the threshold of ZFST = 3.2. (C) Venn diagram showing the genes overlapping among ZFST, θπ ratio, and ZHp selection scan methods.
Table 2.
Candidate genes detected using ZFST, θπ ratio, and ZHp selection scan methods influencing milk production and composition traits in dairy cattle.
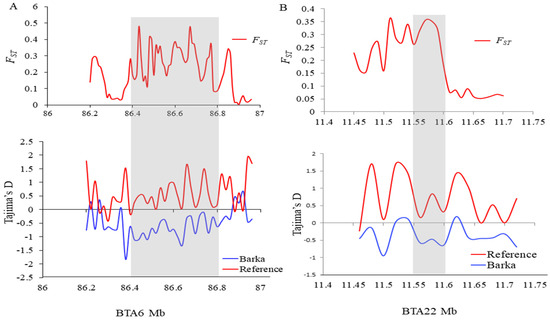
Figure 4.
Population differentiation (FST) and Tajima’s D plots. (A) ACAA1 and (B) SLC4A4 genes genomic regions.
2.5. Functional Annotations of Putative Selection Sweeps
To elucidate the functional relevance of genes identified as putative selection signatures in Barka cattle, we combined the Ensembl ID of candidate genes detected by all three selection scan methods and performed functional enrichment analyses on the online DAVID tools using Bos taurus as background. Candidate genes exhibiting highly analogous functions (p ≤ 0.05 and a fold enrichment ≥ 1.2) were classified into significant GO terms (Table S6). Based on the literature survey, positive regulation of phosphorus metabolic process (GO: 0010562), nucleocytoplasmic transport (GO: 0006913), monoatomic anion transport (GO: 0006820), and positive regulation of cell population proliferation (GO: 0008284) were the most significant GO terms (Table 3).
Table 3.
GO cluster annotation of candidate genes commonly detected by the ZFST, θπ ratio, and ZHp selection scan methods.
3. Discussion
3.1. Genetic Diversity, Relationships, and Population Structure
Characterizing genetic diversity and population structure is essential to reveal cattle populations’ adaptive and productive potential. These insights have profound implications for guiding future genetic improvement and conservation efforts [52]. The principal component (PC) and admixture analyses differentiate Ethiopian cattle from Ankole and African and European taurine breeds (Figure 1A,B). However, the Barka cattle breed exhibits unique genetic patterns distinct from other Ethiopian cattle breeds. This cattle breed is believed to have originated from the initial zebu introgression into Africa and exhibits distinctive genetic patterns reflecting their early adaptation in the region [25,30,53].
In contrast, the newly formed Zenga breeds (Fogera and Horro) and other zebus introduced during the second wave of zebu introgression following the rinderpest epidemic exhibit a different genetic signature [25,53]. This divergence in genetic patterns between Barka and Zenga cattle reflects their separate historical contexts and introgression events, supporting the hypothesis that the timing and circumstances of zebu cattle introductions have left lasting imprints on the genetic makeup of these breeds. Unlike the reference breeds, Ethiopian cattle exhibited notably higher levels of nucleotide diversity, affirming the higher genomic diversity within these cattle breeds. Our analysis also identified a limited occurrence of extended runs of homozygosity (ROH) (Figure 2B,C) and a slower rate of linkage disequilibrium (LD) decay in Ethiopian cattle compared to the reference breeds (Figure 2D). These low levels of ROH and LD decay align with prior research on other zebu cattle, indicating low selection pressure within these cattle breeds [6,31,54].
3.2. Candidate Genes Associated with Milk Production and Composition Traits
Milk production and composition traits are fundamental determinants of dairy cattle profitability, exerting a substantial influence on the economic viability of dairy enterprises. Although many African cattle breeds are not intensively selected for dairy characteristics, some indigenous breeds have displayed favorable dairy traits [6]. Among these breeds, the Barka cattle breed, found in the semi-arid lowlands of northwestern Ethiopia, is commonly recognized for its relatively higher milk-producing potential [8,28]. In contrast, the Ankole and N’Dama cattle breeds are characterized as poor milk producers [32,33]. Therefore, conducting a comparative genome analysis with the Barka breed as the test population and the Ankole and N’Dama breeds as reference populations is an effective strategy for identifying genomic regions that govern milk production and composition traits.
3.2.1. Milk Production Traits
Milk production traits, encompassing milk yield, composition, and other relevant parameters, are complex and polygenic traits influenced by many genetic factors. In recent years, advancements in genomics and bioinformatics have opened new horizons for uncovering the genetic basis of milk traits. This study identified interesting genes modulating milk production traits in Barka cattle (Table 1). ATP1B2, encoding a subunit of the sodium–potassium pump critical for ion transport across cell membranes, has shown a positive correlation with milk yield and heat resistance [47]. Notably, the genetic variations within the second and fourth introns of ATP1B2 have been observed as significant determinants of 305-day milk yield, milk fat content, and milk protein content in Chinese Holstein cows [14]. These findings underscore the pleiotropic effect of ATP1B2 on both tropical adaptation (heat resistance) and various milk traits. It is interesting to note that GMDS (GDP-Mannose 4,6-Dehydratase), located on BTA23 (51.11–51.16 Mb), could potentially have a functional role as a QTL for milk yield due to its involvement in fructose biosynthesis [42]. Fructose, as a critical component of various metabolic processes, may play a pivotal role in the energy balance of dairy cattle, which is closely tied to milk yield [55].
The SLC4A4 gene on BTA6 exhibited a strong positive selection signal (FST = 4.5) in Barka cattle (Table 2 and Figure 3A). This gene plays a pivotal role in regulating active glucose transport. It has previously been recognized as a candidate gene associated with milk yield traits [20]. Its significance is especially evident in milk synthesis, where the glucose uptake by mammary epithelial cells represents a crucial step with direct implications for milk production [21]. The positive selection signals observed in this gene are further corroborated by notably lower Tajima’s D (Figure 4A). Gene functional enrichment analysis revealed that SLC4A4 is associated with various GO terms (Table 3 and Table S6). Notably, it is prominently linked to the positive regulation of the phosphorus metabolic process (GO:0010562), which is primarily responsible for milk production traits [6]. Another noteworthy candidate gene is HNRNPL, which is associated with alternative splicing and mRNA transport and has demonstrated a positive correlation with milk yield [38]. This gene activates eNOS splicing and influences NOS3, which modulates nipple erection, suggesting its potential significance as a critical marker for milk yield traits [38,56].
3.2.2. Milk Fat Content
The milk composition holds significant importance within the dairy industry due to its direct influence on the nutritional profile and economic value of milk and various dairy products. Milk fat content is one of the compositional qualities, and its synthesis is a complex process regulated by a network of genes. Our analysis identified genes related to milk fat content, such as ACACA, FABP3, and PRKG1, in Barka cattle (Table 1). The ACACA gene, which encodes the Acetyl-CoA Carboxylase enzyme, plays a role in fatty acid metabolism. In dairy cattle, it’s associated with milk fat synthesis [22,57]. When the ACACA gene is more active, it can lead to an increased conversion of acetyl-CoA to malonyl-CoA, resulting in an increased synthesis of fatty acids. This can ultimately lead to higher milk fat content in dairy cattle [35]. The FABP3 gene, situated on BTA2, is a member of the fatty acid binding protein (FABP) family. It exhibits predominant expression in the mammary glands of cattle and has been implicated in regulating milk fat synthesis [18,58]. The upregulation of the FABP3 gene is pivotal in stimulating dairy cattle’s milk fat synthesis signaling pathway [36].
Additionally, the polymorphisms of the FABP3 gene have been found to influence milk fat and protein content in Jersey cattle [59]. The PRKG1 gene on BTA26 was identified as a candidate in our analysis. It plays a crucial role in adipocytes, facilitating triacylglycerol hydrolysis, releasing fatty acids and glycerol, and contributing to lipolysis [43]. The GWAS and transcriptional profiling studies support the assumption that the PRKG1 gene regulates milk fatty acid metabolism in dairy cattle [18,43].
3.2.3. Milk Protein Content
Understanding the genetic factors controlling milk protein synthesis is crucial for a comprehensive understanding of milk composition in cattle. Our analysis has revealed several candidate genes, including ANGPT1, CRIM1, P4HTM, and PLEC, which offer intriguing avenues for investigating their roles in milk protein content, particularly in Barka cattle. ANGPT1, also known as Ang1, has been previously recognized as a ligand for the TEK Receptor Tyrosine Kinase (TEK) and is associated with the PI3K-Akt signaling pathway, a pathway known to correlate with milk protein synthesis [37]. ANGPT1’s involvement in vascular network development, as demonstrated in mouse studies [60], suggests a potential role in facilitating nutrient transport and supply to the mammary gland, which is essential for milk synthesis. Identifying ANGPT1 as a candidate gene within our study has significant implications for understanding the genetic factors influencing milk protein production in Barka cattle.
Cysteine-rich transmembrane BMP regulator 1 (CRIM1) is another candidate gene encoding a protein characterized by cysteine-rich repeat structures, along with IGF-binding protein motifs and insulin-like growth factor binding protein motifs [61]. The presence of these motifs implies its potential involvement in insulin-related pathways known to influence milk protein gene expression, casein synthesis, and nutrient uptake in mammary glands [50,51]. Furthermore, genome-wide analysis in Holstein cattle identified the presence of the PLEC gene within selection sweeps, suggesting its association with critical candidate genes involved in milk protein expression [20,23]. The P4HTM gene has been linked to milk protein in dairy cattle [41] and sheep [62]. These findings imply the potential roles of these candidate genes in influencing milk protein content in Barka cattle and provide a basis for further investigations into their specific mechanisms and contributions to milk composition. As milk production and composition traits are complex polygenic traits, the detection of false positive and false negative results in selection signature analysis is expected. Therefore, validating these findings through alternative methods, including GWAS, the candidate gene approach, and gene expression analysis, is imperative.
3.2.4. Mammary Gland Development
Mammary gland development is a pivotal determinant determining milk production in dairy cattle [63]. Our selection signature analysis identified four candidate genes, ACAA1, CSF1, ERBB3, and MED1, which strongly correlate with mammary gland development and function (Table 2). The strong associations of these genes with mammary gland development were further confirmed by functional enrichment analysis linked to several important GO terms (Table 3 and Table S6). ACAA1 is a crucial enzyme involved in fatty acid metabolism, regulating breakdown and synthesis processes while influencing pathways related to fat and casein synthesis in mammary epithelial cells [64]. Markedly, Deng et al. [40] revealed that ACAA1 overexpression leads to enhanced mammary epithelial cell proliferation and increased secretion of triglycerides and β-casein, underlining its significant regulatory role in mammary gland activity, particularly in the synthesis of essential milk components.
The colony-stimulating factor 1 (CSF1) is another promising gene that significantly regulates macrophage migration and functions in various tissues, including the mammary gland [44]. The influence of this gene on macrophage activity within mammary tissue is noteworthy, as macrophages play a crucial role in tissue remodeling, immune defense, and milk synthesis during lactation [65]. ErbB3, also known as HER3, is a receptor tyrosine kinase and a member of the epidermal growth factor receptor (EGFR) family. It plays a significant role in mammary gland development and function, particularly during pregnancy and lactation [45,46]. ErbB3 is activated by neuregulin (NRG1), a growth factor secreted by mammary epithelial cells, and it plays a critical role in stimulating the proliferation and differentiation of mammary epithelial cells [66]. This process is essential for forming alveoli, the milk-producing structures within the mammary gland. The MED1 gene, a mediator complex subunit, is located on BTA19 (39.84–39.86 Mb). A previous study has reported that the MED1 gene is indispensable in mammary gland development and lactation [67,68]. Its involvement, particularly in conjunction with estrogen receptors (ERs), is primarily observed during the developmental phase of the mammary gland in puberty and in facilitating luminal cell differentiation [48].
4. Materials and Methods
4.1. Study Populations and Sequencing
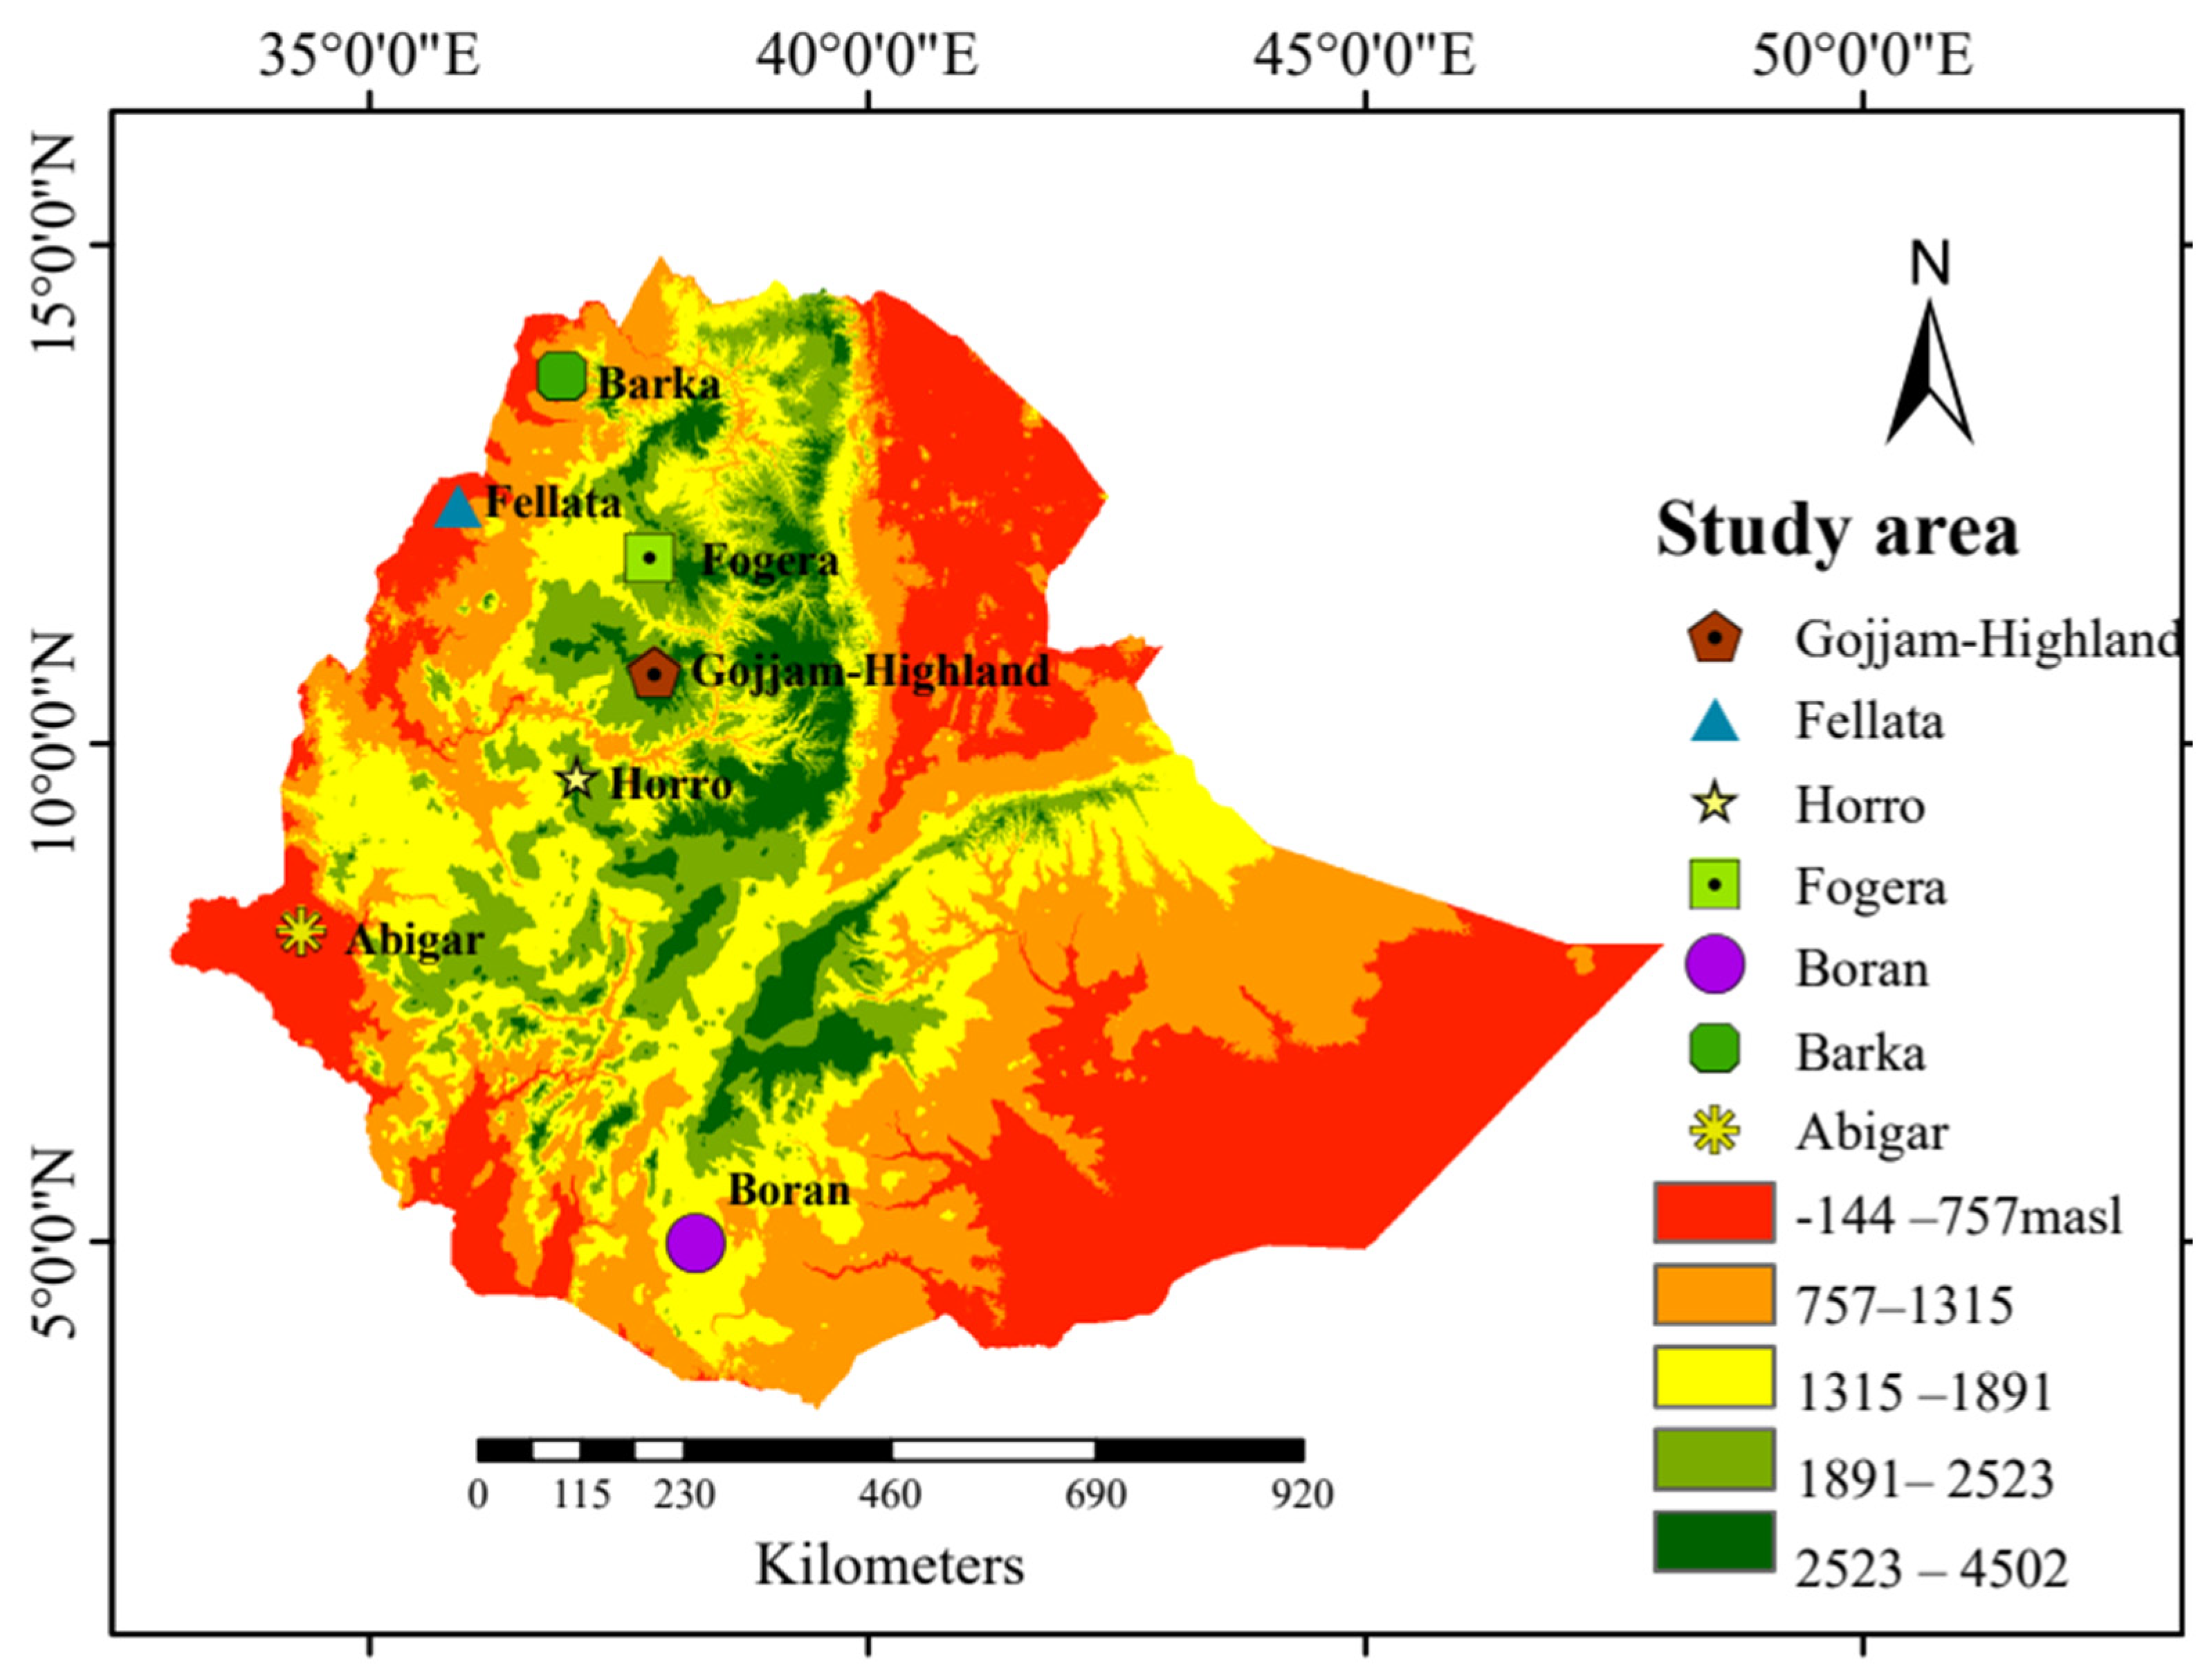
Seventy blood samples were collected from seven Ethiopian cattle populations, with 10 unrelated cattle from each population. These cattle were from diverse agroecological regions within their natural breeding habitats (Figure 5). Genomic DNA was extracted from 5 μg of blood using a Tiangen genomic DNA extraction kit based on the manufacturer’s protocols (TIANGEN Biotech, Beijing, China) and DNA libraries were prepared by ligating paired-end adapters and performing 150 bp PCR amplification. Subsequently, the amplicons were sequenced using the MGI-SEQ 2000 platform, generating a length of 150 bp paired-end reads. For comparison purposes of the selection sweeps and genetic diversity, we used 30 publicly available reference samples (Ankole, Holstein, and N’Dama; 10 samples from each breed) [69,70] obtained from public databases (Table S1). Among the seven cattle breeds sequenced, 20 samples, comprising 10 from the Abigar and 10 from the Barka cattle breeds, were previously included in our publication by Ayalew et al. [71].
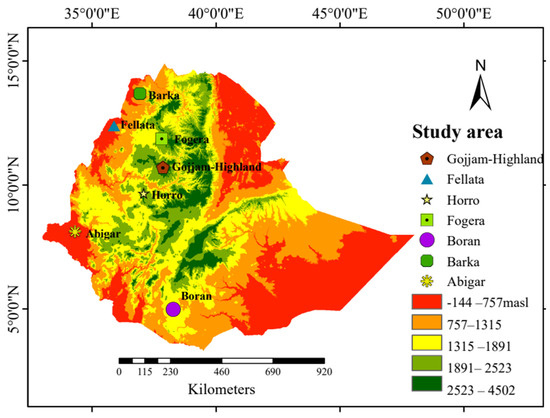
Figure 5.
Geographical map of Ethiopia indicating the sampling locations of the cattle populations with the altitude. Gojjam = Gojjam-Highland.
4.2. Alignment and Variant Identification
The paired-end reads of the seven Ethiopian cattle breeds and the retrieved reference sequences underwent adapter trimming using Trimomatic v0.39 [72]. The filtered reads were aligned against the cattle reference genome ARS-UCD1.2 [73] using default settings with BWA-MEM 0.7.17-r1188 [34]. After alignment, the output in SAM format was converted to BAM format, indexed, and sorted by coordinates using Samtools version 1.6 [74]. The resultant BAM files were processed to mark duplicates using Picard Tools 2.27.4 (https://broadinstitute.github.io/picard/, accessed on 8 March 2022). Subsequently, the non-duplicated individual BAM files underwent base quality recalibration. They were further processed through the ‘HaplotypeCaller,’ ‘CombineGVCFs,’ and ‘GenotypeGVCFs’ functions of GATK version 4.3.0.0 for calling raw SNPs [75], ultimately generating a jointly genotyped VCF file. The Variant Quality Score Recalibration (VQSR) process within the same software was employed on the raw variants to refine the set of variants. Validated SNPs from the 1000 Bull Genome Project were used for this calibration. The ‘SelectVariant’ procedure was applied to retrain variants meeting a 99% truth sensitivity threshold and remove low-quality variants. Finally, 36,527,967 autosomal SNPs were used for downstream analysis.
4.3. Genetic Diversity and Linkage Disequilibrium
The average nucleotide diversity (π) and population genetic differentiation (FST) were assessed using high-quality autosomal SNPs. These SNPs were examined within non-overlapping 100 kb windows with a step size of 50 kb across the entire set of bovine autosomes using VCFtools version 0.1.15 [76]. To assess the genome-wide linkage disequilibrium (LD) within each breed, we computed the average r2 values for pairwise markers using the PopLDdecay software v.3.42 [77] with default settings. SNPs with a minor allele frequency (MAF) of greater than 0.05 were considered in this analysis. The number and size of homozygosity (ROH) runs were estimated for each breed using the methods described in a previous study [78].
4.4. Population Structure and Relationships
After filtering out low-quality sequence data, the high-quality autosomal SNPs underwent additional screening, applying a minor allele frequency (MAF) threshold of 0.05. SNPs with more than 10% missing genotypes were eliminated using VCFtools [76]. Subsequently, the remaining SNPs were subjected to pairwise linkage disequilibrium pruning using Plink 1.9 [79] with the parameters of --indep-pairwise 50 10 0.2. These processes resulted in 1,344,914 SNPs used for Principal component (PC), admixture, and phylogenetic analyses. PC analysis was performed using the Plink 1.9 software package [79]. The resulting eigenvectors were visualized through ggplot2 in R [80]. To estimate the levels of admixture within the study populations, we employed ADMIXTURE version 1.3.0 software [81], running the analysis for values of K from 1 to 10 and plotted by ggplot2. Furthermore, we constructed an unrooted Neighbor-Joining (NJ) tree based on pairwise genetic distances, and the tree was visualized using Interactive Tree Of Life (iTOL) v.6.8.1 [82].
4.5. Selective Sweep Analysis and Annotation
In cattle, domestication and artificial selection have reduced nucleotide diversity and changes in allele frequencies. To elucidate genomic regions under selection and explore the differences between promising dairy breeds, such as Barka, and poor milk-producing cattle breeds (Ankole and N’Dama), two complementary comparative selection sweep analysis approaches were employed. First, we estimated the population differentiation (FST) [83] with a sliding window of 100 kb and 50 kb step size using VCFtools [76]. Then, the nucleotide diversity of the test population (Barka) and reference population (Ankole and N’Dama) was computed using VCFtools commands (--window-pi 100,000 --window-pi-step 50,000). The θπ ratio between the test population and reference populations was calculated as ln (θπ, Barka/θπ, Ankole, and N’Dama). In addition, using the same software, window, and step size, a within-population pooled heterozygosity (ZHp) selection scan was performed in Barka cattle. The genomic regions that show high ZFST values (top 0.5% of ZFST distribution), low levels of nucleotide diversity (top 0.5% for θπ ratio), and extremely low ZHp scores (the bottom 0.5% of ZHp distributions) were considered to represent genomic regions under selection. Tajima’s D and FST statistics were computed for candidate genes using VCFtools [76].
4.6. Functional Analysis of the Candidate Genes
The candidate genomic regions identified by the three complementary approaches (ZFST, ZHp, and θπ ratio) were annotated using the Ensembl Biomart annotation tool (http://useast.ensembl.org/index.html, accessed on 25 September 2023) [84], using the ARS-UCD1.2 cattle reference genome [36]. To better understand the molecular functions of the candidate genes, we performed enrichment analyses using the Gene Ontology (GO) and Kyoto Encyclopedia of Genes and Genomes (KEGG) databases through the online DAVID tools [85]. The p-values for gene enrichment were subjected to correction using the Benjamini–Hochberg method to control the false discovery rate (FDR). Significantly enriched GO and KEGG pathways were determined by considering only those GO and pathways where the corrected p-value fell below the threshold of 0.05.
5. Conclusions
With their rich genetic diversity and remarkable adaptability, indigenous cattle breeds hold significant potential for enhancing milk production and composition traits. Through this study, we have unveiled several candidate genes that shed light on the underlying mechanisms influencing milk production in Barka cattle. These findings offer new avenues for further exploration into the genetic determinants of milk traits in indigenous breeds. Identifying candidate genes associated with milk yield, fat content, protein content, and mammary gland development underscores the complex genetic architecture underlying dairy traits. ATP1B2, SLC4A4, GMDS, and HNRNPL are notable genes implicated in milk production, highlighting their potential role in enhancing Barka cattle’s dairy productivity. Understanding the genetic basis of milk traits is crucial for developing targeted breeding programs to improve dairy productivity and preserve indigenous cattle breeds. Given the challenges posed by climate change and the increasing demand for milk production, harnessing the resilience and productivity of native cattle breeds is essential for sustainable dairy production, particularly in regions with limited feed resources and hot climates. Further validation and in-depth functional investigations of these candidate genes are warranted to elucidate their precise roles in milk production and composition.
Supplementary Materials
The following supporting information can be downloaded at: https://www.mdpi.com/article/10.3390/ijms25116142/s1.
Author Contributions
W.A., G.M.T. and X.W. designed the research; W.A. collected the samples; W.A. and S.E. carried out DNA extraction; W.A. analyzed the data input from G.M.T., X.W., R.N. and R.V.D.; W.A. interpreted the results; P.Y., E.B.-R. and T.S.T. provided funding for laboratory facilities, Sequencing and Bioinformatics resources; W.A. drafted the manuscript, W.A., G.M.T., X.W., T.S.T., R.N., R.V.D., E.B.-R., Z.E., M.C., C.L., S.E. and P.Y. edited the manuscript. All authors have read and agreed to the published version of the manuscript.
Funding
This study was supported by Key Research and Development Programs of Science and Technology, Project of Gansu Province (20YF8WA031), the Agricultural Science and Technology Innovation Program (25-LZIHPS-01), and Central Public-interest Scientific Institution Basal Research Fund (1610322024014).
Institutional Review Board Statement
No specific approval from the Ethical Committee was required to collect blood samples for animal-based studies in the study area. Instead, the research protocol was reviewed and approved by the animal administration and Ethics committee of the Lanzhou Institute of Husbandry and Pharmaceutical Science of the CAAS Institutional Review Board (Permit No. SYXK-2014-0002).
Data Availability Statement
The raw sequencing data for the Ethiopian cattle samples are available from the Sequence Read Archive (SRA) with the Bioproject accession numbers PRJNA1053488 and PRJNA1059514. The accessions for the previously published datasets can be found in Table S1.
Acknowledgments
The authors acknowledge the Swedish University of Agricultural Sciences (SLU), Uppsala, Sweden, for providing access to the SLU Bioinformatics Infrastructure (SLUBI). The authors also thank the Institute of Biotechnology, Addis Ababa University, Ethiopia, for granting access to their laboratory and other essential facilities.
Conflicts of Interest
The authors declare no conflict of interest.
References
- Randhawa, I.A.; Khatkar, M.S.; Thomson, P.C.; Raadsma, H.W. A meta-assembly of selection signatures in cattle. PLoS ONE 2016, 11, e0153013. [Google Scholar] [CrossRef] [PubMed]
- Flori, L.; Fritz, S.; Jaffrézic, F.; Boussaha, M.; Gut, I.; Heath, S.; Foulley, J.L.; Gautier, M. The genome response to artificial selection: A case study in dairy cattle. PLoS ONE 2009, 4, e6595. [Google Scholar] [CrossRef] [PubMed]
- Gouveia, J.J.; Silva, M.V.; Paiva, S.R.; Oliveira, S.M. Identification of selection signatures in livestock species. Genet. Mol. Biol. 2014, 37, 330–342. [Google Scholar] [CrossRef] [PubMed]
- Mwai, O.; Hanotte, O.; Kwon, Y.J.; Cho, S. African indigenous cattle: Unique genetic resources in a rapidly changing world. Asian-Australas. J. Anim. Sci. 2015, 28, 911. [Google Scholar] [CrossRef] [PubMed]
- Kim, K.; Kwon, T.; Dessie, T.; Yoo, D.; Mwai, O.A.; Jang, J.; Sung, S.; Lee, S.; Salim, B.; Jung, J.; et al. The mosaic genome of indigenous African cattle as a unique genetic resource for African pastoralism. Nat. Genet. 2020, 52, 1099–1110. [Google Scholar] [CrossRef] [PubMed]
- Nanaei, H.A.; Qanatqestani, M.D.; Esmailizadeh, A. Whole-genome resequencing reveals selection signatures associated with milk production traits in African Kenana dairy zebu cattle. Genomics 2020, 112, 880–885. [Google Scholar] [CrossRef] [PubMed]
- Kambal, S.; Tijjani, A.; Ibrahim, S.A.; Ahmed, M.K.; Mwacharo, J.M.; Hanotte, O. Candidate signatures of positive selection for environmental adaptation in indigenous African cattle: A review. Anim. Genet. 2023, 54, 689–708. [Google Scholar] [CrossRef] [PubMed]
- Rege, J.E. The state of African cattle genetic resources I. Classification framework and identification of threatened and extinct breeds. Anim. Genet. Resour./Resour. Génétiques Anim./Recur. Genéticos Anim. 1999, 25, 1–25. [Google Scholar] [CrossRef]
- Taye, M.; Kim, J.; Yoon, S.H.; Lee, W.; Hanotte, O.; Dessie, T.; Kemp, S.; Mwai, O.A.; Caetano-Anolles, K.; Cho, S.; et al. Whole genome scan reveals the genetic signature of African Ankole cattle breed and potential for higher quality beef. BMC Genet. 2017, 18, 11. [Google Scholar] [CrossRef]
- Bahbahani, H.; Salim, B.; Almathen, F.; Al Enezi, F.; Mwacharo, J.M.; Hanotte, O. Signatures of positive selection in African Butana and Kenana dairy zebu cattle. PLoS ONE 2018, 13, e0190446. [Google Scholar] [CrossRef]
- Pizarro Inostroza, M.G.; Landi, V.; Navas González, F.J.; León Jurado, J.M.; Delgado Bermejo, J.V.; Fernández Álvarez, J.; Martínez Martínez, M.D. Integrating casein complex SNPs additive, dominance and epistatic effects on genetic parameters and breeding values estimation for murciano-granadina goat milk yield and components. Genes 2020, 11, 309. [Google Scholar] [CrossRef] [PubMed]
- Cochran, S.D.; Cole, J.B.; Null, D.J.; Hansen, P.J. Discovery of single nucleotide polymorphisms in candidate genes associated with fertility and production traits in Holstein cattle. BMC Genet. 2013, 14, 49. [Google Scholar] [CrossRef] [PubMed]
- Szyda, J.; Komisarek, J. Statistical modeling of candidate gene effects on milk production traits in dairy cattle. J. Dairy Sci. 2007, 90, 2971–2979. [Google Scholar] [CrossRef] [PubMed]
- Wang, Z.; Wang, G.; Huang, J.; Li, Q.; Wang, C.; Zhong, J. Novel SNPs in the ATP1B2 gene and their associations with milk yield, milk composition and heat-resistance traits in Chinese Holstein cows. Mol. Biol. Rep. 2011, 38, 1749–1755. [Google Scholar] [CrossRef] [PubMed]
- Fontanesi, L.; Calo, D.G.; Galimberti, G.; Negrini, R.; Marino, R.; Nardone, A.; Ajmone-Marsan, P.; Russo, V. A candidate gene association study for nine economically important traits in Italian Holstein cattle. Anim. Genet. 2014, 45, 576–580. [Google Scholar] [CrossRef] [PubMed]
- Jiang, J.; Gao, Y.; Hou, Y.; Li, W.; Zhang, S.; Zhang, Q.; Sun, D. Whole-genome resequencing of Holstein bulls for indel discovery and identification of genes associated with milk composition traits in dairy cattle. PLoS ONE 2016, 11, e0168946. [Google Scholar] [CrossRef] [PubMed]
- Gao, Y.; Jiang, J.; Yang, S.; Hou, Y.; Liu, G.E.; Zhang, S.; Zhang, Q.; Sun, D. CNV discovery for milk composition traits in dairy cattle using whole genome resequencing. BMC Genom. 2017, 18, 265. [Google Scholar] [CrossRef] [PubMed]
- Li, C.; Sun, D.; Zhang, S.; Wang, S.; Wu, X.; Zhang, Q.; Liu, L.; Li, Y.; Qiao, L. Genome wide association study identifies 20 novel promising genes associated with milk fatty acid traits in Chinese Holstein. PLoS ONE 2014, 9, e96186. [Google Scholar] [CrossRef] [PubMed]
- Chen, Z.; Yao, Y.; Ma, P.; Wang, Q.; Pan, Y. Haplotype-based genome-wide association study identifies loci and candidate genes for milk yield in Holsteins. PLoS ONE 2018, 13, e0192695. [Google Scholar] [CrossRef]
- Pedrosa, V.B.; Schenkel, F.S.; Chen, S.Y.; Oliveira, H.R.; Casey, T.M.; Melka, M.G.; Brito, L.F. Genome-wide association analyses of lactation persistency and milk production traits in Holstein cattle based on imputed whole-genome sequence data. Genes 2021, 12, 1830. [Google Scholar] [CrossRef]
- Pradeep, J.; Monika, S.; Ankita, S.; Umesh, K.S.; Amit, K.; Ashok, M.; Mishra, B.P.; Sandeep, M.; Kataria, R.S.; Kaushik, J.; et al. Expression analysis of solute carrier (SLC2A) genes in milk derived mammary epithelial cells during different stages of lactation in sahiwal (Bos indicus) cows. J. Adv. Dairy Res. 2014, 2, 2. [Google Scholar]
- Yang, J.; Jiang, J.; Liu, X.; Wang, H.; Guo, G.; Zhang, Q.; Jiang, L. Differential expression of genes in milk of dairy cattle during lactation. Anim. Genet. 2016, 47, 174–180. [Google Scholar] [CrossRef] [PubMed]
- Wang, P.; Li, X.; Zhu, Y.; Wei, J.; Zhang, C.; Kong, Q.; Nie, X.; Zhang, Q.; Wang, Z. Genome-wide association analysis of milk production, somatic cell score, and body conformation traits in Holstein cows. Front. Vet. Sci. 2022, 9, 932034. [Google Scholar] [CrossRef] [PubMed]
- Central Statistical Agency of Ethiopia (CSA). Agricultural Sample Survey Vol. II. Report on Livestock and Livestock Characteristics; Statistical Bulletin: Addis Ababa, Ethiopia, 2021.
- Domestic Animal Diversity Information System (DADIS). Number of Breeds by Species and Country. Available online: http://dad.fao.org/ (accessed on 20 June 2021).
- Zerabruk, M.; Vangen, O.; Haile, M. The status of cattle genetic resources in North Ethiopia: On-farm characterization of six major cattle breeds. Anim. Genet. Resour./Resour. Génétiques Anim./Recur. Genéticos Anim. 2007, 40, 15–32. [Google Scholar] [CrossRef]
- Gebrekidan, B.; Tegegne, A.; Regassa, F. Assessment of reproductive performance of Begait cattle in in-situ and ex-situ sites and in different production systems in northern Ethiopia. Anim. Reprod. Sci. 2016, 166, 1–8. [Google Scholar] [CrossRef] [PubMed]
- Mezgebe, G.; Gizaw, S.; Urge, M.; Chavhan, A. Begait cattle production systems and production performances in northern Ethiopia. Int. J. Life Sci. 2017, 5, 506–516. [Google Scholar]
- Zegeye, T.; Belay, G.; Vallejo-Trujillo, A.; Han, J.; Hanotte, O. Genome-wide diversity and admixture of five indigenous cattle populations from the Tigray region of northern Ethiopia. Front. Genet. 2023, 14, 1050365. [Google Scholar] [CrossRef] [PubMed]
- Edea, Z.; Bhuiyan, M.S.; Dessie, T.; Rothschild, M.F.; Dadi, H.; Kim, K.S. Genome-wide genetic diversity, population structure and admixture analysis in African and Asian cattle breeds. Animal 2015, 9, 218–226. [Google Scholar] [CrossRef] [PubMed]
- Terefe, E.; Belay, G.; Tijjani, A.; Han, J.; Hanotte, O. Whole genome resequencing reveals genetic diversity and selection signatures of Ethiopian indigenous cattle adapted to local environments. Diversity 2023, 15, 540. [Google Scholar] [CrossRef]
- Kugonza, D.R.; Nabasirye, M.; Mpairwe, D.; Hanotte, O.; Okeyo, A.M. Productivity and morphology of Ankole cattle in three livestock production systems in Uganda. Anim. Genet. Resour./Resour. Génétiques Anim./Recur. Genéticos Anim. 2011, 48, 13–22. [Google Scholar] [CrossRef]
- Coffie, I.; Annor, S.Y.; Kagya-Agyemang, J.K.; Bonsu, F.R. Effect of breed and non-genetic factors on milk yield of dual-purpose cattle in Ashanti Region, Ghana. Livest. Resour. Rural Dev. 2015, 27, 7. [Google Scholar]
- Li, H.; Durbin, R. Fast and accurate short read alignment with Burrows–Wheeler transform. Bioinformatics 2009, 25, 1754–1760. [Google Scholar] [CrossRef] [PubMed]
- Matsumoto, H.; Sasaki, K.; Bessho, T.; Kobayashi, E.; Abe, T.; Sasazaki, S.; Oyama, K.; Mannen, H. The SNPs in the ACACA gene are effective on fatty acid composition in Holstein milk. Mol. Biol. Rep. 2012, 39, 8637–8644. [Google Scholar] [CrossRef] [PubMed]
- Liang, M.Y.; Hou, X.M.; Qu, B.; Zhang, N.; Li, N.; Cui, Y.J.; Li, Q.Z.; Gao, X.J. Functional analysis of FABP3 in the milk fat synthesis signaling pathway of dairy cow mammary epithelial cells. Vitr. Cell. Dev. Biol.-Anim. 2014, 50, 865–873. [Google Scholar] [CrossRef] [PubMed]
- Bionaz, M.; Loor, J.J. Gene networks driving bovine mammary protein synthesis during the lactation cycle. Bioinform. Biol. Insights 2011, 5, 83–98. [Google Scholar] [CrossRef] [PubMed]
- Seo, M.; Kim, K.; Yoon, J.; Jeong, J.Y.; Lee, H.J.; Cho, S.; Kim, H. RNA-seq analysis for detecting quantitative trait-associated genes. Sci. Rep. 2016, 6, 24375. [Google Scholar] [CrossRef] [PubMed]
- Ouattara, B.; Bissonnette, N.; Duplessis, M.; Girard, C.L. Supplements of vitamins B9 and B12 affect hepatic and mammary gland gene expression profiles in lactating dairy cows. BMC Genom. 2016, 17, 640. [Google Scholar] [CrossRef] [PubMed]
- Deng, T.; Wu, J.; Abdel-Shafy, H.; Wang, X.; Lv, H.; Shaukat, A.; Zhou, X.; Zhou, Y.; Sun, H.; Wei, P.; et al. Comparative genomic analysis of the Thiolase family and functional characterization of the acetyl-coenzyme a Acyltransferase-1 gene for Milk biosynthesis and production of Buffalo and cattle. J. Agric. Food Chem. 2023, 71, 3325–3337. [Google Scholar] [CrossRef] [PubMed]
- Ibeagha-Awemu, E.M.; Peters, S.O.; Akwanji, K.A.; Imumorin, I.G.; Zhao, X. High density genome wide genotyping-by-sequencing and association identifies common and low frequency SNPs, and novel candidate genes influencing cow milk traits. Sci. Rep. 2016, 6, 31109. [Google Scholar] [CrossRef]
- Kemper, K.; Vander Jagt, C.; Bowman, P.; Reich, C.; Mason, B.; Hayes, B.; Goddard, M. Mapping QTL in Australian dairy cattle using Genomic Selection Methodologies. In Proceedings of the 10th World Congress on Genetics Applied to Livestock Production, Vancouver, BC, Canada, 17–22 August 2014. [Google Scholar]
- Shi, L.; Lv, X.; Liu, L.; Yang, Y.; Ma, Z.; Han, B.; Sun, D. A post-GWAS confirming effects of PRKG1 gene on milk fatty acids in a Chinese Holstein dairy population. BMC Genet. 2019, 20, 53. [Google Scholar] [CrossRef]
- Van Nguyen, A.; Pollard, J.W. Colony stimulating factor-1 is required to recruit macrophages into the mammary gland to facilitate mammary ductal outgrowth. Dev. Biol. 2002, 247, 11–25. [Google Scholar] [CrossRef] [PubMed]
- Stern, D.F. ERBB3/HER3 and ERBB2/HER2 duet in mammary development and breast cancer. J. Mammary Gland Biol. Neoplasia 2008, 13, 215–223. [Google Scholar] [CrossRef] [PubMed]
- Williams, M.M.; Vaught, D.B.; Joly, M.M.; Hicks, D.J.; Sanchez, V.; Owens, P.; Rahman, B.; Elion, D.L.; Balko, J.M.; Cook, R.S. ErbB3 drives mammary epithelial survival and differentiation during pregnancy and lactation. Breast Cancer Res. 2017, 19, 105. [Google Scholar] [CrossRef] [PubMed]
- Wang, Z.; Huang, J.; Wang, C.; Liu, Y.; Li, D.; Zhong, J.; Wang, G. Relationship between erythrocyte Na+-K+-ATPase activity and heat-resistance ability in Holstein cows. China Cattle Sci. 2009, 35, 1–5. [Google Scholar]
- Hasegawa, N.; Sumitomo, A.; Fujita, A.; Aritome, N.; Mizuta, S.; Matsui, K.; Ishino, R.; Inoue, K.; Urahama, N.; Nose, J.; et al. Mediator subunits MED1 and MED24 cooperatively contribute to pubertal mammary gland development and growth of breast carcinoma cells. Mol. Cell. Biol. 2012, 32, 1483–1495. [Google Scholar] [CrossRef] [PubMed]
- Schmidtmann, C.; Schönherz, A.; Guldbrandtsen, B.; Marjanovic, J.; Calus, M.; Hinrichs, D.; Thaller, G. Assessing the genetic background and genomic relatedness of red cattle populations originating from Northern Europe. Genet. Sel. Evol. 2021, 53, 23. [Google Scholar] [CrossRef] [PubMed]
- Menzies, K.K.; Lefèvre, C.; Macmillan, K.L.; Nicholas, K.R. Insulin regulates milk protein synthesis at multiple levels in the bovine mammary gland. Funct. Integr. Genom. 2009, 9, 197–217. [Google Scholar] [CrossRef] [PubMed]
- Li, C.; Cai, W.; Zhou, C.; Yin, H.; Zhang, Z.; Loor, J.J. RNA-Seq reveals 10 novel promising candidate genes affecting milk protein concentration in the Chinese Holstein population. Sci. Rep. 2016, 6, 26813. [Google Scholar] [CrossRef] [PubMed]
- Groeneveld, L.F.; Lenstra, J.A.; Eding, H.; Toro, M.A.; Scherf, B.; Pilling, D.; Negrini, R.; Finlay, E.K.; Jianlin, H.; Groeneveld, E.J.; et al. Genetic diversity in farm animals—A review. Anim. Genet. 2010, 41, 6–31. [Google Scholar] [CrossRef]
- Epstein, H. The Origin of the Domestic Animals of Africa. 1. Cattle; Africana Publishing Corporation: New York, NY, USA, 1971; p. 573. [Google Scholar]
- Tijjani, A.; Salim, B.; da Silva, M.V.; Eltahir, H.A.; Musa, T.H.; Marshall, K.; Hanotte, O.; Musa, H.H. Genomic signatures for drylands adaptation at gene-rich regions in African zebu cattle. Genomics 2022, 114, 110423. [Google Scholar] [CrossRef]
- Oba, M. Effects of feeding sugars on productivity of lactating dairy cows. Can. J. Anim. Sci. 2011, 91, 37–46. [Google Scholar] [CrossRef]
- Hui, J.; Stangl, K.; Lane, W.S.; Bindereif, A. HnRNP L stimulates splicing of the eNOS gene by binding to variable-length CA repeats. Nat. Struct. Biology. 2003, 10, 33–37. [Google Scholar] [CrossRef] [PubMed]
- Singh, A.; Malla, W.A.; Kumar, A.; Jain, A.; Thakur, M.S.; Khare, V.; Tiwari, S.P. genetic background of milk fatty acid synthesis in bovines. Trop. Anim. Health Prod. 2023, 55, 328. [Google Scholar] [CrossRef]
- Bionaz, M.; Loor, J.J. ACSL1, AGPAT6, FABP3, LPIN1, and SLC27A6 Are the Most Abundant Isoforms in Bovine Mammary Tissue and Their Expression Is Affected by Stage of Lactation3. J. Nutr. 2008, 138, 1019–1024. [Google Scholar] [CrossRef] [PubMed]
- Kulig, H.; Kowalewska-Łuczak, I.; Kmieć, M.; Wojdak-Maksymiec, K. ANXA9, SLC27A3, FABP3 and FABP4 single nucleotide polymorphisms in relation to milk production traits in Jersey cows. Czech J. Anim. Sci. 2010, 55, 463–467. [Google Scholar] [CrossRef]
- Sato, T.N.; Tozawa, Y.; Deutsch, U.; Wolburg-Buchholz, K.; Fujiwara, Y.; Gendron-Maguire, M.; Gridley, T.; Wolburg, H.; Risau, W.; Qin, Y. Distinct roles of the receptor tyrosine kinases Tie-1 and Tie-2 in blood vessel formation. Nature 1995, 376, 70–74. [Google Scholar] [CrossRef] [PubMed]
- Kolle, G.; Georgas, K.; Holmes, G.P.; Little, M.H.; Yamada, T. CRIM1, a novel gene encoding a cysteine-rich repeat protein, is developmentally regulated and implicated in vertebrate CNS development and organogenesis. Mech. Dev. 2000, 90, 181–193. [Google Scholar] [CrossRef]
- Rezvannejad, E.; Asadollahpour Nanaei, H.; Esmailizadeh, A. Detection of candidate genes affecting milk production traits in sheep using whole-genome sequencing analysis. Vet. Med. Sci. 2022, 8, 1197–1204. [Google Scholar]
- Davis, S.R. TRIENNIAL LACTATION SYMPOSIUM/BOLFA: Mammary growth during pregnancy and lactation and its relationship with milk yield. J. Anim. Sci. 2017, 95, 5675–5688. [Google Scholar] [CrossRef]
- Wang, Y.; Li, X.; Cao, Y. Effect of the ACAA1 Gene on preadipocyte differentiation in sheep. Front. Genet. 2021, 12, 649140. [Google Scholar] [CrossRef]
- Cansever, D.; Petrova, E.; Krishnarajah, S.; Mussak, C.; Welsh, C.A.; Mildenberger, W.; Mulder, K.; Kreiner, V.; Roussel, E.; Stifter, S.A.; et al. Lactation-associated macrophages exist in murine mammary tissue and human milk. Nat. Immunol. 2023, 24, 1098–1109. [Google Scholar] [CrossRef] [PubMed]
- Jardé, T.; Lloyd-Lewis, B.; Thomas, M.; Kendrick, H.; Melchor, L.; Bougaret, L.; Watson, P.D.; Ewan, K.; Smalley, M.J.; Dale, T.C. Wnt and Neuregulin1/ErbB signalling extends 3D culture of hormone responsive mammary organoids. Nat. Commun. 2016, 7, 13207. [Google Scholar] [CrossRef] [PubMed]
- Ji, Z.; Chao, T.; Zhang, C.; Liu, Z.; Hou, L.; Wang, J.; Wang, A.; Wang, Y.; Zhou, J.; Xuan, R.; et al. Transcriptome analysis of dairy goat mammary gland tissues from different lactation stages. DNA Cell Biol. 2019, 38, 129–143. [Google Scholar] [CrossRef] [PubMed]
- Kim, U.; Kim, S.; Kim, N.; Shin, H.Y. Mammary-Enriched Transcription Factors Synergize to Activate the Wap Super-Enhancer for Mammary Gland Development. Int. J. Mol. Sci. 2022, 23, 11680. [Google Scholar] [CrossRef] [PubMed]
- Stothard, P.; Choi, J.W.; Basu, U.; Sumner-Thomson, J.M.; Meng, Y.; Liao, X.; Moore, S.S. Whole genome resequencing of black Angus and Holstein cattle for SNP and CNV discovery. BMC Genom. 2011, 12, 559. [Google Scholar] [CrossRef] [PubMed]
- Kim, J.; Hanotte, O.; Mwai, O.A.; Dessie, T.; Bashir, S.; Diallo, B.; Agaba, M.; Kim, K.; Kwak, W.; Sung, S.; et al. The genome landscape of indigenous African cattle. Genome Biol. 2017, 18, 34. [Google Scholar] [CrossRef] [PubMed] [PubMed Central]
- Ayalew, W.; Wu, X.; Tarekegn, G.M.; Sisay Tessema, T.; Naboulsi, R.; Van Damme, R.; Bongcam-Rudloff, E.; Edea, Z.; Enquahone, S.; Yan, P. Whole-Genome Resequencing Reveals Selection Signatures of Abigar Cattle for Local Adaptation. Animals 2023, 13, 3269. [Google Scholar] [CrossRef] [PubMed]
- Bolger, A.M.; Lohse, M.; Usadel, B. Trimmomatic: A flexible trimmer for Illumina sequence data. Bioinformatics 2014, 30, 2114–2120. [Google Scholar] [CrossRef] [PubMed]
- Rosen, B.D.; Bickhart, D.M.; Schnabel, R.D.; Koren, S.; Elsik, C.G.; Tseng, E.; Rowan, T.N.; Low, W.Y.; Zimin, A.; Couldrey, C.; et al. De novo assembly of the cattle reference genome with single-molecule sequencing. Gigascience 2020, 9, giaa021. [Google Scholar] [CrossRef]
- Li, H. SAMtools 1.6: A toolkit for DNA sequence analysis. Bioinformatics 2017, 34, 3313–3314. [Google Scholar] [CrossRef]
- McKenna, A.; Hanna, M.; Banks, E.; Sivachenko, A.; Cibulskis, K.; Kernytsky, A.; Garimella, K.; Altshuler, D.; Gabriel, S.; Daly, M.; et al. The Genome Analysis Toolkit: A MapReduce framework for analyzing next-generation DNA sequencing data. Genome Res. 2010, 20, 1297–1303. [Google Scholar] [CrossRef] [PubMed]
- Danecek, P.; Auton, A.; Abecasis, G.; Albers, C.A.; Banks, E.; DePristo, M.A.; Handsaker, R.E.; Lunter, G.; Marth, G.T.; Sherry, S.T.; et al. The variant call format and VCFtools. Bioinformatics 2011, 27, 2156–2158. [Google Scholar] [CrossRef] [PubMed]
- Zhang, C.; Dong, S.S.; Xu, J.Y.; He, W.M.; Yang, T.L. PopLDdecay: A fast and effective tool for linkage disequilibrium decay analysis based on variant call format files. Bioinformatics 2019, 35, 1786–1788. [Google Scholar] [CrossRef] [PubMed]
- Chen, J.; Wang, Y.; Qi, X.; Cheng, H.; Chen, N.; Ahmed, Z.; Chen, Q.; Lei, C.; Yang, X. Genome-wide analysis emancipates genomic diversity and signature of selection in Altay white-headed cattle of Xinjiang, China. Front. Genet. 2023, 14, 1144249. [Google Scholar] [CrossRef] [PubMed]
- Purcell, S.; Neale, B.; Todd-Brown, K.; Thomas, L.; Ferreira, M.A.; Bender, D.; Maller, J.; Sklar, P.; De Bakker, P.I.; Daly, M.J.; et al. PLINK: A tool set for whole-genome association and population-based linkage analyses. Am. J. Hum. Genet. 2007, 81, 559–575. [Google Scholar] [CrossRef] [PubMed]
- Francis, R.M. Pophelper: An R package and web app to analyze and visualize population structure. Mol. Ecol. Resour. 2017, 17, 27–32. [Google Scholar] [CrossRef] [PubMed]
- Alexander, D.H.; Lange, K. Enhancements to the ADMIXTURE algorithm for individual ancestry estimation. BMC Bioinform. 2011, 12, 246. [Google Scholar] [CrossRef] [PubMed]
- Letunic, I.; Bork, P. Interactive Tree of Life (iTOL) v5: An online tool for phylogenetic tree display and annotation. Nucleic Acids Res. 2021, 49, W293–W296. [Google Scholar] [CrossRef] [PubMed]
- Weir, B.S.; Cockerham, C.C. Estimating F-Statistics for the Analysis of Population Structure. Evolution 1984, 38, 1358. [Google Scholar] [CrossRef]
- Kinsella, R.J.; Kähäri, A.; Haider, S.; Zamora, J.; Proctor, G.; Spudich, G.; Almeida-King, J.; Staines, D.; Derwent, P.; Kerhornou, A.; et al. Ensembl BioMarts: A hub for data retrieval across taxonomic space. Database 2011, 2011, bar030. [Google Scholar] [CrossRef]
- Huang, D.W.; Sherman, B.T.; Lempicki, R.A. Systematic and integrative analysis of large gene lists using DAVID bioinformatics resources. Nat. Protoc. 2009, 4, 44–57. [Google Scholar] [CrossRef] [PubMed]

Disclaimer/Publisher’s Note: The statements, opinions and data contained in all publications are solely those of the individual author(s) and contributor(s) and not of MDPI and/or the editor(s). MDPI and/or the editor(s) disclaim responsibility for any injury to people or property resulting from any ideas, methods, instructions or products referred to in the content. |
© 2024 by the authors. Licensee MDPI, Basel, Switzerland. This article is an open access article distributed under the terms and conditions of the Creative Commons Attribution (CC BY) license (https://creativecommons.org/licenses/by/4.0/).