
Rational Approach toward COVID-19’s Main Protease Inhibitors: A Hierarchical Biochemoinformatics Analysis


 , , ,
, , ,  ,
,  and
and 
Abstract
:1. Introduction
2. Results and Discussion
2.1. Prediction of Pharmacokinetic Properties
2.2. Toxicity Risk Analysis
2.3. Biological Target Prediction
2.4. Molecular Docking Study
2.5. Structural Dissimilarity Study Using the Tanimoto Index
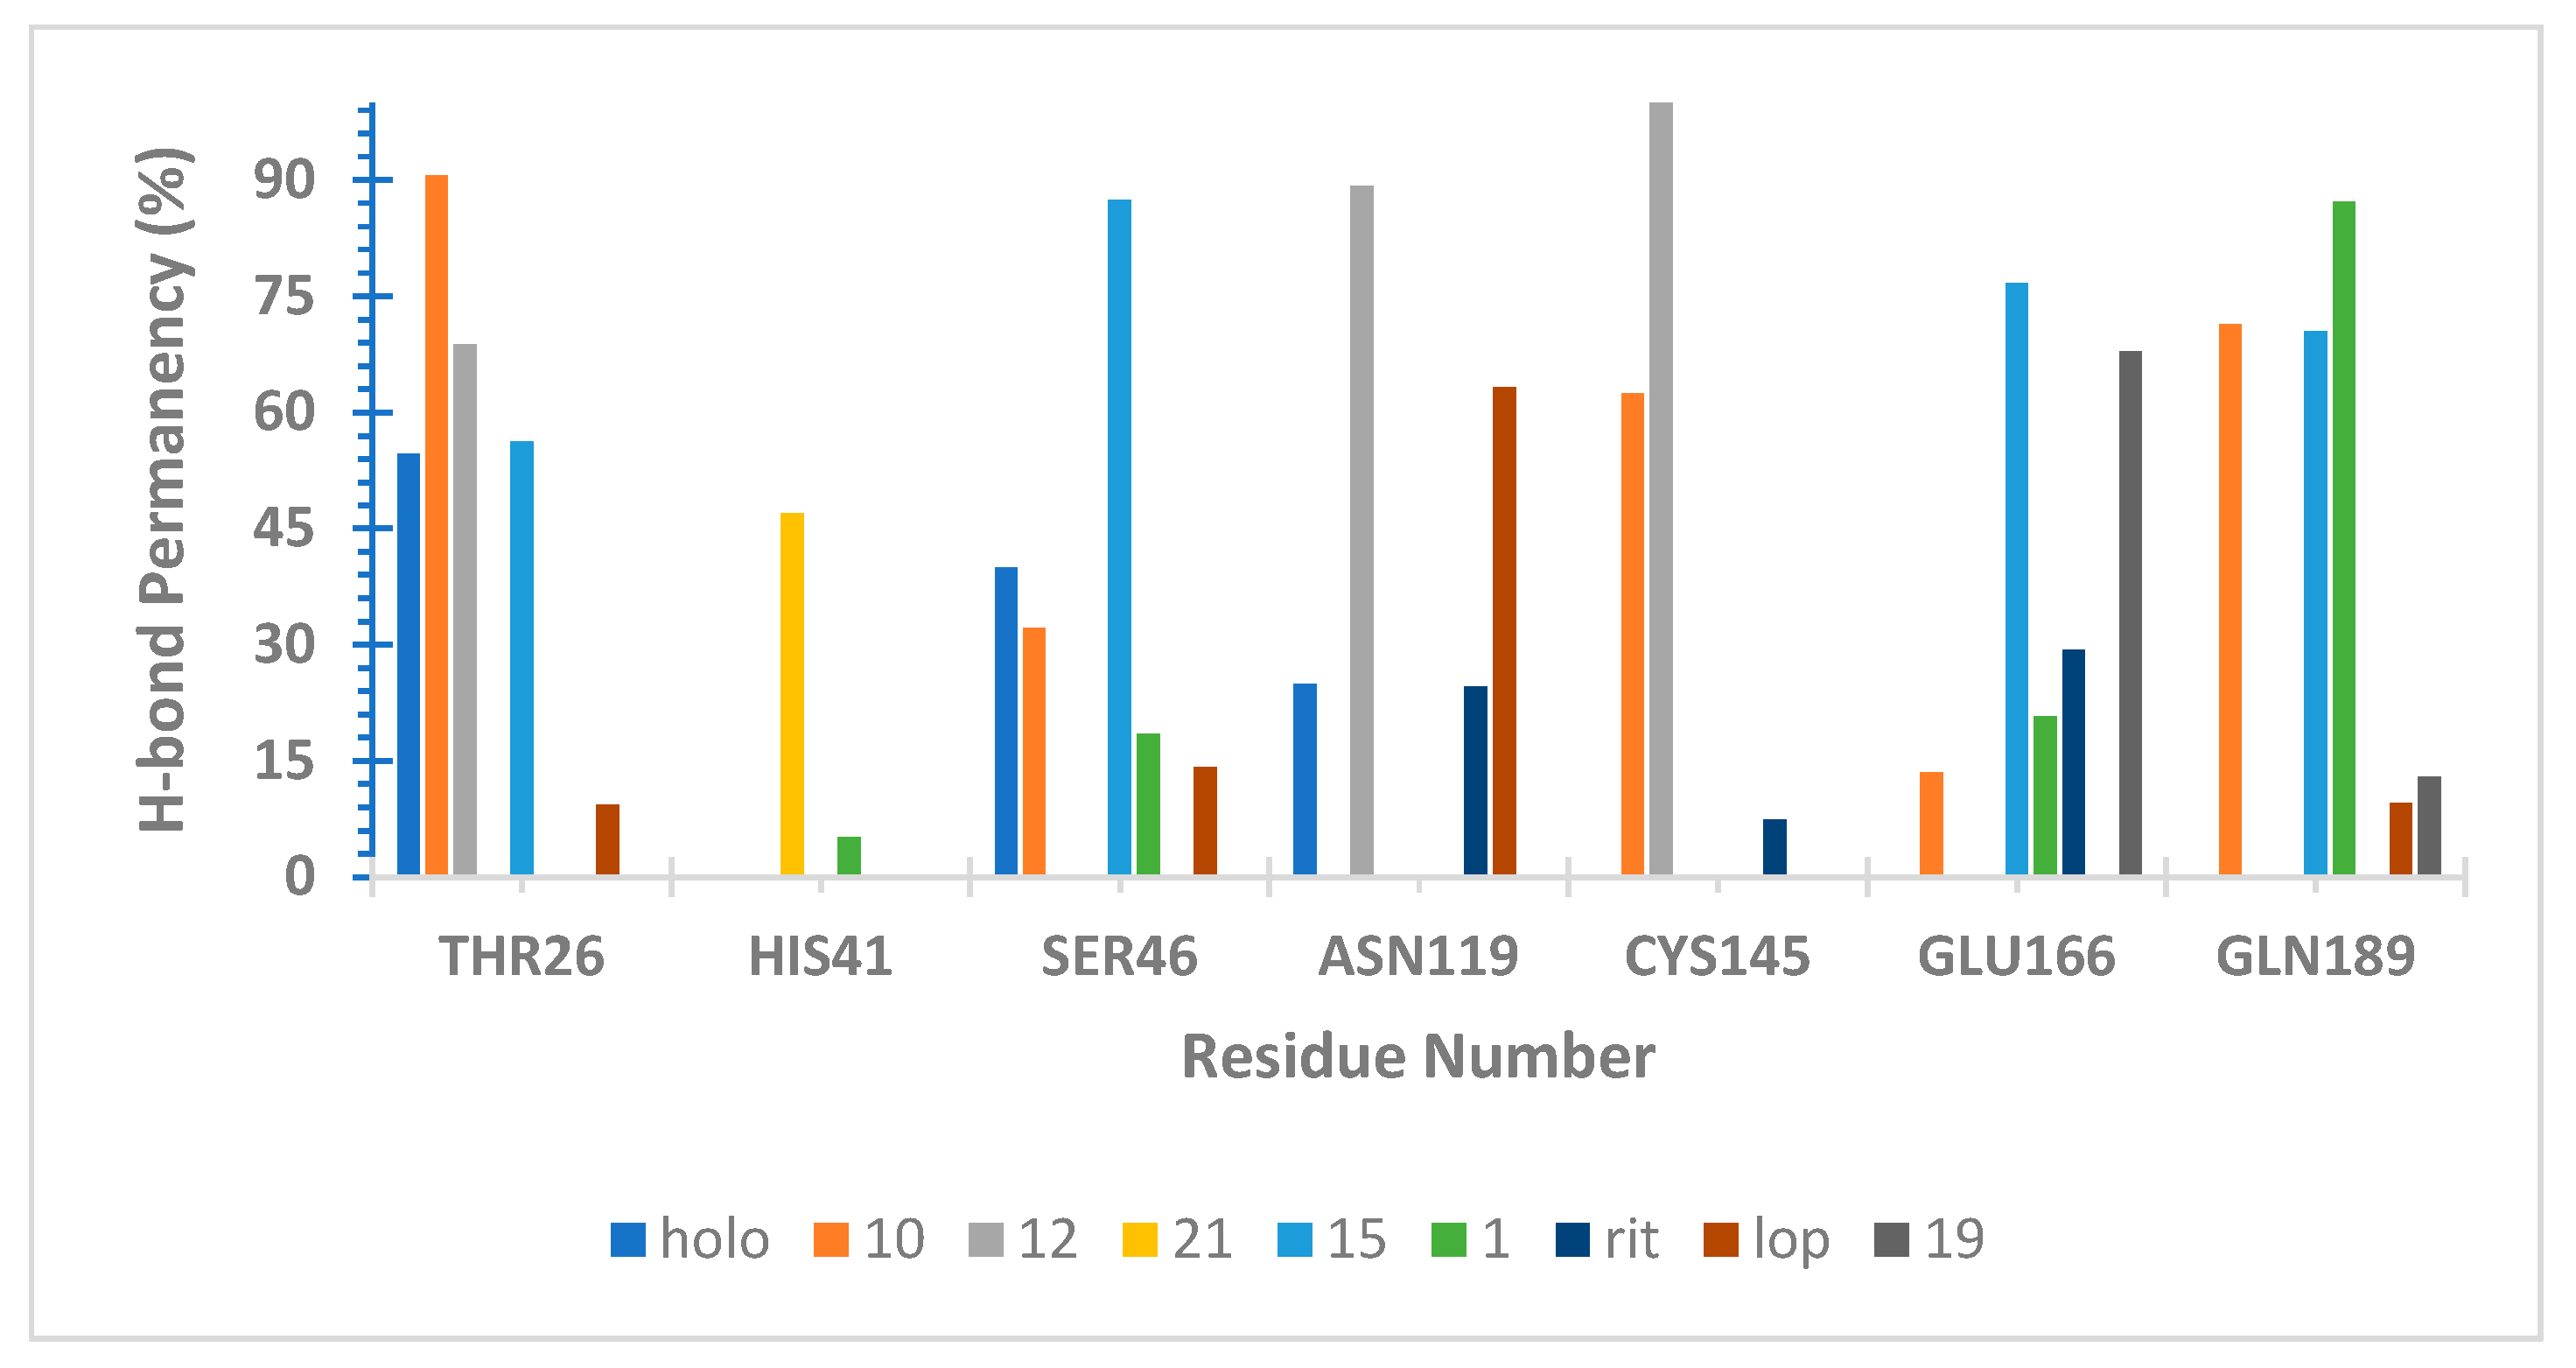
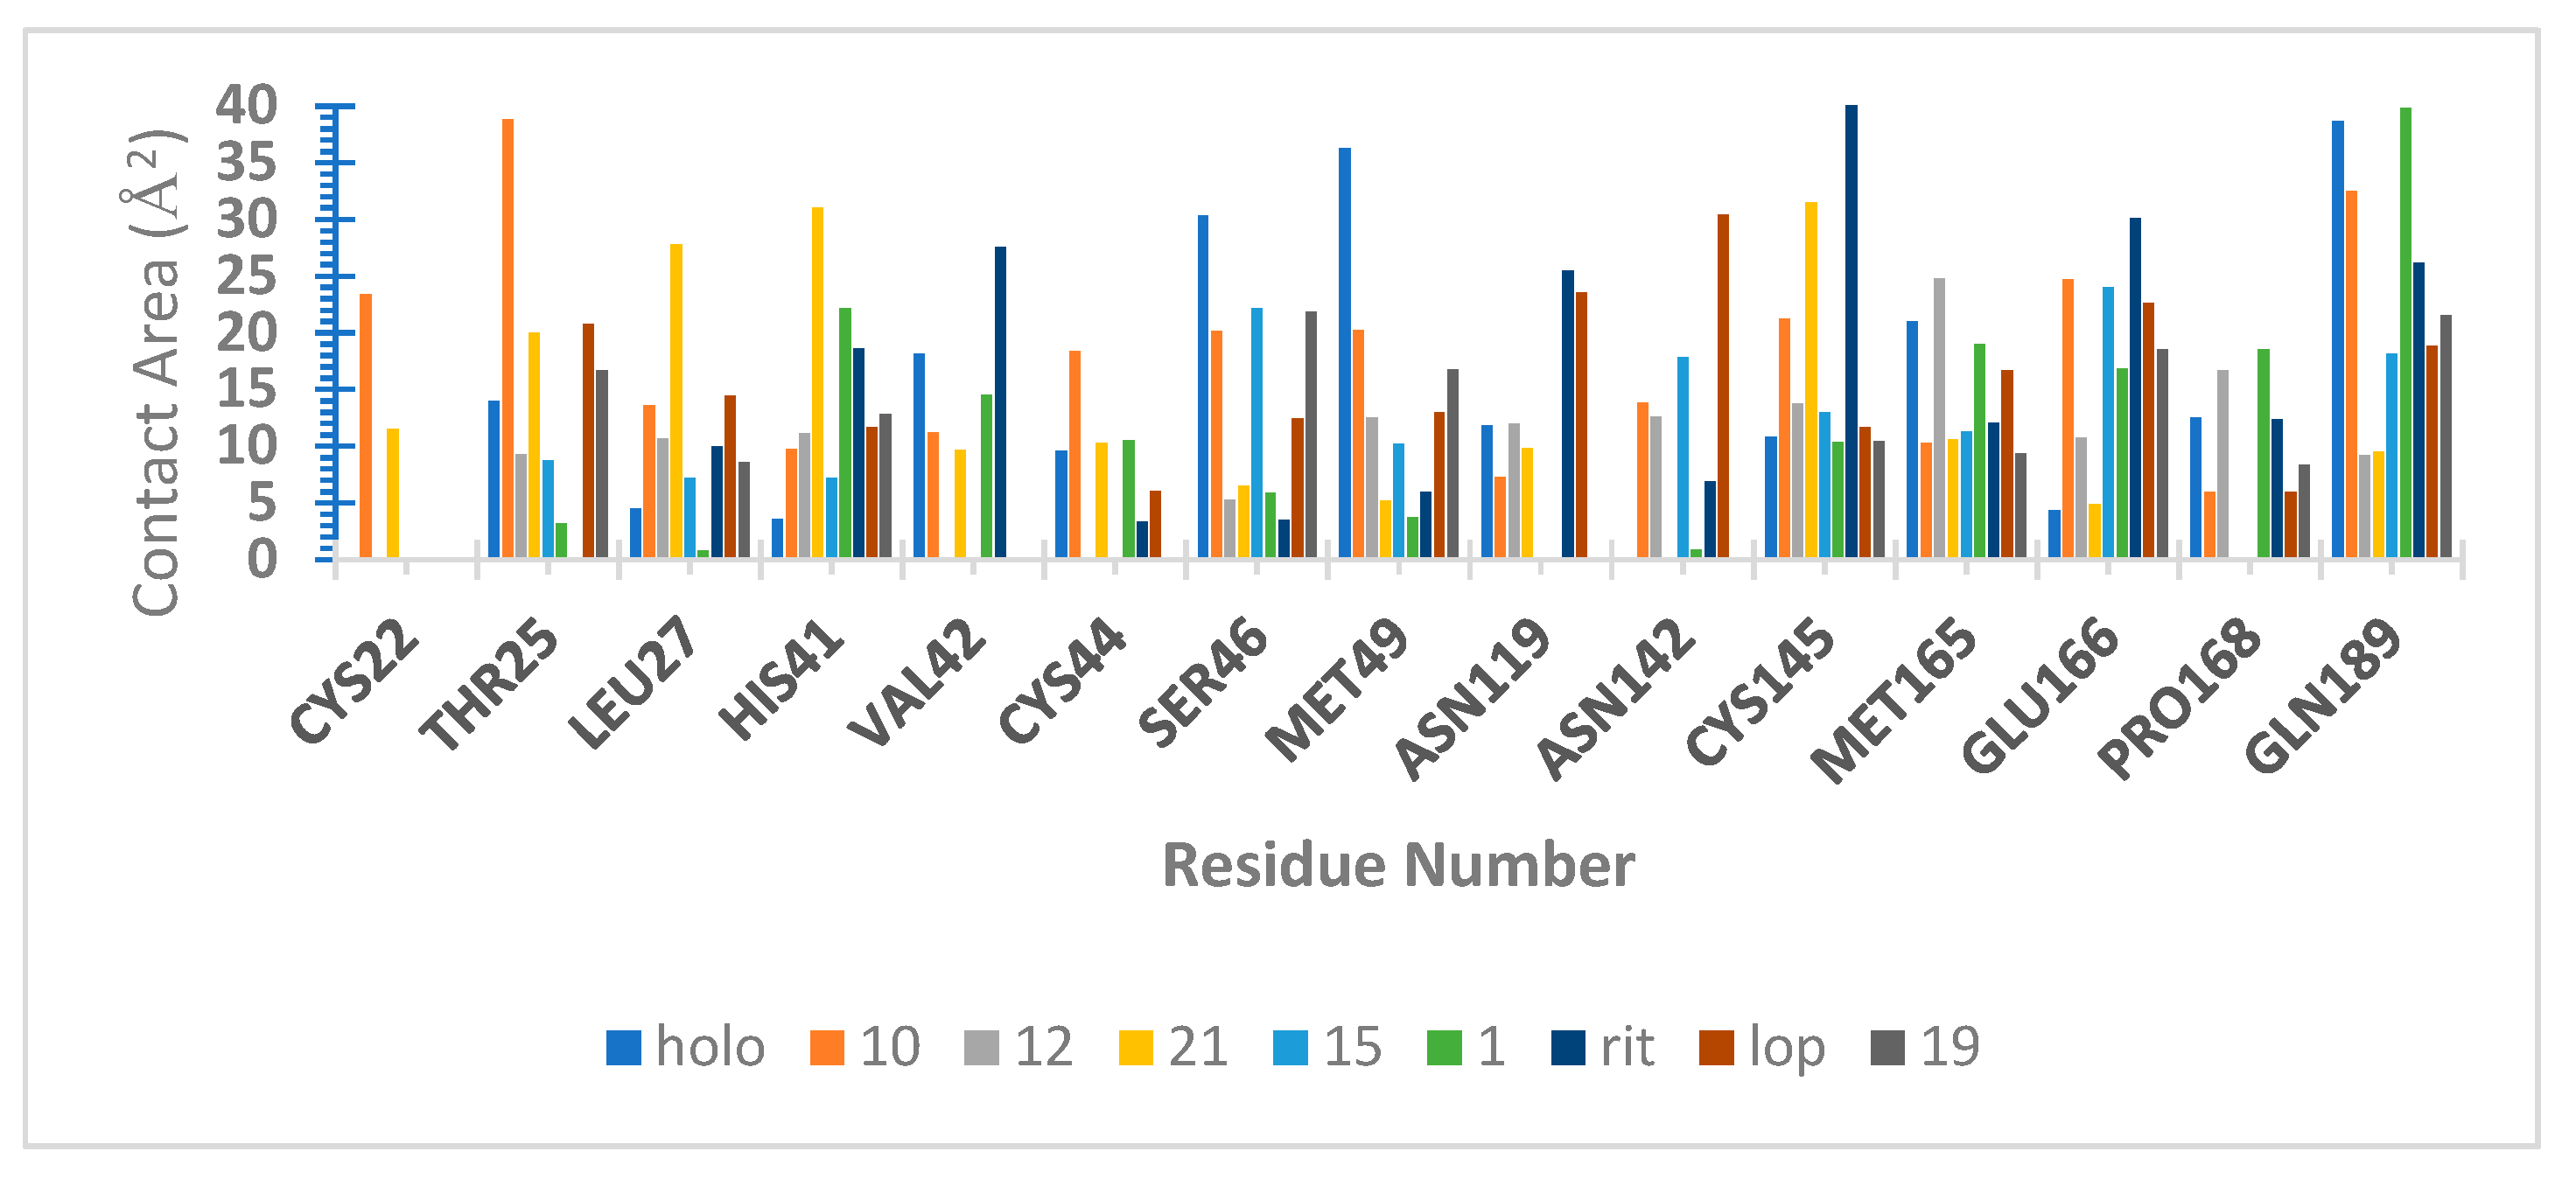
2.6. Molecular Dynamics (MD) Simulations
3. Materials and Methods
3.1. Selection of Compounds
3.2. Pharmacokinetic Properties Prediction
3.3. Toxicological Properties Prediction
3.4. Biological Target Prediction
3.5. Molecular Docking Study
3.6. Structural Dissimilarity Study Using the Tanimoto Index
3.7. Molecular Dynamics (MD) Simulation on SARS-CoV-2 Mpro
3.8. MMPBSA Calculations
3.9. Hydrogen Bond Capacity Analysis
4. Conclusions
Supplementary Materials
Author Contributions
Funding
Institutional Review Board Statement
Informed Consent Statement
Data Availability Statement
Conflicts of Interest
References
- Huynh, T.; Wang, H.; Luan, B. In Silico Exploration of the Molecular Mechanism of Clinically Oriented Drugs for Possibly Inhibiting SARS-CoV-2′s Main Protease. J. Phys. Chem. Lett. 2020, 11, 4413–4420. [Google Scholar] [CrossRef] [PubMed]
- World Health Organization. COVID-19 Epidemiological Update; World Health Organization: Geneva, Switzerland, 2024. [Google Scholar]
- Shamsi, A.; Mohammad, T.; Anwar, S.; AlAjmi, M.F.; Hussain, A.; Rehman, M.T.; Islam, A.; Hassan, M.I. Glecaprevir and Maraviroc Are High-Affinity Inhibitors of SARS-CoV-2 Main Protease: Possible Implication in COVID-19 Therapy. Biosci. Rep. 2020, 40, BSR20201256. [Google Scholar] [CrossRef]
- Ma, C.; Sacco, M.D.; Hurst, B.; Townsend, J.A.; Hu, Y.; Szeto, T.; Zhang, X.; Tarbet, B.; Marty, M.T.; Chen, Y.; et al. Boceprevir, GC-376, and Calpain Inhibitors II, XII Inhibit SARS-CoV-2 Viral Replication by Targeting the Viral Main Protease. Cell Res. 2020, 30, 678–692. [Google Scholar] [CrossRef]
- Liang, J.; Pitsillou, E.; Karagiannis, C.; Darmawan, K.K.; Ng, K.; Hung, A.; Karagiannis, T.C. Interaction of the Prototypical α-Ketoamide Inhibitor with the SARS-CoV-2 Main Protease Active Site in Silico: Molecular Dynamic Simulations Highlight the Stability of the Ligand-Protein Complex. Comput. Biol. Chem. 2020, 87, 107292. [Google Scholar] [CrossRef] [PubMed]
- Nagtode, V.S.; Cardoza, C.; Yasin, H.K.A.; Mali, S.N.; Tambe, S.M.; Roy, P.; Singh, K.; Goel, A.; Amin, P.D.; Thorat, B.R.; et al. Green Surfactants (Biosurfactants): A Petroleum-Free Substitute for Sustainability—Comparison, Applications, Market, and Future Prospects. ACS Omega 2023, 8, 11674–11699. [Google Scholar] [CrossRef] [PubMed]
- Ferreira, E.F.B.; Silva, L.B.; Costa, G.V.; Costa, J.S.; Fujishima, M.A.T.; Leão, R.P.; Ferreira, A.L.S.; Federico, L.B.; Silva, C.H.T.P.; Rosa, J.M.C.; et al. Identification of New Inhibitors with Potential Antitumor Activity from Polypeptide Structures via Hierarchical Virtual Screening. Molecules 2019, 24, 2943. [Google Scholar] [CrossRef] [PubMed]
- Pant, S.; Singh, M.; Ravichandiran, V.; Murty, U.S.N.; Srivastava, H.K. Peptide-like and Small-Molecule Inhibitors against COVID-19. J. Biomol. Struct. Dyn. 2021, 39, 2904–2913. [Google Scholar] [CrossRef] [PubMed]
- Shahane, K.; Kshirsagar, M.; Tambe, S.; Jain, D.; Rout, S.; Ferreira, M.K.M.; Mali, S.; Amin, P.; Srivastav, P.P.; Cruz, J.; et al. An Updated Review on the Multifaceted Therapeutic Potential of Calendula officinalis L. Pharmaceuticals 2023, 16, 611. [Google Scholar] [CrossRef] [PubMed]
- Cava, C.; Bertoli, G.; Castiglioni, I. In Silico Discovery of Candidate Drugs against COVID-19. Viruses 2020, 12, 404. [Google Scholar] [CrossRef]
- Bastos, R.S.; de Lima, L.R.; Neto, M.F.A.; Maryam; Yousaf, N.; Cruz, J.N.; Campos, J.M.; Kimani, N.M.; Ramos, R.S.; Santos, C.B.R. Design and Identification of Inhibitors for the Spike-ACE2 Target of SARS-CoV-2. Int. J. Mol. Sci. 2023, 24, 8814. [Google Scholar] [CrossRef]
- Silva, R.C.; Freitas, H.F.; Campos, J.M.; Kimani, N.M.; Silva, C.H.T.P.; Borges, R.S.; Pita, S.S.R.; Santos, C.B.R. Natural Products-Based Drug Design against SARS-CoV-2 Mpro 3CLpro. Int. J. Mol. Sci. 2021, 22, 11739. [Google Scholar] [CrossRef] [PubMed]
- Shin, H.K.; Kang, Y.-M.; No, K.T. Predicting ADME Properties of Chemicals. In Handbook of Computational Chemistry; Springer International Publishing: Cham, Switzerland, 2017; pp. 2265–2301. [Google Scholar]
- Raies, A.B.; Bajic, V.B. In Silico Toxicology: Computational Methods for the Prediction of Chemical Toxicity. WIREs Comput. Mol. Sci. 2016, 6, 147–172. [Google Scholar] [CrossRef] [PubMed]
- Zhang, L.; Ai, H.; Chen, W.; Yin, Z.; Hu, H.; Zhu, J.; Zhao, J.; Zhao, Q.; Liu, H. CarcinoPred-EL: Novel Models for Predicting the Carcinogenicity of Chemicals Using Molecular Fingerprints and Ensemble Learning Methods. Sci. Rep. 2017, 7, 2118. [Google Scholar] [CrossRef] [PubMed]
- Szikriszt, B.; Póti, Á.; Pipek, O.; Krzystanek, M.; Kanu, N.; Molnár, J.; Ribli, D.; Szeltner, Z.; Tusnády, G.E.; Csabai, I.; et al. A Comprehensive Survey of the Mutagenic Impact of Common Cancer Cytotoxics. Genome Biol. 2016, 17, 99. [Google Scholar] [CrossRef] [PubMed]
- Jain, A.K.; Singh, D.; Dubey, K.; Maurya, R.; Mittal, S.; Pandey, A.K. Models and Methods for In Vitro Toxicity. In In Vitro Toxicology; Elsevier: Amsterdam, The Netherlands, 2018; pp. 45–65. [Google Scholar]
- Al-Afifi, N.A.; Alabsi, A.M.; Bakri, M.M.; Ramanathan, A. Acute and Sub-Acute Oral Toxicity of Dracaena Cinnabari Resin Methanol Extract in Rats. BMC Complement. Altern. Med. 2018, 18, 50. [Google Scholar] [CrossRef] [PubMed]
- Occupational Safety and Health Administration (OSHA). Hazard Classification Guidance for Manufacturers, Importers, and Employers; U.S. Department of Labor: Washington, DC, USA, 2016; Volume 3844, p. 34.
- Pires, D.E.V.; Kaminskas, L.M.; Ascher, D.B. Prediction and Optimization of Pharmacokinetic and Toxicity Properties of the Ligand. In Computational Drug Discovery and Design; Springer: Berlin/Heidelberg, Germany, 2018; pp. 271–284. [Google Scholar]
- Hoffmann, M.; Kleine-Weber, H.; Schroeder, S.; Krüger, N.; Herrler, T.; Erichsen, S.; Schiergens, T.S.; Herrler, G.; Wu, N.-H.; Nitsche, A.; et al. SARS-CoV-2 Cell Entry Depends on ACE2 and TMPRSS2 and Is Blocked by a Clinically Proven Protease Inhibitor. Cell 2020, 181, 271–280.e8. [Google Scholar] [CrossRef] [PubMed]
- Anand, K.; Ziebuhr, J.; Wadhwani, P.; Mesters, J.R.; Hilgenfeld, R. Coronavirus Main Proteinase (3CL pro) Structure: Basis for Design of Anti-SARS Drugs. Science 2003, 300, 1763–1767. [Google Scholar] [CrossRef]
- Khan, S.A.; Zia, K.; Ashraf, S.; Uddin, R.; Ul-Haq, Z. Identification of Chymotrypsin-like Protease Inhibitors of SARS-CoV-2 via Integrated Computational Approach. J. Biomol. Struct. Dyn. 2021, 39, 2607–2616. [Google Scholar] [CrossRef]
- Kaptan, S.; Girych, M.; Enkavi, G.; Kulig, W.; Sharma, V.; Vuorio, J.; Rog, T.; Vattulainen, I. Maturation of the SARS-CoV-2 Virus Is Regulated by Dimerization of Its Main Protease. Comput. Struct. Biotechnol. J. 2022, 20, 3336–3346. [Google Scholar] [CrossRef]
- Aggarwal, R.; Koes, D.R. Learning RMSD to Improve Protein-Ligand Scoring and Pose Selection. Theor. Comput. Chem. 2020. [Google Scholar] [CrossRef]
- Schmid, N.; Eichenberger, A.P.; Choutko, A.; Riniker, S.; Winger, M.; Mark, A.E.; Van Gunsteren, W.F. Definition and testing of the GROMOS force-field versions 54A7 and 54B7. Eur. Biophys. J. 2011, 40, 843–856. [Google Scholar] [CrossRef] [PubMed]
- Biovia, D.S. Discovery Studio Visualization Environment, Release 2017, San Diego: Dassault Systèmes. 2016. Available online: https://discover.3ds.com/discovery-studio-visualizer-download (accessed on 4 May 2023).
- Padilha, E.C.; Serafim, R.B.; Sarmiento, D.Y.R.; Santos, C.F.; Santos, C.B.R.; Silva, C.H.T.P. New PPARα/γ/δ Optimal Activator Rationally Designed by Computational Methods. J. Braz. Chem. Soc. 2016, 27, 1636–1647. [Google Scholar] [CrossRef]
- Dai, W.; Zhang, B.; Jiang, X.-M.; Su, H.; Li, J.; Zhao, Y.; Xie, X.; Jin, Z.; Peng, J.; Liu, F.; et al. Structure-Based Design of Antiviral Drug Candidates Targeting the SARS-CoV-2 Main Protease. Science 2020, 368, 1331–1335. [Google Scholar] [CrossRef] [PubMed]
- Berendsen, H.J.C.; van der Spoel, D.; van Drunen, R. GROMACS: A Message-Passing Parallel Molecular Dynamics Implementation. Comput. Phys. Commun. 1995, 91, 43–56. [Google Scholar] [CrossRef]
- Lindahl, E.; Hess, B.; van der Spoel, D. GROMACS 3.0: A Package for Molecular Simulation and Trajectory Analysis. J. Mol. Model. 2001, 7, 306–317. [Google Scholar] [CrossRef]
- Pronk, S.; Páll, S.; Schulz, R.; Larsson, P.; Bjelkmar, P.; Apostolov, R.; Shirts, M.R.; Smith, J.C.; Kasson, P.M.; van der Spoel, D.; et al. GROMACS 4.5: A High-Throughput and Highly Parallel Open Source Molecular Simulation Toolkit. Bioinformatics 2013, 29, 845–854. [Google Scholar] [CrossRef] [PubMed]
- Van Der Spoel, D.; Lindahl, E.; Hess, B.; Groenhof, G.; Mark, A.E.; Berendsen, H.J.C. GROMACS: Fast, Flexible, and Free. J. Comput. Chem. 2005, 26, 1701–1718. [Google Scholar] [CrossRef] [PubMed]
- Van der Spoel, D.; van Maaren, P.J.; Larsson, P.; Tîmneanu, N. Thermodynamics of Hydrogen Bonding in Hydrophilic and Hydrophobic Media. J. Phys. Chem. B 2006, 110, 4393–4398. [Google Scholar] [CrossRef]
- Abraham, M.J.; Murtola, T.; Schulz, R.; Páll, S.; Smith, J.C.; Hess, B.; Lindahl, E. GROMACS: High Performance Molecular Simulations through Multi-Level Parallelism from Laptops to Supercomputers. SoftwareX 2015, 1–2, 19–25. [Google Scholar] [CrossRef]
- Kabsch, W.; Sander, C. Dictionary of Protein Secondary Structure: Pattern Recognition of Hydrogen-bonded and Geometrical Features. Biopolymers 1983, 22, 2577–2637. [Google Scholar] [CrossRef]
- Sander, C.; Schneider, R. Database of Homology-derived Protein Structures and the Structural Meaning of Sequence Alignment. Proteins Struct. Funct. Bioinform. 1991, 9, 56–68. [Google Scholar] [CrossRef] [PubMed]
- Touw, W.G.; Baakman, C.; Black, J.; te Beek, T.A.H.; Krieger, E.; Joosten, R.P.; Vriend, G. A Series of PDB-Related Databanks for Everyday Needs. Nucleic Acids Res. 2015, 43, D364–D368. [Google Scholar] [CrossRef] [PubMed]
- Zhang, L.; Lin, D.; Sun, X.; Curth, U.; Drosten, C.; Sauerhering, L.; Becker, S.; Rox, K.; Hilgenfeld, R. Crystal Structure of SARS-CoV-2 Main Protease Provides a Basis for Design of Improved α-Ketoamide Inhibitors. Science 2020, 368, 409–412. [Google Scholar] [CrossRef] [PubMed]
- The PyMOL Molecular Graphics System, Version 3.0; Schrödinger, LLC: New York, NY, USA, 2013.
- Jin, Z.; Du, X.; Xu, Y.; Deng, Y.; Liu, M.; Zhao, Y.; Zhang, B.; Li, X.; Zhang, L.; Peng, C.; et al. Structure of Mpro from SARS-CoV-2 and Discovery of Its Inhibitors. Nature 2020, 582, 289–293. [Google Scholar] [CrossRef] [PubMed]
- Ziebuhr, J. Molecular Biology of Severe Acute Respiratory Syndrome Coronavirus. Curr. Opin. Microbiol. 2004, 7, 412–419. [Google Scholar] [CrossRef] [PubMed]
- Ghuman, J.; Zunszain, P.A.; Petitpas, I.; Bhattacharya, A.A.; Otagiri, M.; Curry, S. Structural Basis of the Drug-Binding Specificity of Human Serum Albumin. J. Mol. Biol. 2005, 353, 38–52. [Google Scholar] [CrossRef] [PubMed]
- Gomes, D.E.B.; Sousa, G.L.S.C.; Silva, A.W.S.D.; Pascutti, P.G. SurfinMD 2012. 2012. Available online: http://lmdm.biof.ufrj.br/software/surfinmd/index.html (accessed on 4 May 2023).
- Gomes, D.E.B.; Silva, A.W.; Lins, R.D.; Pascutti, P.G.; Soares, T.A. HbMap2Grace 2002. 2002. Available online: http://lmdm.biof.ufrj.br/software/hbmap2grace/index.html (accessed on 4 May 2023).
- Rosa, S.G.V.; Santos, W.C. Clinical Trials on Drug Repositioning for COVID-19 Treatment. Rev. Panam. Salud Pública 2020, 44, 1. [Google Scholar] [CrossRef] [PubMed]
- Dattoli, S.D.; De Marco, R.; Baiula, M.; Spampinato, S.; Greco, A.; Tolomelli, A.; Gentilucci, L. Synthesis and Assay of Retro-A4β1 Integrin-Targeting Motifs. Eur. J. Med. Chem. 2014, 73, 225–232. [Google Scholar] [CrossRef] [PubMed]
- Liu, R.; Peng, L.; Han, H.; Lam, K.S. Structure–Activity Relationship Studies of a Series of Peptidomimetic Ligands for α 4 β 1 Integrin on Jurkat T-leukemia Cells. Pept. Sci. 2006, 84, 595–604. [Google Scholar] [CrossRef]
- Aykul, S.; Martinez-Hackert, E. Determination of Half-Maximal Inhibitory Concentration Using Biosensor-Based Protein Interaction Analysis. Anal. Biochem. 2016, 508, 97–103. [Google Scholar] [CrossRef]
- Lim, J.; Jeon, S.; Shin, H.-Y.; Kim, M.J.; Seong, Y.M.; Lee, W.J.; Choe, K.-W.; Kang, Y.M.; Lee, B.; Park, S.-J. Case of the Index Patient Who Caused Tertiary Transmission of Coronavirus Disease 2019 in Korea: The Application of Lopinavir/Ritonavir for the Treatment of COVID-19 Pneumonia Monitored by Quantitative RT-PCR. J. Korean Med. Sci. 2020, 35, e79. [Google Scholar] [CrossRef] [PubMed]
- Sanders, J.M.; Monogue, M.L.; Jodlowski, T.Z.; Cutrell, J.B. Pharmacologic Treatments for Coronavirus Disease 2019 (COVID-19). JAMA 2020, 323, 1824–1836. [Google Scholar] [CrossRef]
- O’Boyle, N.M.; Banck, M.; James, C.A.; Morley, C.; Vandermeersch, T.; Hutchison, G.R. Open Babel: An Open Chemical Toolbox. J. Cheminform. 2011, 3, 33. [Google Scholar] [CrossRef]
- Laxmi, D.; Priyadarshy, S. HyperChem 6.03. Biotech Softw. Internet Rep. 2002, 3, 5–9. [Google Scholar] [CrossRef]
- Dos Santos, K.L.B.; Cruz, J.N.; Silva, L.B.; Ramos, R.S.; Neto, M.F.A.; Lobato, C.C.; Ota, S.S.B.; Leite, F.H.A.; Borges, R.S.; da Silva, C.H.T.P.; et al. Identification of Novel Chemical Entities for Adenosine Receptor Type 2a Using Molecular Modeling Approaches. Molecules 2020, 25, 1245. [Google Scholar] [CrossRef] [PubMed]
- Da Silva Costa, J.; da Silva Lopes Costa, K.; Cruz, J.V.; da Silva Ramos, R.; Silva, L.B.; Do Socorro Barros Brasil, D.; de Paula da Silva, C.H.T.; dos Santos, C.B.R.; da Cruz Macedo, W.J. Virtual Screening and Statistical Analysis in the Design of New Caffeine Analogues Molecules with Potential Epithelial Anticancer Activity. Curr. Pharm. Des. 2018, 24, 576–594. [Google Scholar] [CrossRef] [PubMed]
- Ekins, S. (Ed.) Computational Toxicology; Wiley: Hoboken, NJ, USA, 2007; ISBN 9780470049624. [Google Scholar]
- ACD/Chemsketch, Freeware 2010, Advanced Chemistry Development, Inc. (ACD/Labs), Toronto, ON, Canada. Available online: www.acdlabs.com (accessed on 4 May 2023).
- Cheng, F.; Li, W.; Zhou, Y.; Shen, J.; Wu, Z.; Liu, G.; Lee, P.W.; Tang, Y. AdmetSAR: A Comprehensive Source and Free Tool for Assessment of Chemical ADMET Properties. J. Chem. Inf. Model. 2012, 52, 3099–3105. [Google Scholar] [CrossRef]
- Kumari, R.; Kumar, R.; Open Source Drug Discovery Consortium; Lynn, A. g_mmpbsa—A GROMACS tool for high-throughput MM-PBSA calculations. J. Chem. Inf. Model. 2014, 54, 1951–1962. [Google Scholar] [CrossRef]
- Morris, G.M.; Huey, R.; Lindstrom, W.; Sanner, M.F.; Belew, R.K.; Goodsell, D.S.; Olson, A.J. AutoDock4 and AutoDockTools4: Automated Docking with Selective Receptor Flexibility. J. Comput. Chem. 2009, 30, 2785–2791. [Google Scholar] [CrossRef]
- Dallakyan, S.; Olson, A.J. Small-Molecule Library Screening by Docking with PyRx. In Chemical Biology: Methods and Protocols; Springer: Berlin/Heidelberg, Germany, 2015; pp. 243–250. [Google Scholar]
- Baker, N.A.; Sept, D.; Joseph, S.; Holst, M.J.; McCammon, J.A. Electrostatics of nanosystems: Application to microtubules and the ribosome. Proc. Natl. Acad. Sci. USA 2001, 98, 10037–10041. [Google Scholar] [CrossRef]
- De Almeida, R.B.M.; Barbosa, D.B.; do Bomfim, M.R.; Amparo, J.A.O.; Andrade, B.S.; Costa, S.L.; Campos, J.M.; Cruz, J.N.; Santos, C.B.R.; Leite, F.H.A.; et al. Identification of a Novel Dual Inhibitor of Acetylcholinesterase and Butyrylcholinesterase: In Vitro and In Silico Studies. Pharmaceuticals 2023, 16, 95. [Google Scholar] [CrossRef]
- Darden, T.; York, D.; Pedersen, L. Particle mesh Ewald: An N⋅log(N) method for Ewald sums in large systems. J. Chem. Phys. 1993, 98, 10089–10092. [Google Scholar] [CrossRef]
- Stierand, K.; Rarey, M. PoseView—Molecular Interaction Patterns at a Glance. J. Cheminform. 2010, 2, P50. [Google Scholar] [CrossRef]
- Backman, T.W.H.; Cao, Y.; Girke, T. ChemMine Tools: An Online Service for Analyzing and Clustering Small Molecules. Nucleic Acids Res. 2011, 39, W486–W491. [Google Scholar] [CrossRef]
- Silva, L.B.; Ferreira, E.F.B.; Maryam; Espejo-Román, J.M.; Costa, G.V.; Cruz, J.V.; Kimani, N.M.; Costa, J.S.; Bittencourt, J.A.H.M.; Cruz, J.N.; et al. Galantamine Based Novel Acetylcholinesterase Enzyme Inhibitors: A Molecular Modeling Design Approach. Molecules 2023, 28, 1035. [Google Scholar] [CrossRef] [PubMed]
- Santos, C.B.R.; Cruz, J.N.; Federico, L.B.; Mali, S.N.; Kimani, N.M.; Lobato, C.C.; Silva, R.C.; Bittencourt, J.A.H.M.; Bastos, R.S.; da Costa, R.A.; et al. Structure-Based Drug Design for Protein Arginine Deiminase Type IV (PAD4) Receptor: Chemoinformatics Approach. Chem. Phys. Impact 2024, 8, 100464. [Google Scholar] [CrossRef]
- Berendsen, H.J.C.; Grigera, J.R.; Straatsma, T.P. The missing term in effective pair potentials. J. Phys. Chem. 1987, 91, 6269–6271. [Google Scholar] [CrossRef]
- Wriggers, W.; Mehler, E.; Pitici, F.; Weinstein, H.; Schulten, K. Structure and dynamics of calmodulin in solution. Biophys. J. 1998, 74, 1622–1639. [Google Scholar] [CrossRef] [PubMed]
- Silva de Souza, A.; Rivera, J.D.; Almeida, V.M.; Ge, P.; de Souza, R.F.; Farah, C.S.; Ulrich, H.; Marana, S.R.; Salinas, R.K.; Guzzo, C.R. Molecular dynamics reveals complex compensatory effects of ionic strength on the severe acute respiratory syndrome coronavirus 2 spike/human angiotensin-converting enzyme 2 interaction. J. Phys. Chem. Lett. 2020, 11, 10446–10453. [Google Scholar] [CrossRef]
- Bussi, G.; Donadio, D.; Parrinello, M. Canonical sampling through velocity rescaling. J. Chem. Phys. 2007, 126, 014101. [Google Scholar] [CrossRef]
- Berendsen, H.J.C.; Postma, J.P.M.; van Gunsteren, W.F.; Hermans, J. Intermolecular Forces, Chapter Interaction Models for Water in Relation to Protein Hydration; D. Reidel Publishing Company Dordrecht: Dordrecht, The Netherlands, 1981; pp. 331–342. [Google Scholar]
- Yang, H.; Xie, W.; Xue, X.; Yang, K.; Ma, J.; Liang, W.; Zhao, Q.; Zhou, Z.; Pei, D.; Ziebuhr, J.; et al. Design of Wide-Spectrum Inhibitors Targeting Coronavirus Main Proteases. PLoS Biol. 2005, 3, e324. [Google Scholar] [CrossRef] [PubMed]
- Olsson, M.H.M.; Sondergaard, C.R.; Rostkowski, M.; Jensen, J.H. PROPKA3: Consistent treatment of internal and surface residues in empirical pKa predictions. J. Chem. Theory Comput. 2011, 7, 525–537. [Google Scholar] [CrossRef] [PubMed]
- Miyamoto, S.; Kollman, P.A. SETTLE: An analytical version of the SHAKE and RATTLE algorithms for rigid water models. J. Comp. Chem. 1992, 13, 952–962. [Google Scholar] [CrossRef]
- Hess, B.; Bekker, H.; Berendsen, H.J.C.; Fraaije, J.G.E.M. LINCS: A linear constraint solver for molecular simulations. J. Comp. Chem. 1997, 18, 1463–1472. [Google Scholar] [CrossRef]
- Stroet, M.; Caron, B.; Engler, M.S.; van der Woning, J.; Kauffmann, A.; van Dijk, M.; El-Kebir, M.; Visscher, K.M.; Holownia, J.; Macfarlane, C.; et al. OFraMP:A Fragment-Based Tool to Facilitate the Parametrization of Large Molecules. J. Comput. Aided Mol. Des. 2023, 37, 357–371. [Google Scholar] [CrossRef]


| Structure | HIA [a] | PCaco2 [a] | PSkin [a] | PPB [a] | BBB [b] | CNS [b] |
|---|---|---|---|---|---|---|
| 1 | 60.287 | 20.933 | −2.638 | 77.409 | −2.277 | −3.520 |
| 2 | 63.552 | 20.925 | −2.566 | 81.291 | −2.343 | −3.619 |
| 3 | 66.583 | 20.925 | −2.509 | 83.779 | −2.231 | −3.592 |
| 4 | 63.540 | 20.913 | −2.579 | 79.224 | −2.267 | −3.533 |
| 5 | 67.464 | 20.912 | −2.471 | 78.844 | −2.295 | −3.669 |
| 6 | 63.552 | 20.925 | −2.566 | 81.291 | −2.343 | −3.619 |
| 7 | 66.583 | 20.925 | −2.509 | 83.779 | −2.231 | −3.592 |
| 8 | 40.555 | 20.837 | −2.585 | 68.971 | −2.338 | −3.898 |
| 9 | 66.583 | 20.796 | −2.528 | 81.117 | −2.264 | −3.625 |
| 10 | 66.573 | 20.933 | −2.510 | 83.616 | −2.388 | −3.529 |
| 11 | 51.168 | 14.396 | −2.413 | 78.180 | −1.521 | −3.677 |
| 12 | 54.588 | 20.776 | −2.527 | 83.263 | −2.262 | −3.643 |
| 13 | 69.365 | 20.964 | −2.473 | 84.498 | −2.297 | −3.521 |
| 14 | 79.926 | 20.032 | −2.501 | 82.428 | −2.517 | −3.593 |
| 15 | 60.302 | 19.484 | −2.659 | 69.612 | −2.224 | −3.751 |
| 16 | 57.071 | 20.988 | −2.938 | 66.840 | −2.257 | −3.921 |
| 17 | 56.760 | 21.004 | −2.606 | 66.391 | −2.293 | −3.854 |
| 18 | 94.928 | 23.600 | −2.942 | 100.000 | −0.053 | −2.051 |
| 19 | 96.829 | 22.372 | −3.657 | 89.676 | 0.211 | −1.943 |
| 20 | 97.181 | 23.469 | −4.150 | 95.434 | −1.262 | −2.336 |
| 21 | 96.937 | 21.930 | −4.167 | 96.221 | −1.265 | −2.446 |
| 22 | 94.143 | 41.601 | −2.137 | 92.115 | −0.205 | −2.529 |
| FJC | 85.571 | 19.359 | −4.323 | 90.905 | −0.992 | −3.347 |
| Lopinavir | 93.802 | 24.605 | −2.520 | 89.712 | −0.830 | −2.935 |
| Ritonavir | 93.192 | 35.883 | −2.617 | 86.385 | −1.665 | −3.295 |
| Structure | Carcino [a] | Ames [a] | Hepato [a] | MTD [b] | hERG I [b] | hERG II [b] |
|---|---|---|---|---|---|---|
| 1 | - | - | Yes | 0.731 | No | No |
| 2 | - | - | Yes | 0.695 | No | No |
| 3 | - | - | No | 0.672 | No | No |
| 4 | - | - | Yes | 0.645 | No | No |
| 5 | - | - | Yes | 0.737 | No | No |
| 6 | - | - | Yes | 0.695 | No | No |
| 7 | - | - | No | 0.672 | No | No |
| 8 | - | - | Yes | 0.741 | No | No |
| 9 | - | - | Yes | 0.659 | No | No |
| 10 | - | - | Yes | 0.697 | No | No |
| 11 | - | - | No | 0.637 | No | No |
| 12 | - | - | Yes | 0.665 | No | No |
| 13 | - | - | Yes | 0.775 | No | No |
| 14 | - | - | Yes | 0.698 | No | No |
| 15 | - | - | Yes | 0.660 | No | No |
| 16 | - | - | Yes | 0.666 | No | No |
| 17 | - | - | Yes | 0.656 | No | No |
| 18 | - | + | Yes | −0.614 | No | Yes |
| 19 | - | - | Yes | −0.091 | No | No |
| 20 | - | + | Yes | 0.795 | No | Yes |
| 21 | - | - | Yes | 0.777 | No | Yes |
| 22 | - | + | No | 0.320 | No | Yes |
| FJC | - | - | Yes | 0.426 | No | Yes |
| Lopinavir | - | - | Yes | −0.297 | No | Yes |
| Ritonavir | - | - | Yes | 0.096 | No | Yes |
| Structure | Affinity Binding to Proteases [a] (%) | Protease Inhibitor [b] |
|---|---|---|
| 1 | 20.0 | 0.04 |
| 2 | 13.3 | −0.06 |
| 3 | 20.0 | −0.27 |
| 4 | 33.3 | −0.04 |
| 5 | 6.7 | −0.07 |
| 6 | 13.3 | −0.06 |
| 7 | 20.0 | −0.27 |
| 8 | 26.7 | −0.13 |
| 9 | 20.0 | −0.20 |
| 10 | 40.0 | −0.20 |
| 11 | 46.7 | −0.86 |
| 12 | 20.0 | −0.30 |
| 13 | 13.3 | −0.34 |
| 14 | 20.0 | −0.10 |
| 15 | 26.7 | −0.02 |
| 16 | 20.0 | 0.24 |
| 17 | 18.0 | 0.14 |
| 18 | 8.0 | 0.18 |
| 19 | 20.0 | −0.06 |
| 20 | 6.7 | −0.42 |
| 21 | 6.7 | −0.58 |
| 22 | 13.3 | 0.16 |
| FJC | 26.7 | 0.70 |
| Lopinavir | 26.7 | 0.42 |
| Ritonavir | 20.0 | 0.35 |
| Ligand | Binding Energy (kcal/mol) | 2D Interactions of Residues |
|---|---|---|
| 1 | −7.70 | 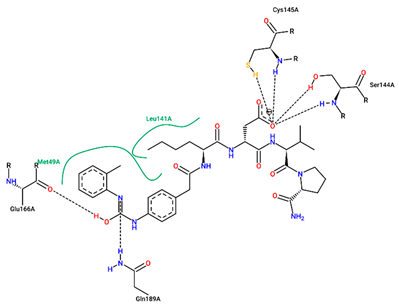 |
| 10 | −8.40 | 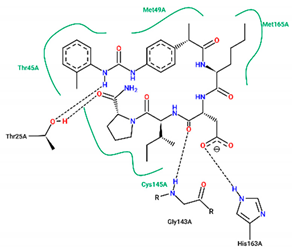 |
| 12 | −7.90 | 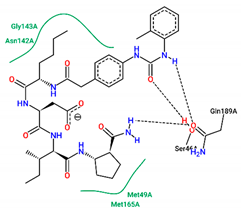 |
| 15 | −7.70 | 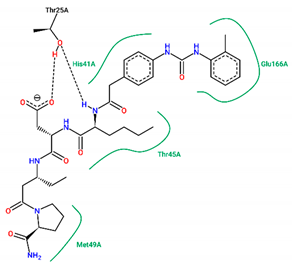 |
| 19 | −6.90 | 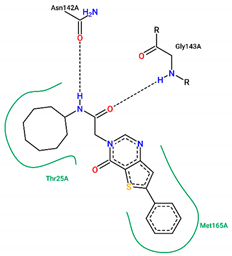 |
| 21 | −7.80 | 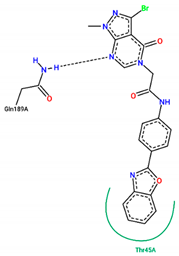 |
| FJC | −8.20 | 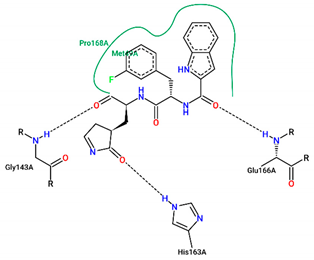 |
| Lopinavir | −6.90 |  |
| Ritonavir | −7.20 | 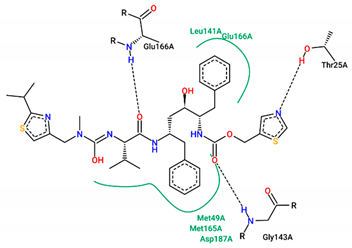 |
Disclaimer/Publisher’s Note: The statements, opinions and data contained in all publications are solely those of the individual author(s) and contributor(s) and not of MDPI and/or the editor(s). MDPI and/or the editor(s) disclaim responsibility for any injury to people or property resulting from any ideas, methods, instructions or products referred to in the content. |
© 2024 by the authors. Licensee MDPI, Basel, Switzerland. This article is an open access article distributed under the terms and conditions of the Creative Commons Attribution (CC BY) license (https://creativecommons.org/licenses/by/4.0/).
Share and Cite
Bastos, R.S.; de Aguiar, C.P.O.; Cruz, J.N.; Ramos, R.S.; Kimani, N.M.; de Souza, J.S.N.; Chaves, M.H.; de Freitas, H.F.; Pita, S.S.R.; Santos, C.B.R.d. Rational Approach toward COVID-19’s Main Protease Inhibitors: A Hierarchical Biochemoinformatics Analysis. Int. J. Mol. Sci. 2024, 25, 6715. https://doi.org/10.3390/ijms25126715
Bastos RS, de Aguiar CPO, Cruz JN, Ramos RS, Kimani NM, de Souza JSN, Chaves MH, de Freitas HF, Pita SSR, Santos CBRd. Rational Approach toward COVID-19’s Main Protease Inhibitors: A Hierarchical Biochemoinformatics Analysis. International Journal of Molecular Sciences. 2024; 25(12):6715. https://doi.org/10.3390/ijms25126715
Chicago/Turabian StyleBastos, Ruan S., Christiane P. O. de Aguiar, Jorddy N. Cruz, Ryan S. Ramos, Njogu M. Kimani, João S. N. de Souza, Mariana H. Chaves, Humberto F. de Freitas, Samuel S. R. Pita, and Cleydson B. R. dos Santos. 2024. "Rational Approach toward COVID-19’s Main Protease Inhibitors: A Hierarchical Biochemoinformatics Analysis" International Journal of Molecular Sciences 25, no. 12: 6715. https://doi.org/10.3390/ijms25126715