Abstract
The oviduct provides an optimal environment for the final preparation, transport, and survival of gametes, the fertilization process, and early embryonic development. Most of the studies on reproduction are based on in vitro cell culture models because of the cell’s accessibility. It creates opportunities to explore the complexity of directly linked processes between cells. Previous studies showed a significant expression of genes responsible for cell differentiation, maturation, and development during long-term porcine oviduct epithelial cells (POECs) in vitro culture. This study aimed at establishing the transcriptomic profile and comprehensive characteristics of porcine oviduct epithelial cell in vitro cultures, to compare changes in gene expression over time and deliver information about the expression pattern of genes highlighted in specific GO groups. The oviduct cells were collected after 7, 15, and 30 days of in vitro cultivation. The transcriptomic profile of gene expression was compared to the control group (cells collected after the first day). The expression of COL1A2 and LOX was enhanced, while FGFBP1, SERPINB2, and OVGP1 were downregulated at all selected intervals of cell culture in comparison to the 24-h control (p-value < 0.05). Adding new detailed information to the reproductive biology field about the diversified transcriptome profile in POECs may create new future possibilities in infertility treatments, including assisted reproductive technique (ART) programmes, and may be a valuable tool to investigate the potential role of oviduct cells in post-ovulation events.
1. Introduction
In mammals, the oviduct provides an optimal environment for the final preparation, transport, and survival of gametes, the fertilization process, and early embryonic development [1,2,3,4,5]. Fallopian tubes are narrow passageways which the ova travel from each ovary to the uterus. Oviductal tissue is highly sensitive to the fluctuating levels of sex steroid hormones during different stages of the estrous cycle [6,7]. The processes occurring in the female reproductive system are relatively well described, but the changes on the molecular level are not fully known, because the research is still being conducted and knowledge in this area is expanding. Fertilization usually occurs in the distal third of the fallopian tube which curves over the ovary, and the ampulla contains ciliated epithelial cells with tubal fimbria [5]. The preimplantation phase is filled with crucial events that require effective embryo–maternal interactions involving oviductal secretion and other cellular and molecular interactions [5,8], such as embryonic genome activation during the migration of the embryo through the oviduct [9,10]. The fertilized oocyte undergoes its first cell divisions, and then cells increase their intracellular contacts, leading to compaction (morula stage), blastocoele formation, and cell differentiation [11]. The transcriptomic changes in the oviducts are related to the regulation of embryo implantation and development [12].
Over the past few years, various cell culture models for primary oviductal epithelial cells were established. Monolayer cultures of OECs and 3D culture models [1] are frequently utilized as a model showing interactions of the oviduct with spermatozoa [4] or cumulus–oocyte complexes (COCs) [3,5].
Recent studies [13,14,15,16,17] have shown that POECs during in vitro culture may change their morphology and biochemical properties [13,18]. The presented studies used standardized OECs primary in vitro culture methods, which have already been used in the analysis of gene expression related to processes such as “angiogenesis and circulatory system development” [19], “cell cycle”- and “cell death”-related genes [17] and genes linked to cellular proteins defined in Gene Ontology as “maintenance of location”, “maintenance of protein location”, and “maintenance of protein location in cell” [20] and oxygen metabolism [21].
The current results demonstrate more transcripts that may be associated with metabolic regulators, immune modulators, enzymes, and extracellular matrix components, and hence be associated with oviductal early events in maintaining stable oviductal physiology. It is proven that abnormalities in fallopian tubes from infections, surgeries, tumors, or rare congenital malformations may be the cause of ectopic pregnancy [22]. Additionally, ovarian carcinoma is a highly heterogeneous group of diseases because of the different histological subtypes with distinct molecular genetic backgrounds. Nowadays, there is a development in genomic studies focused on the origin of ovarian cancer [23,24,25,26]. Labidi-Galy et al. in 2017 published groundbreaking results which revealed that the development of high-grade serous ovarian carcinoma (HGSOC) is the result of a seeding event from an initial tumor in the fallopian tubes. Serous tubal intraepithelial carcinomas (STICs) might be precursors for most HGSOCs [25]. This discovery has opened a conversation between scientists as to whether ovarian cancer subtypes other than HGSOC, such as low-grade serous cancers and endometrial cancers, may also arise from cells outside of the ovary.
Numerous studies based on in vitro cultures confirmed the important effect of oviductal epithelia and oviductal fluid on early embryonic development in mammals, like sheep, mice, pigs, and cattle [27,28,29,30]. The oviductal microenvironment provides stable conditions, including an optimal temperature, pH, and fluid secretions. It is a place where important embryonic changes occur, like the first mitotic cleavage and embryonic genome activation at the 8-cell blastocyst [31]. Oviductal epithelia are also responsible for the synthesis of embryotropic factors, such as growth factors (EGF, FGF, IGF, TGF) [3,5]. In turn, tubal fluid contains catalase, superoxide dismutase, and glutathione peroxidase to reduce the stress of the embryos from reactive oxygen, and in vivo, it protects the embryo from environmental stress. The oviduct also participates in autoimmunology protection of the embryos by inhibiting the production of antimicrobial peptides and excess protease activity [5].
The continuation of research on primary cultured OECs may be a valuable tool to investigate the original properties of the oviductal epithelium and the potential role of oviduct cells in other biochemical processes and post-ovulation events, including oocyte–oviduct interactions and early embryo development, as well as hormonal actions on reproductive processes occurring within the oviduct [13,32]. The selective transport of embryos through the oviduct indicates a reciprocal interaction of the embryo on gene expression [29].
Therefore, in the present study, the expression profile of genes clustered in GO groups representing cellular processes and interactions, such as “cell adhesion”, “rRNA processing”, “ribosome biogenesis”, “DNA regulation”, “cell migration”, “collagen fibril organization”, “extracellular matrix organization”, “response to viruses”, “positive regulation of transcription from RNA polymerase II promoter”, and others were assessed. The “cell adhesion” Gene Ontology group is associated with the attachment of a cell, either to another cell or to an underlying substrate such as the extracellular matrix, via cell adhesion molecules [33]. Changing the expression of genes related to the adhesion process may be of key importance in the transport of the spermatozoa, oocyte, and zygote [34].
Determining the changes associated with these processes will allow us to understand the mechanism of the fertilization process that takes place in the ampulla of the oviduct. The main objective of this study was to characterize changes in gene expression associated with the regulation of cellular processes such as “cell adhesion”, “cell migration”, “intercellular communication”, “rRNA processing”, “ribosome biogenesis”, and “extracellular matrix organization” occurring in porcine oviductal epithelial cells in primary in vitro culture.
It is assumed that there will be a change in the expression profile of the COL1A2, LOX, OVGP1, GCNT3, RSAD2, CHRDL1, LUM, and EPCAM genes, which play a key role in processes such as “cell adhesion”, “cell migration”, “intercellular communication”, “rRNA processing”, “ribosome biogenesis”, and “extracellular matrix organization” occurring in the epithelial cells of porcine oviductal cells.
2. Results
Oviduct cells were collected after 7, 15, and 30 days of cultivation to assess changes in the direction of gene expression profiles. The transcriptomic profile of gene expression was compared to the control group (24-h).
The general profile of the transcriptome changes is shown in the Figure 1, where dots represent the mean gene expression. With respect to the assumed cut-off criteria for differentially expressed genes (|fold change| = 2, and p-value = 0.05), we demonstrated 478 genes with downregulated expression and 853 with upregulated expression in 7-day vs. 24-h, 639 genes with downregulated expression and 1086 with upregulated expression in 15-day vs. 24-h, and 1057 genes with downregulated expression and 1250 with upregulated expression in 30-day vs. 24-h comparisons.
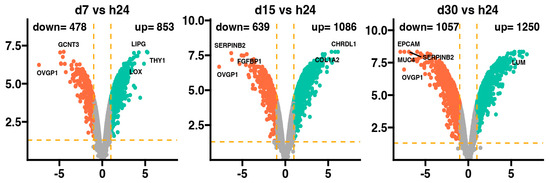
Figure 1.
Volcano plots of differentially expressed genes in the d7, d15, and d30 experimental groups compared to the h24 control group. Cut-off values shown on the graph as orange dashed lines were obtained based on parameters |fold change| = 2; p-value = 0.05. Red dots represent genes with downregulated expression, while green dots—upregulated expression. The exact number of differentially expressed genes in each comparison is shown in the upper part of the graph. The five most overexpressed genes are labeled with their names. Two biological replicates were performed for each experiment.
In the 7-day and 24-h comparisons of the experiment, the genes with downregulated expression profile include GCNT3 and OVGP1, with overexpression of the LIPG, THY1, and LOX genes. In the 15-day vs. 24-h comparisons, the most downregulated genes were SERPINB2, FGFBP1, and OVGP1, while the most overexpressed were the CHRDL1 and COL1A2 genes. Meanwhile, at 30 days vs. 24 h, it has been indicated that EPCAM, SERPINB2, MUC4, and OVGP1 were downregulated, while only LUM was upregulated. Interestingly, it has been observed that only the expression of the OVGP1 gene was reduced in all analyzed groups compared to the 24-h group.
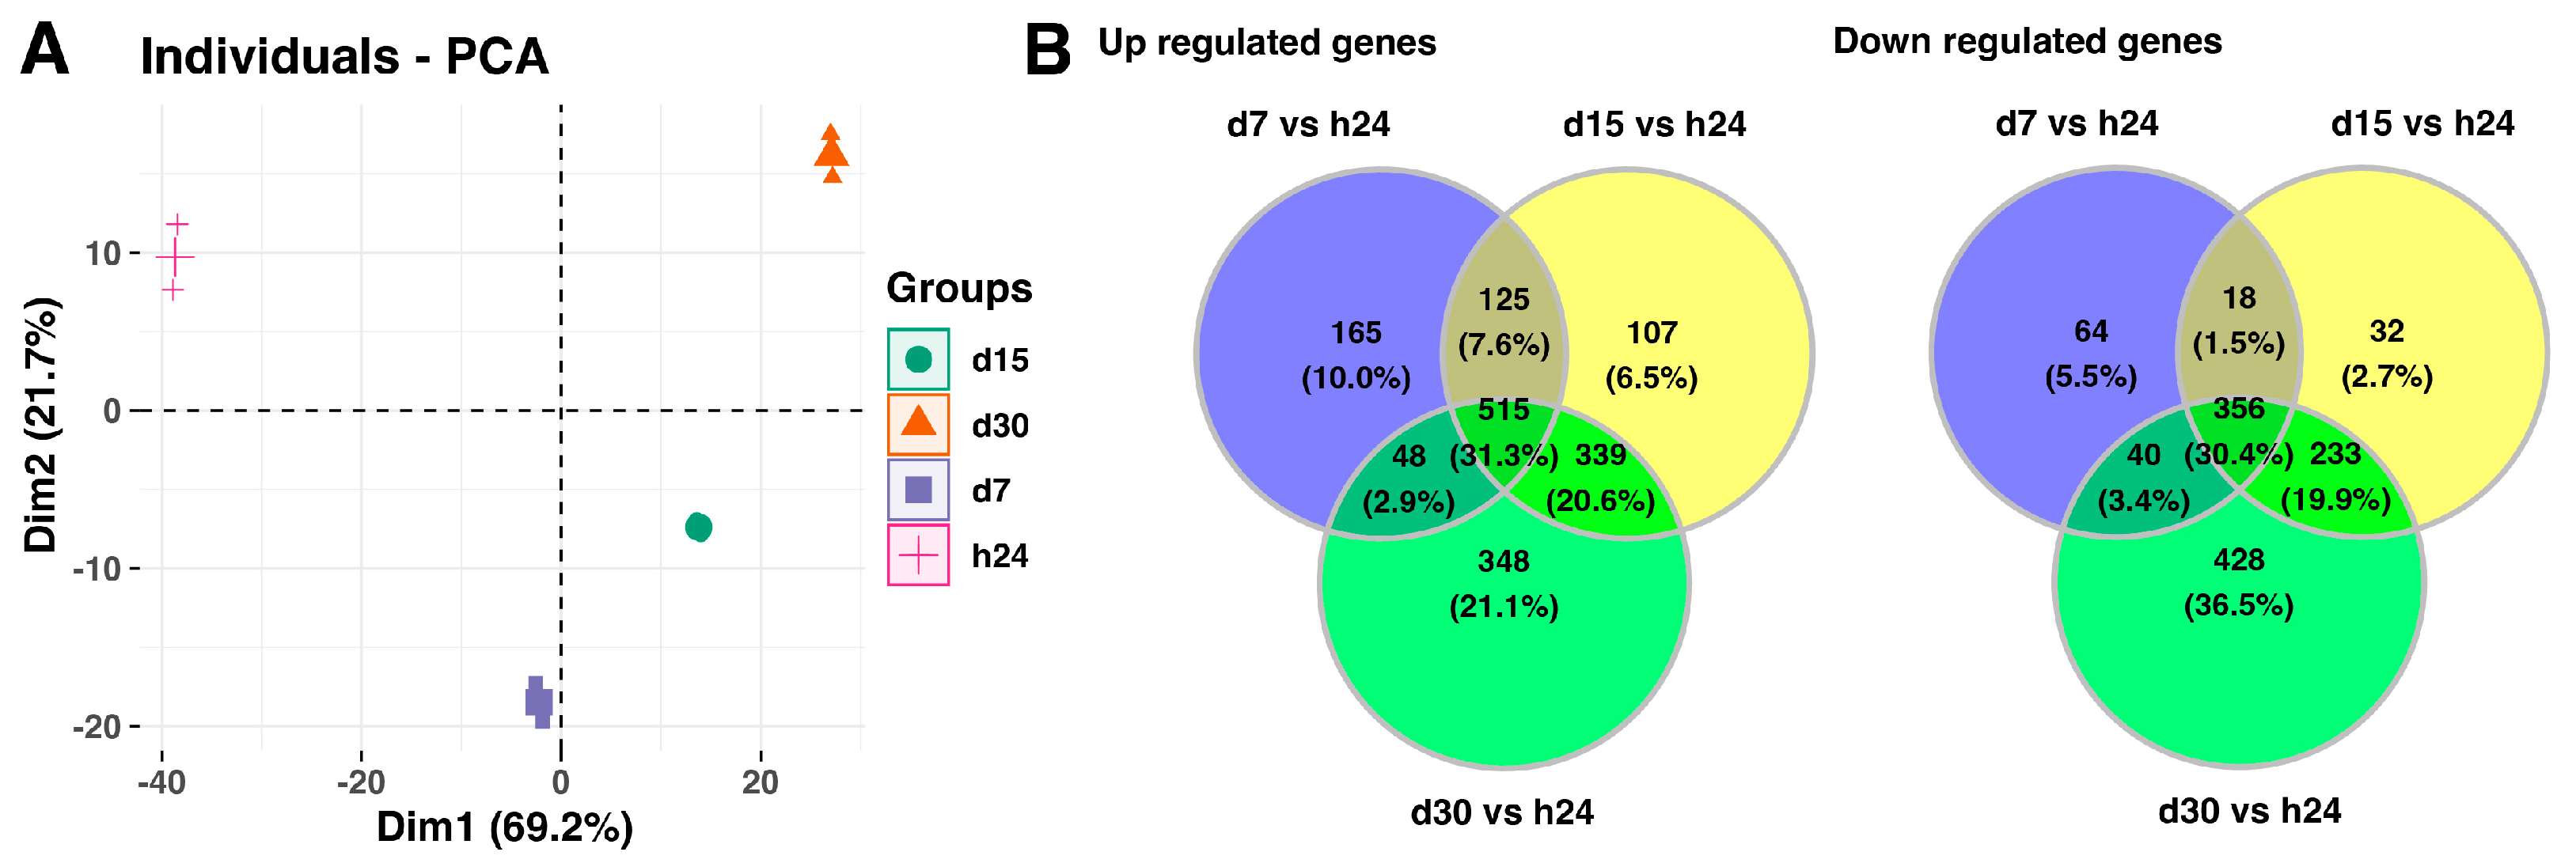
Next, the analysis includes full data sets comprising the analyzed groups, and it is presented in Figure 2. The principal component analysis (PCA) indicates the variation between the different biological groups. The first principal component (Dim1) explains 69.2% of variations between analyzed groups, while the second principal component accounts for 21.7% of the variance. The PCA plot shows that the groups of the control and day 7 of the experiment, scattered in the left region of the plot, were separated from the groups of day 15 and day 20 of the experiment, which were scattered in the right region of the plot (Figure 2A). Furthermore, the Venn diagrams indicates that a high number of the analyzed genes are commonly expressed in the experimental conditions, 515 genes with upregulated expression (31.3%) and 356 genes with downregulated expression (30.4%), compared to the 24-h point of the experiment (Figure 2B).
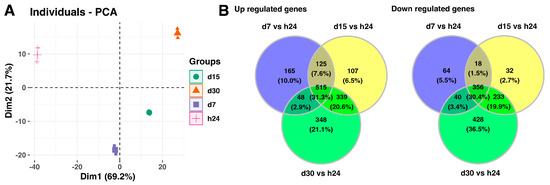
Figure 2.
(A) Principal component analysis (PCA) plot of the first two components of the filtered microarray data set. (B) Venn diagrams show genes with upregulated (left panel) and downregulated (right panel) expression shared among different analyzed groups.
A list of the top 20 genes with the highest (10 genes) and lowest (10 genes) expression fold change at 7, 15, and 30 days of the experiment compared to the 24-h point of the experiment is presented in Table 1, Table 2, and Table 3, respectively.

Table 1.
A list of the top 20 most regulated genes from the comparison group d7 vs. h24, including 10 genes with the highest and 10 genes with the lowest fold change. Values were obtained using following parameters: |fold change| > 2, p-value < 0.05.
Table 2.
A list of the top 20 most regulated genes from the comparison group d15 vs. h24, including 10 genes with the highest and 10 genes with the lowest fold change. Values were obtained using following parameters: |fold change| > 2, p-value < 0.05.
Table 3.
A list of the top 20 most regulated genes from the comparison group d30 vs. h24, including 10 genes with the highest and 10 genes with the lowest fold change. Values were obtained using following parameters: |fold change| > 2, p-value < 0.05.
The fold change values of the top ten overexpressed genes at the 7-day vs. 24-h point (Table 1) ranged from 38.75 (THY1) to 12.88 (FMOD), while the downregulated expression of the top ten genes ranged from −12.17 (TXNIP) to −166.19 (OVGP1).
The compassion of gene expression between the 15-day and 24-h points of the experiment (Table 2) indicates that the ten genes with the most enhanced expression ranged from 70.42 (CHRDL1) to 24.48 (CDH11), meanwhile the fold change of the ten top genes with downregulated expression ranged from −18.51 (LOC100524999) to −209.47 (OVGP1).
The fold change values for the top ten overexpressed genes at the 30-day vs. 24-h point of the experiment (Table 3) ranged from 114.07 (LUM) to 41.92 (LOC106508700), whereas for the genes with downregulated expression, the fold changed ranged from −61.38 (CLDN7) to −243.04 (EPCAM).
In summary, it appears that the expression of COL1A2 and LOX was enhanced while FGFBP1, SERPINB2, and OVGP1 were downregulated at the 7-, 15-, and 30-day points when compared to the 24-h control.
Furthermore, the analysis also includes a functional annotation of differentially expressed genes evaluated using the Database for Annotation, Visualization, and Integrated Discovery (DAVID) bioinformatics tool with the GO BP Direct database.
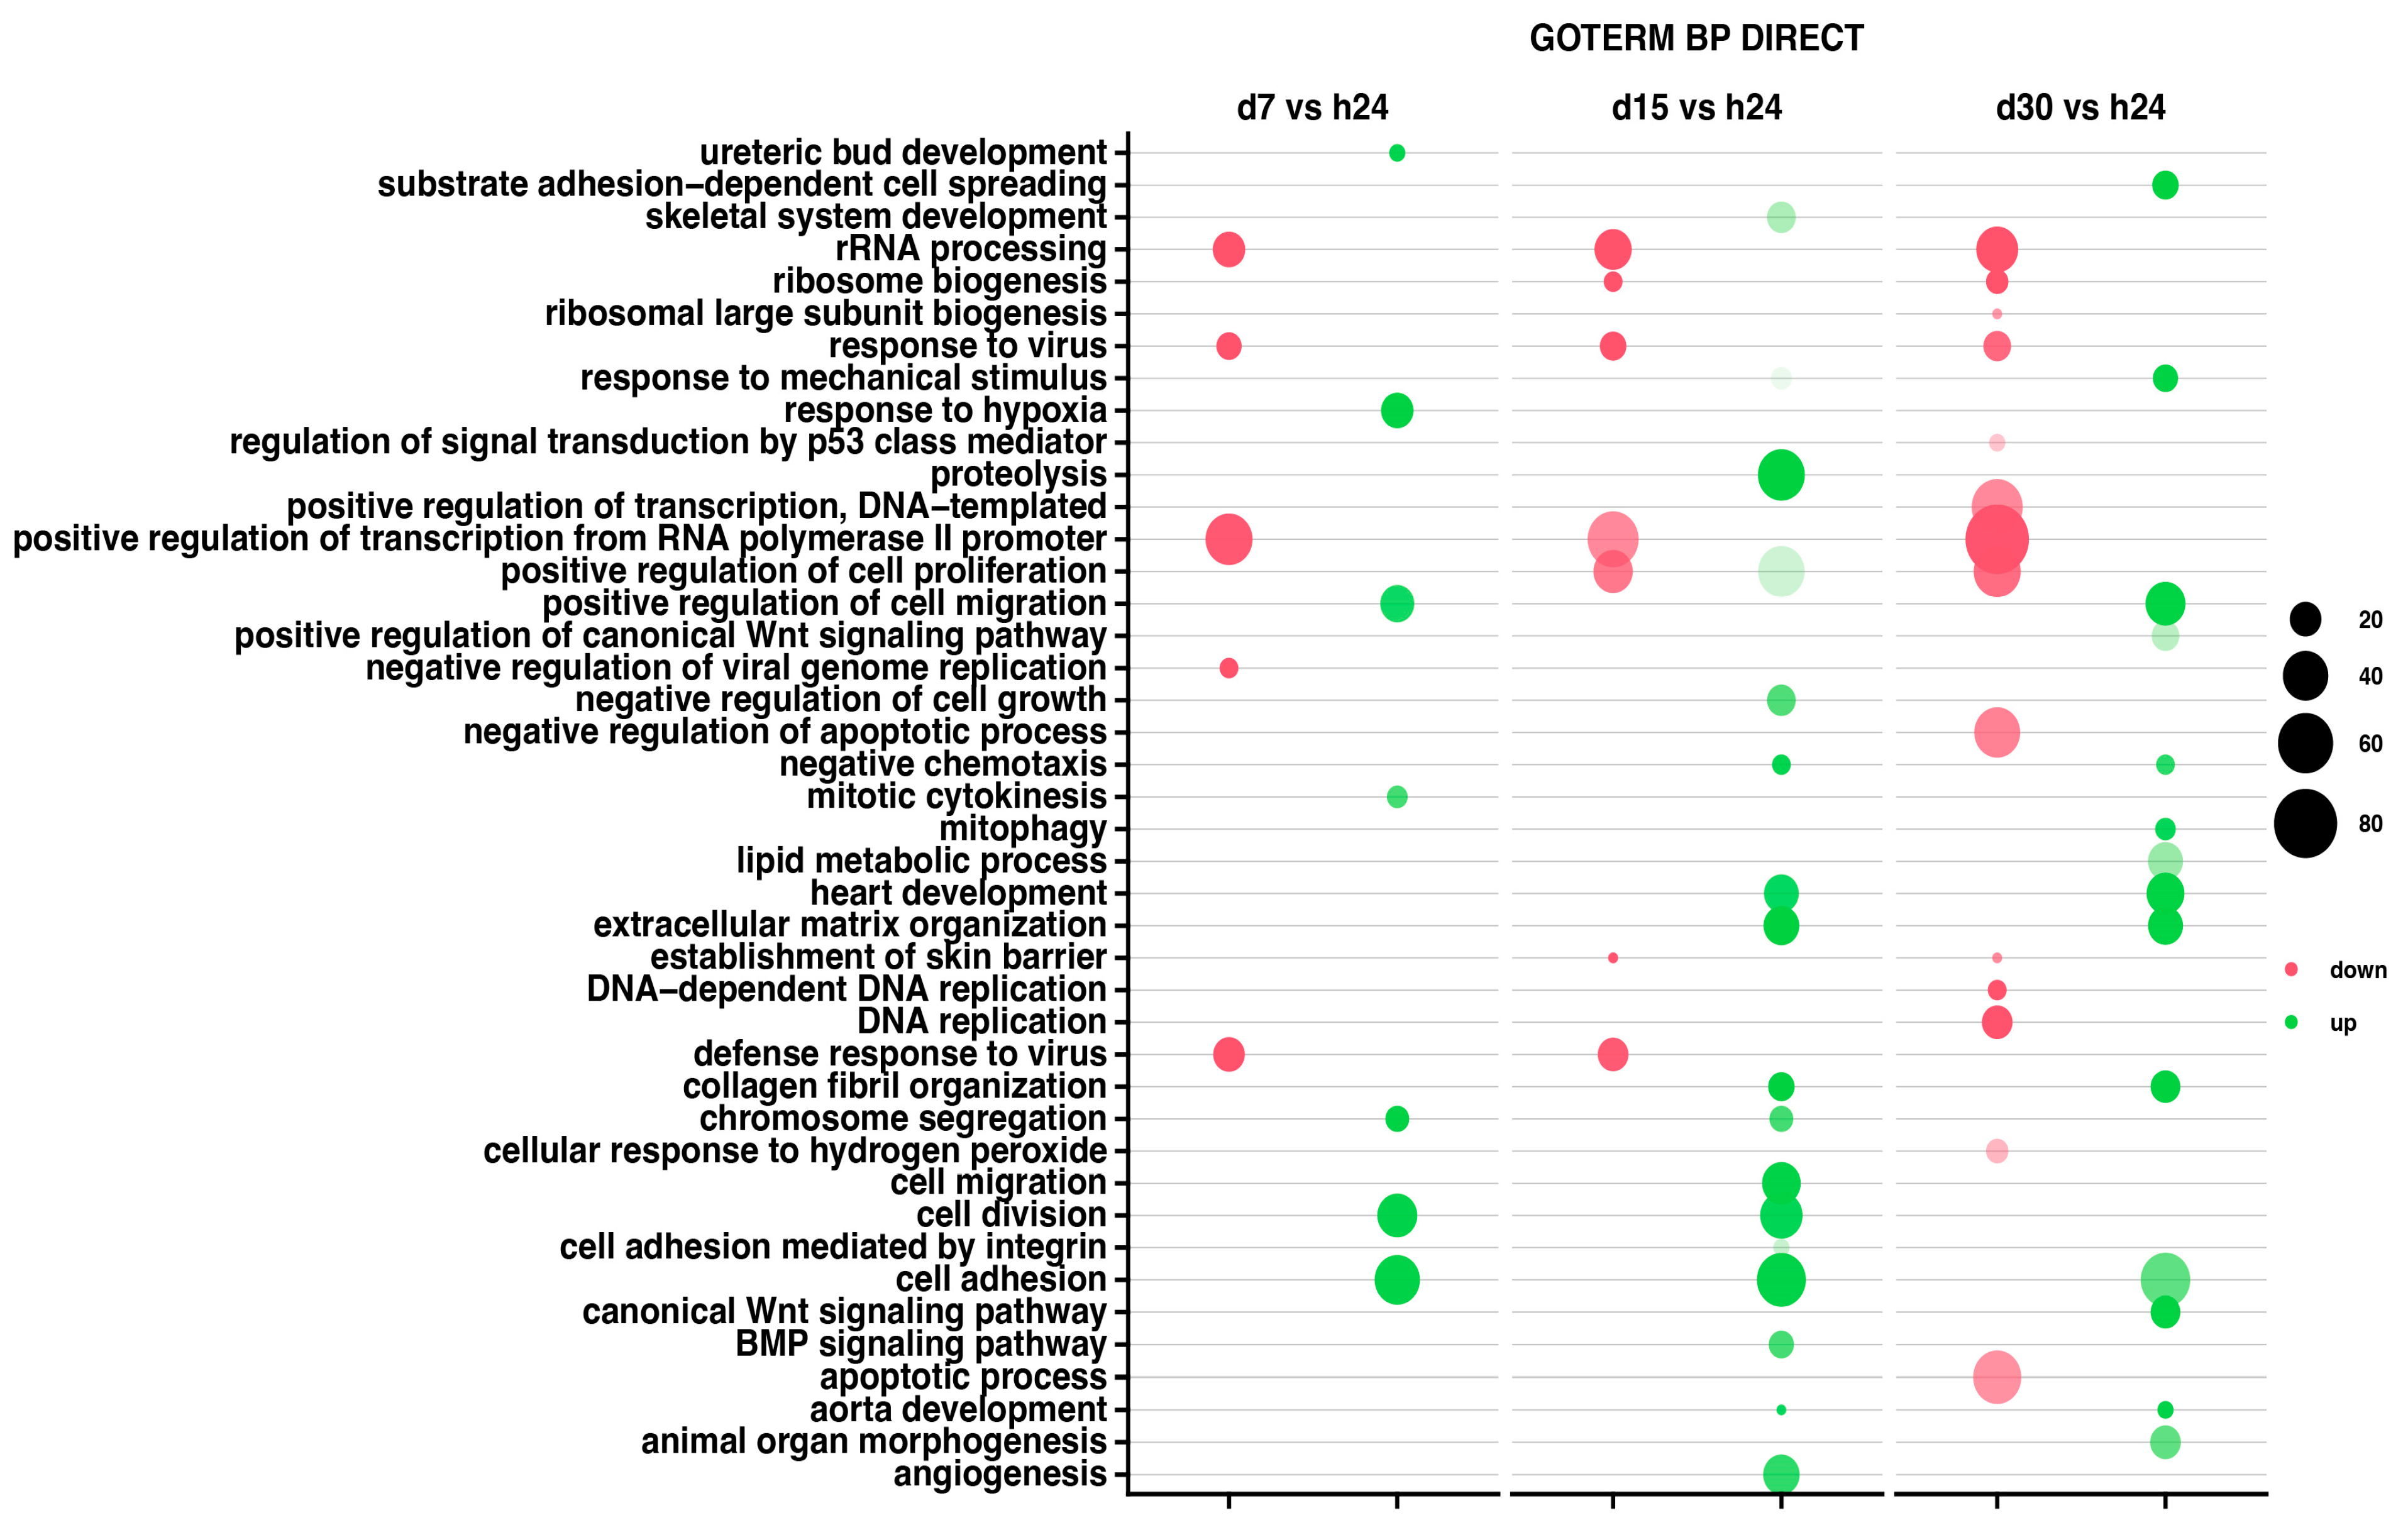
The relevant GO ontological groups with adjusted p-values below 0.05 and N per group > 2 are presented in Figure 3, where comparison of the 7-day vs. 24-h point of experiment shows seven activated and five inhibited GO BP terms. In other experimental groups, it has been shown that a 15-day vs. 24-h comparison showed 17 activated and 7 inhibited GO BP terms, while a 30-day and 24-h of experiment comparison indicates 14 activated and 14 inhibited GO BP terms.
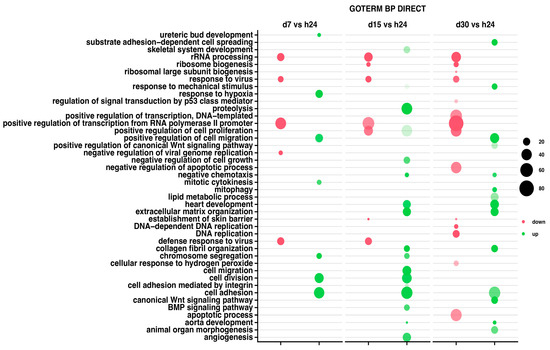
Figure 3.
Bubble plot showing differentially expressed gene sets in DAVID GO BP DIRECT database. Each column represents corresponding gene sets in comparison groups d7 vs. h24; d15 vs. h24; d30 vs. h24, respectively. Red bubbles represent downregulated expression and green bubbles represent upregulated expression gene sets. The size of the bubble reflects the number of different genes in a particular GO term. Higher bubble transparency means closer proximity of p-value to 0.05. The parameters used for the cut-off criteria were p-value with correction < 0.05, number of genes in set >2.
For day 7 of the experiment, the most inhibited GO term was “rRNA processing” (n = 21, p = 1.005 × 10⁻¹³). Aside from this process, the GO terms related to the biological response to viruses were also inhibited (mostly, response to viruses n = 14, p = 5.98 × 10⁻⁸), being similar at day 15 of the experiment (n = 15, p = 3.09 × 10⁻⁷). At the day 30 of the experiment, aside from rRNA processing (n = 34, p = 6.86 × 10⁻¹⁸), there has been also indicated an inhibition of the apoptotic (n = 45, p = 9.52 × 10⁻⁵) and cell development processes (ribosome biogenesis n = 12, p = 2.91 × 10⁻⁷).
The 7-day to 24-h of the experiment comparison indicates mostly the GO term “response to hypoxia” (n = 21, p = 2.52 × 10⁻⁶), as well as chromosome segregations (n = 13, p = 6.6 × 10⁻⁶) and cell adhesion (n = 40, p = 8.39 × 10⁻⁶). In the second group, at day 15 of the experiment, the most activated GO terms were proteolysis (n = 43, p = 6.11 × 10⁻⁸) and extracellular matrix organization (n = 25, p = 8.27 × 10⁻⁸). Also, the analysis of GO terms at day 30 confirmed the activation of cellular organization processes (collagen fibril organization, n = 18, p = 1.36 × 10⁻⁹).
For all analyzed groups, we observed some similarities in GO terms expression; “rRNA processing” was mostly inhibited across all analyzed groups. Moreover, “response to viruses” and “positive regulation of transcription from RNA polymerase II promoter” were also inhibited in all analyzed groups. Nevertheless, only “cell adhesion” has been activated across all groups.
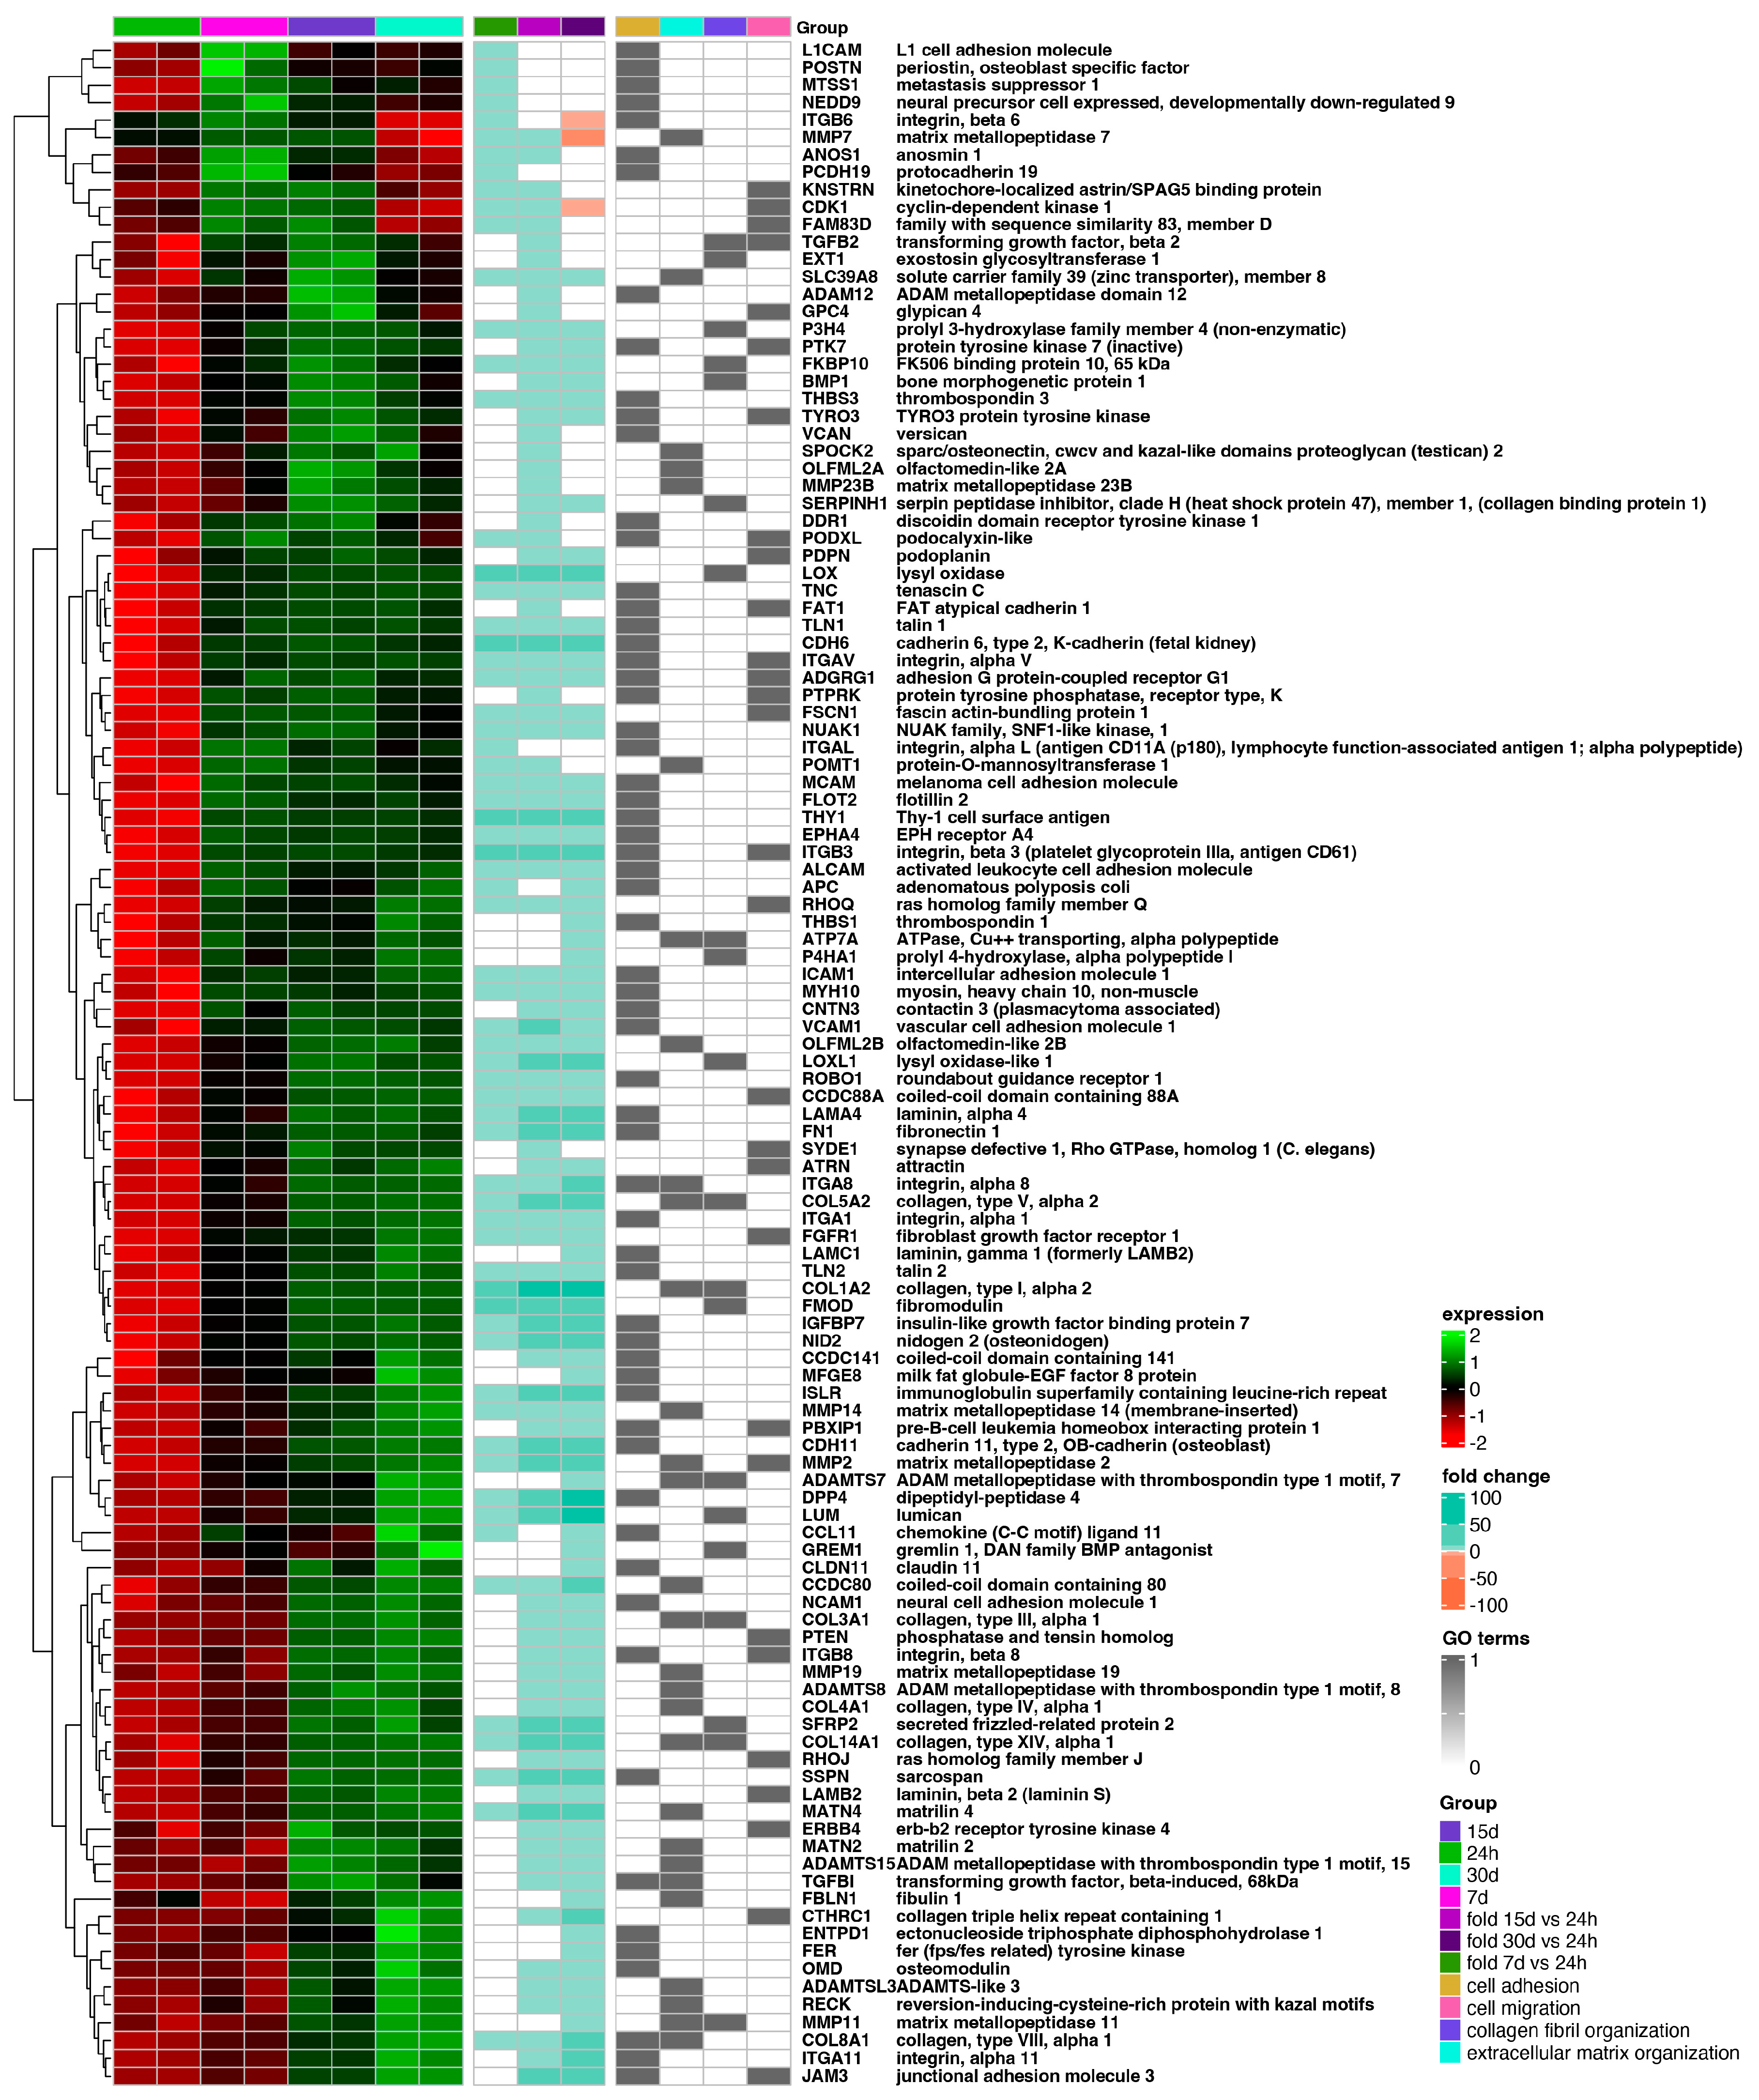
The hierarchic clustering of differentially expressed genes in all analyzed groups has been shown as a heatmap and presented in Figure 4. The figure shows mean expression values, normalized expression values, and fold changes between compared groups. Genes belonging to the most significantly enriched ontological groups (lowest adjusted p-value) are shown as dark squares. Expression values are scaled by rows and presented as colors and ranges.
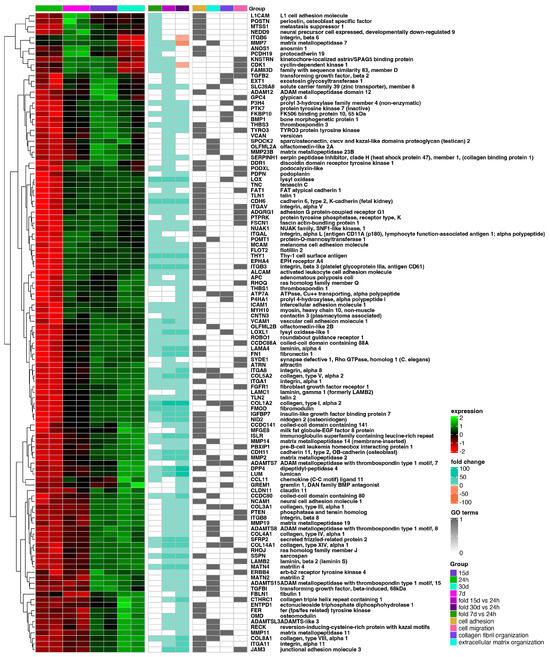
Figure 4.
Heatmap of expressed gene clusters in 24 h control group and d7, d15, and d30 experimental groups. Leftmost heat map shows scaled levels of gene expression in each study group (green = 2, black = 0, red = −2). The middle heatmap shows the fold change of the gene expression in comparison to the 24 h control group. The right heatmap highlights genes belonging to the four most significantly enriched ontological groups (black = present, white = absent).
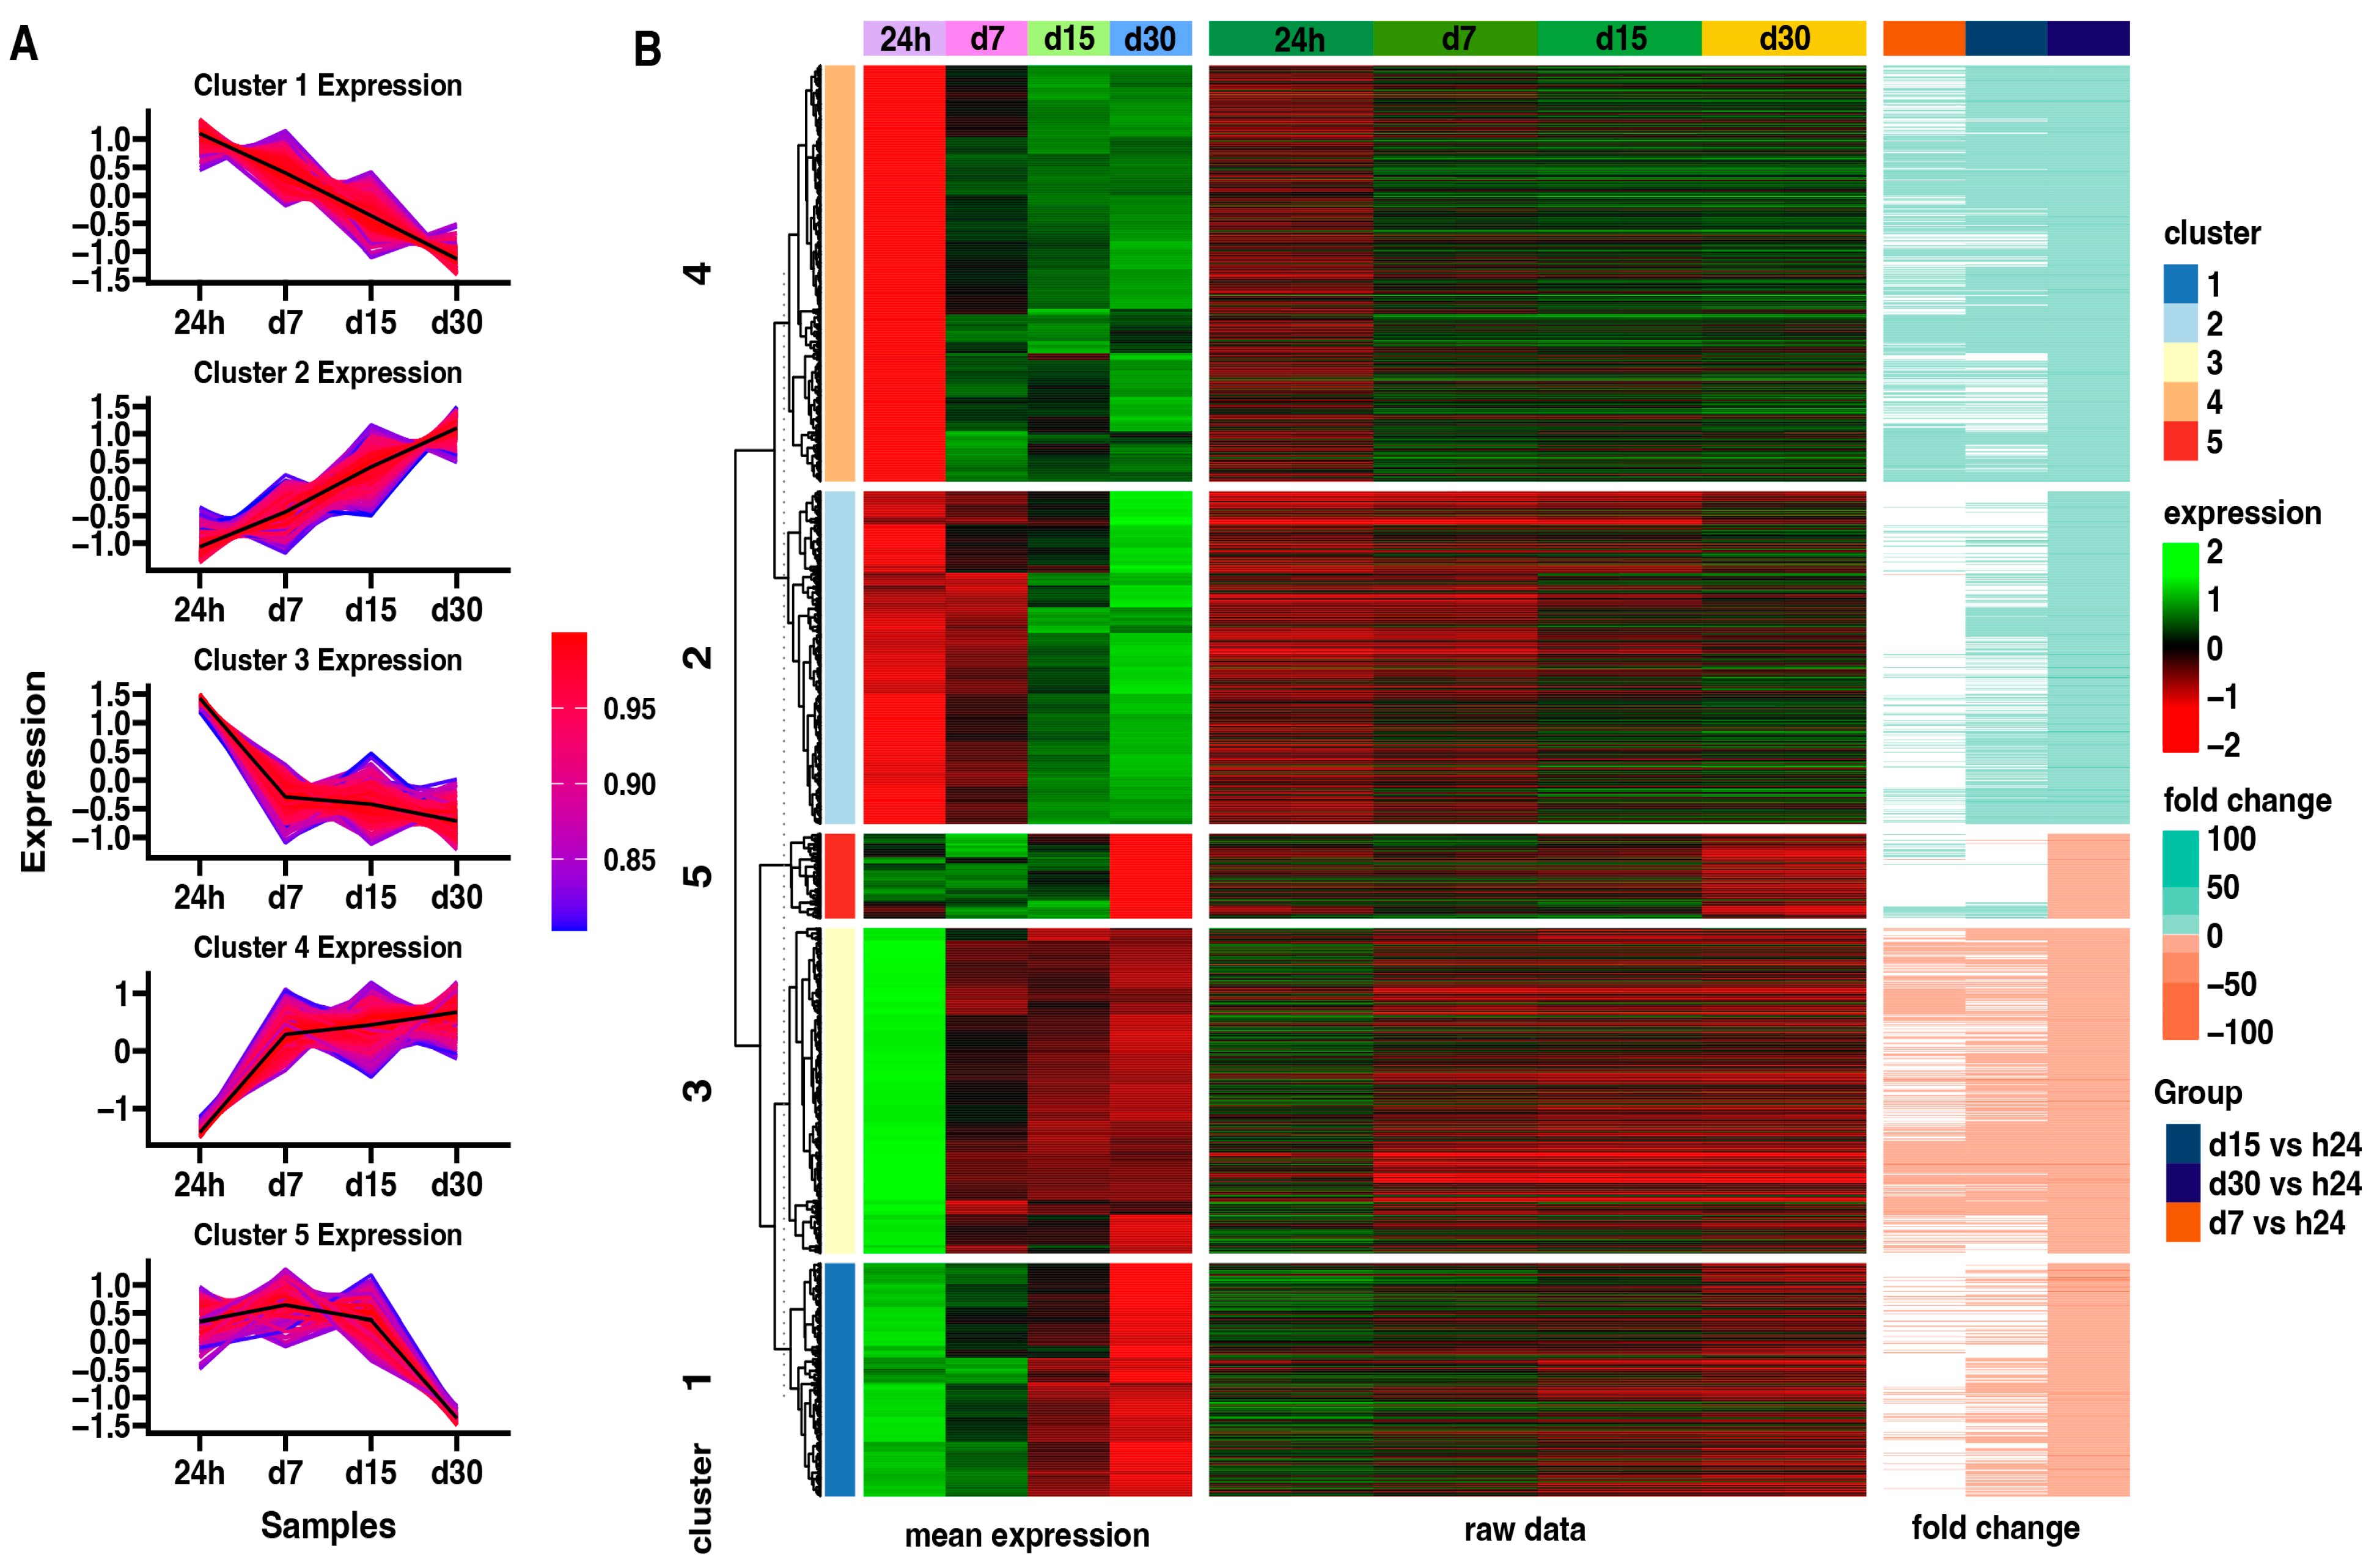
Subsequently, an analysis of the expression patterns in each group using the K-means clusterization algorithm has been made (Figure 5). First, the optimal number of clusters has been determined using the sum of squared error (SSE) approach, with an increasing number of clusters. By using this algorithm, five clusters was determined as the optimal number (Figure 5A). The centroid values and core gene expression set have been determined for each cluster. Cluster 1 contains the genes whose expression is highest at the beginning of the experiment and decreases with time. Cluster 2 shows the opposite expression profile to Cluster 1. Next, Cluster 3 presents the genes expressed mostly at the beginning of the experiment, with a similar reduction in expression from 7 to 30 days of the experiment. Cluster 4 contains the genes inhibited at the beginning of the experiment, with high enhancement since day 7 till the end of the experiment. Cluster 5 presents genes expressed highly from the 24-h to 15-day points of the experiment, with a significant decrease at the 30-day point.

Figure 5.
(A) Clustering of differentially expressed genes. Centroid values are shown as black lines. Each line represents an individual gene, where the color corresponds to the level of correlation to the centroid values according to the color scale. (B) Heatmap of differentially expressed genes in all analyzed groups divided into five gene clusters. Leftmost heat map illustrates mean expression of genes grouped in five clusters in 24 h control group and in each study group: d7, d15, d30 (green = 2, black = 0, red = −2). The rightmost heatmap shows the fold change of the gene expression compared to the 24 h control group.
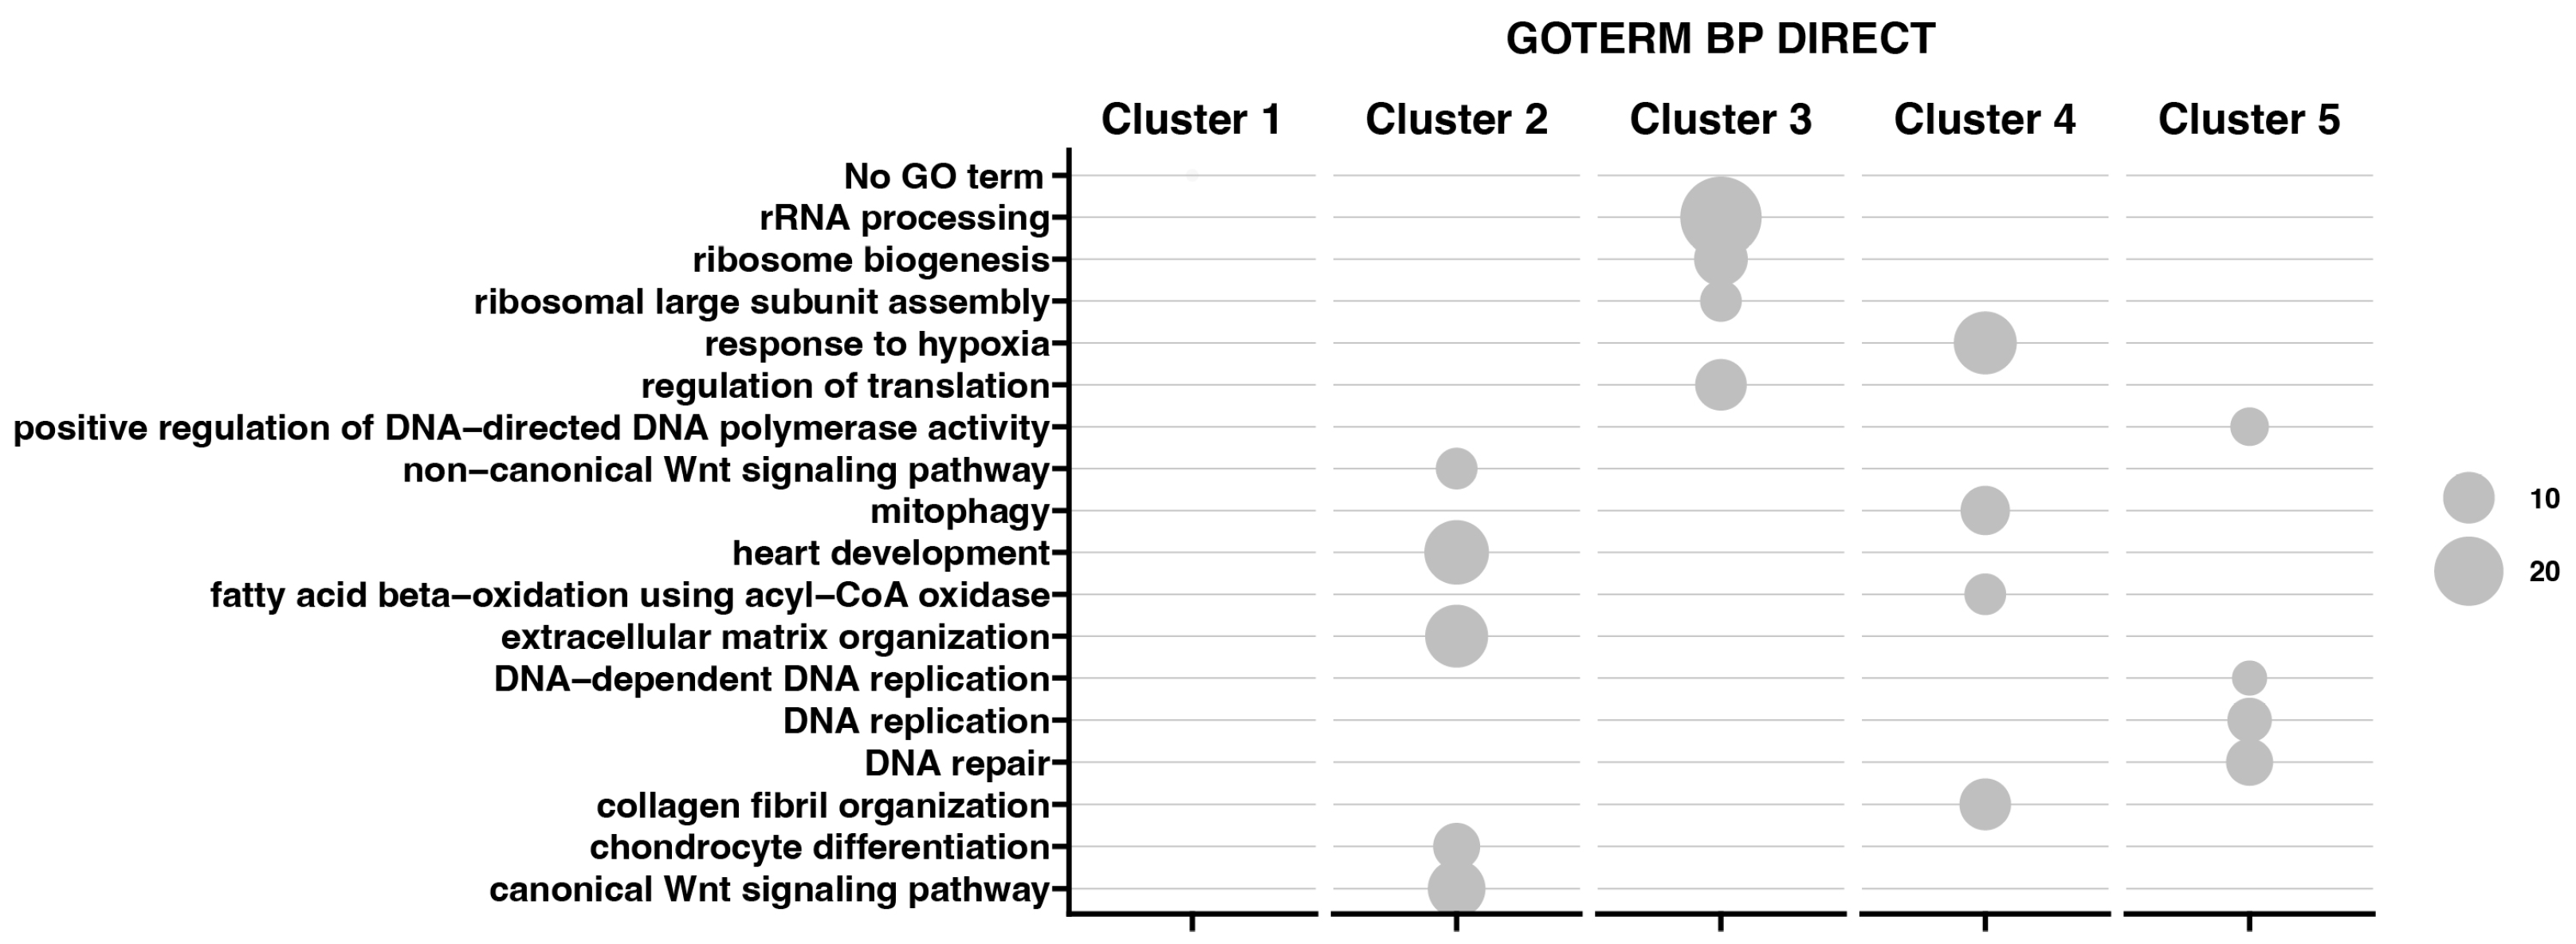
Moreover, the results obtained by K-means clusterization have been transcribed into GO BP terms by DAVIVD and presented in Figure 6 as a bubble plot for all clusters. It has been indicated that for Cluster 1, none of the GO processes has been assigned. Cluster 2 is mainly associated with ECM organization and the canonical and non-canonical Wnt signaling pathway. Cluster 3 contains genes responsible for rRNA processing, ribosome biogenesis, and regulation of translation. Custer 4 represents genes in response to hypoxia, mitophagy, and collagen fibril organization, while Cluster 5 is responsible for DNA replication, repair, and the positive regulation of DNA-directed DNA polymerase activity.

Figure 6.
Bubble plot representing enrichment of genes in GO groups divided among five gene clusters. The size of the bubble corresponds to the number of genes assigned to the GO BP terms.
3. Discussion
Unlike the ovary and uterus, fallopian tube physiology is less understood for its contribution to reproduction. The challenge for scientists is to identify appropriate in vitro models to facilitate the study of early embryo–maternal communication. In this study, only genes associated with cell molecular pathways such as “rRNA processing”, “ribosome biogenesis”, “DNA regulation”, “cell adhesion”, “cell migration”, “collagen fibril organization”, “response to viruses”, “extracellular matrix organization”, “positive regulation of transcription from RNA polymerase II promoter”, “canonical Wnt signalling pathway”, and “proteolysis” were examined in the analysis, which may play role in gametes and fertilized egg transport. The mentioned processes may be regulated in the fallopian tube during fertilization and the passage of the embryo from oviduct to uterus [34]. For instance, the cell–cell adhesion molecules in gamete transport facilitate the attachment of the sperm to the oviductal epithelium. It is also known that cumulus–oocyte complexes (COCs) express adhesion molecules, such as E-cadherin and N-cadherin. The adhesion between the extracellular matrix of the cumulus cells (CCs) and oviductal cells correlates with successful oocyte pick-up and subsequently the transfer of COCs to the infundibulum and oviduct [35,36]. Additionally, adhesion molecules have a role in initiating the compaction state through implantation [36].
Microarray assay analysis allows the identification of different groups of genes and their interrelationships. It has expanded the field of research of the valid transcriptomic factors in the porcine oviductal epithelium. During the in vitro culture of POECs, changes in gene expression were analyzed at different time intervals: 1 (24 h), 7, 15, and 30 days of cultivation.
Standardization of the cell culture is crucial for stable in vitro conditions of cell culture for further study. The characterization of the passage method, stable temperature conditions, and the well-defined composition of the culture medium provide high-quality experimental reproducibility in mammalian cell culture. This approach makes it possible to evaluate the expression profile of individual genes in porcine oviductal epithelial cells.
The results indicate changes in the gene expression of defined gene clusters during the in vitro cell culture. Cluster 2 includes genes related to extracellular matrix organization and the non-canonical and canonical Wnt signaling pathway, and it shows the lowest expression at the beginning and an increase with time. Cluster 3 consists of genes with a similar reduction in expression from 7 to 30 days of the experiment—genes linked to “rRNA processing”, “ribosome biogenesis”, “ribosomal large subunit assembly”, and “regulation of translation”. Cluster 4 contains genes belonging to the groups “response to hypoxia”, “mitophagy”, “fatty acid beta-oxidation using acyl-CoA oxidase”, and “collagen fibril organization”, and they were inhibited at the beginning of the experiment, with high upregulation at day 7 till the end of the experiment. Cluster 5 presents genes expressed highly from the 24-h to 15-day interval of the experiment, with significant limitation at the 30-day interval. Genes in this group related to the apoptotic process, DNA replication, and repair can be included, such as CDK1 (Figure 4). It may suggest the limited functions of repair mechanisms due to aging and the accumulation of damage in cells over time after crossing the 30th day of long-term in vitro primary cultivation [37,38,39,40].
Most of the studies focus on oviductal fluid and proteins secreted into it [41,42,43]. Banliat et al. identified 56 proteins involved in embryo–maternal interactions in the bovine oviduct by mass spectrometry, such as annexins (ANXA1, ANXA2, ANXA4), OVGP1, and PYGL [41]. A reduced expression of the oviduct-specific glycoprotein gene (OVGP1) was revealed in all analyzed groups compared to the 24-h control. It is well described in the literature that OVGP1 belongs to the group of MUC proteins, and it is a main constituent of oviductal fluid in early embryonic enhancement [44,45]. The roles of oviductal glycoprotein 1 relate to the maintenance of sperm viability and motility and sperm capacitation in the oviduct [46] and oocyte zona pellucida stability, including the process of acquiring resistance to proteolytic digestion during oviductal transit [47]. Recently, Nelson et al. [48] conducted an RNAseq analysis of granulosa cells (GCs) collected from mice and suggested that a reduced expression of the OVGP1 gene in GCs could have an impact on pre-ovulation processes such as cumulus expansion and oocyte maturation.
Another mucin-type encoding gene was downregulated at the 30th day—MUC4, a membrane-bound mucin, a family member of highly glycosylated proteins, which play an important role in the protection of epithelial cells and have been implied in epithelial renewal and differentiation [49].
In the group of genes studied at day 7 of culture, one was also significantly downregulated. GCNT3 is a gene directly linked with mucin-type biosynthesis, because it codes a glycosyltransferase that can synthesize all known mucin beta 6 N-acetylglucosaminides [50].The reduced expression of all mucin-type or mucin-related protein-encoding genes through the in vitro culture may be connected with the absence of an embryo in the in vitro long-term culture conditions of the cells, because it has been suggested that mucins are expressed during the peri-implantation period in the uterus in vivo [51].
RSAD2 is a member of the S-adenosyl-L-methionine (SAM) super family of enzymes and a crucial factor in cellular antiviral response and innate immune signaling, and it was significantly downregulated on day 7 [52]. A transcriptional profiling of the ovine urine endometrium conducted by Song et al. [53] showed an increased transcript of RSAD2 with other related genes between days 12 and 16 of pregnancy, but not of the estrous cycle. Schmaltz-Panneau’s experimental data [54] of the in vitro co-culture of early bovine embryos with bovine oviduct epithelial cells (BOECs) experiment show an increased expression of RSAD2, as opposed to our results relating to the single culture of porcine OECs.
As we indicated earlier, FGFBP1, SERPINB2, and SERPINB5 expression was also downregulated. FGFBP1 encodes a fibroblast growth factor binding protein 1, and it plays a critical role in various cell mechanisms and cell–cell signaling, such as proliferation, differentiation, and migration, by binding to fibroblast growth factors [55,56,57]. Lee et al. suggested that the primary function of FGFBP1 may be connected to sustaining cellular survival throughout embryogenesis [58]. SERPINB2, known also as plasminogen activator inhibitor type 2 (PAI)-2, is predicted to be involved in the negative regulation of endopeptidase activity and is one of the most upregulated proteins after cellular stress [59]. Its expression is acutely upregulated in pregnancy and inflammation an infection state [60], and was also demonstrated during the in vitro culture of porcine granulosa cells (pGCs) [39], while a decreased expression SERPINB2 was noted during the culture of porcine OECs [17]. Serpin 5, also known as maspin (encoded by SERPINB5), is commonly described as a tumor and metastasis suppressor [61,62]. Its expression, present in human mammary epithelial cells and downregulated during cancer progression [63], has been described. The main biological roles of maspin are cell adhesion, migration, control of gene expression and oxidative stress response [64]; these functions are therefore due to the expression of SERPINB5.
From the genes analyzed in day 15 of cultivation, two genes were significantly upregulated—CHRDL1 and COL1A2. COL1A2 (collagen type I alpha 2 chain) belongs to the “extracellular matrix organization”. CHRDL1 is another gene contributing to the neuronal differentiation of neural stem cells in the brain and may play a role in embryonic bone formation. This gene, belonging to the “BMP signalling pathway” GO group, antagonizes the function of bone morphogenetic protein 4 (BMP4) by binding to it and preventing its interaction with receptors. Due to this role, CHRDL1 has an important role in regulating retinal angiogenesis through the modulation of BMP4 actions in endothelial cells [65]. Wang et al. [66] suggested that CHRDL1, with the interaction of other genes (TWSG1 and CHRD) in ovarian granulosa cells, may modulate the intra-ovarian functions of the TGF-β superfamily members, such as the control of progesterone production. A similar conclusion was indicated in earlier research conducted on porcine oocytes [67]. The upregulation of CHRDL1 may be connected to its function in early stages of folliculogenesis and oogenesis regulation in pigs. The observed overexpression of CHRDL1 in this study may be connected with the preparation of oviductal cells for maternal–oocyte interactions. The expression of gene-encoding lysyl oxidase was upregulated in all the analyzed intervals in the presented study. LOX is related to the GO group “collagen fibril organization”, which links to extracellular matrix formation in pOECs.
Interestingly, up to day 30 of in vitro cell culture, the most overexpressed gene was LUM (lumican), which is similar to the results of Kedem et al. [68] with mRNA samples from mural (MGCs) and cumulus granulosa cells. LUM expression was induced in high-density cell cultures in a confluence-dependent manner. Its role might be described as a new potential ovulatory marker during the preovulatory period up until ovulation, as well as in endometriosial infertility [68,69].
EpCAM was the gene that was the most downregulated up to the 30-day interval. EpCAM is an antigen expressed in most normal epithelial cells, numerous stem and progenitor-type cells, and most carcinomas, and is highly overexpressed in cancer-initiating cell types [70]. In carcinoma cells, EpCAM takes part in cell adhesion, proliferation, migration, stemness, and epithelial-to-mesenchymal transition (EMT) [71,72], showing its multifunctional transmembrane protein role. Additionally, it plays an important role in embryonic stem cells proliferation and differentiation, and with other molecules is responsible for maintaining the murine embryonic stem cell’s phenotype [73]. The decreased expression of EpCAM at day 30 of in vitro culture in our study might be in response to EMT induction, because it seems that the changes in cell morphology require the downregulation of EpCAM and E-cadherin [74,75].
This work was performed on the basis of standard methods used in molecular biology. The results presented are a contribution to an even better understanding of the processes occurring in the fallopian tube. Those may in the future contribute to a better understanding of pathological processes occurring within the female reproductive system.
4. Materials and Methods
4.1. Tissue Collection
Porcine oviducts were collected at the abattoir from local crossbred landrace gilts (n = 20) at an age of approximately nine months and weight of 98 kg. Pigs were kept in the same conditions, in accordance with the standards of breeding and feeding of pigs. The animals were kept in accordance with the commonly acknowledged technology for this particular group, with attention paid to their well-being. Animals were checked daily for estrus behavior and were slaughtered after reaching the anestrus phase of the estrus cycle. The oviducts were excised within 30 min of slaughter. The collected tissues were immediately transported to the laboratory and kept in an isolated container. The use of animals for the purpose of scientific research complied with all the relevant Polish national and European Union regulations and institutional policies for the care and use of animals.
4.2. Primary Long-Term Cell Culture of Porcine Oviductal Epithelial Cells (POECs)
In this study, the establishing of the long-term POECs culture in vitro was based on the earlier described protocol by Kulus et al. [13]. Oviducts were washed twice in Dulbecco’s phosphate buffered saline (DPBS; 137 mM NaCl; 27 mM KCl; 10 mM Na2HPO4; 2 mM KH2PO4; pH 7.4). Epithelial cells were surgically removed using sterile blades and then enzymatically digested for 1 h at 37 °C with 1mg/mL collagenase I (Sigma Aldrich, St. Louis, MO, USA) in Dulbecco’s modified Eagle’s medium (DMEM; Sigma Aldrich, St. Louis, MO, USA, Merck KGaA, Darmstadt, Germany). The cell suspension obtained from this digestion was filtered through a 40 µm strainer to remove blood and aggregated cells and centrifuged for 10 min at 200× g at room temperature (RT). Next, the resulting pellet was washed in PBS and centrifuged again at 200× g for 10 min at RT. After rinsing with PBS, the POECs were incubated for another 10 min at 37 °C with 0.5% Trypsin/EDTA (Sigma Aldrich, St. Louis, MO, USA, Merck KGaA, Darmstadt, Germany). After a time, the reaction was stopped with fetal calf serum (FCS; Sigma-Aldrich, St. Louis, MO, USA), and cells were filtered and centrifuged again at 200× g for 10 min at RT. The final cell pellet was resuspended in DMEM supplemented with 10% FCS, 100 U/mL penicillin, 100 µg/mL streptomycin, and 1 µg/mL amphotericin B, and the cells were cultured up to 30 days at 37 °C in a humidified atmosphere of 5% CO2. The cells’ vitality used for primary culture was rated 90%. Initially, the cells proliferated very slowly, but after 7 days of culture, they reached similar parameters of growth and density. The culture medium was changed every three days. Once the OECs reached a confluency of around 70–80%, they were passaged to another culture dish at a seeding density of 2 × 10⁴ cells/cm2. Cells in the culture were detached from the bottom of the culture bottle by 1–2 min incubation with 0.5% Trypsin/EDTA (Sigma Aldrich, St. Louis, MO, USA, Merck KGaA, Darmstadt, Germany). The proliferation rate of the cells corresponded to the days of cell collection. The cultures were passaged three times. Samples of cells from the 7th day of culture were collected as a culture sample defined as a short-term culture; the cells on 15th day of culture showed the effects of the first passage, and the cells on the 30th day of culture were comparable after three passages. The dynamic changes in cell morphology were monitored under an inverted microscope (relief contrast) throughout the in vitro primary cultivation of the cells.
4.3. RNA Isolation from Porcine Oviductal Epithelial Cells (POECs)
The total RNA from the POECs were isolated using TRI Reagent (Sigma Aldrich, St. Louis, MO, USA) and an RNeasy MinElute Cleanup Kit (Qiagen, Hilden, Germany). The RNA for transcriptome study was collected from two independent replicates for each experimental variant: (1) control—24 h, (2) 7-day, (3) 15-day, and (4) 30-day interval of experiments. Each replicate contained pooled RNA from three independent experiments. The amount of total mRNA was determined from measuring the optical density (OD) at 260 nm, and the RNA purity was estimated using the 260/280 nm absorption ratio on a NanoDrop™ spectrophotometer (Thermo Fisher Scientific, Inc., Waltham, MA, USA). Samples purity was obtained if the ratio was >1.8. RNA integrity and quality were checked on a Bioanalyzer 2100 (Agilent Technologies, Inc., Santa Clara, CA, USA). The resulting RNA integrity numbers were between 8.5–10. The RNA in each sample was diluted to a concentration of 100 ng/μL with an OD260/OD280ratio of 1.8–2.0. For each sample, 100 ng RNA was taken for the microarray analysis.
4.4. Microarray Expression Study
A cDNA synthesis was made from total RNA (100 ng) during a two-step reaction, biotin labeling and fragmentation according to the manufacturer’s protocol (GeneChip® WT Plus Reagent Kit, Affymetrix, Santa Clara, CA, USA). Next, the biotin-labeled cDNA was hybridized to the Affymetrix® PorGene 1.1 ST Array Strip (45 C/20 h) and stained by the Affymetrix GeneAtlas Fluidcs Station of GeneAtlas System. The Imaging Station of the GeneAtlas System (Affymetrix, Santa Clara, CA, USA) has been used for microarrays scanning. Moreover, the Affymetrix GeneAtlas Operating System was used for analyzing the performed results and evaluation of the quality of gene expression data in accordance with the software’s quality control criteria.
4.5. Microarray Data Analysis
The microarray study was carried out according to the previously described procedure [76,77]. All bioinformatics analyses have been performed by using BioConductor software (release 3.15, https://bioconductor.org, accessed on 1 April 2024) with relevant BioConductor packages, functioning as an extension of the R programming language (v4.2.1; R Core Team 2022).
For the normalization, background correction, and calculation of the expression values of the analyzed genes, the Robust Multiarray Average (RMA) normalization algorithm implement in the “Affy” library was applied [78]. To show the total number of up- and downregulated genes, a principal component analysis (PCA) of the filtered data set was performed and visualized using the “factoextra” library [79].
The DAVID (Database for Annotation, Visualization, and Integrated Discovery) bioinformatics tool has been used for the functional annotation and clusterization of differentially expressed genes (DEGs) [80]. The established cut-off criteria for DEGs were based on the differences in the absolute value from an expression fold change greater than 2. Further, the expressed genes were assigned to relevant GO terms, with the subsequent selection of significantly enriched GO terms using the GO BP DIRECT database. Gene symbols of differentially expressed genes were uploaded to DAVID by the “RDAVIDWebService” BioConductor package [81], where DEGs were assigned to relevant Gene Ontology (GO) terms, with the subsequent selection of significantly enriched GO terms from the GO BP FAT database. The p-values of selected GO terms were corrected using the Benjamini–Hochberg correction; DEGs from each comparison were visualized by the hierarchic clustering of differentially expressed genes as a heatmap using the “ComplexHeatmap” library [82,83].
4.6. mRNA Co-Expression Analysis—Clustering of mRNA Data
A set of mRNAs expression data whose expression was significantly regulated in at least one of the compared pairs were selected for analysis. To determine the optimal number of clusters, a repeatedly calculated sum of squared error (SSE) measurement with an increasing number of clusters was applied. The K-means algorithm was used for the clustering of mRNA expression profiles (according to the manual from: https://2-bitbio.com/2017/10/clustering-rnaseq-data-using-k-means.html (accessed on 1 April 2024). Clustering was performed on the average expressions from each experimental group using the “kmeans” core R function.
For each cluster, the centroid values and core mRNA sets were determined. Core mRNAs were generated by filtering the fitting level of mRNAs expression to centroid values, where the mRNA expression profile displayed a high correlation to centroids for a given cluster (correlation > 0.8). The mean expression, normalized expression values, and fold changes for the core mRNA of each cluster were visualized as a heatmap using the “Complexheatmap” package [83]. Next, the DAVID bioinformatic tool was used to identify the functional annotation and clusterization of the target genes [84,85].
5. Conclusions
Each molecular factor identified during in vitro studies, and which could be potentially significant and used as a supplement in assisted reproductive techniques, must be evaluated by the analysis of signaling pathways. Currently, the domestic pig (Sus scrofa) is one of the best models used by researchers because of its close association with human physiology.
The general changes in transcriptomic profiles in POECs genes belong to ontological groups related to different processes occurring within epithelial oviductal cells. Some of the genes are specific to the reproductive system and may have a potential role as novel biomarkers of porcine oviductal epithelial cells, but most corresponded to cellular processes in all type of cells. The current results represent an essential next step in understanding the regulatory processes occurring in the mammalian oviduct.
Author Contributions
Conceptualization: B.K. and W.Z.; investigation: M.B., K.K. and D.B.; formal analysis: W.Z., W.K., P.M. and P.D.; data curation: W.Z., D.B., W.K. and M.F.; writing—original draft: W.Z., M.B. and K.K.; validation: M.B.; visualization: M.B. and K.K.; software: M.B.; writing—review and editing: W.Z., W.K., M.F., A.B., P.M., M.P.-O., M.Z. and B.K.; supervision: P.M., W.K., A.B., P.D. and B.K.; project administration: A.B., P.M., P.A. and M.P.-O.; funding acquisition: P.M., P.A. and B.K.; resources: W.K. and D.B. All authors have read and agreed to the published version of the manuscript.
Funding
This work was partially supported by the USDA National Institute of Food and Agriculture, Hatch project nc07082.
Institutional Review Board Statement
Not applicable.
Informed Consent Statement
Not applicable.
Data Availability Statement
The data presented in this study are available on request from the corresponding author.
Conflicts of Interest
The authors declare no conflicts of interests.
References
- Avilés, M.; Coy, P.; Rizos, D. The oviduct: A key organ for the success of early reproductive events. Anim. Front. 2015, 5, 25–31. [Google Scholar] [CrossRef]
- Rybska, M.; Knap, S.; Jankowski, M.; Jeseta, M.; Bukowska, D.; Antosik, P.; Nowicki, M.; Zabel, M.; Kempisty, B.; Jaśkowski, J.M. Characteristic of factors influencing the proper course of folliculogenesis in mammals. Med. J. Cell Biol. 2018, 6, 33–38. [Google Scholar] [CrossRef]
- Kölle, S.; Hughes, B.; Steele, H. Early embryo-maternal communication in the oviduct: A review. Mol. Reprod. Dev. 2020, 87, 650–662. [Google Scholar] [CrossRef]
- Kölle, S.; Reese, S.; Kummer, W. New aspects of gamete transport, fertilization, and embryonic development in the oviduct gained by means of live cell imaging. Theriogenology 2010, 73, 786–795. [Google Scholar] [CrossRef]
- Li, S.; Winuthayanon, W. Oviduct: Roles in fertilization and early embryo development. J. Endocrinol. 2017, 232, R1–R26. [Google Scholar] [CrossRef] [PubMed]
- Sun, S.; Shin, J.; Jang, J.; Hwang, S.; Kim, J.; Kong, J.; Yang, H. 17Beta-Estradiol Regulates NUCB2/ Nesfatin-1 Expression in MouseOviduct. Dev. Reprod. 2020, 24, 43. [Google Scholar] [CrossRef] [PubMed]
- Chen, S.; Palma-Vera, S.E.; Kempisty, B.; Rucinski, M.; Vernunft, A.; Schoen, J. In Vitro Mimicking of Estrous Cycle Stages: Dissecting the Impact of Estradiol and Progesterone on Oviduct Epithelium. Endocrinology 2018, 159, 3421–3432. [Google Scholar] [CrossRef]
- Barton, B.E.; Herrera, G.G.; Anamthathmakula, P.; Rock, J.K.; Willie, A.M.; Harris, E.A.; Takemaru, K.I.; Winuthayanon, W. Roles of steroid hormones in oviductal function. Reproduction 2020, 159, R125. [Google Scholar] [CrossRef]
- Wu, E.; Vastenhouw, N.L. From mother to embryo: A molecular perspective on zygotic genome activation. Curr. Top. Dev. Biol. 2020, 140, 209–254. [Google Scholar] [CrossRef]
- Duranthon, V.; Watson, A.J.; Lonergan, P. Preimplantation embryo programming: Transcription, epigenetics, and culture environment. Reproduction 2008, 135, 141–150. [Google Scholar] [CrossRef]
- Leese, H.J.; Hugentobler, S.A.; Gray, S.M.; Morris, D.G.; Sturmey, R.G.; Whitear, S.L.; Sreenan, J.M. Female reproductive tract fluids: Composition, mechanism of formation and potential role in the developmental origins of health and disease. Reprod. Fertil. Dev. 2008, 20, 1–8. [Google Scholar] [CrossRef]
- Bauersachs, S.; Wolf, E. Transcriptome analyses of bovine, porcine and equine endometrium during the pre-implantation phase. Anim. Reprod. Sci. 2012, 134, 84–94. [Google Scholar] [CrossRef] [PubMed]
- Kulus, M.; Kranc, W.; Wojtanowicz-markiewicz, K.; Celichowski, P.; Światły-Błaszkiewicz, A.; Matuszewska, E.; Sujka-kordowska, P.; Konwerska, A.; Zdun, M.; Bryl, R.; et al. New Gene Markers Expressed in Porcine Oviductal Epithelial Cells Cultured Primary In Vitro Are Involved in Ontological Groups Representing Physiological Processes of Porcine Oocytes. Int. J. Mol. Sci. 2021, 22, 2082. [Google Scholar] [CrossRef]
- Hasan, M.M.; Viil, J.; Lättekivi, F.; Ord, J.; Reshi, Q.U.A.; Jääger, K.; Velthut-Meikas, A.; Andronowska, A.; Jaakma, Ü.; Salumets, A.; et al. Bovine Follicular Fluid and Extracellular Vesicles Derived from Follicular Fluid Alter the Bovine Oviductal Epithelial Cells Transcriptome. Int. J. Mol. Sci. 2020, 21, 5365. [Google Scholar] [CrossRef] [PubMed]
- Danesh Mesgaran, S.; Sharbati, J.; Einspanier, R.; Gabler, C. mRNA expression pattern of selected candidate genes differs in bovine oviductal epithelial cells in vitro compared with the in vivo state and during cell culture passages. Reprod. Biol. Endocrinol. 2016, 14, 44. [Google Scholar] [CrossRef]
- Kulus, M.; Józkowiak, M.; Kulus, J.; Popis, M.; Borowiec, B.; Stefańska, K.; Celichowski, P.; Nawrocki, M.J.; Bukowska, D.; Brüssow, K.P.; et al. “Cell cycle process”, “cell division” and “cell proliferation” belong to ontology groups highly regulated during long–term culture of porcine oviductal epithelial cells. Med. J. Cell Biol. 2019, 7, 15–24. [Google Scholar] [CrossRef]
- Kulus, M.; Kulus, J.; Popis, M.; Borowiec, B.; Stefańska, K.; Celichowski, P.; Nawrocki, M.J.; Brüssow, K.P.; Kempisty, B.; Jeseta, M.; et al. “Cell cycle” and ‘cell death’-Related genes are differentially expressed during long—Term in vitro real-time cultivation of porcine oviductal epithelial cells. Med. J. Cell Biol. 2019, 7, 90–99. [Google Scholar] [CrossRef]
- Chen, S.; Einspanier, R.; Schoen, J. Long-term culture of primary porcine oviduct epithelial cells: Validation of a comprehensive in vitro model for reproductive science. Theriogenology 2013, 80, 862–869. [Google Scholar] [CrossRef] [PubMed]
- Chamier-Gliszczyńska, A.; Brazert, M.; Sujka-Kordowska, P.; Popis, M.; Ozegowska, K.; Stefańska, K.; Kocherova, I.; Celichowski, P.; Kulus, M.; Bukowska, D.; et al. Genes involved in angiogenesis and circulatory system development are differentially expressed in porcine epithelial oviductal cells during long-term primary in vitro culture—A transcriptomic study. Med. J. Cell Biol. 2018, 6, 163–173. [Google Scholar] [CrossRef]
- Stefańska, K.; Kocherova, I.; Knap, S.; Kulus, M.; Celichowski, P.; Jeseta, M. The genes regulating maintenance of cellular protein location are differentially expressed in porcine epithelial oviductal cells during longterm in vitro cultivation. Med. J. Cell Biol. 2019, 7, 77–85. [Google Scholar] [CrossRef]
- Stefańska, K.; Knap, S.; Kulus, M.; Kocherova, I.; Celichowski, P.; Jeseta, M.; Machatkova, M.; Bukowska, D.; Antosik, P. Differential expression pattern of genes involved in oxygen metabolism in epithelial oviductal cells during primary in vitro culture. Med. J. Cell Biol. 2019, 7, 66–76. [Google Scholar] [CrossRef]
- Bendarska-Czerwińska, A.; Zmarzły, N.; Morawiec, E.; Panfil, A.; Bryś, K.; Czarniecka, J.; Ostenda, A.; Dziobek, K.; Sagan, D.; Boroń, D.; et al. Endocrine disorders and fertility and pregnancy: An update. Front. Endocrinol. 2023, 13, 970439. [Google Scholar] [CrossRef] [PubMed]
- Medeiros, F.; Muto, M.G.; Lee, Y.; Elvin, J.A.; Callahan, M.J.; Feltmate, C.; Garber, J.E.; Cramer, D.W.; Crum, C.P. The tubal fimbria is a preferred site for early adenocarcinoma in women with familial ovarian cancer syndrome. Am. J. Surg. Pathol. 2006, 30, 230–236. [Google Scholar] [CrossRef] [PubMed]
- Kim, J.; Coffey, D.M.; Creighton, C.J.; Yu, Z.; Hawkins, S.M.; Matzuk, M.M. High-grade serous ovarian cancer arises from fallopian tube in a mouse model. Proc. Natl. Acad. Sci. USA 2012, 109, 3921–3926. [Google Scholar] [CrossRef]
- Labidi-Galy, S.I.; Papp, E.; Hallberg, D.; Niknafs, N.; Adleff, V.; Noe, M.; Bhattacharya, R.; Novak, M.; Jones, S.; Phallen, J.; et al. High grade serous ovarian carcinomas originate in the fallopian tube. Nat. Commun. 2017, 8, 1093. [Google Scholar] [CrossRef]
- Kyo, S.; Ishikawa, N.; Nakamura, K.; Nakayama, K. The fallopian tube as origin of ovarian cancer: Change of diagnostic and preventive strategies. Cancer Med. 2020, 9, 421. [Google Scholar] [CrossRef] [PubMed]
- Monde’jarmonde’jar, I.; Acunã, O.S.; Izquierdo-Rico, M.J.; Coy, P.; Avile’s, M.A. The Oviduct: Functional Genomic and Proteomic Approach. Reprod. Domest. Anim. 2012, 47, 22–29. [Google Scholar] [CrossRef]
- Maillo, V.; Lopera-Vasquez, R.; Hamdi, M.; Gutierrez-Adan, A.; Lonergan, P.; Rizos, D. Maternal-embryo interaction in the bovine oviduct: Evidence from in vivo and in vitro studies. Theriogenology 2016, 86, 443–450. [Google Scholar] [CrossRef]
- Maillo, V.; Gaora, P.; Forde, N.; Besenfelder, U.; Havlicek, V.; Burns, G.W.; Spencer, T.E.; Gutierrez-Adan, A.; Lonergan, P.; Rizos, D. Oviduct-embryo interactions in cattle: Two-way traffic or a one-way street? Biol. Reprod. 2015, 92, 144–145. [Google Scholar] [CrossRef]
- White, K.L.; Hehnke, K.; Rickords, L.F.; Southern, L.L.; Thompson, D.L.; Wood, T.C. Early Embryonic Development in Vitro by Coculture with Oviductal Epithelial Cells in Pigs. Biol. Reprod. 1989, 41, 425–430. [Google Scholar] [CrossRef]
- Graf, A.; Krebs, S.; Heininen-Brown, M.; Zakhartchenko, V.; Blum, H.; Wolf, E. Genome activation in bovine embryos: Review of the literature and new insights from RNA sequencing experiments. Anim. Reprod. Sci. 2014, 149, 46–58. [Google Scholar] [CrossRef]
- Budna, J.; Celichowski, P.; Knap, S.; Jankowski, M.; Magas, M.; Nawrocki, M.J.; Ramlau, P.; Nowicki, A.; Rojewska, M.; Chermuła, B.; et al. Fatty acids related genes expression undergo substantial changes in porcine oviductal epithelial cells during long-term primary culture. Med. J. Cell Biol. 2018, 6, 39–47. [Google Scholar] [CrossRef]
- AmiGO 2: Term Details for “Cell Adhesion” (GO:0007155). Available online: https://amigo.geneontology.org/amigo/term/GO:0007155 (accessed on 16 March 2024).
- Croxatto, H.B. Physiology of gamete and embryo transport through the Fallopian tube. Reprod. Biomed. Online 2002, 4, 160–169. [Google Scholar] [CrossRef] [PubMed]
- Talbot, P.; Shur, B.D.; Myles, D.G. Cell adhesion and fertilization: Steps in oocyte transport, sperm-zona pellucida interactions, and sperm-egg fusion. Biol. Reprod. 2003, 68, 1–9. [Google Scholar] [CrossRef] [PubMed]
- D’Occhio, M.J.; Campanile, G.; Zicarelli, L.; Visintin, J.A.; Baruselli, P.S. Adhesion molecules in gamete transport, fertilization, early embryonic development, and implantation—Role in establishing a pregnancy in cattle: A review. Mol. Reprod. Dev. 2020, 87, 206–222. [Google Scholar] [CrossRef] [PubMed]
- Koch, C.M.; Joussen, S.; Schellenberg, A.; Lin, Q.; Zenke, M.; Wagner, W. Monitoring of cellular senescence by DNA-methylation at specific CpG sites. Aging Cell 2012, 11, 366–369. [Google Scholar] [CrossRef] [PubMed]
- Rubin, H. Cell aging in vivo and in vitro. Mech. Ageing Dev. 1997, 98, 1–35. [Google Scholar] [CrossRef] [PubMed]
- Kulus, M.; Kranc, W.; Sujka-Kordowska, P.; Mozdziak, P.; Jankowski, M.; Konwerska, A.; Kulus, J.; Bukowska, D.; Skowroński, M.; Piotrowska-Kempisty, H.; et al. The processes of cellular growth, aging, and programmed cell death are involved in lifespan of ovarian granulosa cells during short-term IVC—Study based on animal model. Theriogenology 2020, 148, 76–88. [Google Scholar] [CrossRef] [PubMed]
- Chermuła, B.; Kranc, W.; Jopek, K.; Budna-Tukan, J.; Hutchings, G.; Dompe, C.; Moncrieff, L.; Janowicz, K.; Józkowiak, M.; Jeseta, M.; et al. Human Cumulus Cells in Long-Term In Vitro Culture Reflect Differential Expression Profile of Genes Responsible for Planned Cell Death and Aging—A Study of New Molecular Markers. Cells 2020, 9, 1265. [Google Scholar] [CrossRef]
- Banliat, C.; Tsikis, G.; Labas, V.; Teixeira-Gomes, A.P.; Com, E.; Lavigne, R.; Pineau, C.; Guyonnet, B.; Mermillod, P.; Saint-Dizier, M. Identification of 56 Proteins Involved in Embryo–Maternal Interactions in the Bovine Oviduct. Int. J. Mol. Sci. 2020, 21, 466. [Google Scholar] [CrossRef]
- Pillai, V.V.; Weber, D.M.; Phinney, B.S.; Selvaraj, V. Profiling of proteins secreted in the bovine oviduct reveals diverse functions of this luminal microenvironment. PLoS ONE 2017, 12, e0188105. [Google Scholar] [CrossRef] [PubMed]
- Cebrian-Serrano, A.; Salvador, I.; García-Roselló, E.; Pericuesta, E.; Pérez-Cerezales, S.; Gutierrez-Adán, A.; Coy, P.; Silvestre, M.A. Effect of the Bovine Oviductal Fluid on In Vitro Fertilization, Development and Gene Expression of In Vitro-Produced Bovine Blastocysts. Reprod. Domest. Anim. 2013, 48, 331–338. [Google Scholar] [CrossRef]
- Pradeep, M.A.; Jagadeesh, J.; De, A.K.; Kaushik, J.K.; Malakar, D.; Kumar, S.; Dang, A.K.; Das, S.K.; Mohanty, A.K. Purification, sequence characterization and effect of goat oviduct-specific glycoprotein on in vitro embryo development. Theriogenology 2011, 75, 1005–1015. [Google Scholar] [CrossRef]
- Buhi, W.C. Characterization and biological roles of oviduct-specific, oestrogen-dependent glycoprotein. Reproduction 2002, 123, 355–362. [Google Scholar] [CrossRef] [PubMed]
- Zhang, N.; Mao, W.; Zhang, Y.; Huang, N.; Liu, B.; Gao, L.; Zhang, S.; Cao, J. The prostaglandin E2 receptor PTGER2 and prostaglandin F2α receptor PTGFR mediate oviductal glycoprotein 1 expression in bovine oviductal epithelial cells. J. Reprod. Dev. 2018, 64, 101–108. [Google Scholar] [CrossRef]
- Choudhary, S.; Kumaresan, A.; Kumar, M.; Chhillar, S.; Malik, H.; Kumar, S.; Kaushik, J.K.; Datta, T.K.; Mohanty, A.K. Effect of recombinant and native buffalo OVGP1 on sperm functions and in vitro embryo development: A comparative study. J. Anim. Sci. Biotechnol. 2017, 8, 69. [Google Scholar] [CrossRef]
- Nelson, R.N.; Chakravarthi, V.P.; Ratri, A.; Hong, X.; Gossen, J.A.; Christenson, L.K. Granulosa Cell Specific Loss of Adar in Mice Delays Ovulation, Oocyte Maturation and Leads to Infertility. Int. J. Mol. Sci. 2022, 23, 14001. [Google Scholar] [CrossRef] [PubMed]
- Moniaux, N.; Escande, F.; Batra, S.K.; Porchet, N.; Laine, A.; Aubert, J.P. Alternative splicing generates a family of putative secreted and membrane-associated MUC4 mucins. Eur. J. Biochem. 2000, 267, 4536–4544. [Google Scholar] [CrossRef]
- Yeh, J.C.; Ong, E.; Fukuda, M. Molecular cloning and expression of a novel beta-1, 6-N-acetylglucosaminyltransferase that forms core 2, core 4, and I branches. J. Biol. Chem. 1999, 274, 3215–3221. [Google Scholar] [CrossRef]
- Redzovic, A.; Laskarin, G.; Dominovic, M.; Haller, H.; Rukavina, D. Mucins help to avoid alloreactivity at the maternal fetal interface. Clin. Dev. Immunol. 2013, 2013, 542152. [Google Scholar] [CrossRef]
- Jang, J.S.; Lee, J.H.; Jung, N.C.; Choi, S.Y.; Park, S.Y.; Yoo, J.Y.; Song, J.Y.; Seo, H.G.; Lee, H.S.; Lim, D.S. Rsad2 is necessary for mouse dendritic cell maturation via the IRF7-mediated signaling pathway. Cell Death Dis. 2018, 9, 823. [Google Scholar] [CrossRef]
- Song, G.; Bazer, F.W.; Spencer, T.E. Pregnancy and interferon tau regulate RSAD2 and IFIH1 expression in the ovine uterus. Reproduction 2007, 133, 285–295. [Google Scholar] [CrossRef]
- Schmaltz-Panneau, B.; Cordova, A.; Dhorne-Pollet, S.; Hennequet-Antier, C.; Uzbekova, S.; Martinot, E.; Doret, S.; Martin, P.; Mermillod, P.; Locatelli, Y. Early bovine embryos regulate oviduct epithelial cell gene expression during in vitro co-culture. Anim. Reprod. Sci. 2014, 149, 103–116. [Google Scholar] [CrossRef] [PubMed]
- Huang, Y.; Qi, S.H.; Shu, B.; Chen, L.; Xie, J.L.; Xu, Y.B.; Liu, X.S. Fibroblast growth factor-binding protein facilitates the growth and migration of skin-derived precursors. J. Cutan. Med. Surg. 2011, 15, 201–209. [Google Scholar] [CrossRef] [PubMed]
- Abuharbeid, S.; Czubayko, F.; Aigner, A. The fibroblast growth factor-binding protein FGF-BP. Int. J. Biochem. Cell Biol. 2006, 38, 1463–1468. [Google Scholar] [CrossRef]
- Taetzsch, T.; Brayman, V.L.; Valdez, G. FGF binding proteins (FGFBPs): Modulators of FGF signaling in the developing, adult, and stressed nervous system. Biochim. Biophys. Acta (BBA) Mol. Basis Dis. 2018, 1864 Pt B, 2983–2991. [Google Scholar] [CrossRef]
- Lee, H.O.; Choe, H.; Seo, K.; Lee, H.; Lee, J.; Kim, J. Fgfbp1 is essential for the cellular survival during zebrafish embryogenesis. Mol. Cells 2010, 29, 501–507. [Google Scholar] [CrossRef]
- Lee, J.A.; Yerbury, J.J.; Farrawell, N.; Shearer, R.F.; Constantinescu, P.; Hatters, D.M.; Schroder, W.A.; Suhrbier, A.; Wilson, M.R.; Saunders, D.N.; et al. SerpinB2 (PAI-2) Modulates Proteostasis via Binding Misfolded Proteins and Promotion of Cytoprotective Inclusion Formation. PLoS ONE 2015, 10, e0130136. [Google Scholar] [CrossRef] [PubMed]
- Wyatt, A.R.; Cater, J.H.; Ranson, M. PZP and PAI-2: Structurally-diverse, functionally similar pregnancy proteins? Int. J. Biochem. Cell Biol. 2016, 79, 113–117. [Google Scholar] [CrossRef]
- Kim, J.; Jang, K.T.; Kim, K.H.; Park, J.W.; Chang, B.J.; Lee, K.H.; Lee, J.K.; Heo, J.S.; Choi, S.H.; Choi, D.W.; et al. Aberrant maspin expression is involved in early carcinogenesis of gallbladder cancer. Tumour Biol. 2010, 31, 471–476. [Google Scholar] [CrossRef]
- Sinha, K.K.; Vinay, J.; Parida, S.; Singh, S.P.; Dixit, M. Association and functional significance of genetic variants present in regulatory elements of SERPINB5 gene in gallbladder cancer. Gene 2022, 808, 145989. [Google Scholar] [CrossRef]
- Machowska, M.; Wachowicz, K.; Sopel, M.; Rzepecki, R. Nuclear location of tumor suppressor protein maspin inhibits proliferation of breast cancer cells without affecting proliferation of normal epithelial cells. BMC Cancer 2014, 14, 142. [Google Scholar] [CrossRef] [PubMed]
- Longhi, M.T.; Magalhães, M.; Reina, J.; Freitas, V.M.; Cella, N. EGFR Signaling Regulates Maspin/SerpinB5 Phosphorylation and Nuclear Localization in Mammary Epithelial Cells. PLoS ONE 2016, 11, e0159856. [Google Scholar] [CrossRef]
- Kane, R.; Godson, C.; O’Brien, C. Chordin-like 1, a bone morphogenetic protein-4 antagonist, is upregulated by hypoxia in human retinal pericytes and plays a role in regulating angiogenesis. Mol. Vis. 2008, 14, 1138. [Google Scholar] [PubMed]
- Wang, Y.W.; Wu, C.H.; Lin, T.Y.; Luo, C.W. Expression profiling of ovarian BMP antagonists reveals the potential interaction between TWSG1 and the chordin subfamily in the ovary. Mol. Cell. Endocrinol. 2021, 538, 111457. [Google Scholar] [CrossRef] [PubMed]
- Budna, J.; Rybska, M.; Ciesiółka, S.; Bryja, A.; Borys, S.; Kranc, W.; Wojtanowicz-Markiewicz, K.; Jeseta, M.; Sumelka, E.; Bukowska, D.; et al. Expression of genes associated with BMP signaling pathway in porcine oocytes before and after IVM—A microarray approach. Reprod. Biol. Endocrinol. 2017, 15, 43. [Google Scholar] [CrossRef]
- Kedem, A.; Ulanenko-Shenkar, K.; Yung, Y.; Youngster, M.; Avraham, S.; Yerushalmi, G.; Hourvitz, A. The Involvement of Lumican in Human Ovulatory Processes. Reprod. Sci. 2022, 29, 366–373. [Google Scholar] [CrossRef]
- Bonavina, G.; Taylor, H.S. Endometriosis-associated infertility: From pathophysiology to tailored treatment. Front. Endocrinol. 2022, 13, 1020827. [Google Scholar] [CrossRef] [PubMed]
- Imrich, S.; Hachmeister, M.; Gires, O. EpCAM and its potential role in tumor-initiating cells. Cell Adhes. Migr. 2012, 6, 30–38. [Google Scholar] [CrossRef]
- Keller, L.; Werner, S.; Pantel, K. Biology and clinical relevance of EpCAM. Cell Stress 2019, 3, 165. [Google Scholar] [CrossRef]
- Gires, O.; Pan, M.; Schinke, H.; Canis, M.; Baeuerle, P.A. Expression and function of epithelial cell adhesion molecule EpCAM: Where are we after 40 years? Cancer Metastasis Rev. 2020, 39, 969–987. [Google Scholar] [CrossRef]
- González, B.; Denzel, S.; Mack, B.; Conrad, M.; Gires, O. EpCAM is involved in maintenance of the murine embryonic stem cell phenotype. Stem Cells 2009, 27, 1782–1791. [Google Scholar] [CrossRef]
- van der Gun, B.T.F.; Melchers, L.J.; Ruiters, M.H.J.; de Leij, L.F.M.H.; McLaughlin, P.M.J.; Rots, M.G. EpCAM in carcinogenesis: The good, the bad or the ugly. Carcinogenesis 2010, 31, 1913–1921. [Google Scholar] [CrossRef] [PubMed]
- Brown, T.C.; Sankpal, N.V.; Gillanders, W.E. Functional Implications of the Dynamic Regulation of EpCAM during Epithelial-to-Mesenchymal Transition. Biomolecules 2021, 11, 956. [Google Scholar] [CrossRef] [PubMed]
- Stelcer, E.; Komarowska, H.; Jopek, K.; Żok, A.; Iżycki, D.; Malińska, A.; Szczepaniak, B.; Komekbai, Z.; Karczewski, M.; Wierzbicki, T.; et al. Biological response of adrenal carcinoma and melanoma cells to mitotane treatment. Oncol. Lett. 2022, 23, 120. [Google Scholar] [CrossRef]
- Budna, J.; Chachuła, A.; Kaźmierczak, D.; Rybska, M.; Ciesiółka, S.; Bryja, A.; Kranc, W.; Borys, S.; Zok, A.; Bukowska, D.; et al. Morphogenesis-related gene-expression profile in porcine oocytes before and after in vitro maturation. Zygote 2017, 25, 331–340. [Google Scholar] [CrossRef]
- Gautier, L.; Cope, L.; Bolstad, B.M.; Irizarry, R.A. affy--analysis of Affymetrix GeneChip data at the probe level. Bioinformatics 2004, 20, 307–315. [Google Scholar] [CrossRef]
- Szyszka, M.; Paschke, L.; Tyczewska, M.; Jopek, K.; Celichowski, P.; Milecka, P.; Sultanova, G.; Stelcer, E.; Malinska, A.; Malendowicz, L.K.; et al. Analysis of Transcriptome, Selected Intracellular Signaling Pathways, Proliferation and Apoptosis of LNCaP Cells Exposed to High Leptin Concentrations. Int. J. Mol. Sci. 2019, 20, 5412. [Google Scholar] [CrossRef] [PubMed]
- Gentleman, R.C.V. Genefilter: Genefilter: Methods for Filtering Genes from High-Throughput Experiments. R Package Version 1.74.1. Available online: https://bioconductor.org/packages/release/bioc/html/genefilter.html (accessed on 5 April 2023).
- Fresno, C.; Fernández, E.A. RDAVIDWebService: A versatile R interface to DAVID. Bioinformatics 2013, 29, 2810–2811. [Google Scholar] [CrossRef]
- Benjamini, Y.; Cohen, R. Weighted false discovery rate controlling procedures for clinical trials. Biostatistics 2017, 18, 91–104. [Google Scholar] [CrossRef]
- Gu, Z.; Eils, R.; Schlesner, M. Complex heatmaps reveal patterns and correlations in multidimensional genomic data. Bioinformatics 2016, 32, 2847–2849. [Google Scholar] [CrossRef]
- Dennis, G.; Sherman, B.T.; Hosack, D.A.; Yang, J.; Gao, W.; Lane, H.C.; Lempicki, R.A. DAVID: Database for Annotation, Visualization, and Integrated Discovery. Genome Biol. 2003, 4, R60. [Google Scholar] [CrossRef]
- Golkar-Narenji, A.; Antosik, P.; Nolin, S.; Rucinski, M.; Jopek, K.; Zok, A.; Sobolewski, J.; Jankowski, M.; Zdun, M.; Bukowska, D.; et al. Gene Ontology Groups and Signaling Pathways Regulating the Process of Avian Satellite Cell Differentiation. Genes 2022, 13, 242. [Google Scholar] [CrossRef] [PubMed]

Disclaimer/Publisher’s Note: The statements, opinions and data contained in all publications are solely those of the individual author(s) and contributor(s) and not of MDPI and/or the editor(s). MDPI and/or the editor(s) disclaim responsibility for any injury to people or property resulting from any ideas, methods, instructions or products referred to in the content. |
© 2024 by the authors. Licensee MDPI, Basel, Switzerland. This article is an open access article distributed under the terms and conditions of the Creative Commons Attribution (CC BY) license (https://creativecommons.org/licenses/by/4.0/).