
Mannan-Binding Lectin Is Associated with Inflammation and Kidney Damage in a Mouse Model of Type 2 Diabetes
 , , , and
Abstract
:1. Introduction
2. Results
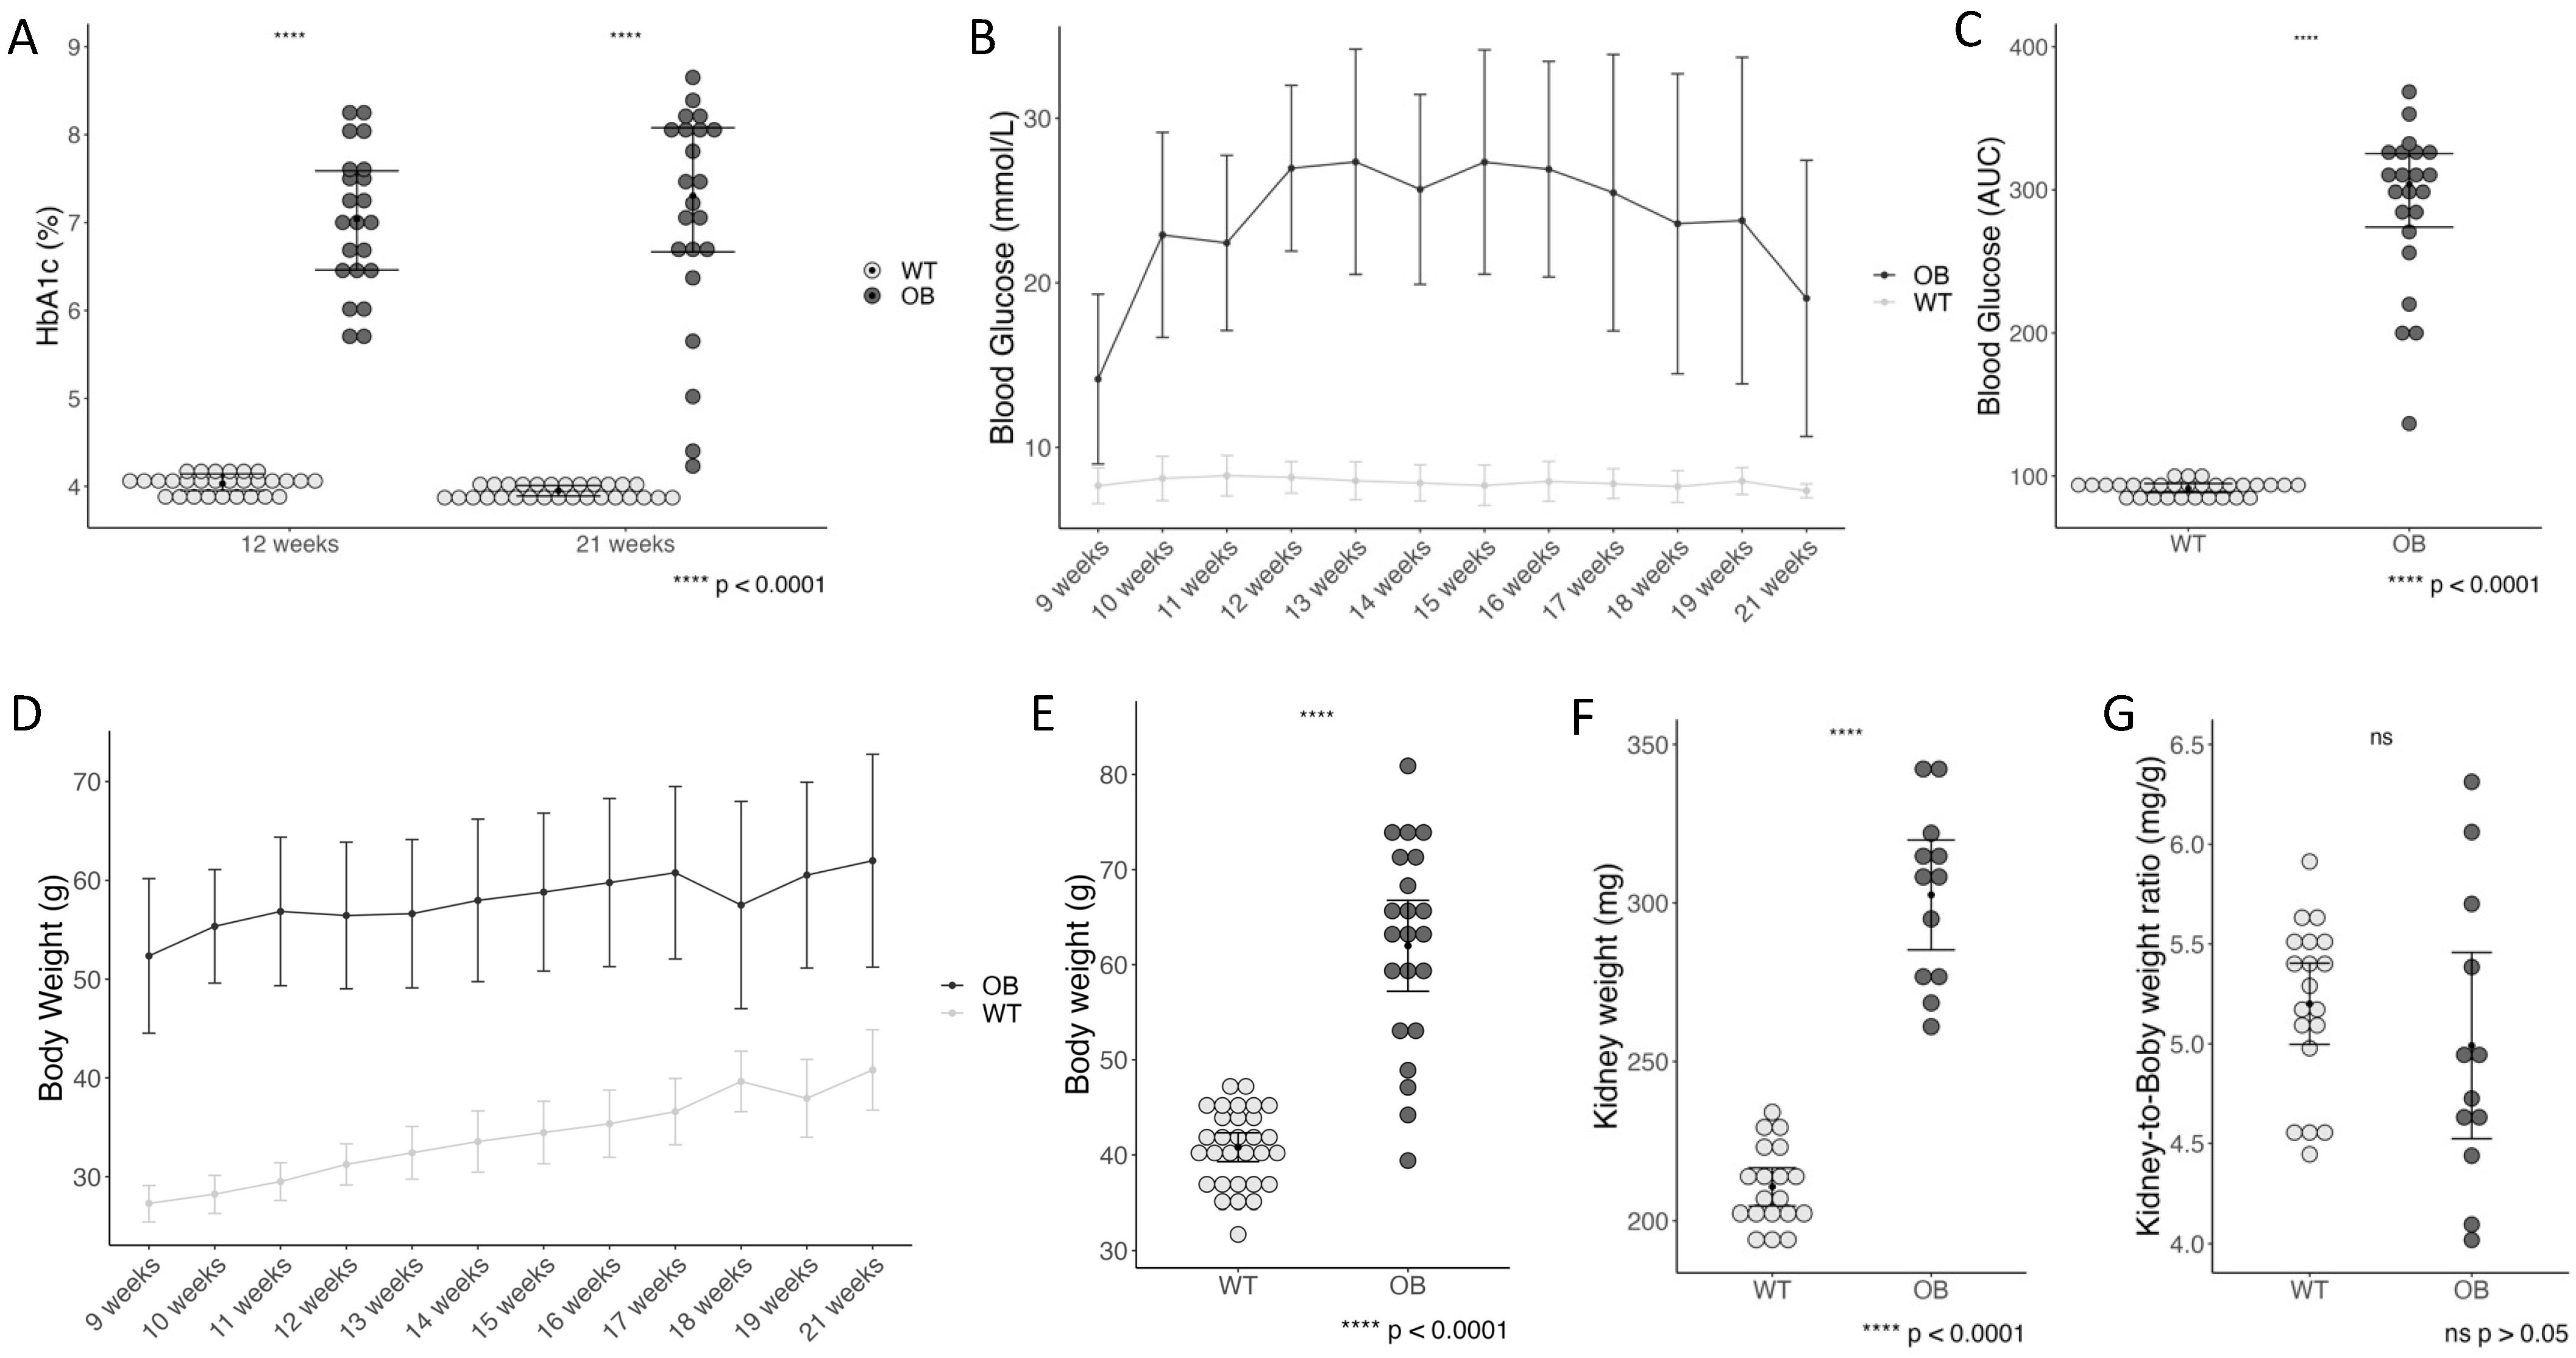
2.1. Diabetes Status, Kidney Weight, and Kidney-to-Body Weight Ratio
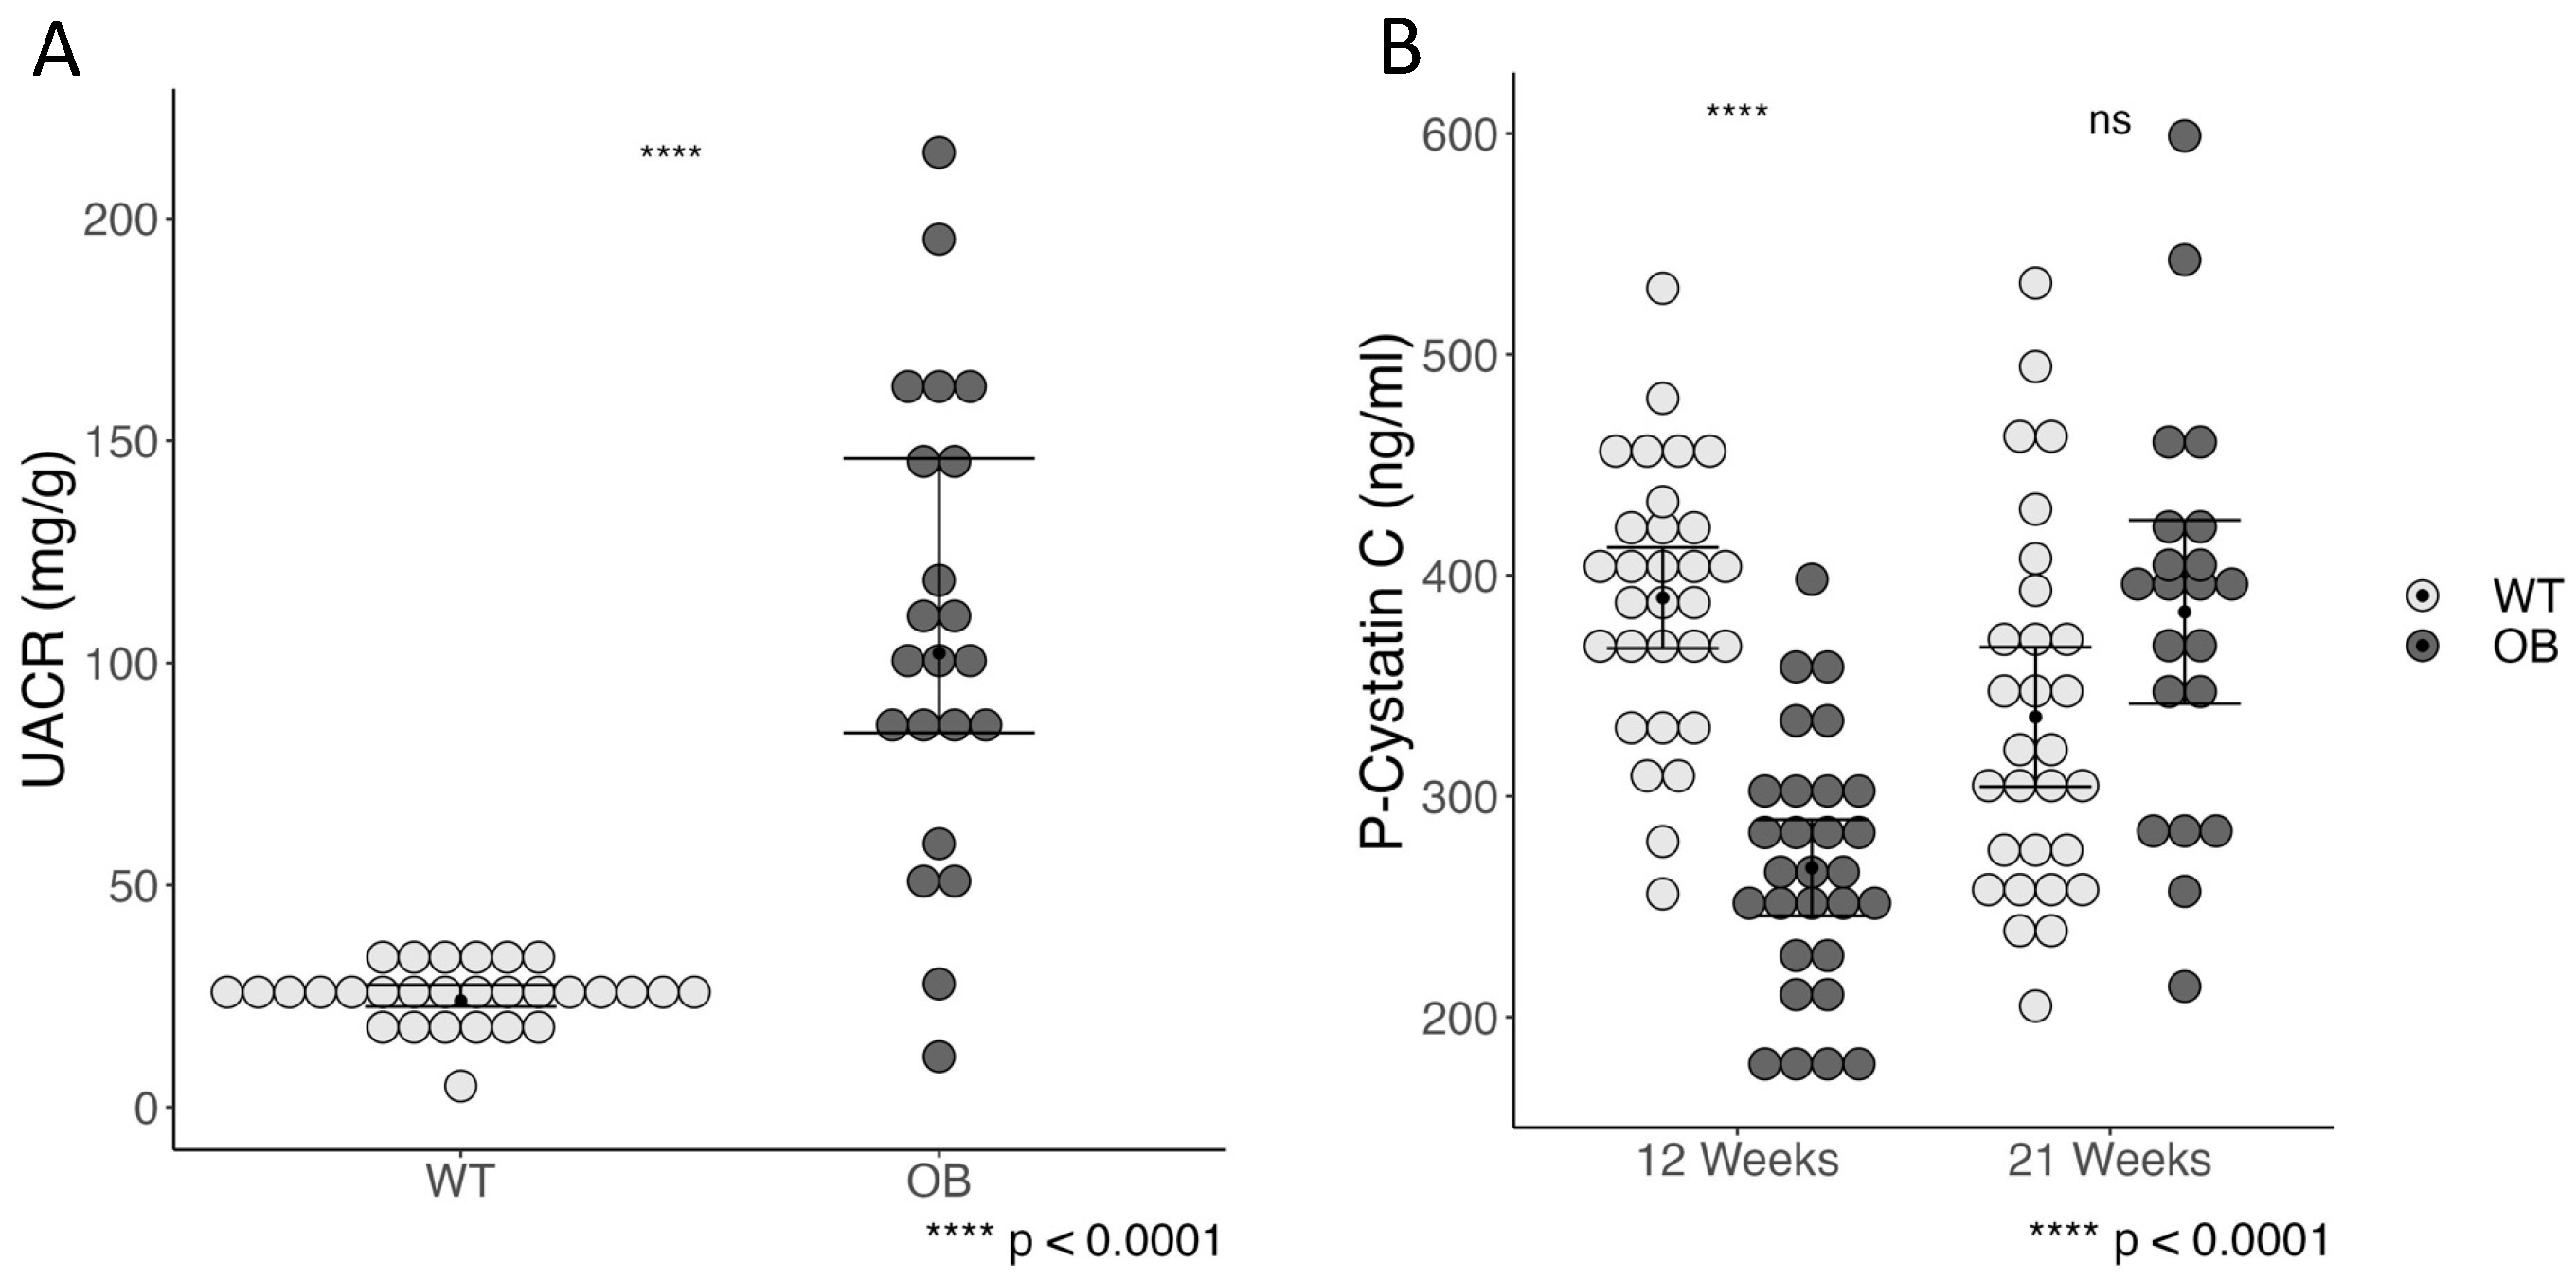
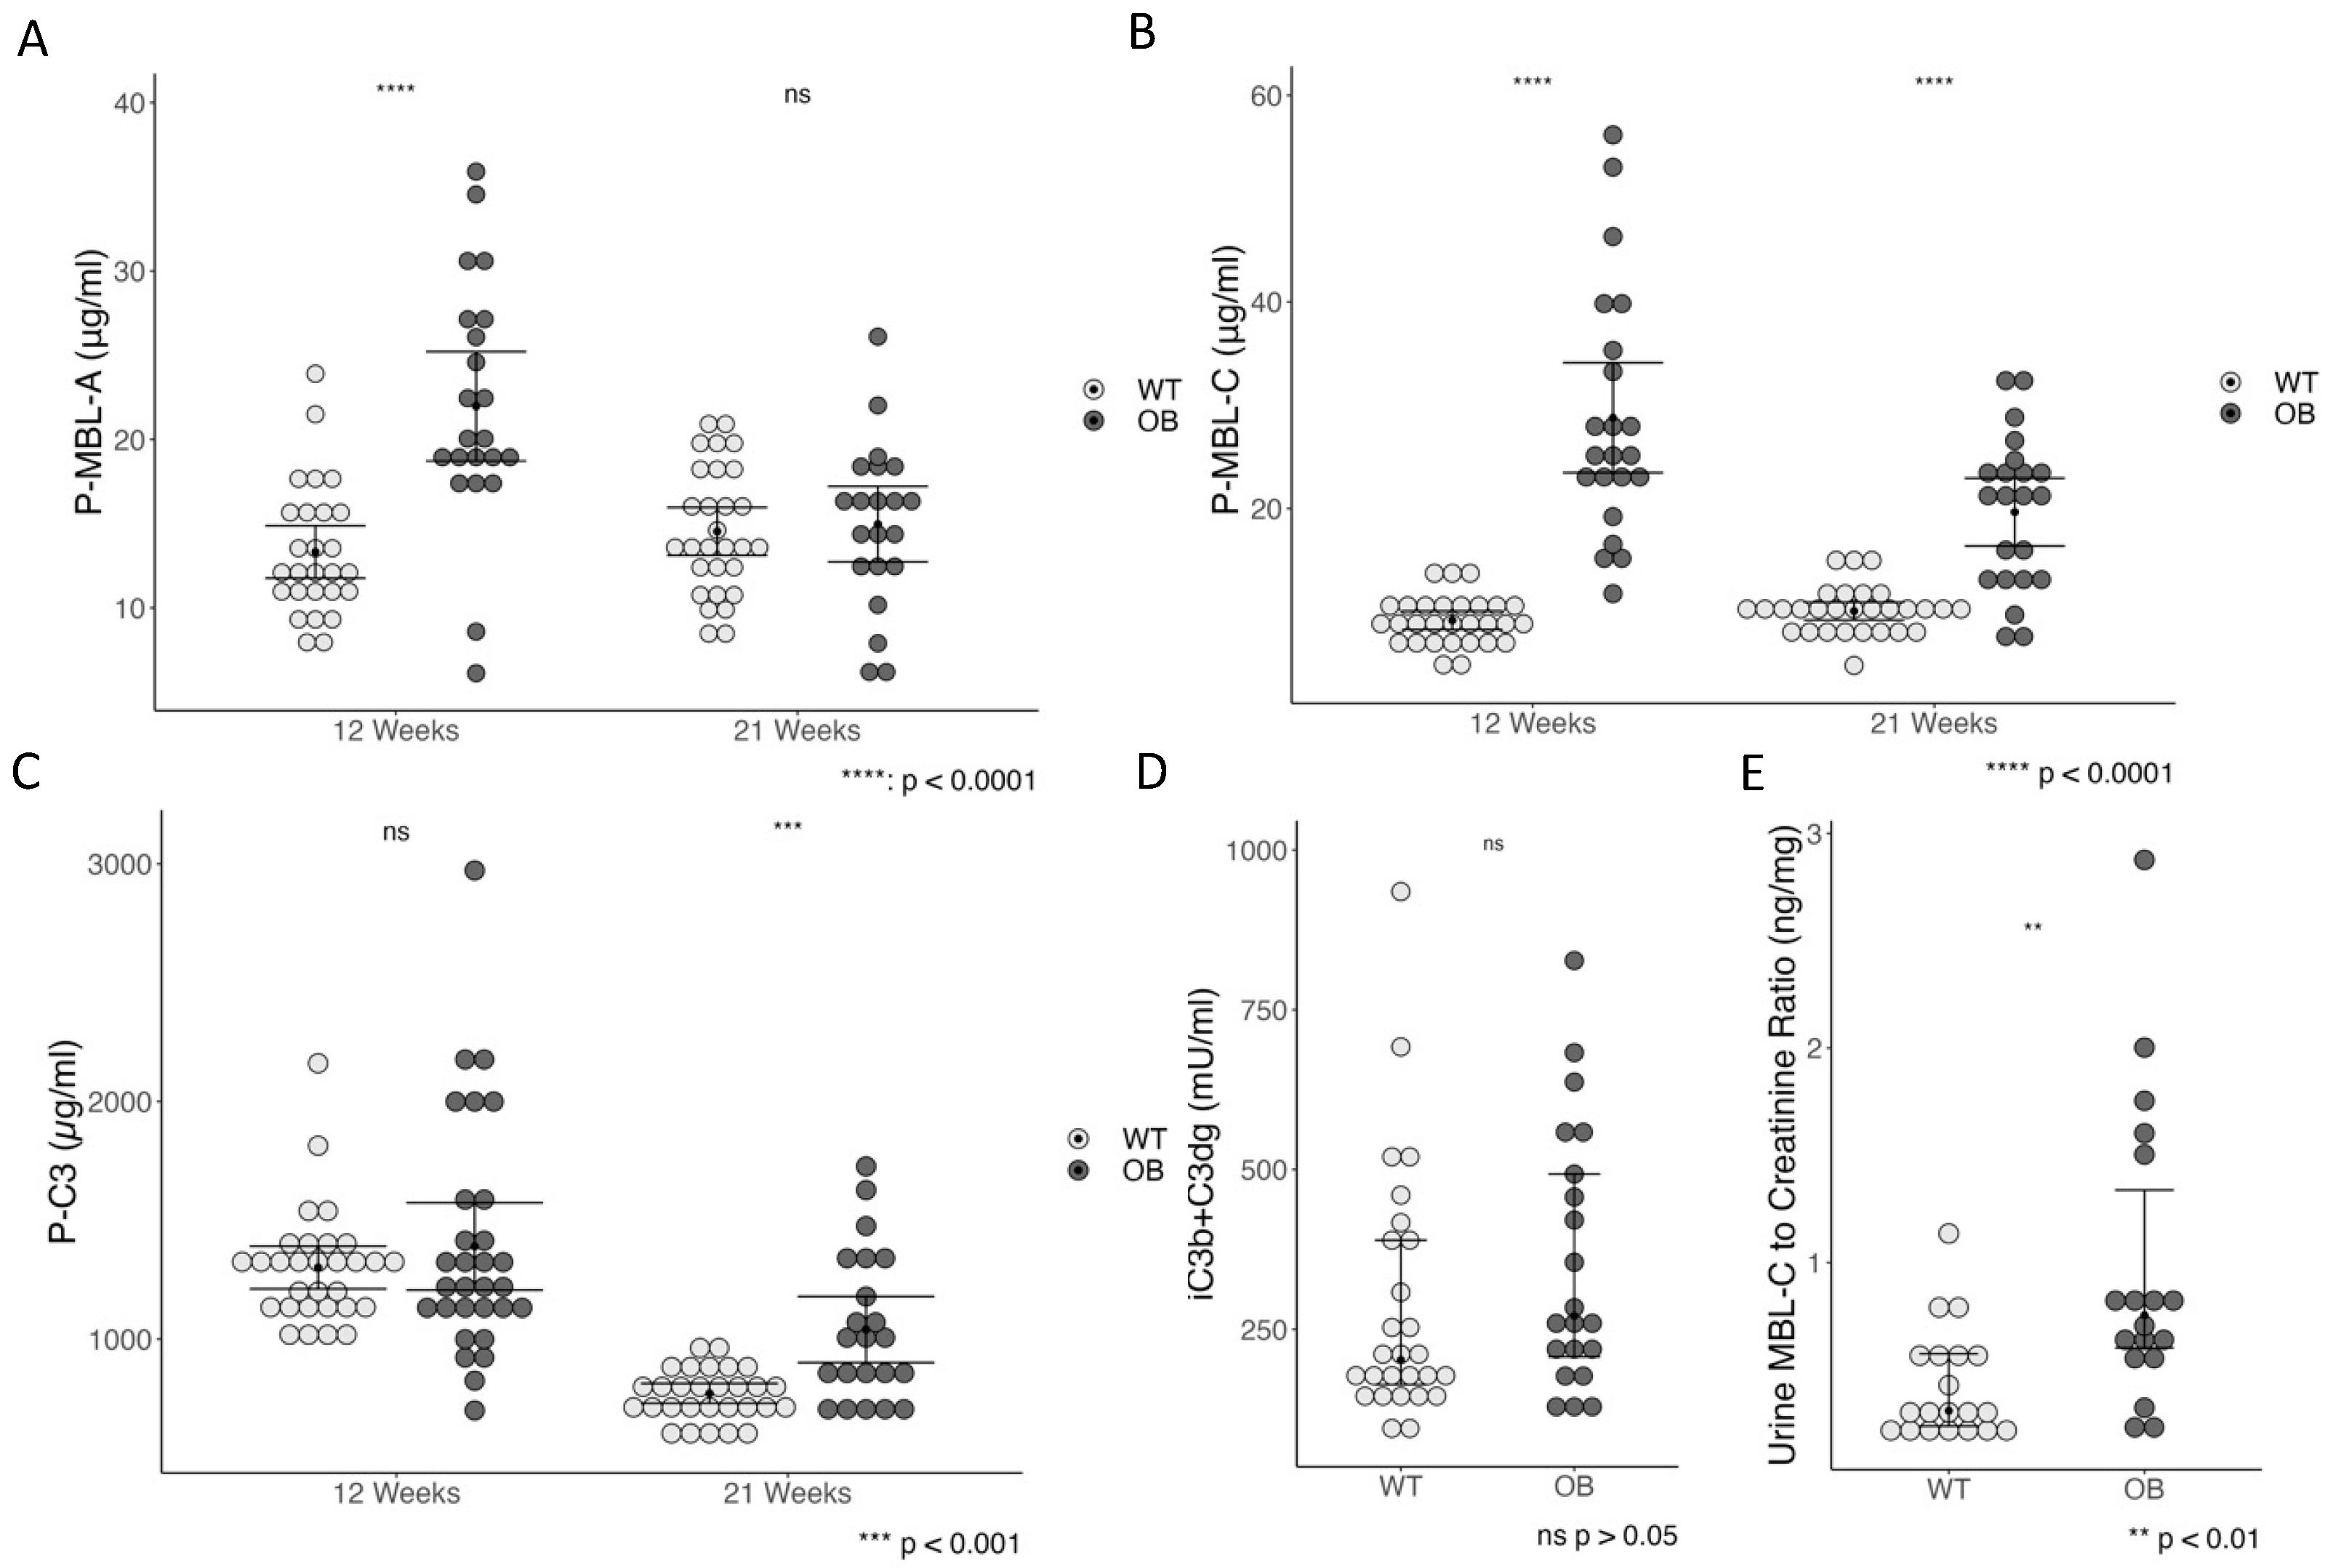
2.2. Albumin-to-Creatinine Ratio and Plasma Cystatin C
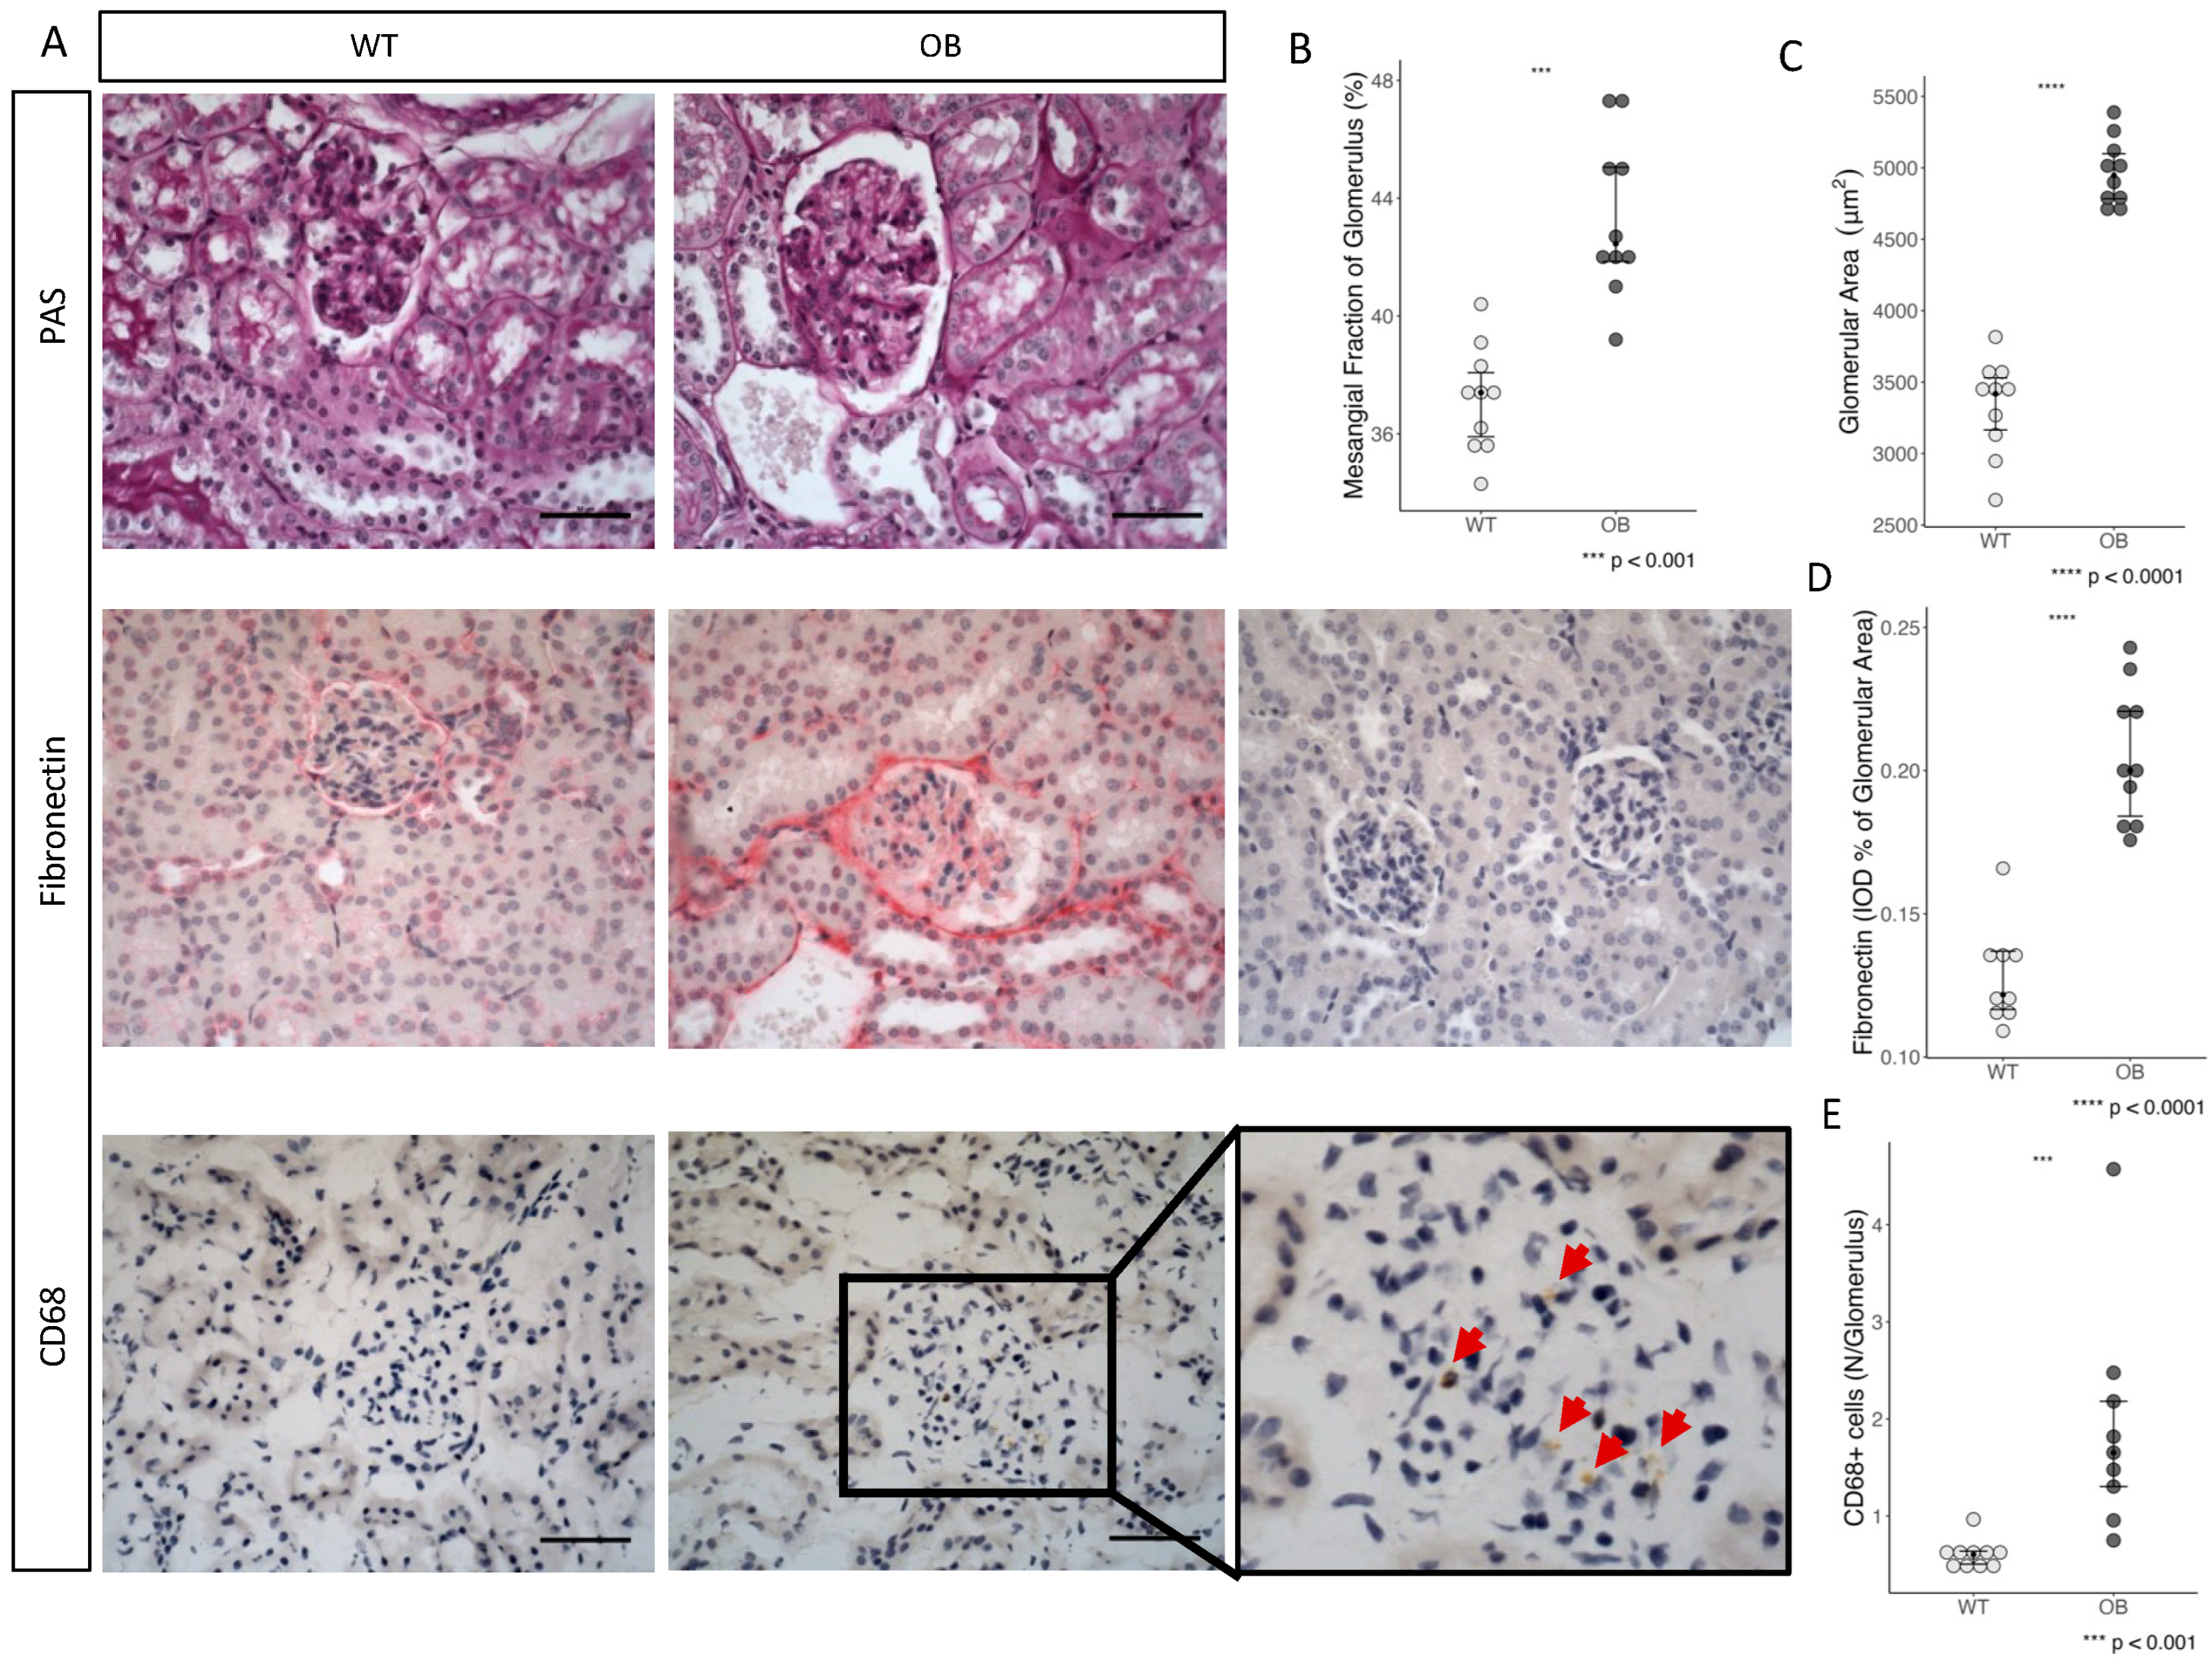
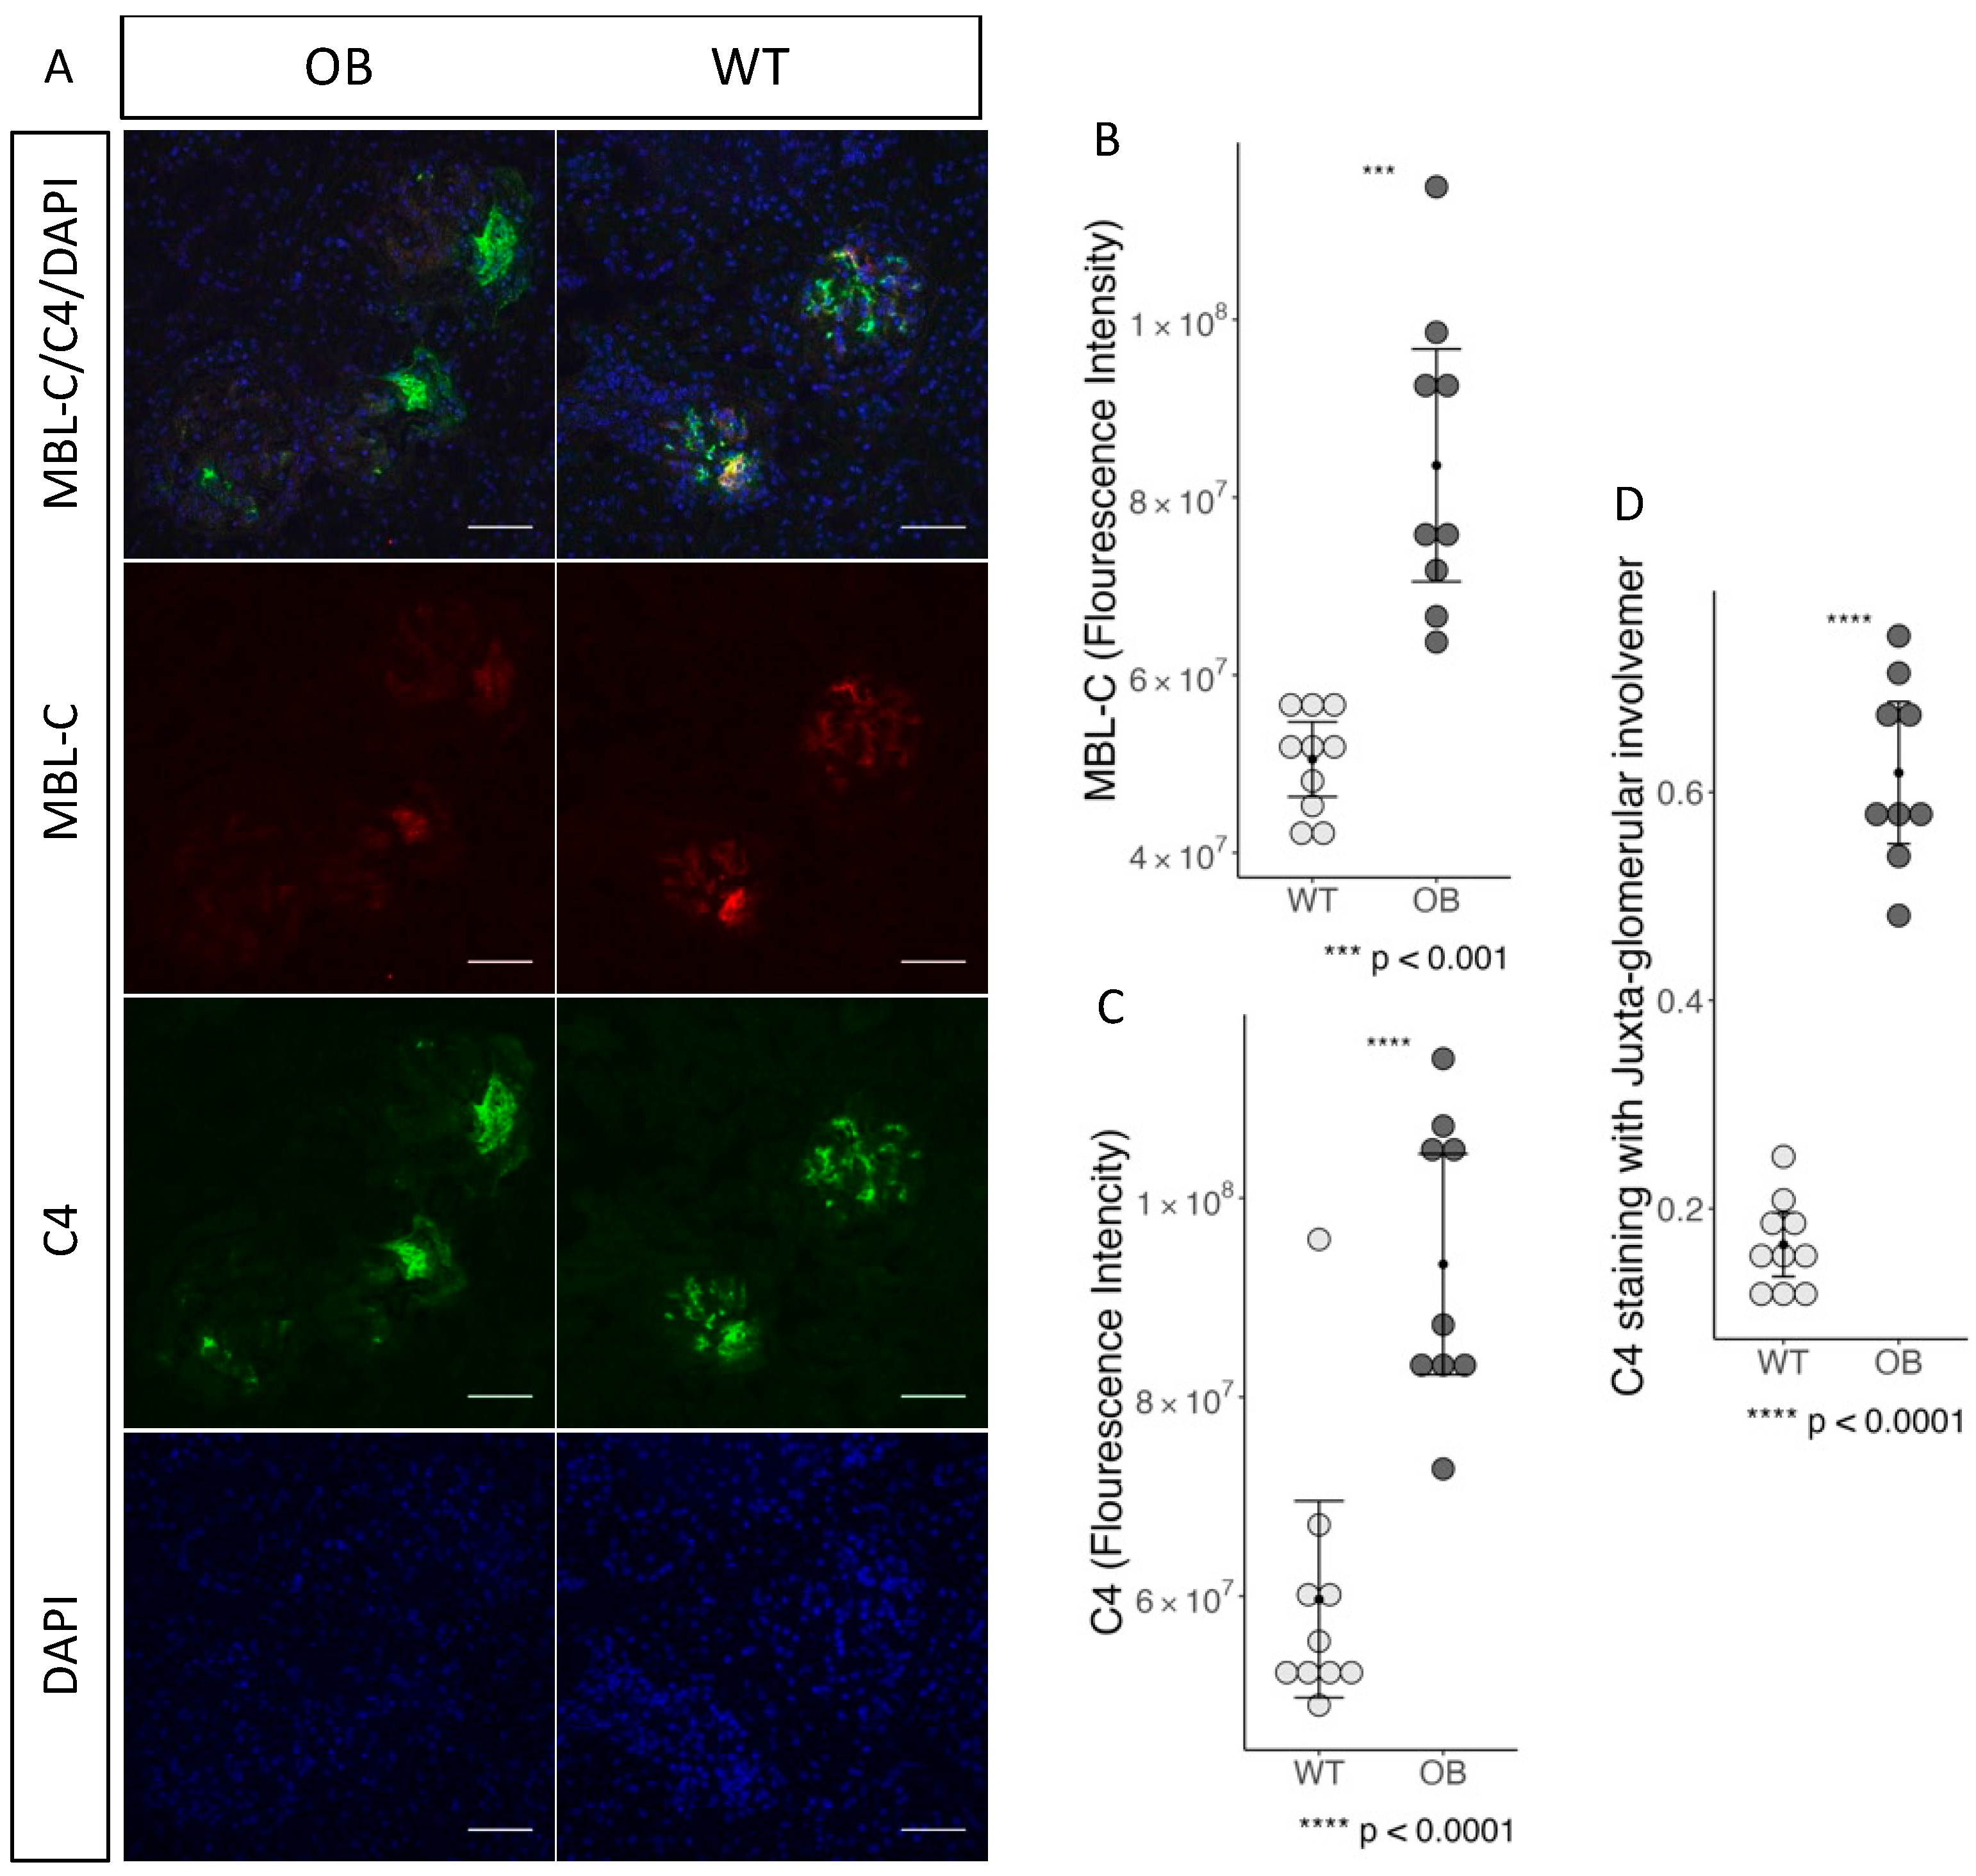
2.3. Immunohistochemistry
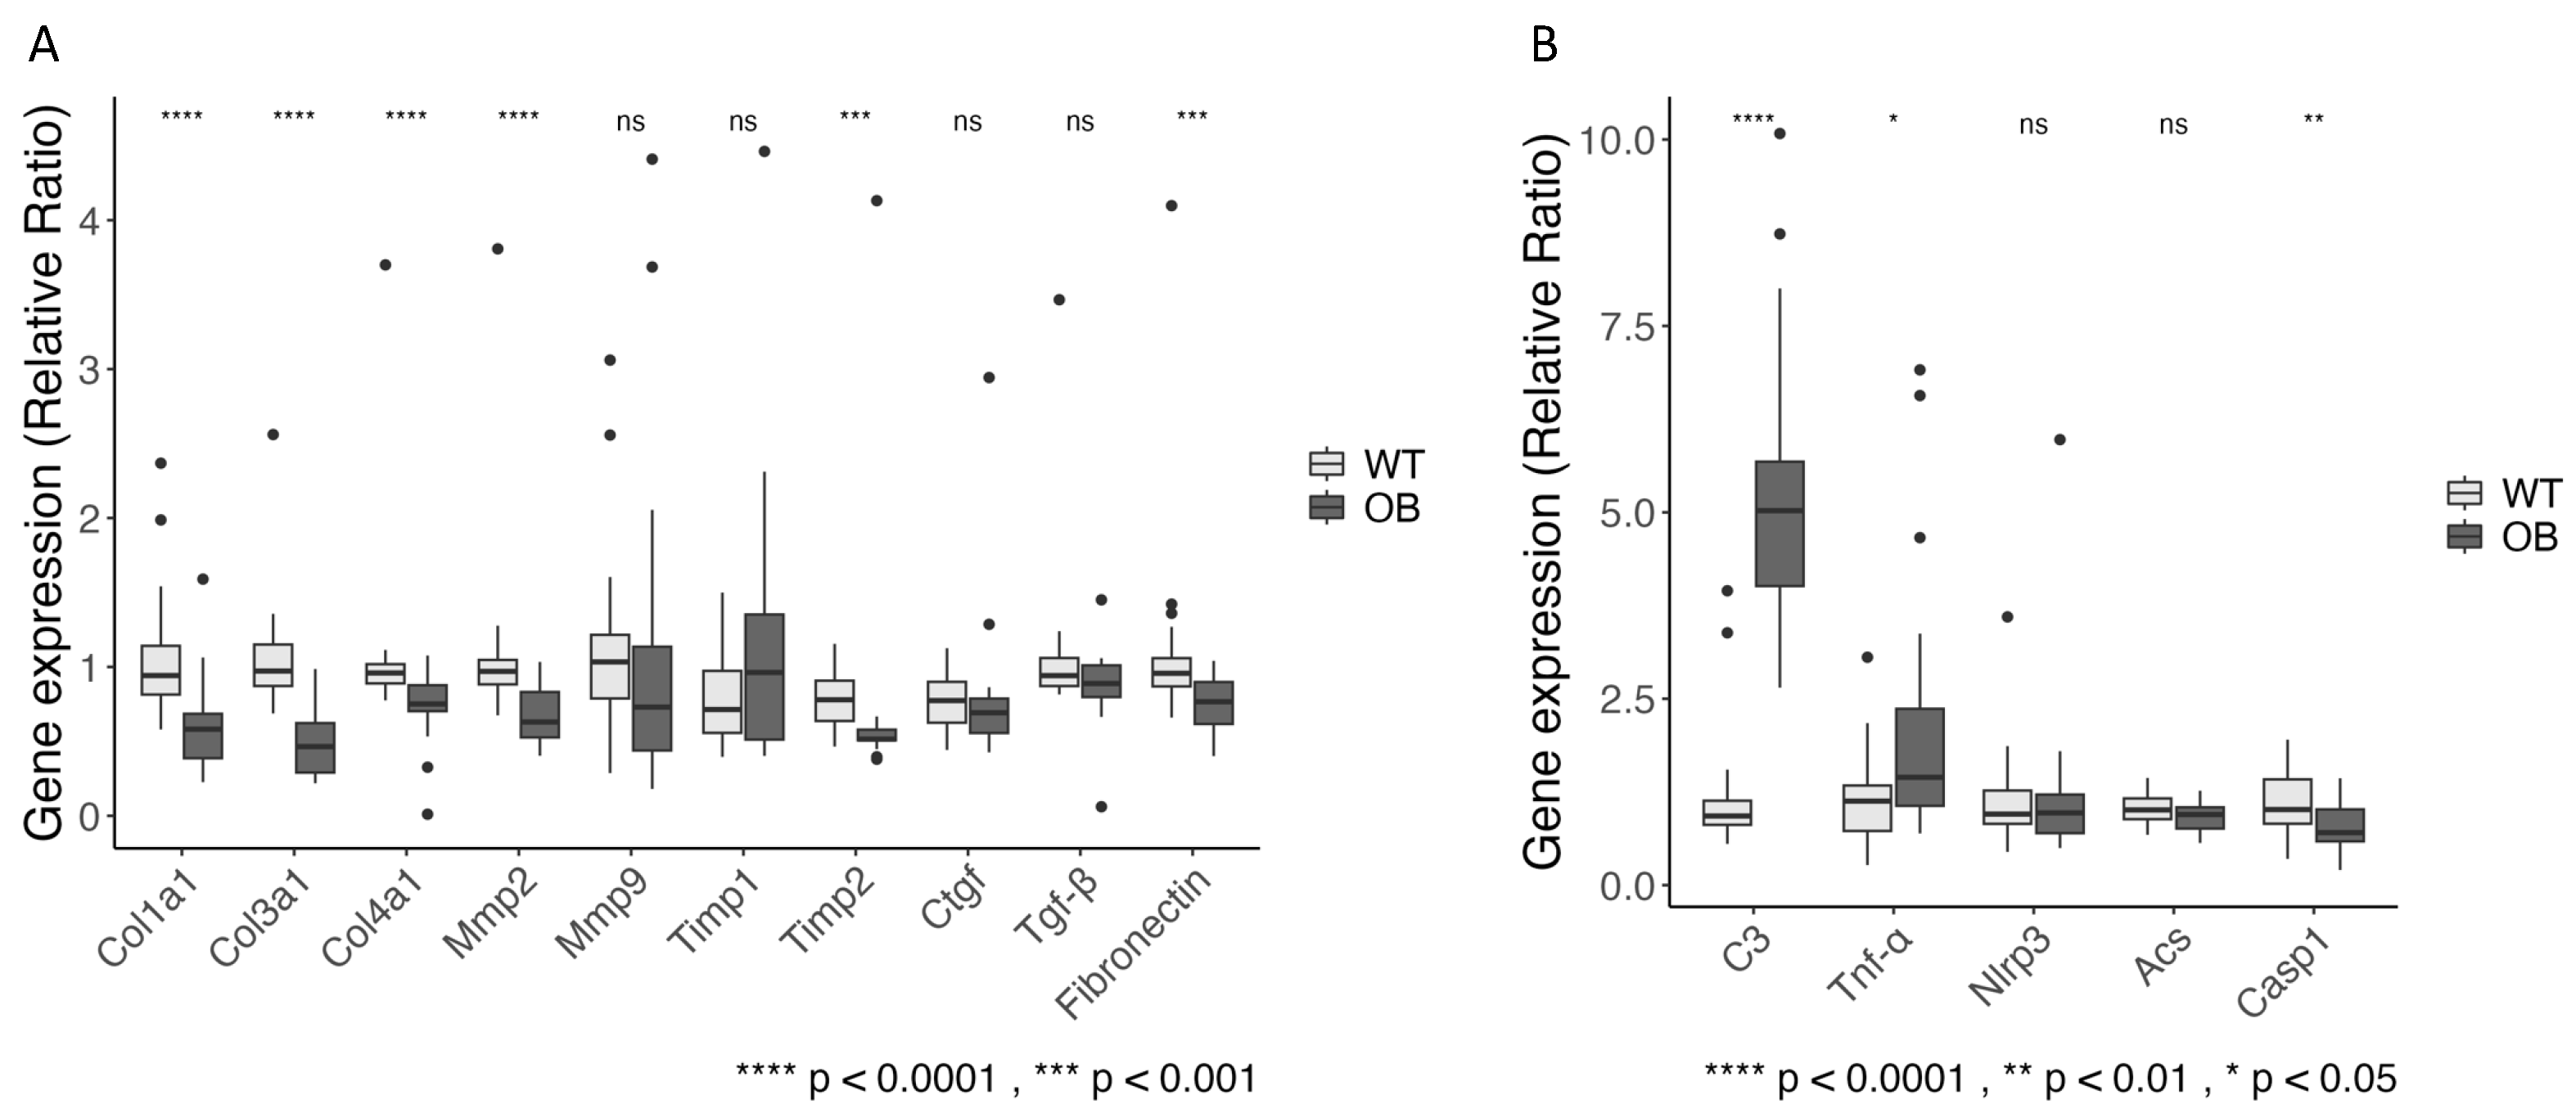
2.4. Fibrosis
2.5. The Complement System and Inflammation
2.6. Complement Staining and Inflammation in Glomeruli
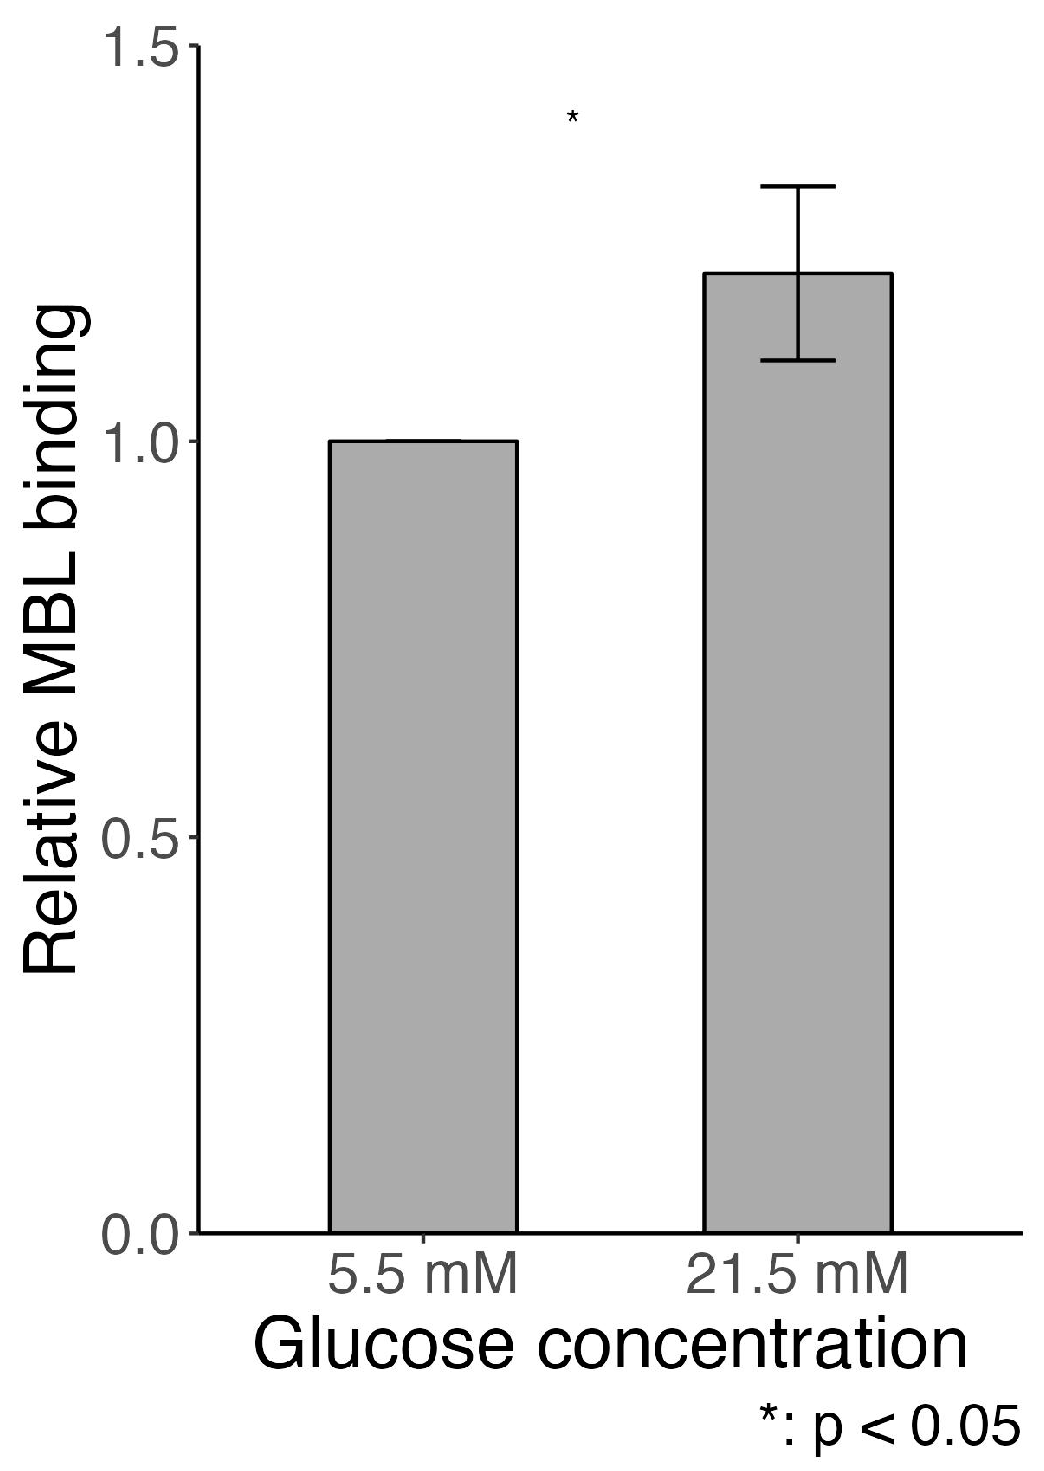
2.7. MBL Adhesion In Vitro
3. Discussion
4. Materials and Methods
4.1. Animals
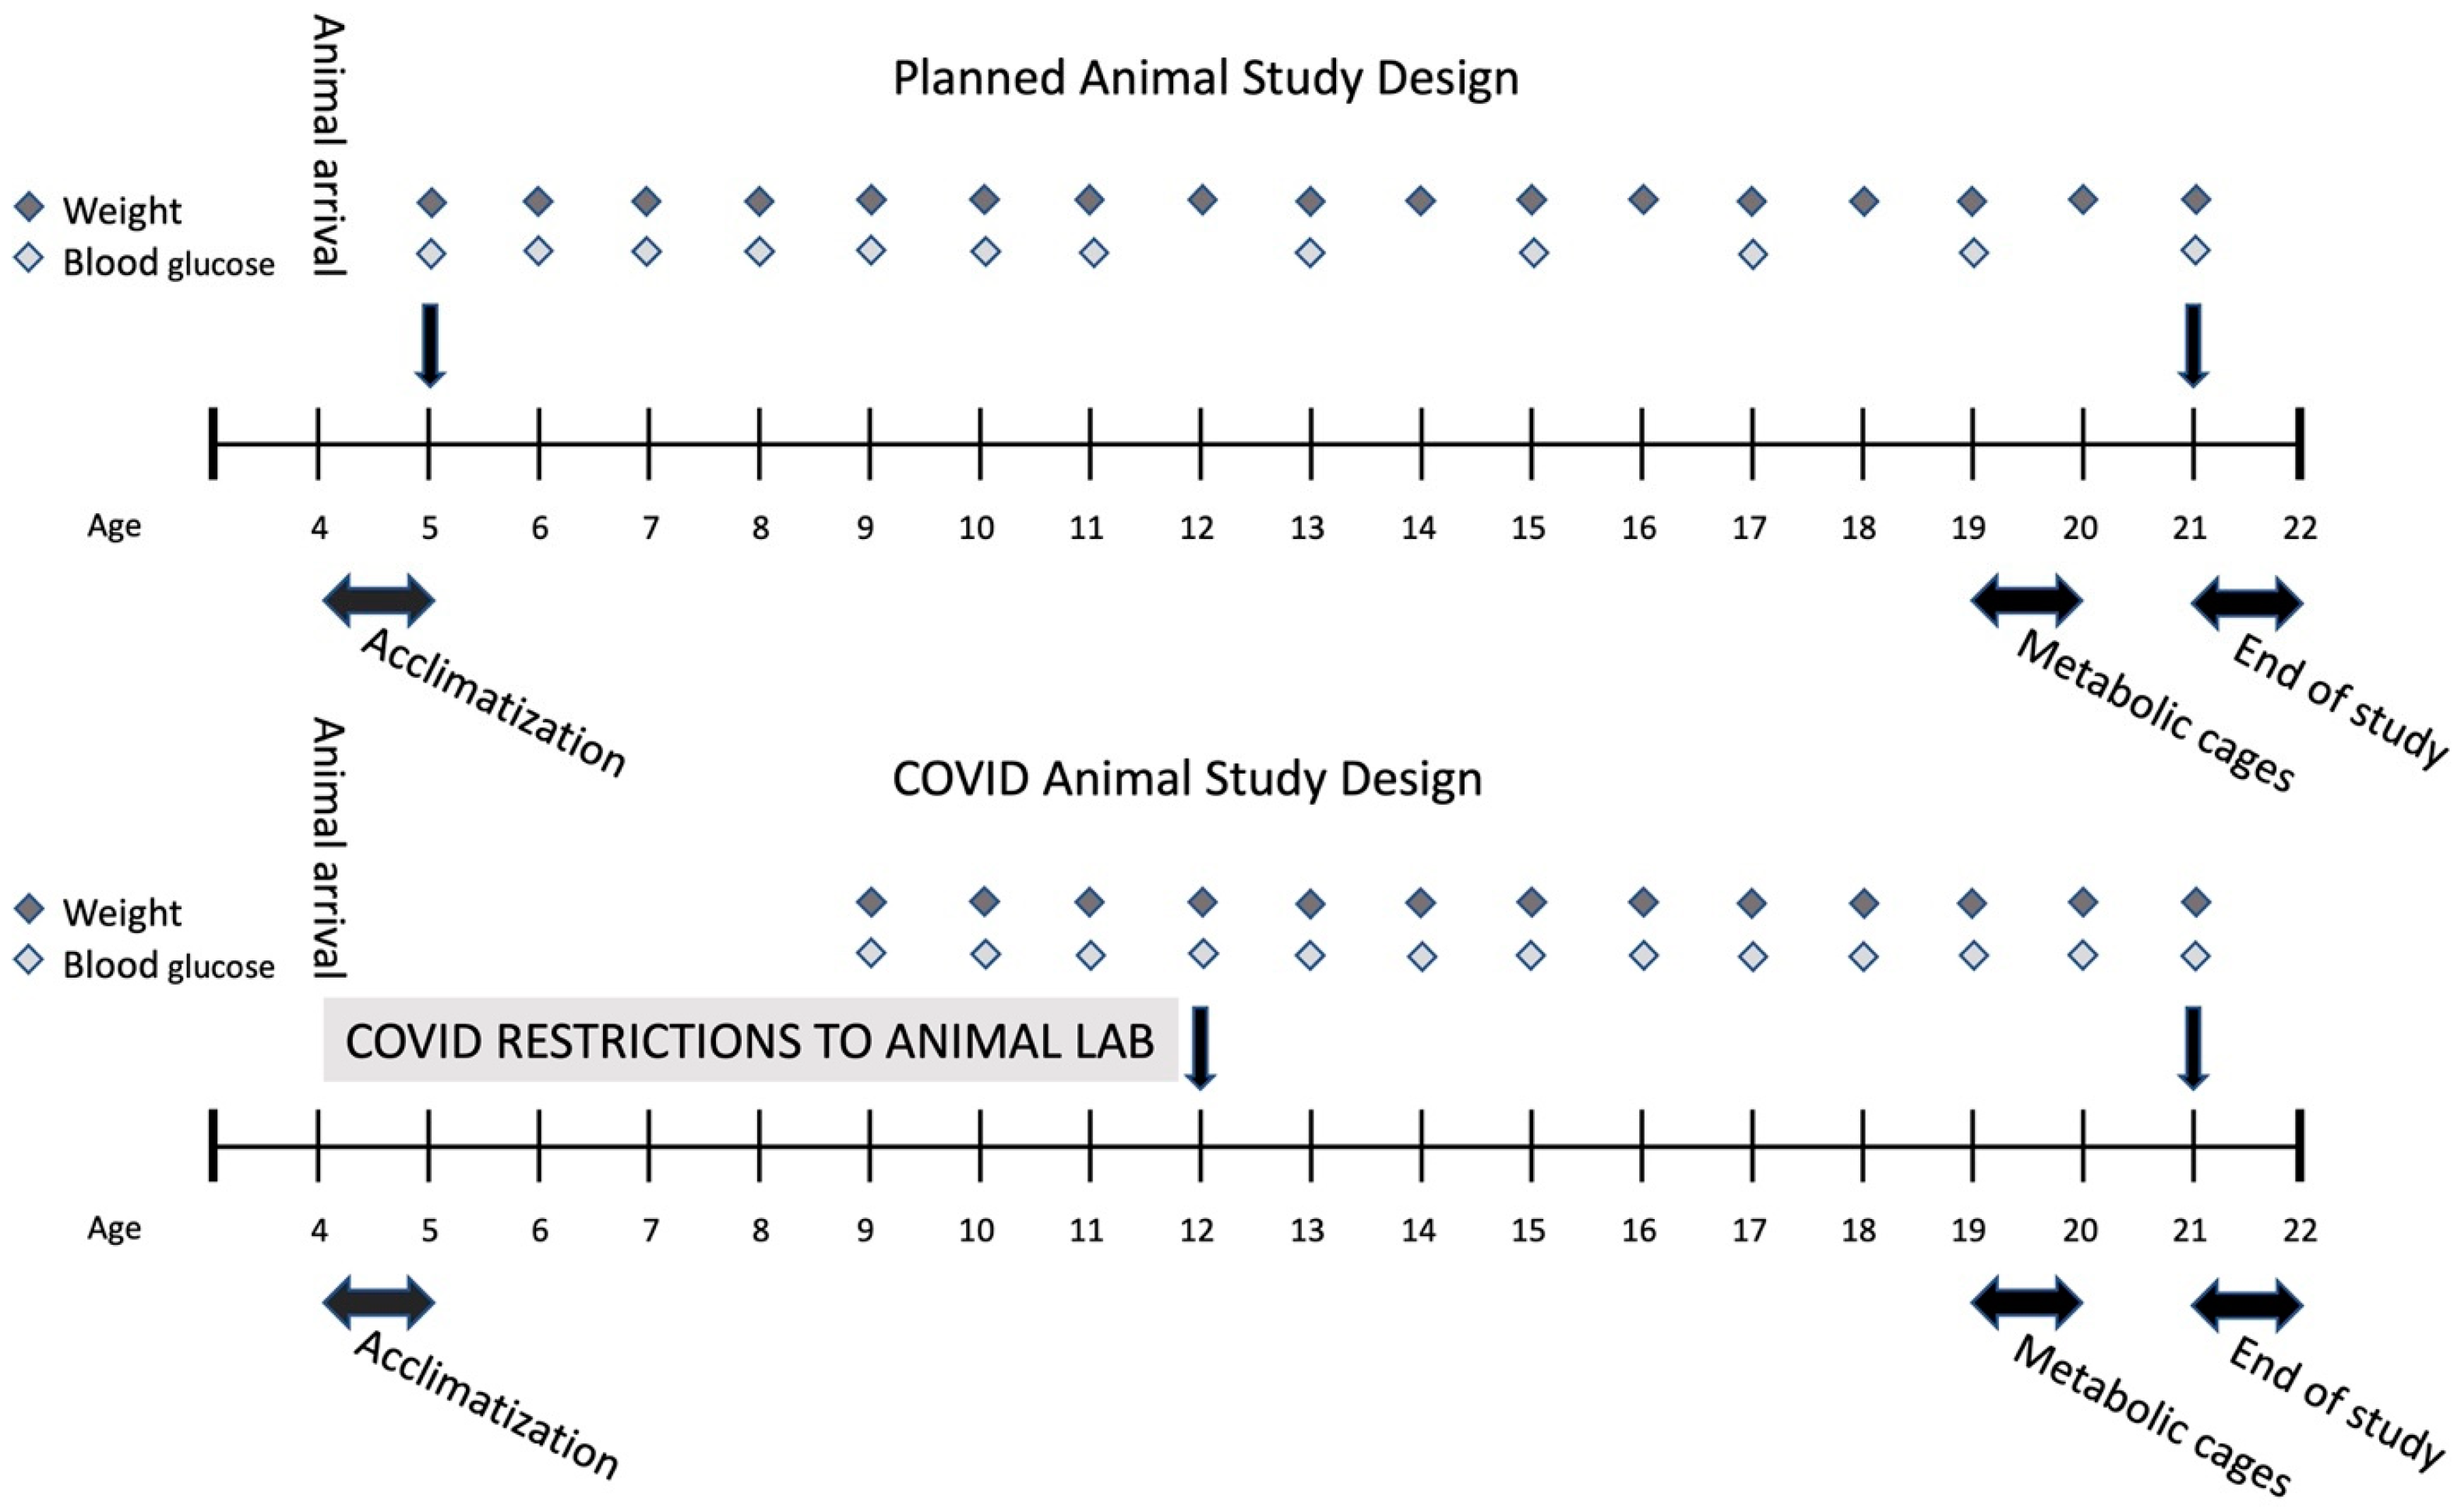
4.2. Study Design
4.3. Blood Analysis
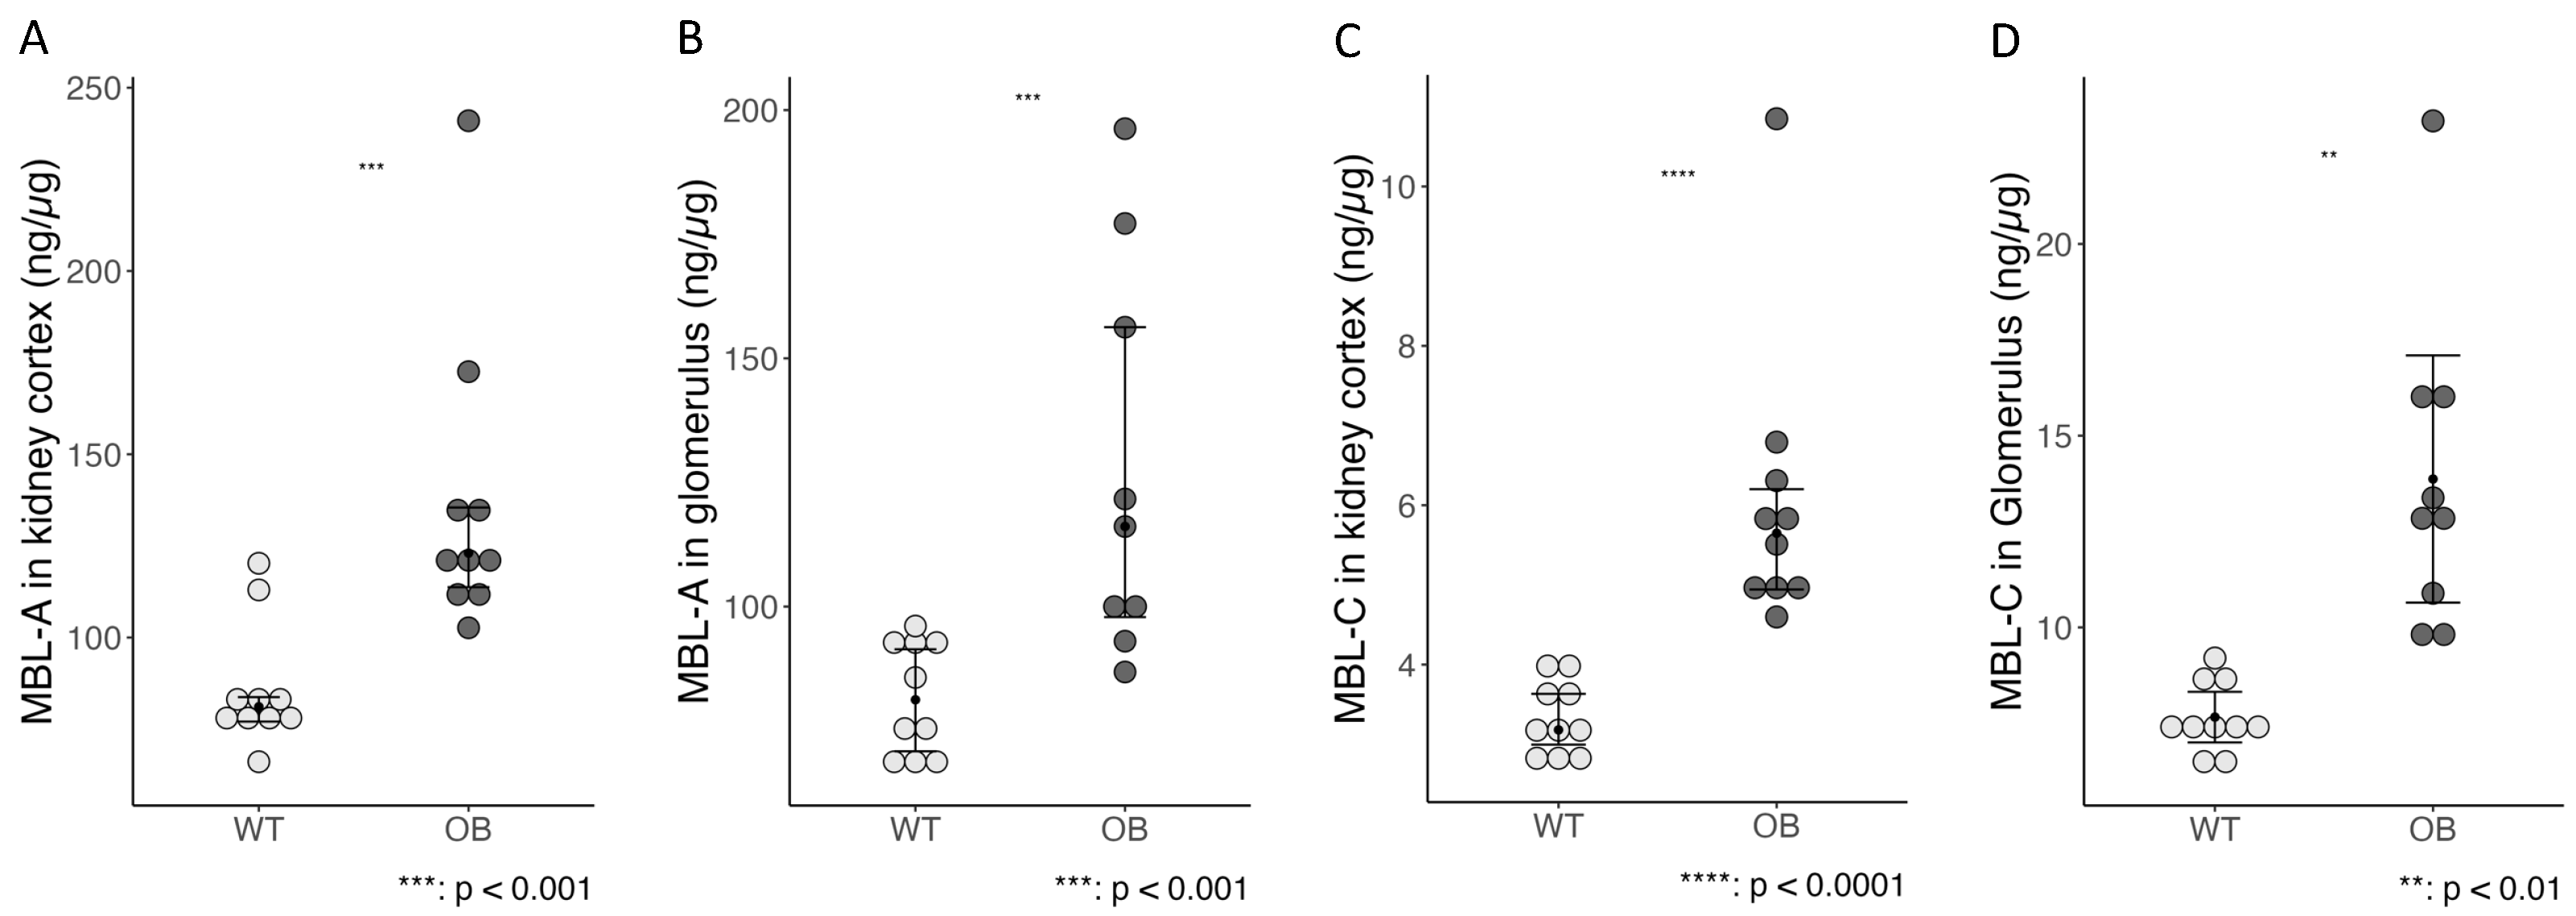
4.4. MBL-A and MBL-C Measurements in the Kidney Cortex and Glomerulus
4.5. Urinalysis
4.6. Histopathology and Immunohistochemistry
4.7. Immunohistochemical Evaluation of Fibrosis Collagen and Fibronectin
4.8. Isolation of Glomeruli
4.9. Real-Time Quantitative PCR Analysis
4.10. Flow Cytometry
4.11. Statistical Analysis
5. Conclusions
6. Limitations
Supplementary Materials
Author Contributions
Funding
Institutional Review Board Statement
Data Availability Statement
Acknowledgments
Conflicts of Interest
References
- Yokoyama, H.; Okudaira, M.; Otani, T.; Sato, A.; Miura, J.; Takaike, H.; Yamada, H.; Muto, K.; Uchigata, Y.; Ohashi, Y.; et al. Higher Incidence of Diabetic Nephropathy in Type 2 than in Type 1 Diabetes in Early-Onset Diabetes in Japan. Kidney Int. 2000, 58, 302–311. [Google Scholar] [CrossRef] [PubMed]
- Harjutsalo, V.; Groop, P.-H. Epidemiology and Risk Factors for Diabetic Kidney Disease. Adv. Chronic Kidney Dis. 2014, 21, 260–266. [Google Scholar] [CrossRef] [PubMed]
- Calles-Escandon, J.; Cipolla, M. Diabetes and Endothelial Dysfunction: A Clinical Perspective. Endocr. Rev. 2001, 22, 36–52. [Google Scholar] [CrossRef] [PubMed]
- Kanwar, Y.S.; Wada, J.; Sun, L.; Xie, P.; Wallner, E.I.; Chen, S.; Chugh, S.; Danesh, F.R. Diabetic Nephropathy: Mechanisms of Renal Disease Progression. Exp. Biol. Med. 2008, 233, 4–11. [Google Scholar] [CrossRef] [PubMed]
- Tan, S.M.; Snelson, M.; Østergaard, J.A.; Coughlan, M.T. The Complement Pathway: New Insights into Immunometabolic Signaling in Diabetic Kidney Disease. Antioxid. Redox Signal. 2022, 37, 781–801. [Google Scholar] [CrossRef] [PubMed]
- Hovind, P.; Hansen, T.K.; Tarnow, L.; Thiel, S.; Steffensen, R.; Flyvbjerg, A.; Parving, H.-H. Mannose-Binding Lectin as a Predictor of Microalbuminuria in Type 1 Diabetes: An Inception Cohort Study. Diabetes 2005, 54, 1523–1527. [Google Scholar] [CrossRef] [PubMed]
- Saraheimo, M.; Forsblom, C.; Hansen, T.K.; Teppo, A.-M.; Fagerudd, J.; Pettersson-Fernholm, K.; Thiel, S.; Tarnow, L.; Ebeling, P.; Flyvbjerg, A.; et al. Increased Levels of Mannan-Binding Lectin in Type 1 Diabetic Patients with Incipient and Overt Nephropathy. Diabetologia 2005, 48, 198–202. [Google Scholar] [CrossRef]
- Hansen, T.K.; Tarnow, L.; Thiel, S.; Steffensen, R.; Stehouwer, C.D.; Schalkwijk, C.G.; Parving, H.-H.; Flyvbjerg, A. Association between Mannose-Binding Lectin and Vascular Complications in Type 1 Diabetes. Diabetes 2004, 53, 1570–1576. [Google Scholar] [CrossRef]
- Degn, S.E.; Thiel, S. Humoral Pattern Recognition and the Complement System. Scand. J. Immunol. 2013, 78, 181–193. [Google Scholar] [CrossRef]
- Dobó, J.; Kocsis, A.; Farkas, B.; Demeter, F.; Cervenak, L.; Gál, P. The Lectin Pathway of the Complement System—Activation, Regulation, Disease Connections and Interplay with Other (Proteolytic) Systems. Int. J. Mol. Sci. 2024, 25, 1566. [Google Scholar] [CrossRef]
- Mastellos, D.C.; Hajishengallis, G.; Lambris, J.D. A Guide to Complement Biology, Pathology and Therapeutic Opportunity. Nat. Rev. Immunol. 2024, 24, 118–141. [Google Scholar] [CrossRef] [PubMed]
- Brownlee, M.; Vlassara, H.; Cerami, A. Nonenzymatic Glycosylation and the Pathogenesis of Diabetic Complications. Ann. Intern. Med. 1984, 101, 527–537. [Google Scholar] [CrossRef] [PubMed]
- Hansen, T.K.; Thiel, S.; Knudsen, S.T.; Gravholt, C.H.; Christiansen, J.S.; Mogensen, C.E.; Poulsen, P.L. Elevated Levels of Mannan-Binding Lectin in Patients with Type 1 Diabetes. J. Clin. Endocrinol. Metab. 2003, 88, 4857–4861. [Google Scholar] [CrossRef] [PubMed]
- Geng, P.; Ding, Y.; Qiu, L.; Lu, Y. Serum Mannose-Binding Lectin Is a Strong Biomarker of Diabetic Retinopathy in Chinese Patients with Diabetes. Diabetes Care 2015, 38, 868–875. [Google Scholar] [CrossRef]
- Østergaard, J.A.; Thiel, S.; Lajer, M.; Steffensen, R.; Parving, H.-H.; Flyvbjerg, A.; Rossing, P.; Tarnow, L.; Hansen, T.K. Increased All-Cause Mortality in Patients with Type 1 Diabetes and High-Expression Mannan-Binding Lectin Genotypes: A 12-Year Follow-up Study. Diabetes Care 2015, 38, 1898–1903. [Google Scholar] [CrossRef] [PubMed]
- Dørflinger, G.H.; Høyem, P.H.; Laugesen, E.; Østergaard, J.A.; Funck, K.L.; Steffensen, R.; Poulsen, P.L.; Hansen, T.K.; Bjerre, M. High MBL-Expressing Genotypes Are Associated with Deterioration in Renal Function in Type 2 Diabetes. Front. Immunol. 2022, 13, 1080388. [Google Scholar] [CrossRef] [PubMed]
- Axelgaard, E.; Ostergaard, J.A.; Haxha, S.; Thiel, S.; Hansen, T.K. Global Autorecognition and Activation of Complement by Mannan-Binding Lectin in a Mouse Model of Type 1 Diabetes. Mediat. Inflamm. 2017, 2017, 9403754. [Google Scholar] [CrossRef] [PubMed]
- Axelgaard, E.; Ostergaard, J.A.; Thiel, S.; Hansen, T.K. Diabetes Is Associated with Increased Autoreactivity of Mannan-Binding Lectin. J. Diabetes Res. 2017, 2017, 6368780. [Google Scholar] [CrossRef]
- Østergaard, J.A.; Ruseva, M.M.; Malik, T.H.; Hoffmann-Petersen, I.T.; Pickering, M.C.; Thiel, S.; Hansen, T.K. Increased Autoreactivity of the Complement-Activating Molecule Mannan-Binding Lectin in a Type 1 Diabetes Model. J. Diabetes Res. 2016, 2016, 1825738. [Google Scholar] [CrossRef]
- Alpers, C.E.; Hudkins, K.L. Mouse Models of Diabetic Nephropathy. Curr. Opin. Nephrol. Hypertens. 2011, 20, 278–284. [Google Scholar] [CrossRef]
- Hudkins, K.L.; Pichaiwong, W.; Wietecha, T.; Kowalewska, J.; Banas, M.C.; Spencer, M.W.; Muhlfeld, A.; Koelling, M.; Pippin, J.W.; Shankland, S.J.; et al. BTBR Ob/Ob Mutant Mice Model Progressive Diabetic Nephropathy. J. Am. Soc. Nephrol. 2010, 21, 1533–1542. [Google Scholar] [CrossRef]
- Chen, J.; Liu, Q.; He, J.; Li, Y. Immune Responses in Diabetic Nephropathy: Pathogenic Mechanisms and Therapeutic Target. Front. Immunol. 2022, 13, 958790. [Google Scholar] [CrossRef]
- Kanwar, Y.S.; Sun, L.; Xie, P.; Liu, F.-Y.; Chen, S. A Glimpse of Various Pathogenetic Mechanisms of Diabetic Nephropathy. Annu. Rev. Pathol. 2011, 6, 395–423. [Google Scholar] [CrossRef] [PubMed]
- Flyvbjerg, A. The Role of the Complement System in Diabetic Nephropathy. Nat. Rev. Nephrol. 2017, 13, 311–318. [Google Scholar] [CrossRef] [PubMed]
- Ostergaard, J.A.; Bjerre, M.; Dagnaes-Hansen, F.; Hansen, T.K.; Thiel, S.; Flyvbjerg, A. Diabetes-Induced Changes in Mannan-Binding Lectin Levels and Complement Activation in a Mouse Model of Type 1 Diabetes. Scand. J. Immunol. 2013, 77, 187–194. [Google Scholar] [CrossRef]
- Thórarinsdóttir, H.K.; Lúdvíksson, B.R.; Víkingsdóttir, T.; Leópoldsdóttir, M.O.; Ardal, B.; Jónsson, T.; Valdimarsson, H.; Arason, G.J. Childhood Levels of Immunoglobulins and Mannan-Binding Lectin in Relation to Infections and Allergy. Scand. J. Immunol. 2005, 61, 466–474. [Google Scholar] [CrossRef]
- Zahedifard, S.; Rashidi, E.; Shams, S.; Saghafi, S.; Fazlollahi, M.; Talebzadeh, A.; Kazemnejad, A.; Soltani, A.; Pourpak, Z. Mannan-Binding Lectin Serum Levels in 593 Healthy Iranian Children and Adults. Iran. J. Allergy Asthma Immunol. 2014, 13, 120–124. [Google Scholar]
- Kowalska, I.; Fernandez-Real, J.M.; Straczkowski, M.; Kozlowska, A.; Adamska, A.; Ortega, F.; Nikolajuk, A.; Karczewska-Kupczewska, M.; Wolczynski, S.; Gorska, M. Insulin Resistance Is Associated with Decreased Circulating Mannan-Binding Lectin Concentrations in Women with Polycystic Ovary Syndrome. Diabetes Care 2008, 31, e20. [Google Scholar] [CrossRef] [PubMed]
- Zhang, J.; Wang, Y.; Zhang, R.; Li, H.; Han, Q.; Guo, R.; Wang, T.; Li, L.; Liu, F. Implication of Decreased Serum Complement 3 in Patients with Diabetic Nephropathy. Acta Diabetol. 2018, 55, 31–39. [Google Scholar] [CrossRef]
- Bucala, R.; Vlassara, H. Advanced Glycosylation End Products in Diabetic Renal and Vascular Disease. Am. J. Kidney Dis. 1995, 26, 875–888. [Google Scholar] [CrossRef]
- Rojas, A.; Morales, M.A. Advanced Glycation and Endothelial Functions: A Link towards Vascular Complications in Diabetes. Life Sci. 2004, 76, 715–730. [Google Scholar] [CrossRef] [PubMed]
- Kundu, N.; Nandula, S.R.; Asico, L.D.; Fakhri, M.; Banerjee, J.; Jose, P.A.; Sen, S. Transplantation of Apoptosis-Resistant Endothelial Progenitor Cells Improves Renal Function in Diabetic Kidney Disease. J. Am. Heart Assoc. 2021, 10, e019365. [Google Scholar] [CrossRef] [PubMed]
- Holt, C.B.; Halkjær, L.; Dudler, T.; Schwaeble, W.; Hansen, T.K.; Thiel, S.; Østergaard, J.A. MASP-2 Deficiency Does Not Prevent the Progression of Diabetic Kidney Disease in a Mouse Model of Type 1 Diabetes. Scand. J. Immunol. 2024, 99, e13348. [Google Scholar] [CrossRef]
- Zhao, S.-Q.; Hu, Z. Mannose-Binding Lectin and Diabetic Nephropathy in Type 1 Diabetes. J. Clin. Lab. Anal. 2016, 30, 345–350. [Google Scholar] [CrossRef]
- Yu, T.-H.; Wu, C.-C.; Tsai, I.-T.; Hsuan, C.-F.; Lee, T.-L.; Wang, C.-P.; Wei, C.-T.; Chung, F.-M.; Lee, Y.-J.; Hung, W.-C.; et al. Circulating Mannose-Binding Lectin Concentration in Patients with Stable Coronary Artery Disease Is Associated with Heart Failure and Renal Function. Clin. Chim. Acta 2023, 548, 117528. [Google Scholar] [CrossRef] [PubMed]
- Duan, S.; Sun, L.; Nie, G.; Chen, J.; Zhang, C.; Zhu, H.; Huang, Z.; Qian, J.; Zhao, X.; Xing, C.; et al. Association of Glomerular Complement C4c Deposition with the Progression of Diabetic Kidney Disease in Patients with Type 2 Diabetes. Front. Immunol. 2020, 11, 2073. [Google Scholar] [CrossRef] [PubMed]
- Zwirner, J.; Felber, E.; Herzog, V.; Riethmüller, G.; Feucht, H.E. Classical Pathway of Complement Activation in Normal and Diseased Human Glomeruli. Kidney Int. 1989, 36, 1069–1077. [Google Scholar] [CrossRef]
- Luo, W.; Olaru, F.; Miner, J.H.; Beck, L.H.; van der Vlag, J.; Thurman, J.M.; Borza, D.-B. Alternative Pathway Is Essential for Glomerular Complement Activation and Proteinuria in a Mouse Model of Membranous Nephropathy. Front. Immunol. 2018, 9, 1433. [Google Scholar] [CrossRef]
- Sarkar, S.; Elliott, E.C.; Henry, H.R.; Ludovico, I.D.; Melchior, J.T.; Frazer-Abel, A.; Webb-Robertson, B.-J.; Davidson, W.S.; Holers, V.M.; Rewers, M.J.; et al. Systematic Review of Type 1 Diabetes Biomarkers Reveals Regulation in Circulating Proteins Related to Complement, Lipid Metabolism, and Immune Response. Clin. Proteom. 2023, 20, 38. [Google Scholar] [CrossRef]
- Hansen, T.K.; Forsblom, C.; Saraheimo, M.; Thorn, L.; Waden, J.; Hoyem, P.; Ostergaard, J.; Flyvbjerg, A.; Groop, P.-H. Association between Mannose-Binding Lectin, High-Sensitivity C-Reactive Protein and the Progression of Diabetic Nephropathy in Type 1 Diabetes. Diabetologia 2010, 53, 1517–1524. [Google Scholar] [CrossRef]
- Kaunisto, M.A.; Sjolind, L.; Sallinen, R.; Pettersson-Fernholm, K.; Saraheimo, M.; Frojdo, S.; Forsblom, C.; Fagerudd, J.; Hansen, T.K.; Flyvbjerg, A.; et al. Elevated MBL Concentrations Are Not an Indication of Association between the MBL2 Gene and Type 1 Diabetes or Diabetic Nephropathy. Diabetes 2009, 58, 1710–1714. [Google Scholar] [CrossRef] [PubMed]
- Zhang, N.; Zhuang, M.; Ma, A.; Wang, G.; Cheng, P.; Yang, Y.; Wang, X.; Zhang, J.; Chen, X.; Lu, M. Association of Levels of Mannose-Binding Lectin and the MBL2 Gene with Type 2 Diabetes and Diabetic Nephropathy. PLoS ONE 2013, 8, e83059. [Google Scholar] [CrossRef] [PubMed]
- Cai, K.; Ma, Y.; Wang, J.; Nie, W.; Guo, J.; Zhang, M.; Yang, Y.; Chen, J.; Han, F. Mannose-Binding Lectin Activation Is Associated with the Progression of Diabetic Nephropathy in Type 2 Diabetes Mellitus Patients. Ann. Transl. Med. 2020, 8, 1399. [Google Scholar] [CrossRef] [PubMed]
- Meek, R.L.; LeBoeuf, R.C.; Saha, S.A.; Alpers, C.E.; Hudkins, K.L.; Cooney, S.K.; Anderberg, R.J.; Tuttle, K.R. Glomerular Cell Death and Inflammation with High-Protein Diet and Diabetes. Nephrol. Dial. Transplant. 2013, 28, 1711–1720. [Google Scholar] [CrossRef]
- Anderberg, R.J.; Meek, R.L.; Hudkins, K.L.; Cooney, S.K.; Alpers, C.E.; Leboeuf, R.C.; Tuttle, K.R. Serum Amyloid A and Inflammation in Diabetic Kidney Disease and Podocytes. Lab. Investig. 2015, 95, 697. [Google Scholar] [CrossRef] [PubMed]
- Arbore, G.; Kemper, C. A Novel “Complement-Metabolism-Inflammasome Axis” as a Key Regulator of Immune Cell Effector Function. Eur. J. Immunol. 2016, 46, 1563–1573. [Google Scholar] [CrossRef]
- Ma, Y.; Cai, F.; Huang, X.; Wang, H.; Yu, B.; Wang, J.; Nie, W.; Cai, K.; Yang, Y.; Chen, J.; et al. Mannose-binding Lectin Activates the Nuclear Factor-κB and Renal Inflammation in the Progression of Diabetic Nephropathy. FASEB J. 2022, 36, e22227. [Google Scholar] [CrossRef] [PubMed]
- Hudkins, K.L.; Li, X.; Holland, A.L.; Swaminathan, S.; Alpers, C.E. Regression of Diabetic Nephropathy by Treatment with Empagliflozin in BTBR Mice. Nephrol. Dial. Transplant. 2022, 37, 847–859. [Google Scholar] [CrossRef] [PubMed]
- Opazo-Ríos, L.; Tejera-Muñoz, A.; Soto Catalan, M.; Marchant, V.; Lavoz, C.; Mas Fontao, S.; Moreno, J.A.; Fierro Fernandez, M.; Ramos, R.; Suarez-Alvarez, B.; et al. Kidney MicroRNA Expression Pattern in Type 2 Diabetic Nephropathy in BTBR Ob/Ob Mice. Front. Pharmacol. 2022, 13, 778776. [Google Scholar] [CrossRef]
- Sheerin, N.S.; Zhou, W.; Adler, S.; Sacks, S.H. TNF-α Regulation of C3 Gene Expression and Protein Biosynthesis in Rat Glomerular Endothelial Cells. Kidney Int. 1997, 51, 703–710. [Google Scholar] [CrossRef]
- Pichaiwong, W.; Hudkins, K.L.; Wietecha, T.; Nguyen, T.Q.; Tachaudomdach, C.; Li, W.; Askari, B.; Kobayashi, T.; O’Brien, K.D.; Pippin, J.W.; et al. Reversibility of Structural and Functional Damage in a Model of Advanced Diabetic Nephropathy. J. Am. Soc. Nephrol. 2013, 24, 1088–1102. [Google Scholar] [CrossRef]
- Halkjær, L.; Troldborg, A.; Pedersen, H.; Jensen, L.; Hansen, A.G.; Hansen, T.K.; Bjerre, M.; Østergaard, J.A.; Thiel, S. Complement Receptor 2 Based Immunoassay Measuring Activation of the Complement System at C3-Level in Plasma Samples from Mice and Humans. Front. Immunol. 2020, 11, 774. [Google Scholar] [CrossRef] [PubMed]
- Liu, H.; Jensen, L.; Hansen, S.; Petersen, S.V.; Takahashi, K.; Ezekowitz, A.B.; Hansen, F.D.; Jensenius, J.C.; Thiel, S. Characterization and Quantification of Mouse Mannan-Binding Lectins (MBL-A and MBL-C) and Study of Acute Phase Responses. Scand. J. Immunol. 2001, 53, 489–497. [Google Scholar] [CrossRef] [PubMed]
- Buzello, M. Comparison of Two Stereological Methods for Quantitative Renal Morphology: A Modified Fractionator and Modified Weibel-Gomez Method. Pathol. Res. Pract. 2000, 196, 111–117. [Google Scholar] [CrossRef] [PubMed]
- Davis, K.L.; Burnum, A.L.; Beck, J.A.; Kirejczyk, S.G.M.; Miller, M.A.; Sola, M.F.; Brown, C.A. Diagnosis of Collagen Type III Glomerulopathy Using Picrosirius Red and PASH/Masson’s Trichrome Stain. Vet. Pathol. 2020, 57, 675–680. [Google Scholar] [CrossRef]
- Schindelin, J.; Arganda-Carreras, I.; Frise, E.; Kaynig, V.; Longair, M.; Pietzsch, T.; Preibisch, S.; Rueden, C.; Saalfeld, S.; Schmid, B.; et al. Fiji: An Open-Source Platform for Biological-Image Analysis. Nat. Methods 2012, 9, 676–682. [Google Scholar] [CrossRef]
- Dumas, S.J.; Meta, E.; Conchinha, N.V.; Sokol, L.; Chen, R.; Borri, M.; Teuwen, L.-A.; Veys, K.; García-Caballero, M.; Geldhof, V.; et al. Protocols for Endothelial Cell Isolation from Mouse Tissues: Kidney, Spleen, and Testis. STAR Protoc. 2021, 2, 100523. [Google Scholar] [CrossRef]


| Protein | Gene | Forward Primer Sequence | Reverse Primer Sequence |
|---|---|---|---|
| Collagen I | Col1al | GACGCATGGCCAAGAAGACA | ATTGCACGTCATCGCACACA |
| Collagen III | Col3al | GGGAATGGAGCAAGACAGTCTT | TGCGATATCTATGATGGGTAGTCTCA |
| Collagen IV | Col4al | ACTTCGCCTCCAGGAACGAC | GGTGCTTCACAAACCGCACA |
| Fibronectin | Fn1 | ACATGCCTCGGGAATGGAAAGG | CGTCATAGCACGTTGCTTCATGG |
| Matrix Metalloproteinase 2 | Mmp2 | TCACTTTCCTGGGCAACAAGT | GCCACGAGGAATAGGCTATATCC |
| Matrix Metalloproteinase 9 | Mmp9 | TGAGTCCGGCAGACAATCCT | CGCCCTGGATCTCAGCAATA |
| Transforming growth factor-beta | Tgfb1 | CTGACCCCCACTGATACGCC | GCGCTGAATCGAAAGCCCTG |
| Tumour necrosis factor-alpha | Tnfa | TTCCCAAATGGCCTCCCTCTCATC | TCCTCCACTTGGTGGTTTGCTAC |
| Mannan-binding lectin A | Mbl1 | GTTCCCGGTCACCAGGCTAA | ACCACACACAGAAGGACAGGG |
| Mannan-binding lectin C | Mbl2 | TGGGACCGAAAGGAGACCGT | AGGGCTCTCAGCTCTGATCGT |
| Complement factor 3 | C3 | CAGCTTCAGGGTCCCAGCTAC | CCAGCCGTAGGACATTGGGA |
| Caspase 1 | Casp1 | CACGCCCTGTTGGAAAGGAA | CCCTCAGGATCTTGTCAGCCA |
| Apoptosis-associated speck-like protein containing a CARD | ASC | AGAGTACAGCCAGAACAGGACA | CAGCACACTGCCATGCAAAG |
| NLR family pyrin domain containing 3 | Nlrp3 | GCTCCAACCATTCTCTGACCA | GGTTGGTTTTGAGCACAGAGG |
| Connective tissue growth factor | Ccn2 | GGAGTGTGCACTGCCAAAGATG | AGGCAAGTGCATTGGTATTTGCAG |
| Tissue inhibitors of metalloproteinase 1 | Timp1 | GCCTACACCCCAGTCATGGA | GGCCCGTGATGAGAAACTCTT |
| Tissue inhibitors of metalloproteinase 2 | Timp2 | AGGAGATGTAGCAAGGGATCA | GAGCCTGAACCACAGGTACCA |
Disclaimer/Publisher’s Note: The statements, opinions and data contained in all publications are solely those of the individual author(s) and contributor(s) and not of MDPI and/or the editor(s). MDPI and/or the editor(s) disclaim responsibility for any injury to people or property resulting from any ideas, methods, instructions or products referred to in the content. |
© 2024 by the authors. Licensee MDPI, Basel, Switzerland. This article is an open access article distributed under the terms and conditions of the Creative Commons Attribution (CC BY) license (https://creativecommons.org/licenses/by/4.0/).
Share and Cite
Dørflinger, G.H.; Holt, C.B.; Thiel, S.; Bech, J.N.; Østergaard, J.A.; Bjerre, M. Mannan-Binding Lectin Is Associated with Inflammation and Kidney Damage in a Mouse Model of Type 2 Diabetes. Int. J. Mol. Sci. 2024, 25, 7204. https://doi.org/10.3390/ijms25137204
Dørflinger GH, Holt CB, Thiel S, Bech JN, Østergaard JA, Bjerre M. Mannan-Binding Lectin Is Associated with Inflammation and Kidney Damage in a Mouse Model of Type 2 Diabetes. International Journal of Molecular Sciences. 2024; 25(13):7204. https://doi.org/10.3390/ijms25137204
Chicago/Turabian StyleDørflinger, Gry H., Charlotte B. Holt, Steffen Thiel, Jesper N. Bech, Jakob A. Østergaard, and Mette Bjerre. 2024. "Mannan-Binding Lectin Is Associated with Inflammation and Kidney Damage in a Mouse Model of Type 2 Diabetes" International Journal of Molecular Sciences 25, no. 13: 7204. https://doi.org/10.3390/ijms25137204