Article

Cytological and Transcriptome Analyses Provide Insights into Persimmon Fruit Size Formation (Diospyros kaki Thunb.)

1
Key Laboratory of Cultivation and Protection for Non-Wood Forest Trees, Ministry of Education, Central South University of Forestry and Technology, No. 498 Shaoshan South Road, Changsha 410004, China
2
Research Institute of Non-Timber Forestry, Chinese Academy of Forestry, No. 3 Weiwu Road, Jinshui District, Zhengzhou 450003, China
3
Research Institute of Forestry Policy and Information, Chinese Academy of Forestry, Xiangshan Road, Haidian District, Beijing 100091, China
*
Authors to whom correspondence should be addressed.
Int. J. Mol. Sci. 2024, 25(13), 7238; https://doi.org/10.3390/ijms25137238
Submission received: 27 May 2024 / Revised: 21 June 2024 / Accepted: 29 June 2024 / Published: 30 June 2024
(This article belongs to the Special Issue Molecular Genetics and Plant Breeding 4.0)

Abstract

:
Persimmon (Diospyros kaki Thunb.) fruit size variation is abundant. Studying the size of the persimmon fruit is helpful in improving its economic value. At present, the regulatory mechanism of persimmon fruit size formation is still unclear. In this study, the mechanism of fruit size formation was investigated through morphological, cytological and transcriptomic analyses, as well as exogenous ethrel and aminoethoxyinylglycine (AVG: ethylene inhibitor) experiments using the large fruit and small fruit of ‘Yaoxianwuhua’. The results showed that stages 3–4 (June 11–June 25) are the crucial morphological period for differentiation of large fruit and small fruit in persimmon. At this crucial morphological period, the cell number in large fruit was significantly more than that in small fruit, indicating that the difference in cell number is the main reason for the differentiation of persimmon fruit size. The difference in cell number was caused by cell division. CNR1, ANT, LAC17 and EB1C, associated with cell division, may be involved in regulating persimmon fruit size. Exogenous ethrel resulted in a decrease in fruit weight, and AVG treatment had the opposite effect. In addition, LAC17 and ERF114 were upregulated after ethrel treatment. These results indicated that high ethylene levels can reduce persimmon fruit size, possibly by inhibiting cell division. This study provides valuable information for understanding the regulation mechanism of persimmon fruit size and lays a foundation for subsequent breeding and artificial regulation of fruit size.

1. Introduction

Persimmon (Diospyros kaki Thunb.) is one of the most popular fruits in China [1]. Fruit size, as the most intuitive external feature, is often the primary factor for consumers to consider when purchasing. In biology, fruit size is an important fitness trait in plant evolution. In the breeding process, fruit size, as a crucial agronomic trait for crop improvement, is the target of artificial selection [2,3]. In production, non-uniformity in fruit size affects mechanical harvesting and processing efficiency. The abundant diversity of persimmon fruit size laid a foundation for studying the regulation mechanism of fruit size, which is conducive to the subsequent artificial regulation of fruit size.
Fruit size formation involves multiple biological processes, such as plant hormone biosynthesis and signal transduction, cell division, and cell expansion. Plant hormones are directly or indirectly involved in cell division and cell expansion during fruit development, ultimately affecting fruit size. In tomato (Solanum lycopersicum) and Arabidopsis (Arabidopsis thaliana), rapid accumulation of auxin in fertilized ovules stimulates cell division and cell expansion, thus promoting fruit growth [4,5]. PINs are involved in regulating the polar transport of auxin, and silencing SlPIN4 reduces tomato fruit size [6]. In grape (Vitis vinifera), exogenous GA can promote cell division and increase fruit weight [7]. In jujube (Ziziphus jujuba), cytokinin controls fruit size by regulating cell division [8,9]. Low carbon levels directly inhibited the expression of cytokinin biosynthetic enzymes like IPTs and CYP735As, resulting in smaller fruit size of kiwifruit (Actinidia chinensis) [10]. In addition, ABA, ethylene and brassinosteroid have also been shown to be involved in regulating fruit size [11,12,13,14].
With the development of sequencing technology, more and more genes related to fruit size have been identified. For example, overexpression of SlERF36 can reduce fruit size in tomato [14]. ENO regulates tomato fruit size, participating in floral meristem development [15]. STK encodes a MADS-box transcription factor, and NTT encodes a C2H2/C2HC zinc finger transcription factor; loss function in Arabidopsis leads to reduced silique length [16,17].
At present, research on persimmon fruit size is in its initial stage, and the regulatory mechanism of fruit size formation is still unclear. Here, the large fruit and small fruit of ‘Yaoxianwuhua’ were used as materials to carry out morphological, cytological, transcriptomic and exogenous hormone experimental studies. This study will provide valuable information for further exploring the mechanism of persimmon fruit size formation.

2. Results

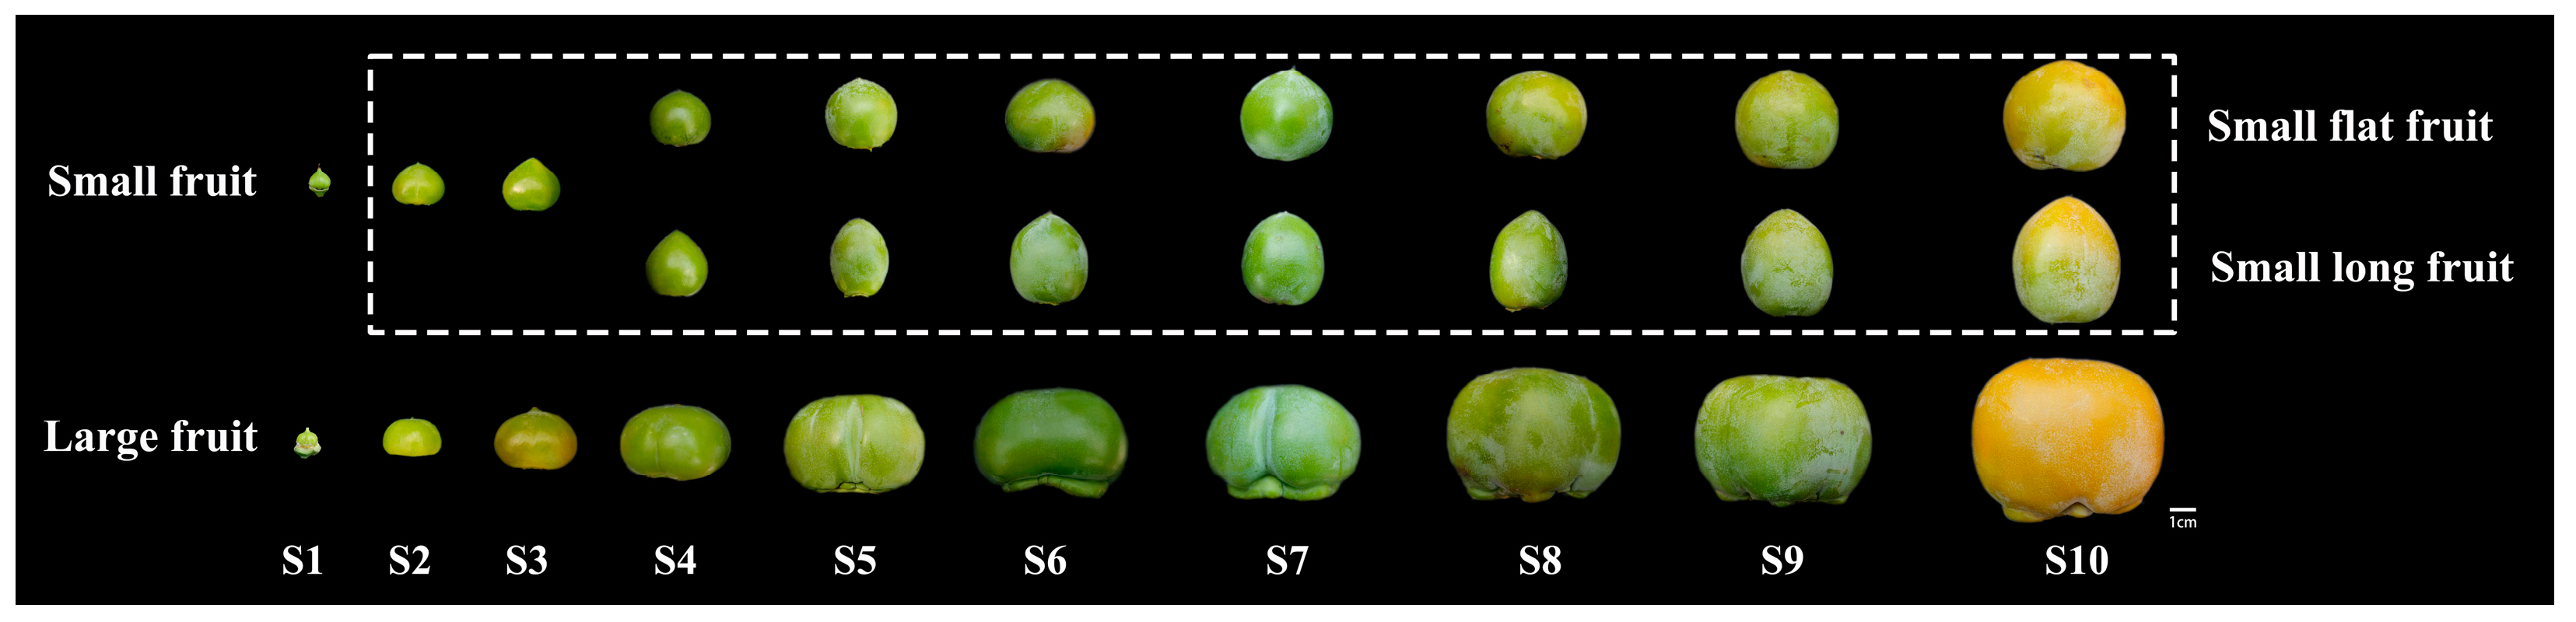
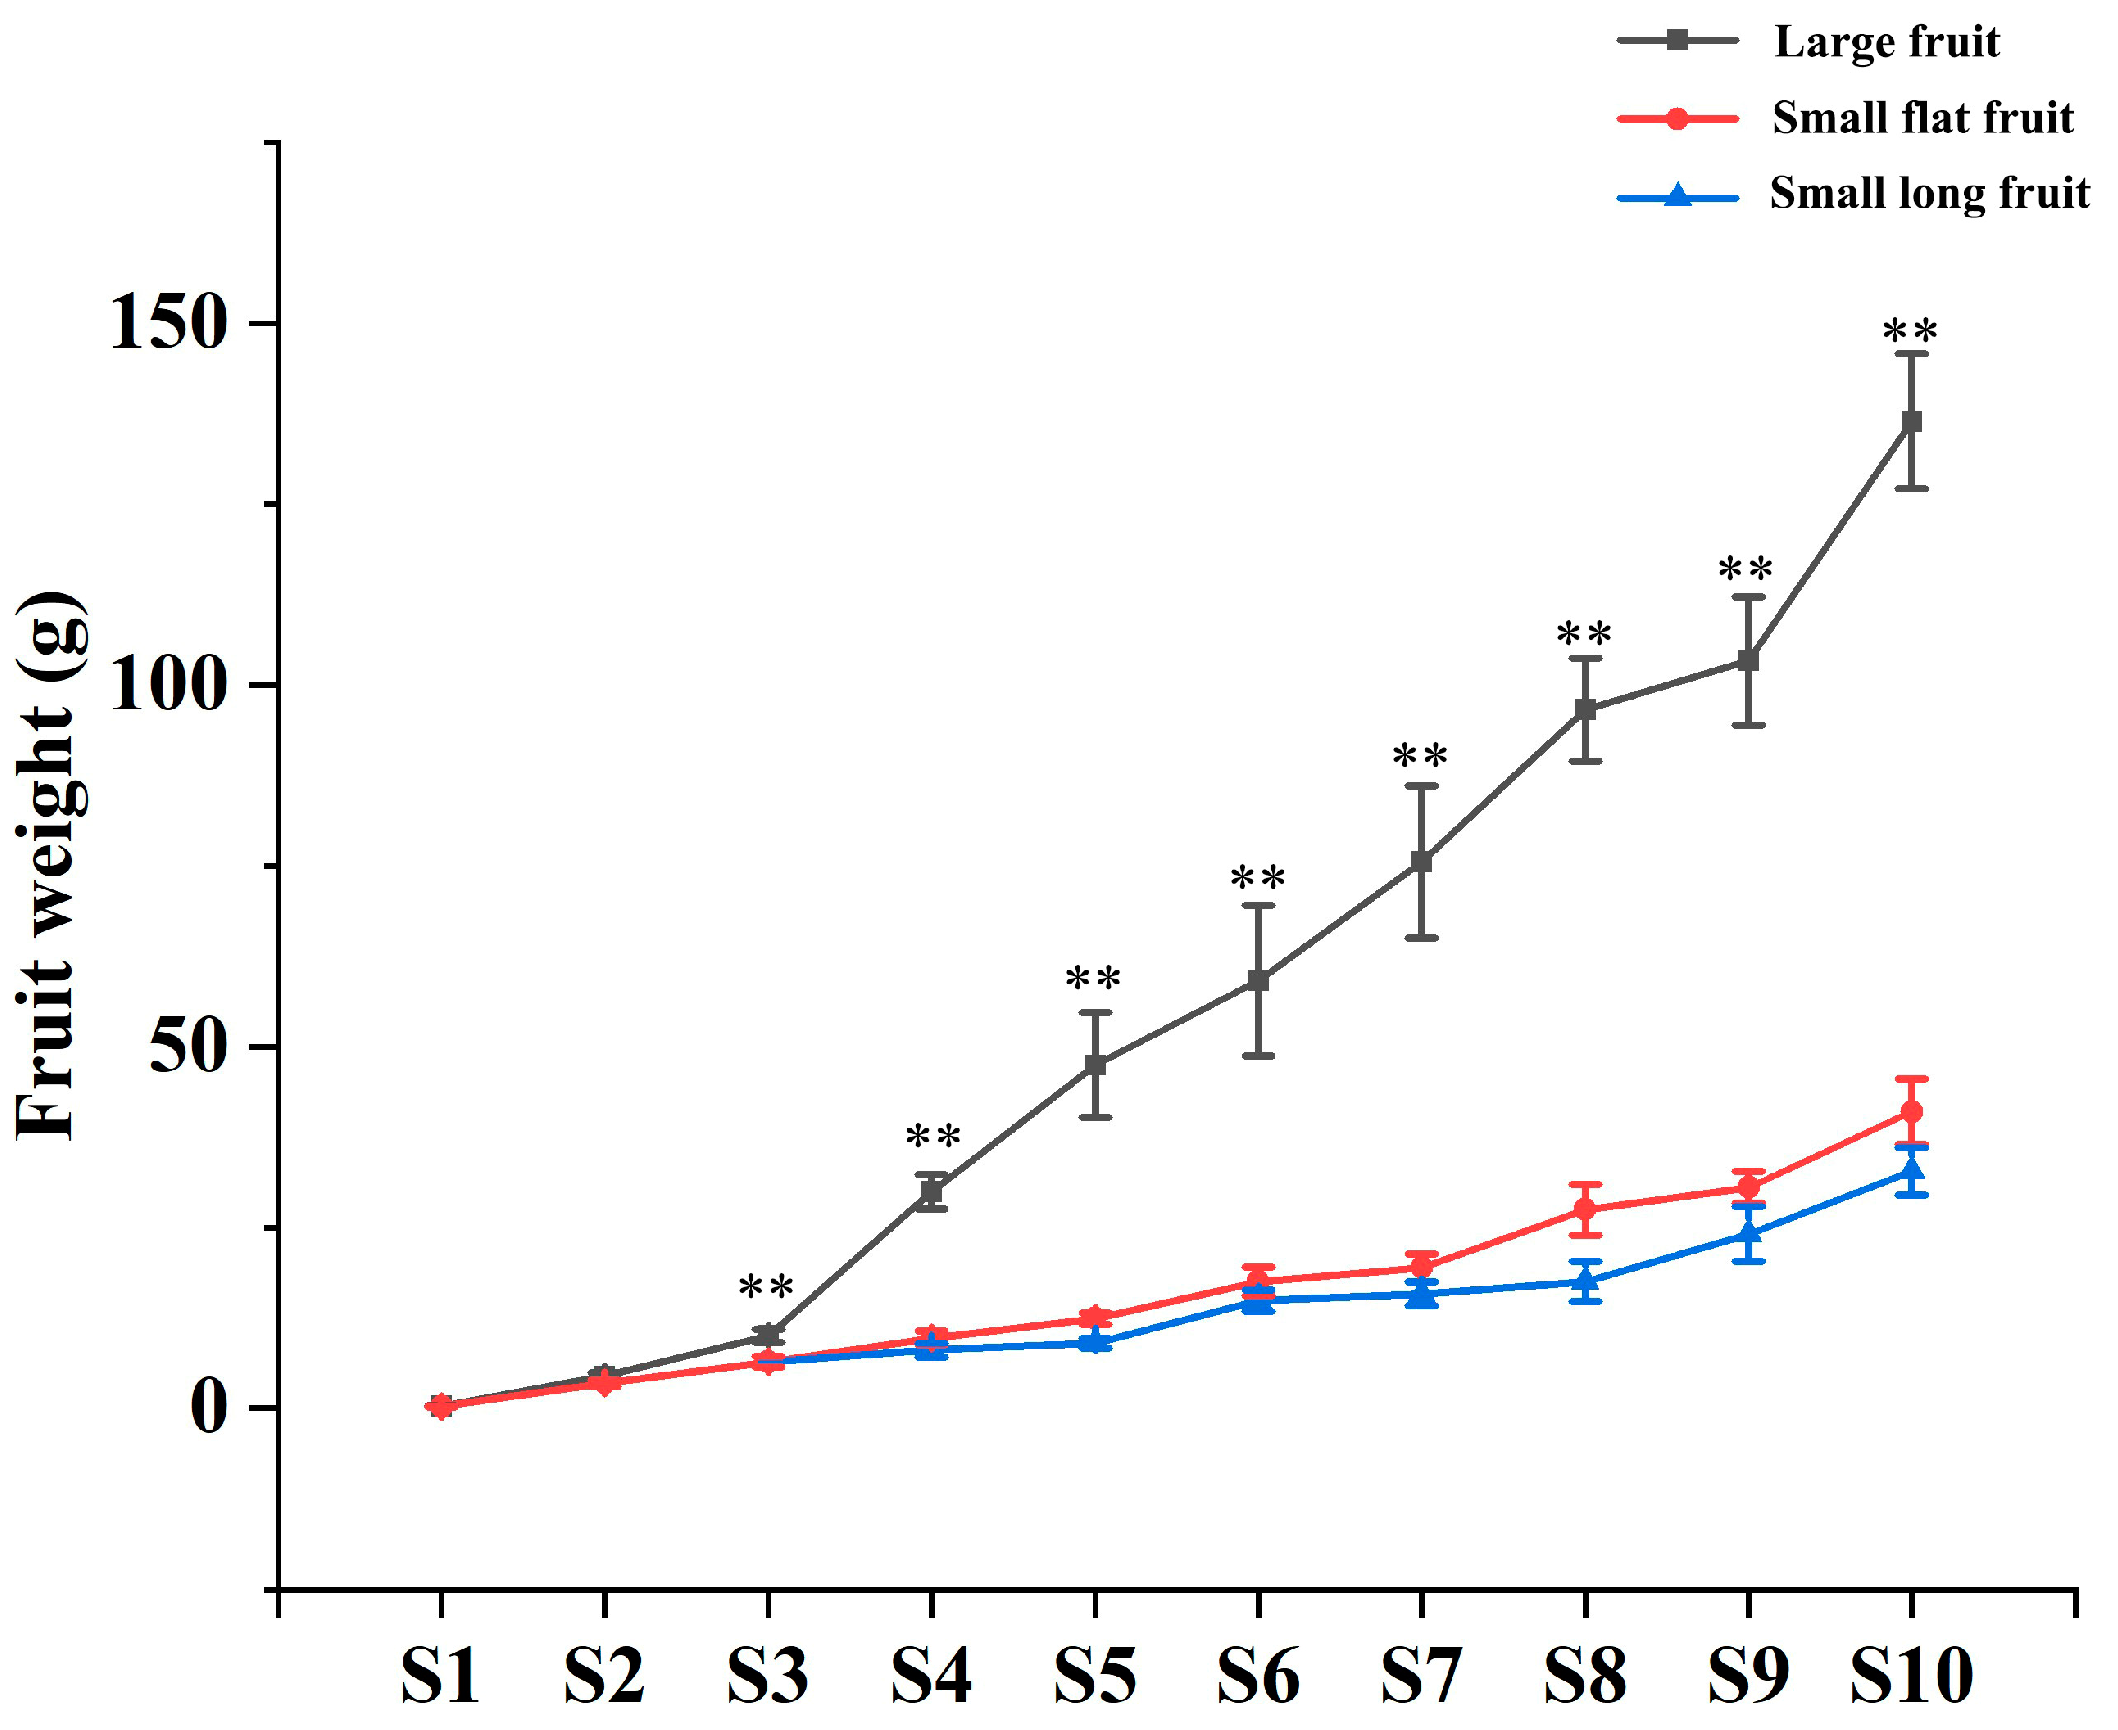
2.1. Morphological Comparison of Fruit

The ‘Yaoxianwuhua’ persimmon is polygamomonoecious with a male flower, female flower and hermaphroditic flower. Interestingly, there is a significant difference in fruit size between female flower fruit and hermaphroditic flower fruit. Large fruit (LF) was produced by female flowers. Small fruit (SF), including small long fruit (SLF) and small flat fruit (SFF), were produced by hermaphroditic flowers. In order to study the reasons for the formation of different fruit sizes, we observed the phenotype of fruits throughout the development period. In this study, fruit size was measured by fruit weight (FW). In stages 1–2 (May 15–May 29), there was no significant difference in FW of LF and SF. In stage 3 (June 11), the FW began to differentiate, and the FW of LF was greater than that of SF. From stage 4 to stage 10 (June 25–September 15), SF differentiated into SFF and SLF. The FW of SF increased slightly, while the FW of LF increased substantially (Figure 1 and Figure 2). Therefore, stages 3–4 (June 11–June 25) are crucial for the morphological differentiation of LF and SF in persimmon.

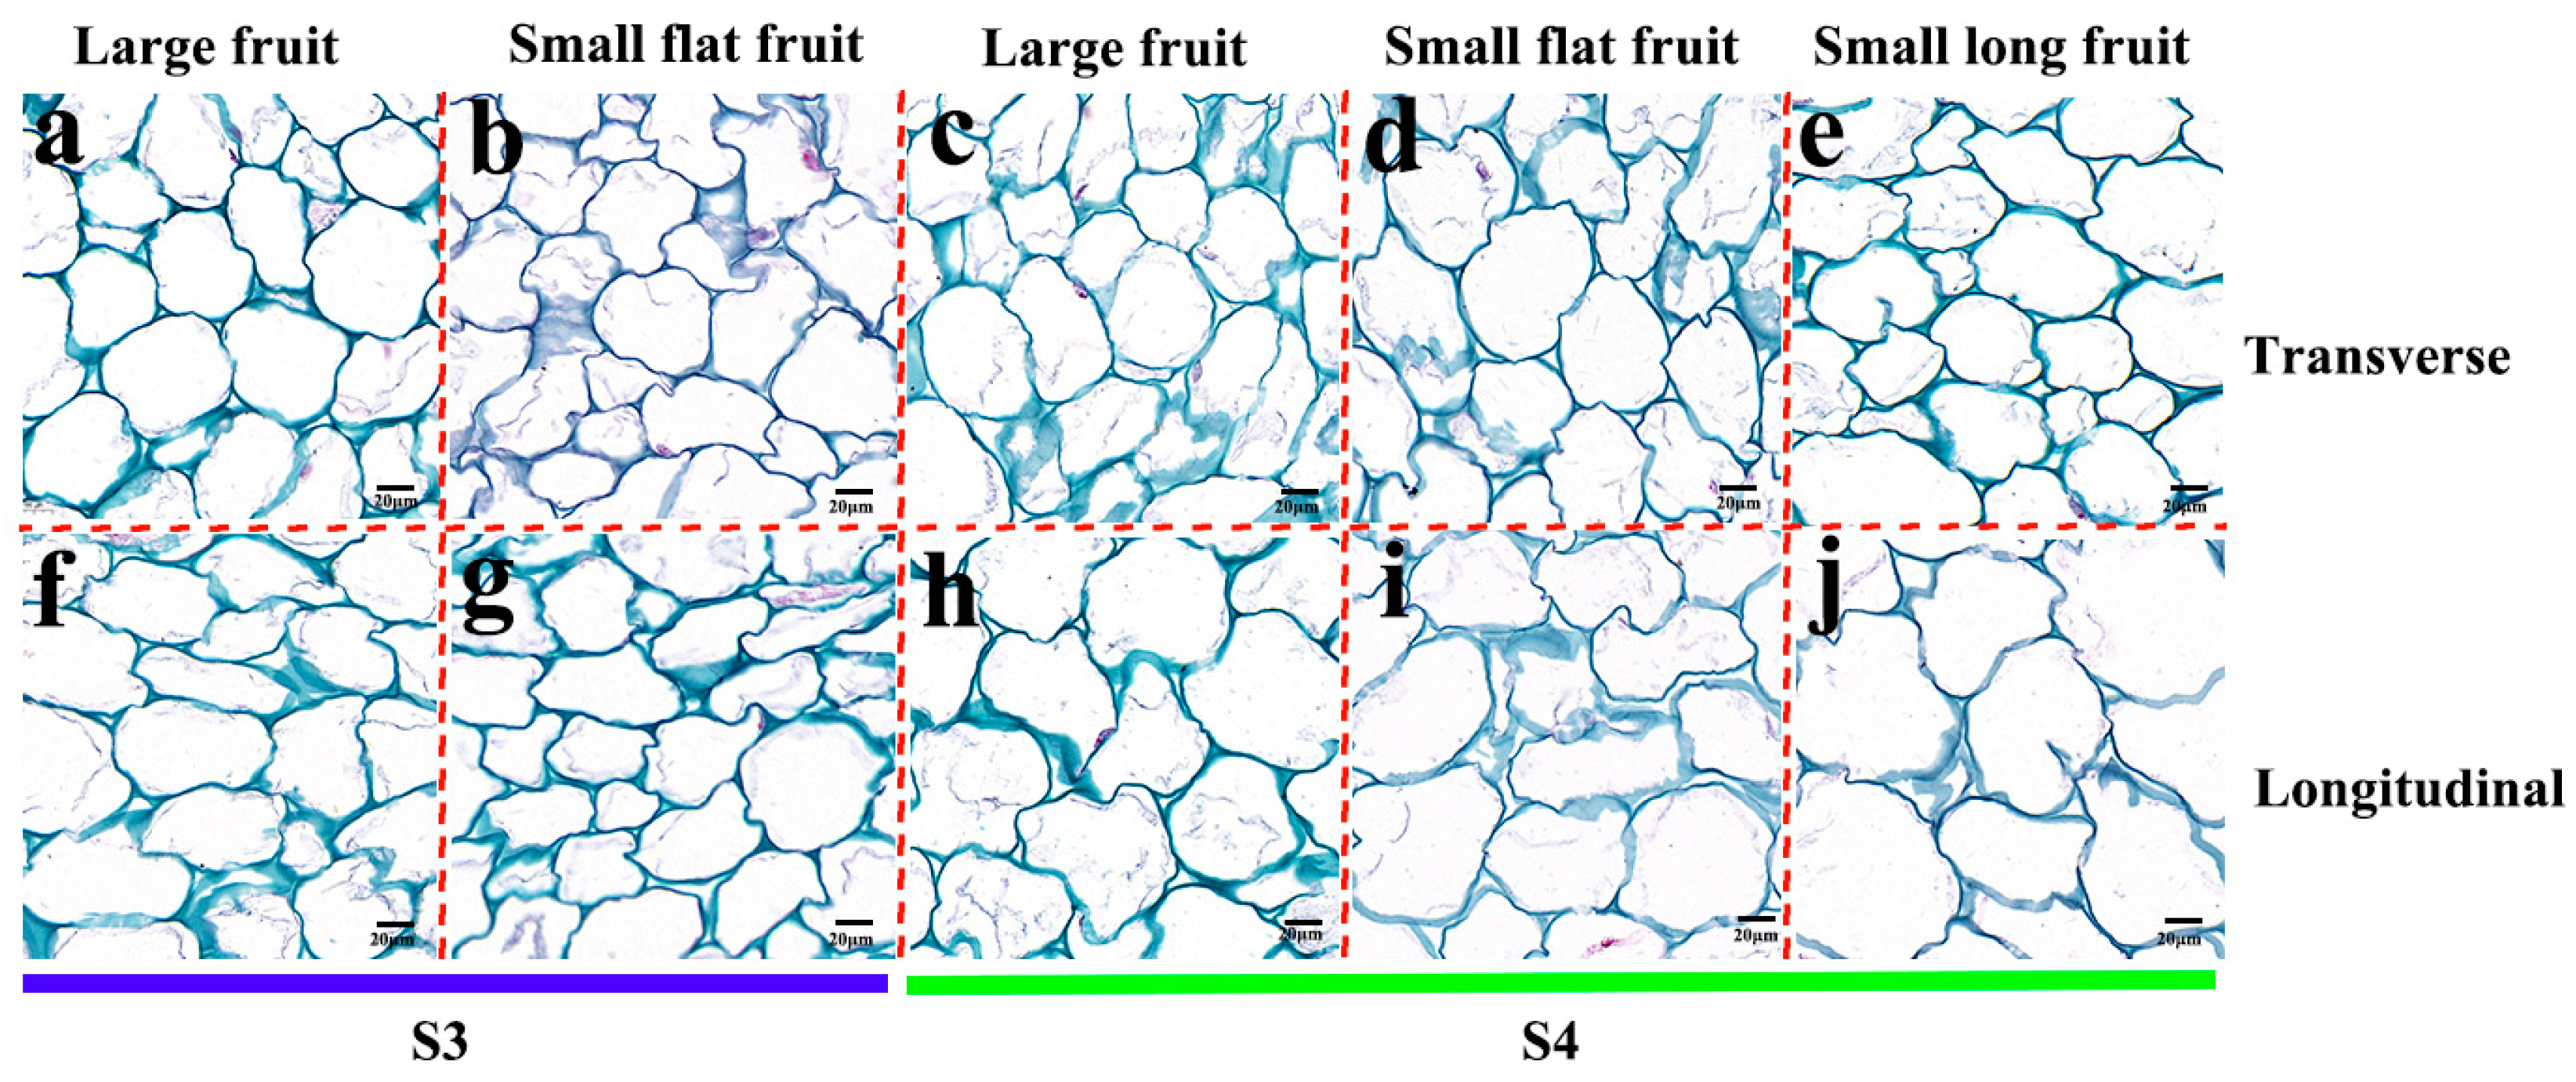
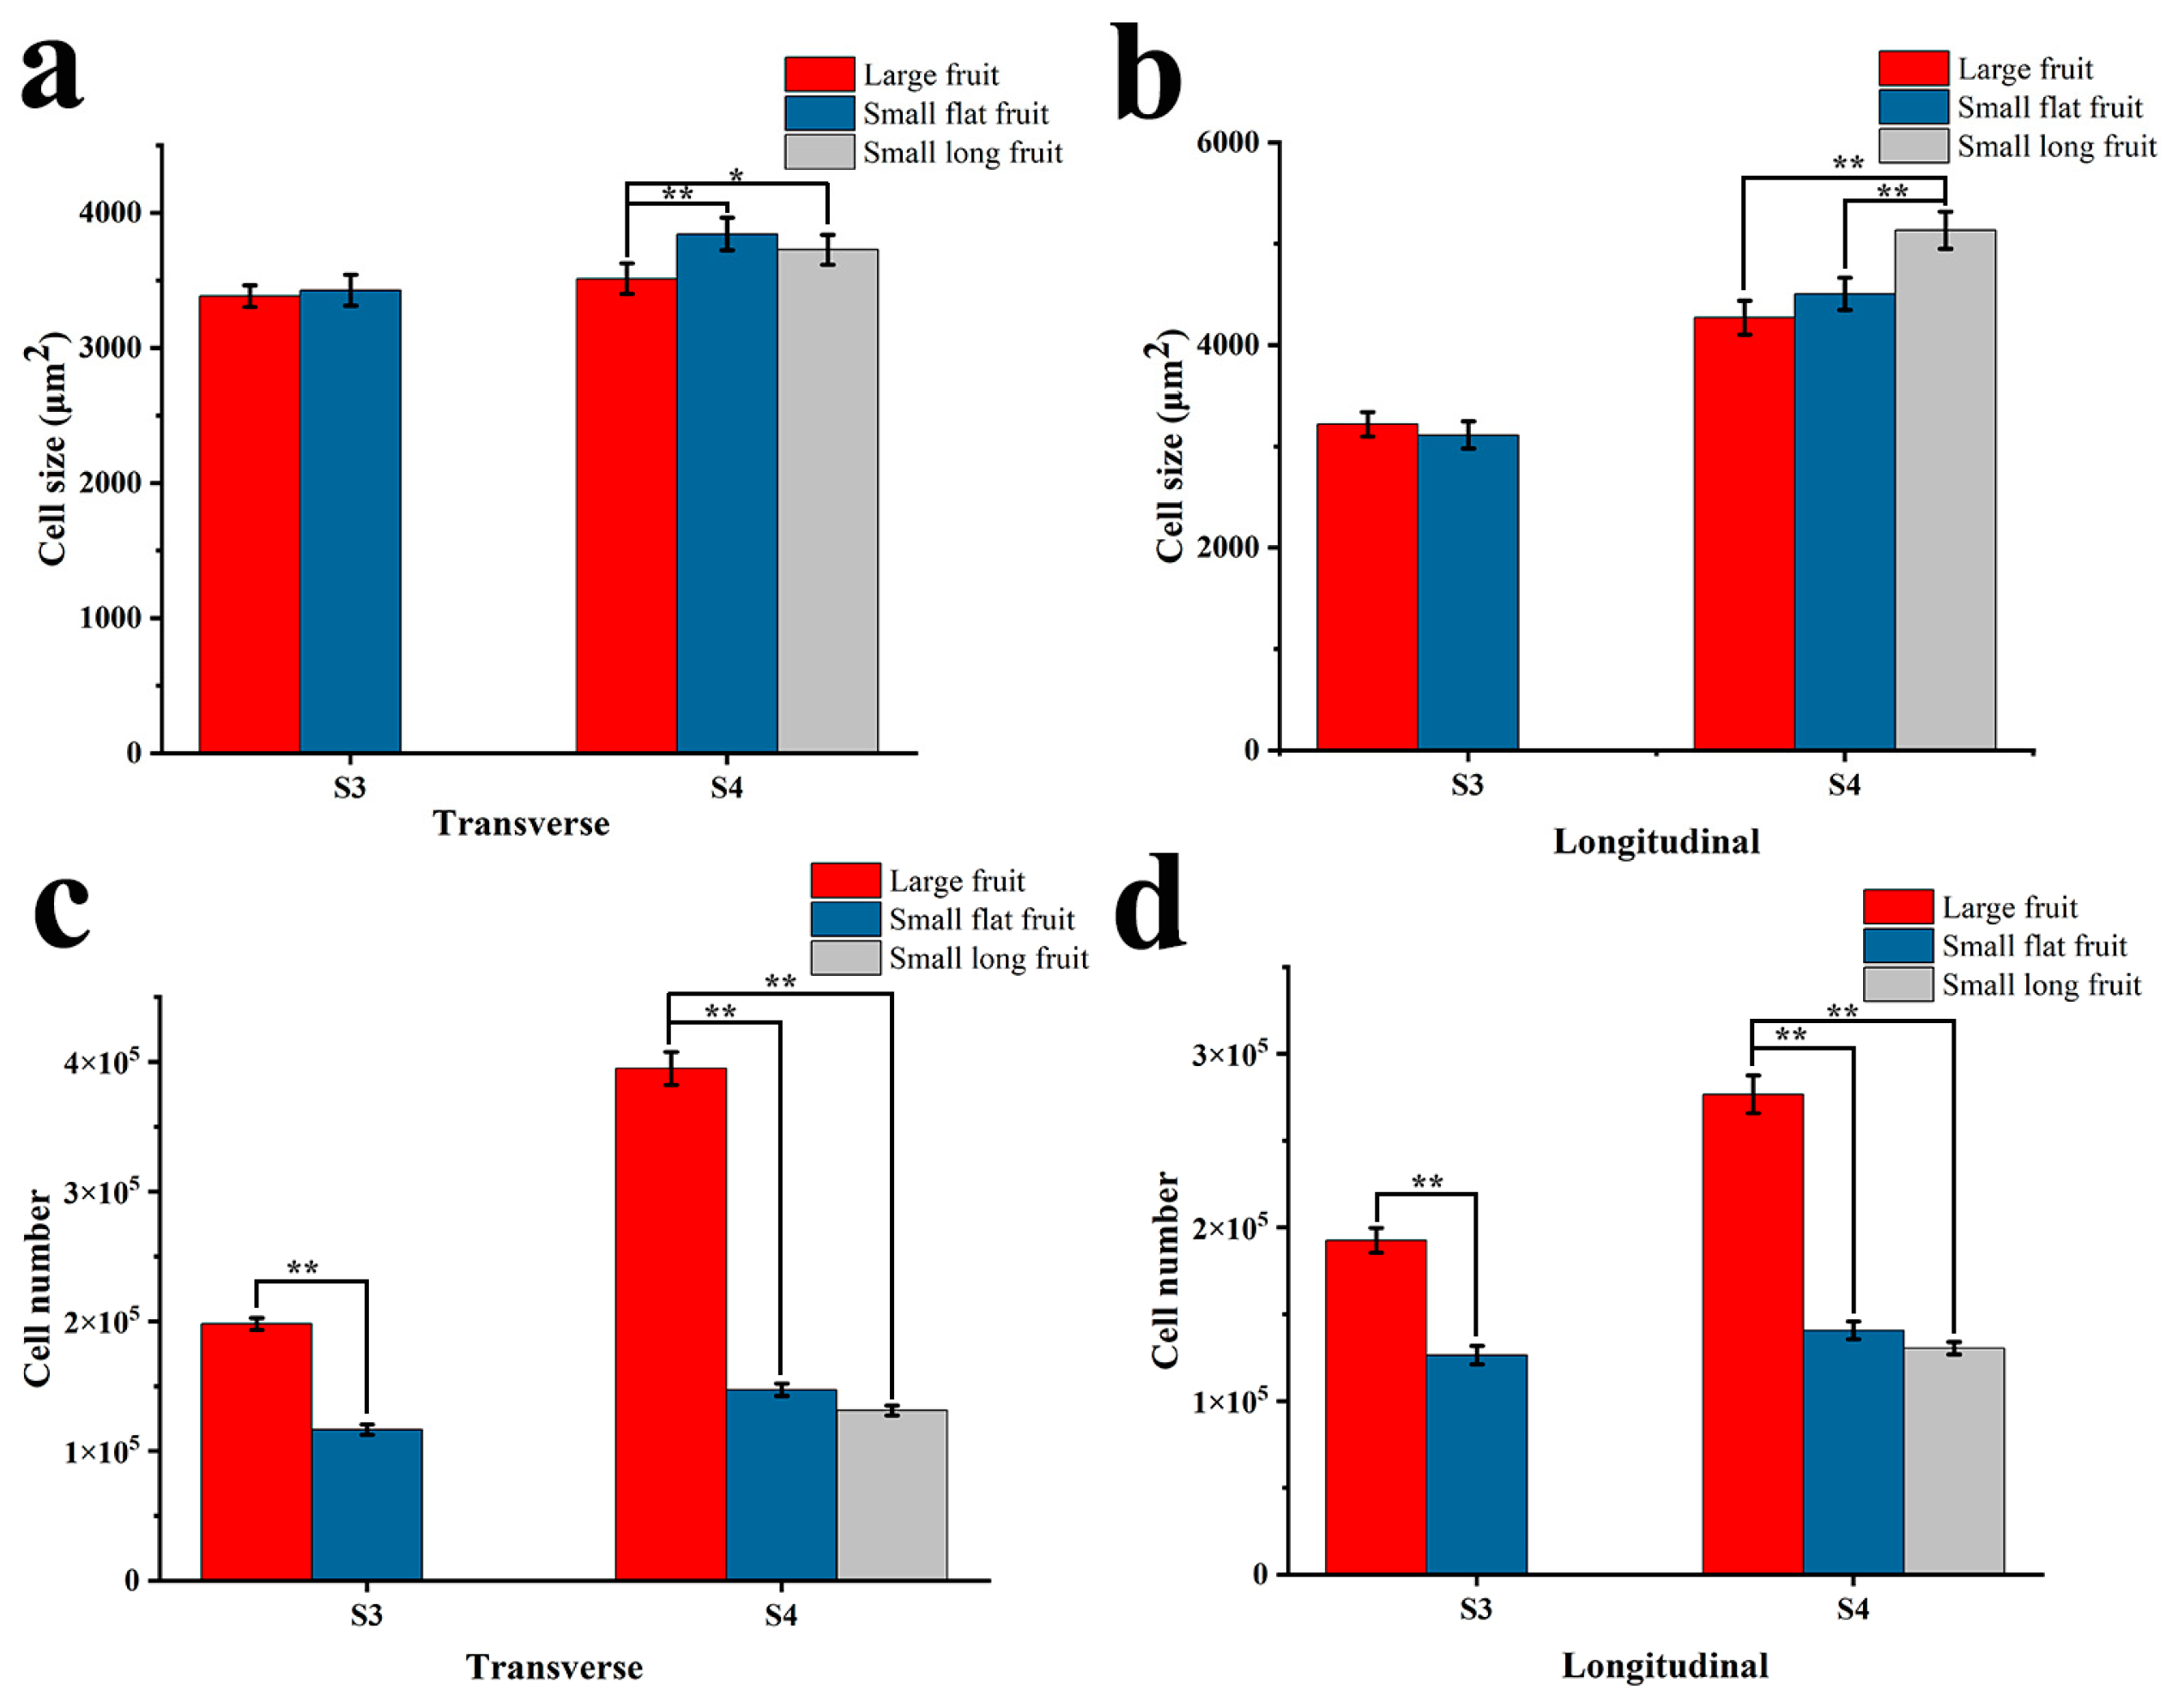
2.2. Cytological Observation

In order to observe the difference between LF and SF cells during the crucial morphological period, the fruit tissues were sliced (Figure 3). In stage 3, there was no difference in cell size between LF and SF (Figure 3a,b,f,g and Figure 4a,b). In stage 4, the cell size of SFF and SLF on the transverse section, as well as SLF on the longitudinal section, were significantly larger than that of LF, but there is no difference between LF and SFF on the longitudinal section (Figure 3c–e,h–j and Figure 4a,b). In stages 3 and 4, the cell number of LF is significantly more than that of SF in both the transverse section and longitudinal section (Figure 4c,d). The above results showed that in the crucial morphological period, the differentiation of fruit size is not determined by cell size but by cell number.

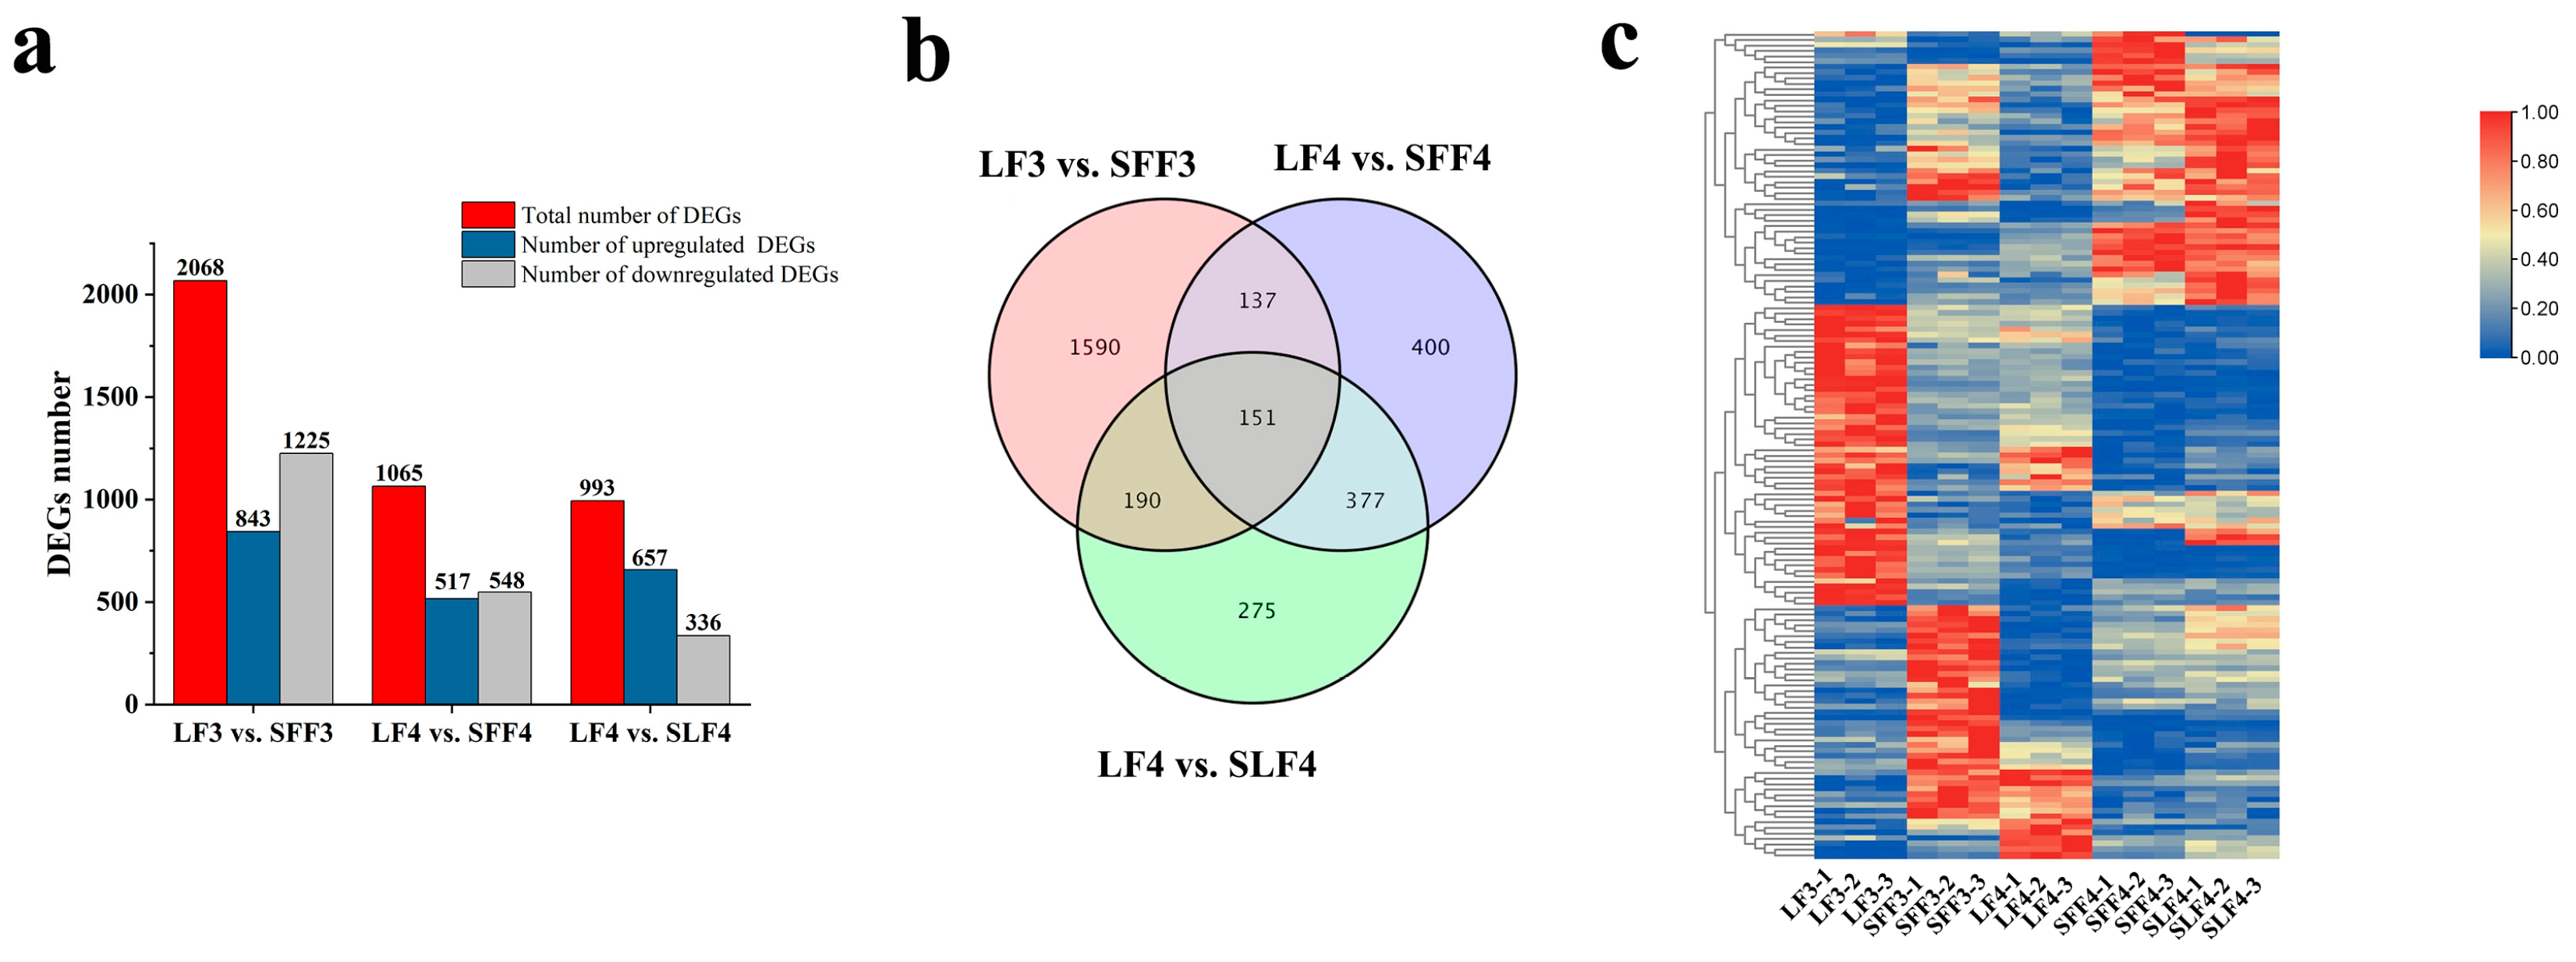
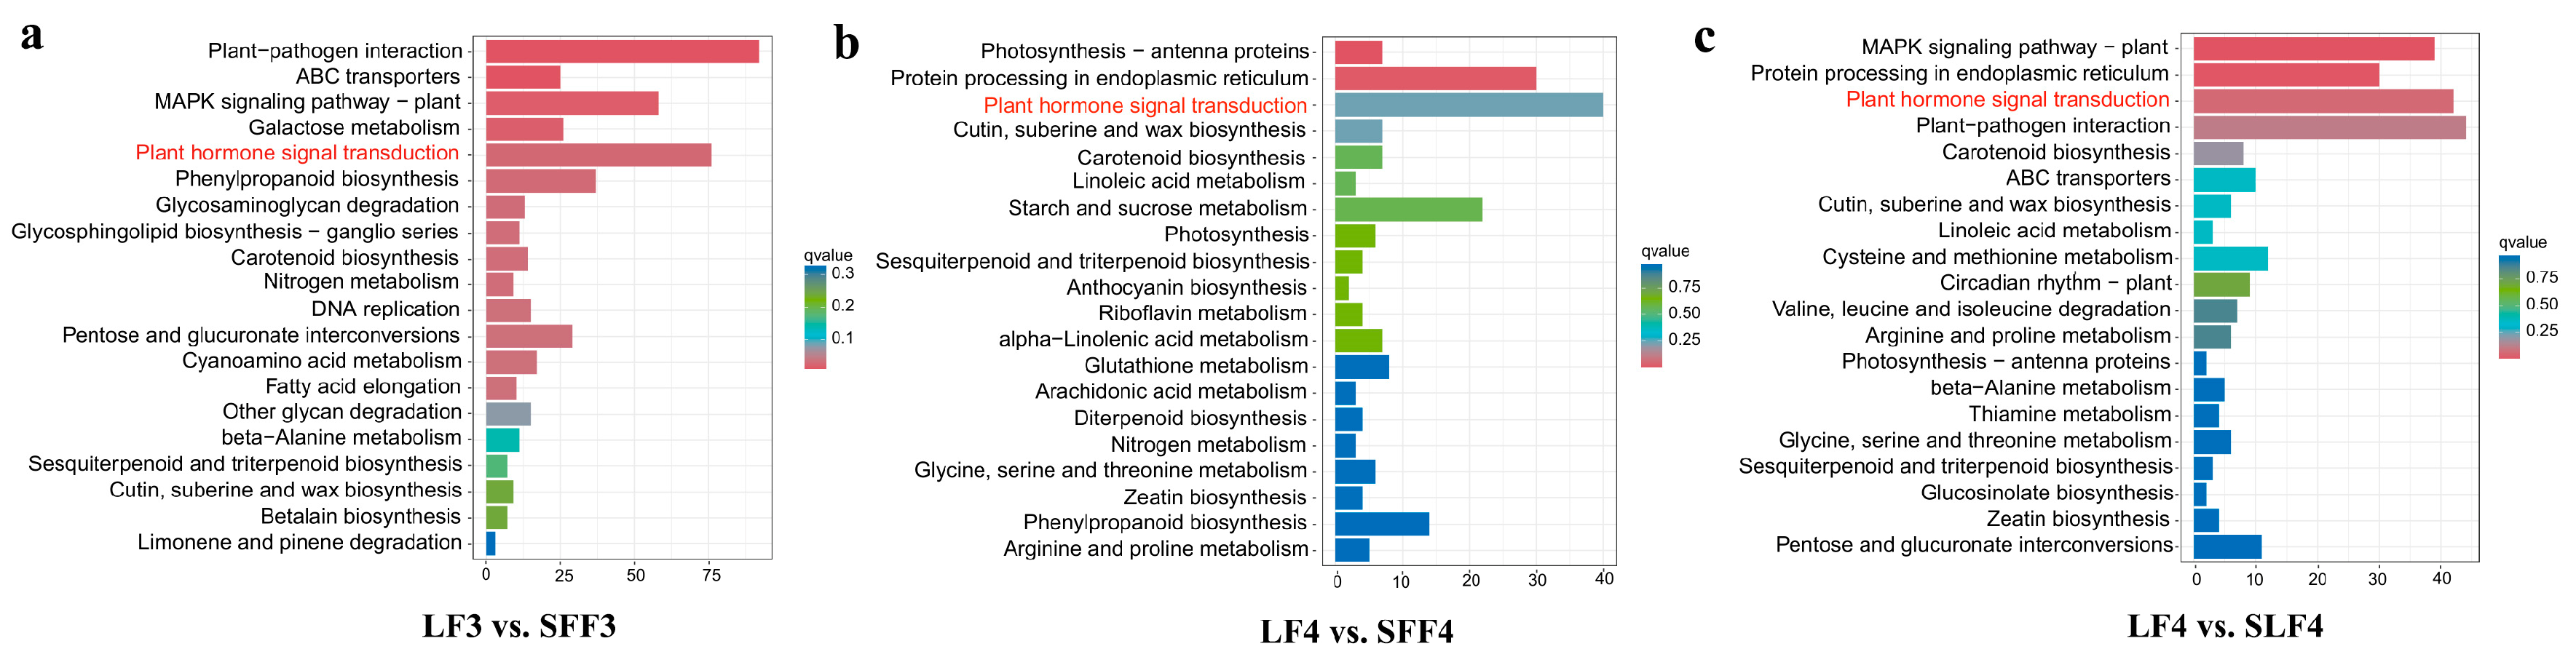
2.3. Transcriptome Sequencing

To identify the mRNA expression profiles in LF and SF, 15 cDNA libraries were constructed in stage 3 (LF3-1, LF3-2 and LF3-3 for the LF; SFF3-1, SFF3-2 and SFF3-3 for the SF) and stage 4 (LF4-1, LF4-2 and LF4-3 for the LF; SFF4-1, SFF4-2, SFF4-3, SLF4-1, SLF 4-2 and SLF4-3 for the SF) using total RNA and sequenced them on the NovaSeq 6000 platform. A total of 346.70Mb clean reads were obtained after eliminating low-quality reads (Table S1). Over 85.44% of the reads were mapped to the reference D. kaki genome (Table S2).
The differentially expressed genes (DEGs) were compared using DESeq2 software. A total of 2068, 1065 and 993 DEGs were identified in LF3 vs. SFF3, LF4 vs. SFF4 and LF4 vs. SLF4, respectively (Figure 5a). Compared with the LF3, 843 genes were upregulated, and 1225 genes were downregulated in SFF3 (Figure 5a). Compared with the LF4, 517 genes were upregulated, and 548 genes were downregulated in SFF4; 657 genes were upregulated, and 336 genes were downregulated in SLF4, respectively (Figure 5a). In addition, a total of 151 DEGs were shared by LF3 vs. SFF3, LF4 vs. SFF4 and LF4 vs. SLF4 (Figure 5b,c).
Further analysis of DEGs was performed using the KEGG database. The plant hormone signal transduction was enriched in groups LF3 vs. SFF3, LF4 vs. SFF4 and LF4 vs. SLF4, suggesting that plant hormones play an important role in regulating persimmon fruit size (Figure 6).

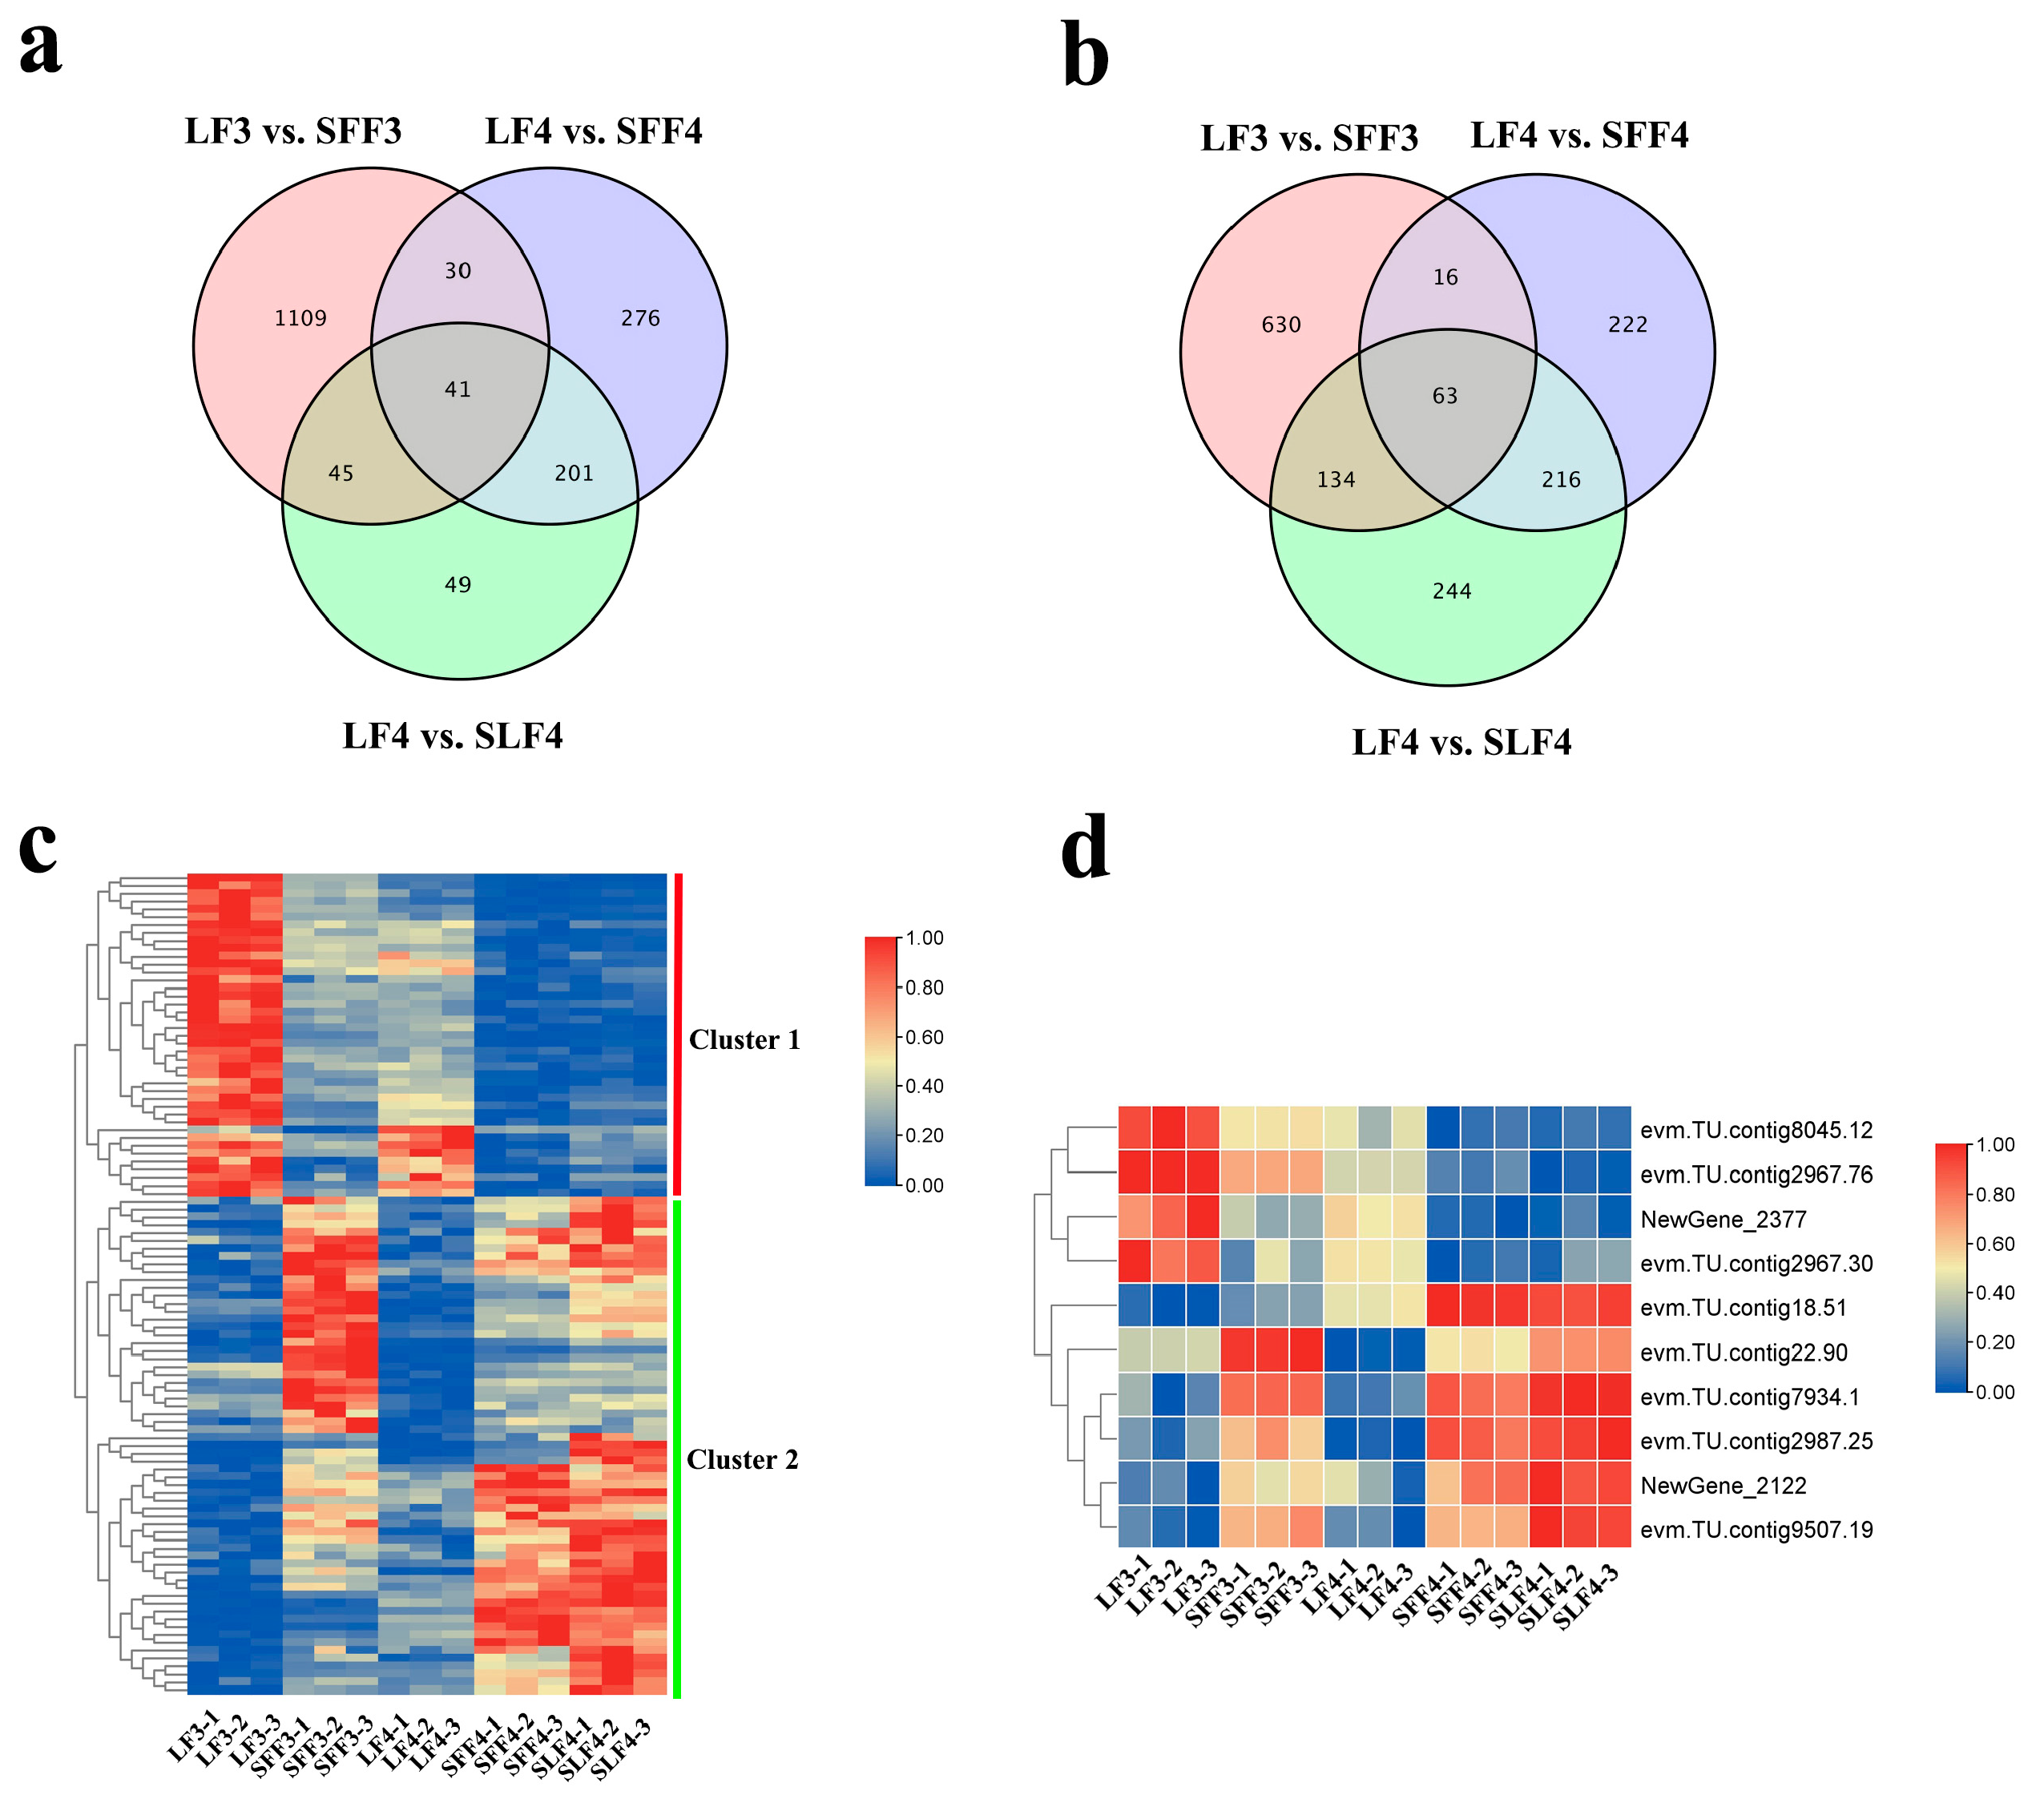
2.4. Candidate Genes Identification

Forty-one DEGs (cluster 1) were co-downregulated, and 63 DEGs (cluster 2) were co-upregulated in SFF3, SFF4 and SLF4 (Figure 7a–c; Table S3). Among them, six DEGs related to plant hormones were identified: ABP19A (NewGene_2122), CYP707A4 (evm.TU.contig18.51), ERS1 (evm.TU.contig22.90) and ERF114 (evm.TU.contig7934.1) were co-upregulated, and GAI1 (evm.TU.contig8045.12) and At3g51470 (NewGene_2377) were co-downregulated in SFF3, SFF4 and SLF4 (Figure 7d; Table S4).
Four DEGs related to cell division were identified: LAC17 (evm.TU.contig9507.19) and CNR1 (evm.TU.contig2987.25) were co-upregulated, and ANT (evm.TU.contig2967.76) and EB1C (evm.TU.contig2967.30) were co-downregulated in SFF3, SFF4 and SLF4 (Figure 7d; Table S4).

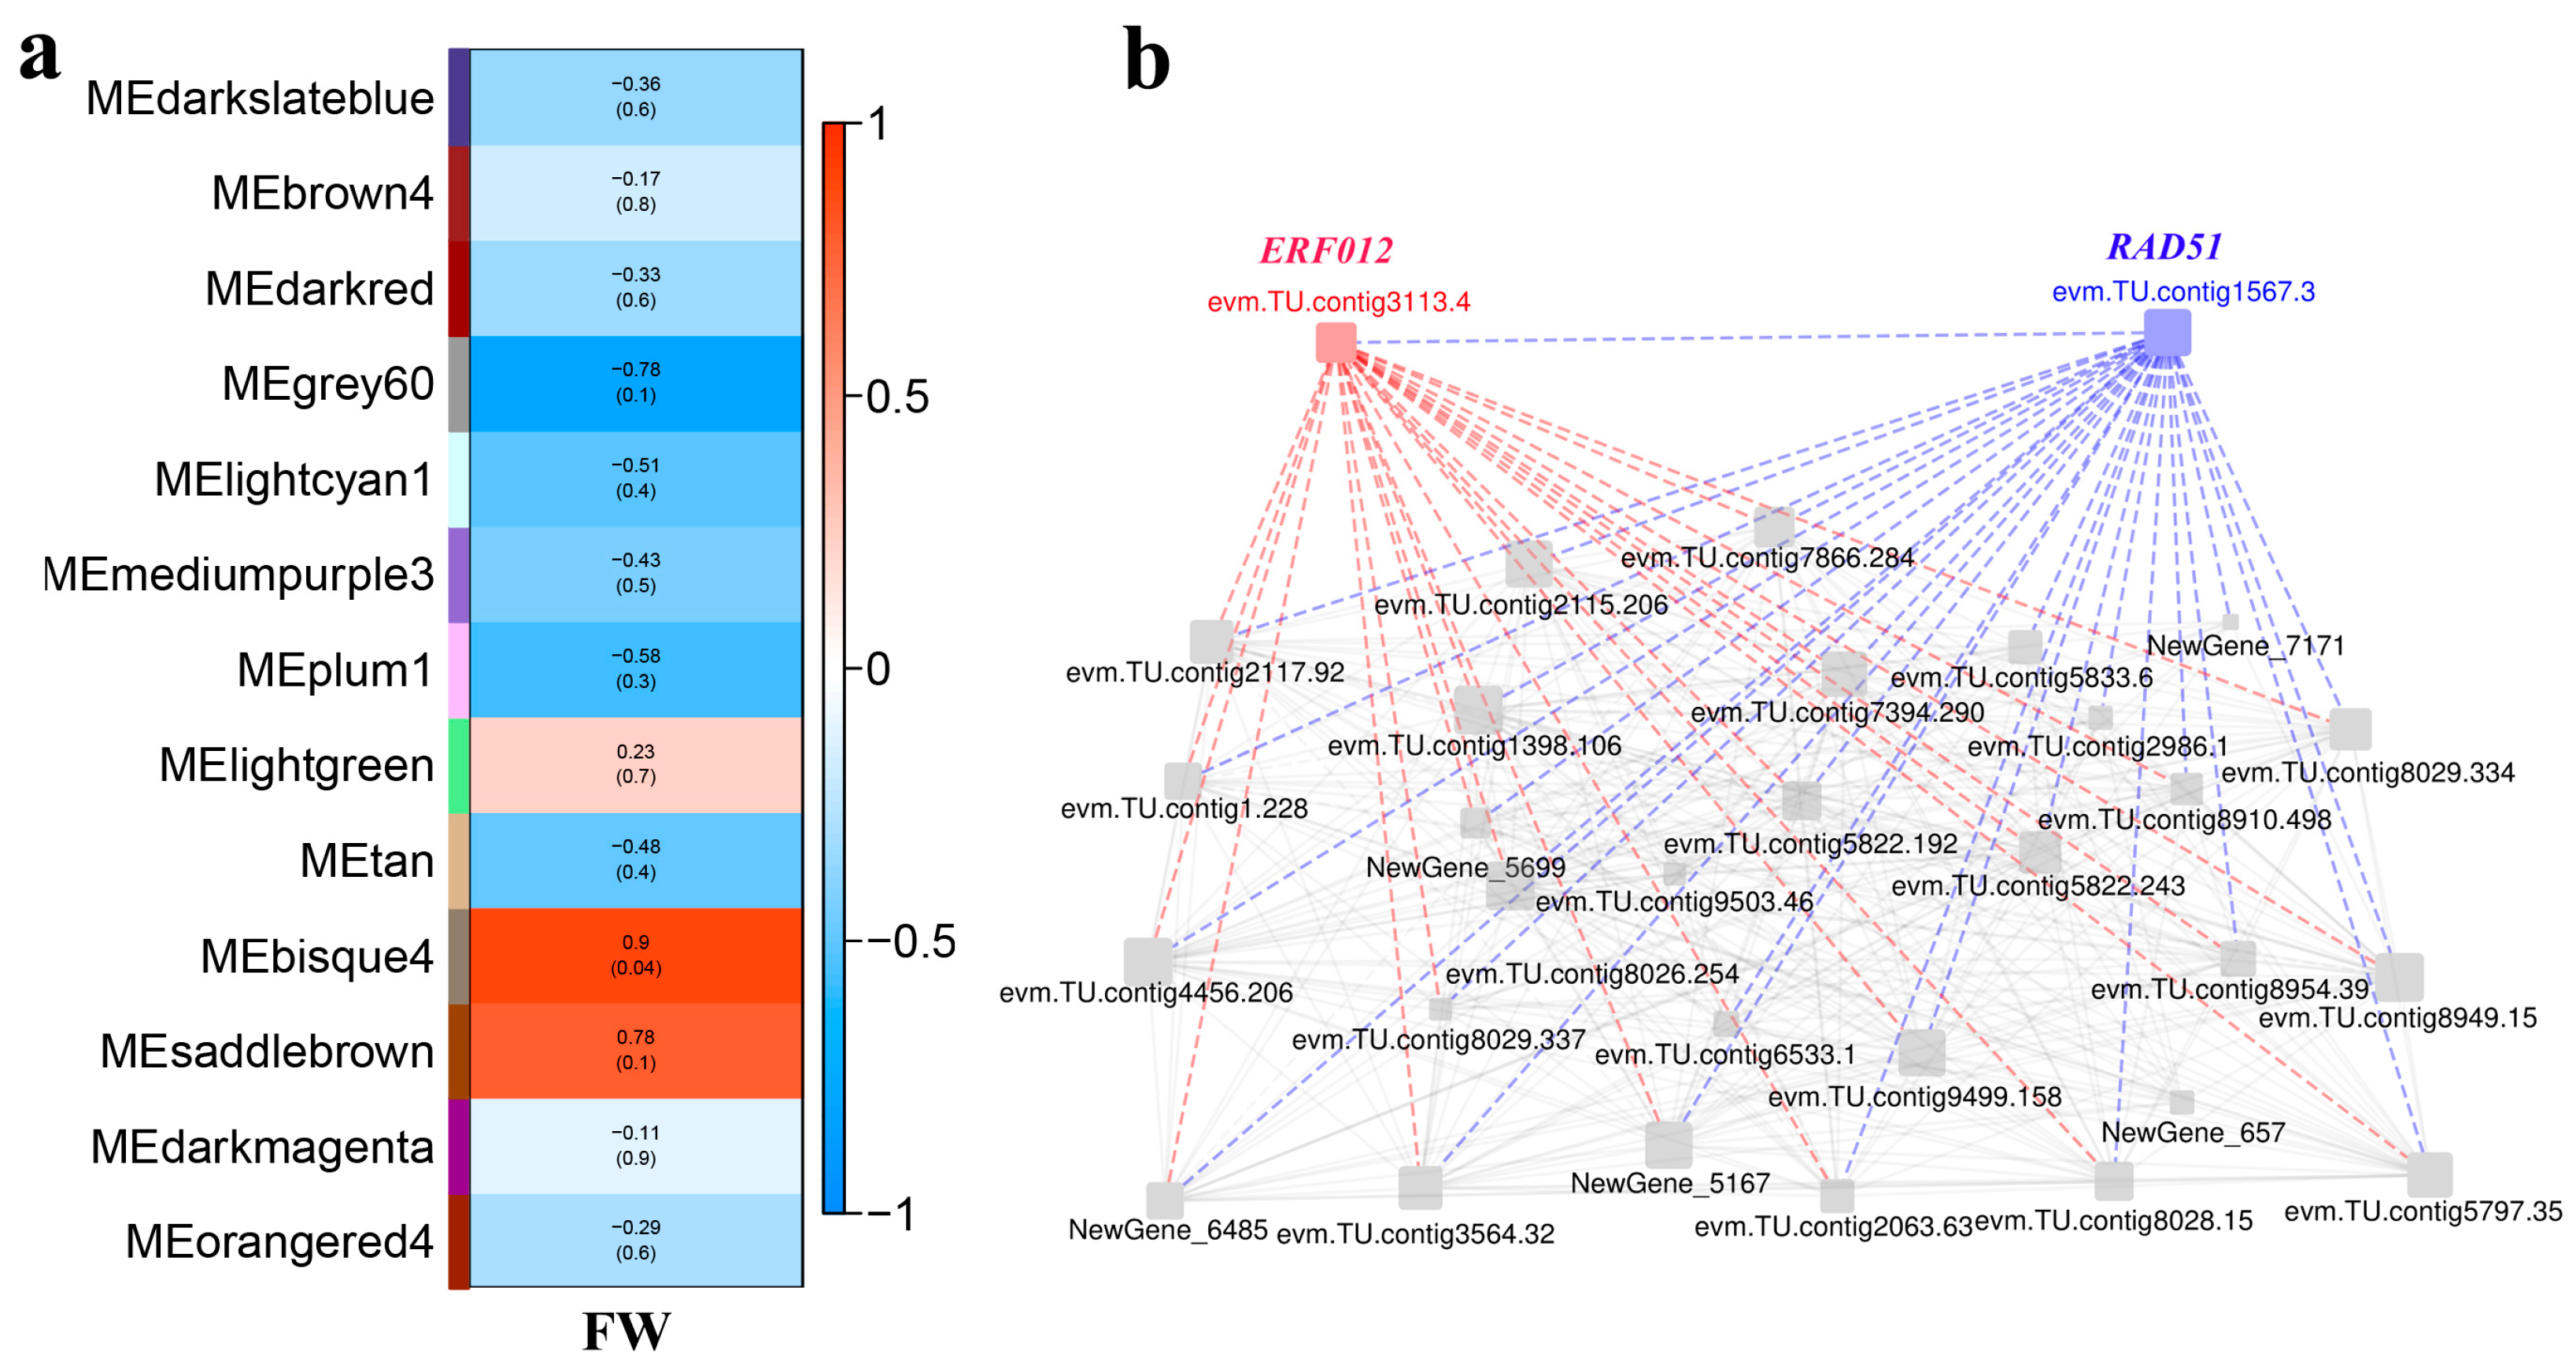
2.5. Weighted Gene Co-Expression Network (WGCNA)

To identify the gene regulatory networks associated with the persimmon fruit size, the correlation relationships between gene expression and FW were analyzed using WGCNA. A total of 26,905 genes were performed by WGCNA analysis, and 13 merged co-expression gene modules were identified. Only the bisque4 module showed a significant positive correlation with FW (Figure 8a). Further analysis revealed that 31 genes related to FW were identified in the module.
The highly connected genes of the bisque4 module were further investigated as potential key factors related to persimmon FW variation. The gene co-expression network identified two genes, ERF012 (evm.TU.contig3113.4), related to ethylene signal transduction, and RAD51 (evm.TU.contig1567.3), related to cell division, showing a close correlation with the FW (Figure 8b).

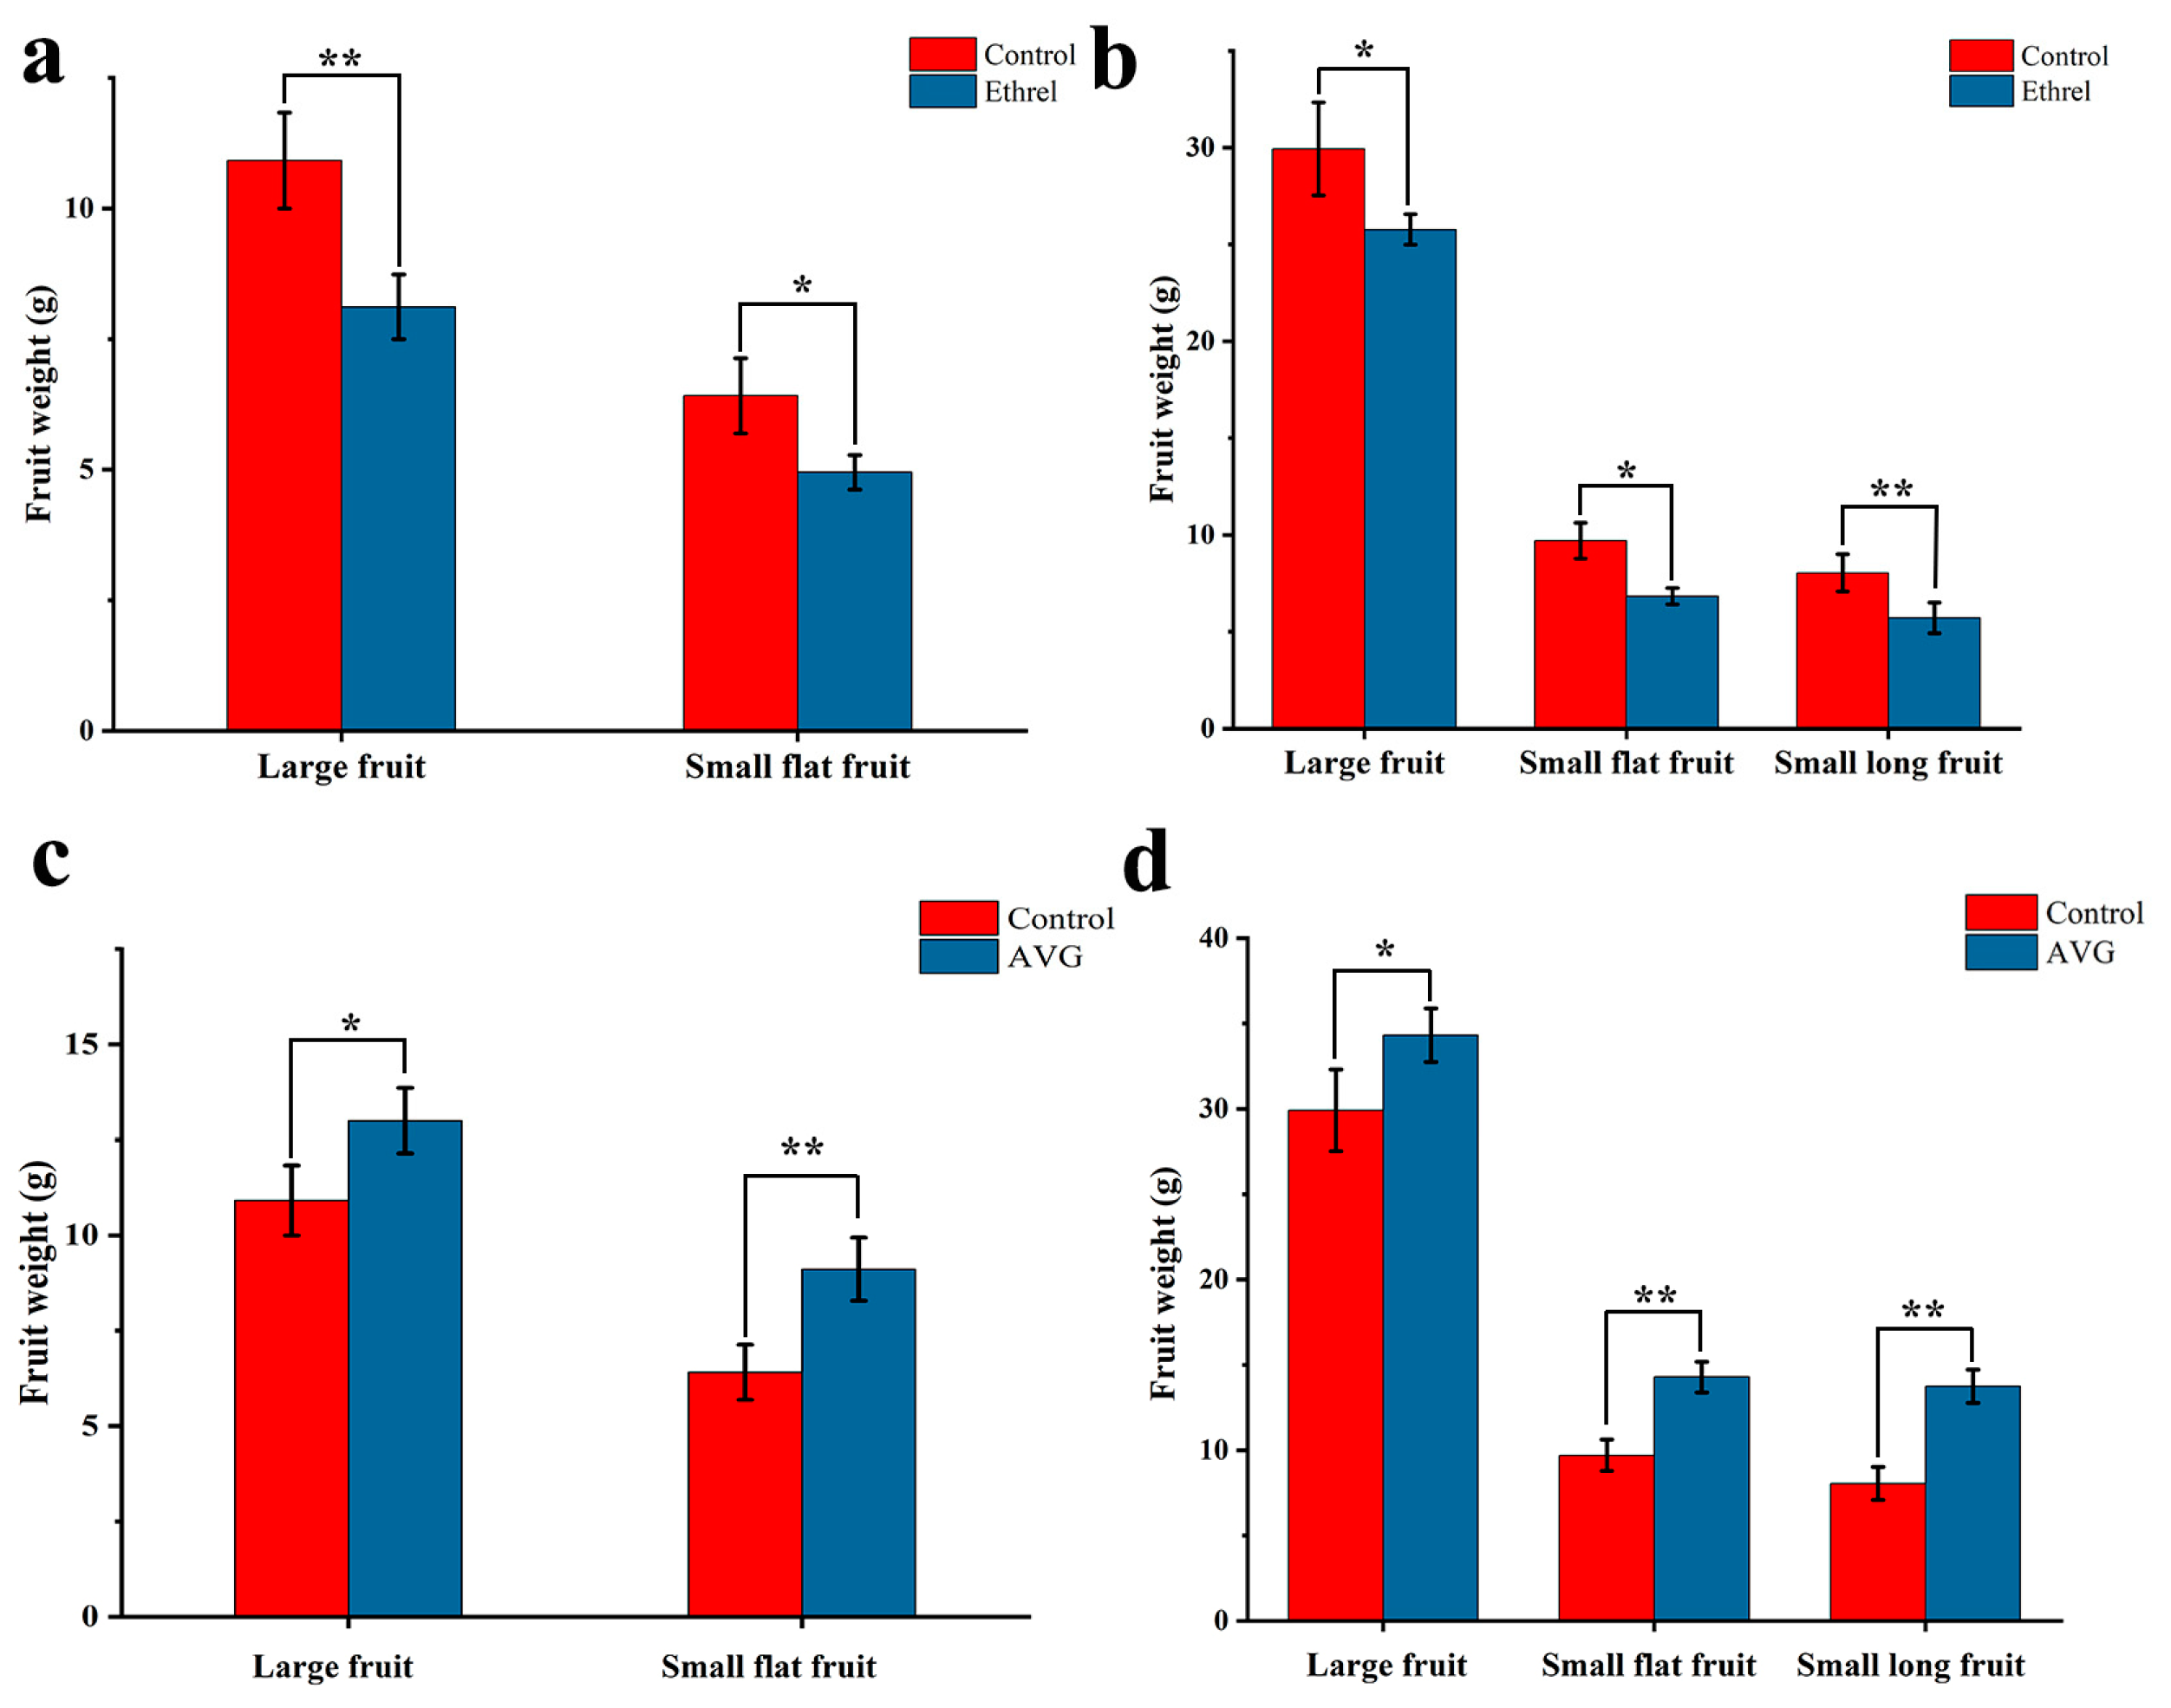
2.6. Application of Ethrel and Aminoethoxyinylglycine
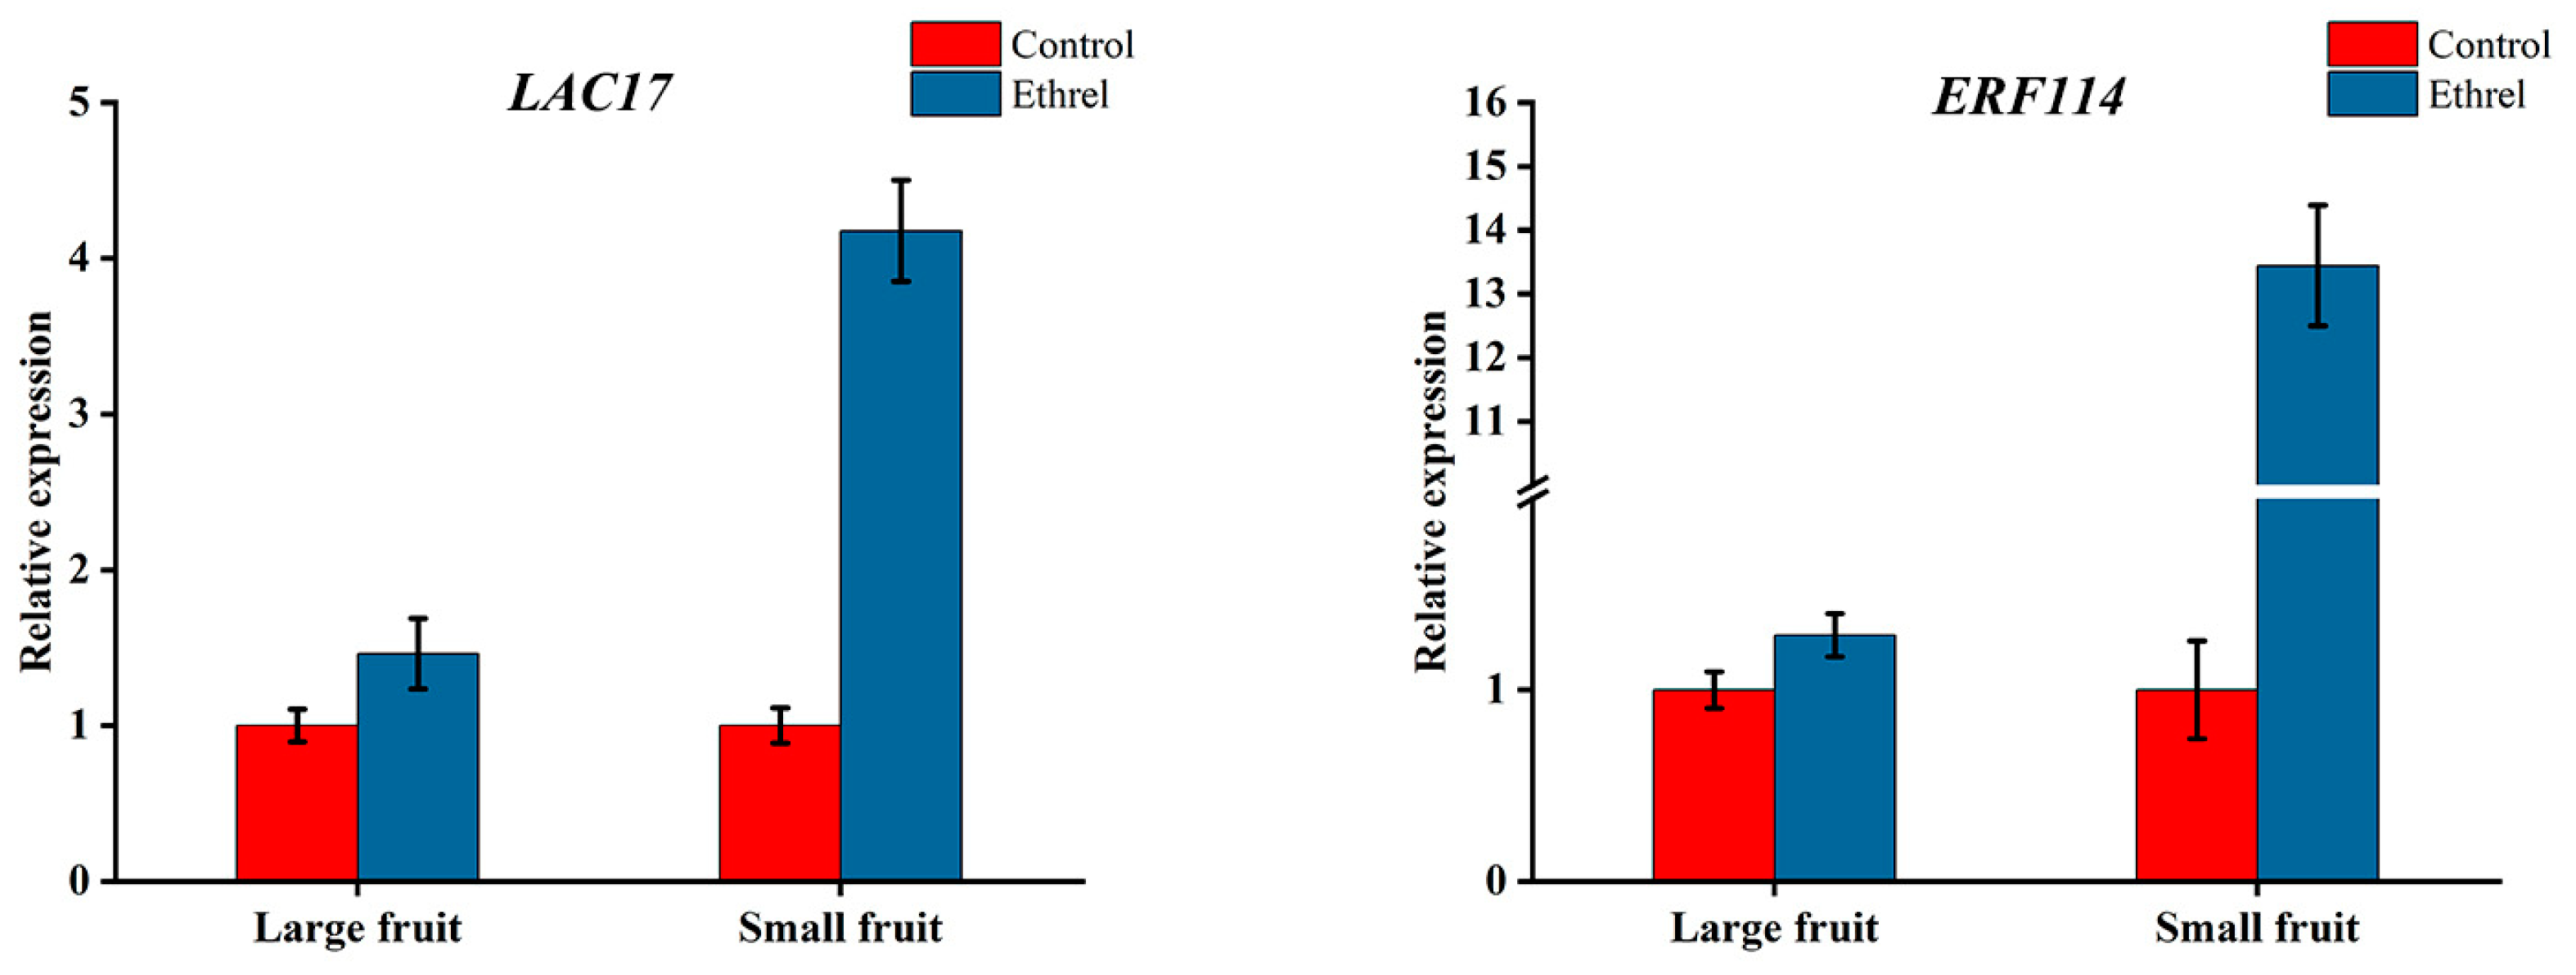
Ethylene response factors, ERS1 and ERF114, were identified as key candidate genes, indicating that ethylene plays an important role in persimmon fruit size formation. To verify the regulatory effect of ethylene on persimmon fruit size, we applied 100 mg/L of ethrel and 100 mg/L aminoethoxyinylglycine (AVG: ethylene inhibitor) to observe the change in FW. Compared with the control, the FW of LF and SF treated with ethrel decreased in stages 3 and 4, while the FW of LF and SF treated with AVG increased in these two stages (Figure 9).

2.7. qRT-qPCR

After ethrel treatment, LAC17 (evm.TU.contig9507.19) and ERF114 (evm.TU.contig7934.1) were upregulated, which was consistent with the transcriptome result (Figure 10). This result not only proved the accuracy of the transcriptome data but also showed that ethylene can regulate fruit size by affecting cell division.

3. Discussion

The most common cultivated persimmon species is hexaploid (2n = 6x = 90), with abundant variation in fruit size [19,20]. The inconsistency in genetic background among different varieties causes interference in studying the mechanism of persimmon fruit size formation. Polygamomonoecious persimmon ‘Yaoxianwuhua’ can produce different types of fruit of different sizes, which is an ideal material for studying the regulating mechanism of persimmon fruit size. In this study, the result of morphological observation showed that stages 3–4 (June 11–June 25) are crucial periods for the differentiation of LF and SF in persimmon.
Fruit size is influenced by the cell number or cell size. In cucumber (Cucumis sativus), small fruits tend to be composed of smaller cells, while some small fruits with lower cell numbers and larger cells also exist [11,21,22]. In apple (Malus pumila) and pineapple (Ananas comosus), fruit size is determined by both cell number and cell size [23,24]. In melon (Cucumis melo), sweet cherry (Prunus avium), peach (Prunus persica) and pear (Pyrus spp), fruit size was mainly influenced by cell number [25,26,27,28]. In this study, there was no difference in cell size between LF and SFF in the transverse section in stage 3 and the longitudinal section in stages 3 and 4. However, the cell size of LF was significantly smaller than that in SLF on both the transverse and longitudinal sections in stage 4 and also significantly smaller than that in SFF on a transverse section at this stage. The cell number of LF was significantly greater than that of SF on both the transverse section and longitudinal section in stages 3 and 4. These results indicate that the difference in cell number is the main reason for the differentiation of persimmon fruit size. The accumulation of cell number is conducive to the subsequent increase in persimmon fruit size.
Cell division affects fruit size by regulating the cell number. Several genes involved in cell division related to fruit size formation were found in some studies. FW2.2, also known as CNR, was the first gene identified to control fruit size. FW2.2 influences fruit size by negatively regulating cell division in tomato [29,30]. In maize (Zea mays), over-expression of ZmCNR1 and ZmCNR2 can reduce organ and plant size by inhibiting cell division [31]. In this study, CNR1 was downregulated in LF, suggesting that CNR1 may promote persimmon fruit enlargement by negatively regulating cell division. ANT, encoding a transcription factor of the AP2-domain family, positively regulates fruit size by controlling cell division [32,33]. In this study, ANT was upregulated in LF, suggesting that ANT may promote persimmon fruit enlargement by positively regulating cell division. In addition, AtLAC17 and AtEB1C were involved in regulating cell division during the growth and development of Arabidopsis [34,35]. In this study, LAC17 and EB1C may be involved in regulating persimmon fruit size formation.
Ethylene often plays an inhibitory role in plant development [36]. In Arabidopsis, EER5 can enhance ethylene reaction during signal transduction. The eer5 ethylene hypersensitive mutant exhibits shorter siliques, curly leaves, shorter primary roots and less lateral roots [37]. In cucumber, high concentrations of ethylene can inhibit fruit elongation and cell division [12]. In apples, the application of ethylene inhibitors increased fruit size [38]. In this study, ethrel and AVG treatments resulted in a decrease and increase in fruit weight, respectively, indicating that high ethylene levels can inhibit persimmon fruit growth. As the ethylene response factors, ERS1 and ERF114 may play an important role in this process. After ethrel treatment, LAC17 and ERF114 were upregulated, indicating that ethylene can influence the persimmon fruit size by regulating cell division. The similar trend of expression of LAC17 and ERF114 after ethrel treatment also indicated that there might be a potential interaction between the ethylene response factor and cell division genes.

4. Materials and Methods

4.1. Plant Material

Fruit samples of ‘Yaoxianwuhua’ persimmon (Diospyros kaki) were harvested in Yuanyang County, Henan Province, China (34°55′18″~34°56′27″ N, 113°46′14″~113°47′35″ E). The sampling time was 15 May 2022–15 September 2022 (0–124 days past anthesis). Samples were randomly collected every 14 days. The sample for the paraffin section is fixed in the FAA (formalin/lacial acetic acid/50% alcohol = 8:5:87). Samples for RNA extraction were immediately frozen in liquid nitrogen and stored at −80 °C.

4.2. Paraffin Section

The fruit samples fixed in FAA for 24h were dehydrated with a range of different concentrations of alcohol and then embedded in paraffin. After slicing and dyeing, the microslides were dried and and mounted with a cover slip. Finally, the finished microslides were observed under a light microscope (Olympus, Tokyo, Japan).
The cell size in the given images was calculated using the software ImageJ (v.1.8.0). Cell size is represented by cell area. The cell number in the transverse section = fruit transverse section area/fruit cell area in the transverse section. The cell number on the longitudinal section = fruit longitudinal section area/fruit cell area in the longitudinal section. The fruit transverse and longitudinal section areas were calculated using the software ImageJ (v.1.8.0).

4.3. Transcriptome

TRIzol Total RNA Isolation Kit (Sangon, Shanghai, China) was used to extract total RNA for sequencing libraries. Bioanalyzer 2100 was used to detect RNA integrity. The sequencing platform is NovaSeq 6000 (Illumina, San Diego, CA, USA). HISAT2 software (v.2.2.1) was used to match the filtered reads to the persimmon genome [19,39]. StringTie (v.2.1.1) and FeatureCounts (v.2.0.1) software were used to predict new transcripts and calculate the number of reads mapped to each gene, respectively [40,41]. Gene expression was represented by FPKM. DEseq2 (v1.18.0) was used to detect the differential mRNA expression (DEGs) (fold change ≥ 2; FDR < 0.01).
All expressed genes were used to perform weighted gene co-expression network analysis using the R package WGCNA (An R package for weighted correlation network analysis). The co-expression networks were visualized using Cytoscape (v3.8.0).

4.4. Ethrel and Aminoethoxyinylglycine Treatment

At dusk on 5 June 2023 (21 days past anthesis), 100 mg/L of ethrel and 100 mg/L aminoethoxyinylglycine were sprayed on the fruits of ‘YaoxianWuhua’ persimmon. The control was treated with water. Treatment was applied to three replicate trees. After one (28 days past anthesis) and three weeks (42 days past anthesis) of ethrel and aminoethoxyinylglycine treatment, fruit samples were taken and weighed.

4.5. qRT-qPCR

After 12 h of ethrel and water (control) treatment, fruit samples were taken for qRT-qPCR. The reaction condition: 30 s at 95 °C, 40 cycles of 3 s at 95 °C, 30 s at 60 °C. The reference gene is GAPDH [42]. The 2−ΔΔCt method was used to calculate relative expression. The primer sequences are listed in Table S5.

5. Conclusion

In conclusion, stages 3–4 (June 11–June 25) are the crucial morphological periods for the differentiation of large fruit and small fruit in persimmon. In this crucial morphological period, the difference in cell number is the main reason for the differentiation of persimmon fruit size, and the accumulation of cell number is conducive to the subsequent increase in persimmon fruit size. The difference in cell number was caused by cell division. CNR1, ANT, LAC17 and EB1C, associated with cell division, may be involved in regulating persimmon fruit size. High ethylene levels can reduce persimmon fruit size, possibly by inhibiting cell division. As the ethylene response factors, ERS1 and ERF114 may play an important role in this process. This study lays an empirical foundation for ongoing investigations of persimmon fruit size formation.

Supplementary Materials

The following supporting information can be downloaded at: https://www.mdpi.com/article/10.3390/ijms25137238/s1.

Author Contributions

Conceptualization, S.L., D.Y., W.H. and J.F.; methodology, Y.S.; software, P.S.; validation, H.L. (Hui Li); writing—original draft preparation, H.L. (Huawei Li); writing—review and editing, W.H. and J.F. All authors have read and agreed to the published version of the manuscript.

Funding

This research was funded by the National Key R&D Program of China (2018YFD1000606).

Institutional Review Board Statement

Not applicable.

Informed Consent Statement

Not applicable.

Data Availability Statement

The transcriptome sequencing raw data were deposited in the National Center for Biotechnology Information Sequence Read Archive (NCBI SRA) under the Bioproject ID PRJNA1094889 and PRJNA1116589.

Conflicts of Interest

The authors declare no conflicts of interest.

References

  1. Luo, Z.; Wang, R. Persimmon in China: Domestication and traditional utilization of genetic resources. Adv. Hortic. Sci. 2008, 22, 239–243. [Google Scholar]
  2. Seymour, G.B.; Østergaard, L.; Chapman, N.H.; Knapp, S.; Martin, C. Fruit development and ripening. Annu. Rev. Plant Biol. 2013, 64, 219–241. [Google Scholar] [CrossRef] [PubMed]
  3. Tanksley, S.D. The genetic, developmental, and molecular bases of fruit size and shape variation in tomato. Plant Cell 2004, 16 (Suppl. S1), S181–S189. [Google Scholar] [CrossRef] [PubMed]
  4. Pattison, R.J.; Catalá, C. Evaluating auxin distribution in tomato (Solanum lycopersicum) through an analysis of the PIN and AUX/LAX gene families. Plant J. 2012, 70, 585–598. [Google Scholar] [CrossRef] [PubMed]
  5. Liao, X.; Li, M.; Liu, B.; Yan, M.; Yu, X.; Zi, H.; Liu, R.; Yamamuro, C. Interlinked regulatory loops of ABA catabolism and biosynthesis coordinate fruit growth and ripening in woodland strawberry. Proc. Natl. Acad. Sci. USA 2018, 115, E11542–E11550. [Google Scholar] [CrossRef] [PubMed]
  6. Mounet, F.; Moing, A.; Kowalczyk, M.; Rohrmann, J.; Petit, J.; Garcia, V.; Maucourt, M.; Yano, K.; Deborde, C.; Aoki, K. Down-regulation of a single auxin efflux transport protein in tomato induces precocious fruit development. J. Exp. Bot. 2012, 63, 4901–4917. [Google Scholar] [CrossRef] [PubMed]
  7. Wu, J.; Zhong, J.; Xu, K.; Wei, Q.; Wei, Z. Effects of exogenous GA3 on fruit development and endogenous hormones in Fujiminori grape. J. Fruit Sci. 2001, 4, 209–212. [Google Scholar]
  8. Pang, Y.; Zang, X.; Pang, F.; Zhou, T.; Tian, F. Changes of CTK and few nitrogen index during development of flower and fruit in Zhanhua jujube. J. North China Agric. 2017, 5, 101–104. [Google Scholar]
  9. Zhao, Z.; Gu, Y.; Li, B.; Guo, S.; Qi, G.; Hu, Y. Study on the development of bagging changfu 2 fruit and the changes of endogenous hormones content after bag removal. J. Hebei Agric. Univ. 2006, 5, 12–15. [Google Scholar]
  10. Nardozza, S.; Cooney, J.; Boldingh, H.L.; Hewitt, K.G.; Trower, T.; Jones, D.; Thrimawithana, A.H.; Allan, A.C.; Richardson, A.C. Phytohormone and transcriptomic analysis reveals endogenous cytokinins affect kiwifruit growth under restricted carbon supply. Metabolites 2020, 10, 23. [Google Scholar] [CrossRef]
  11. Nitsch, L.; Kohlen, W.; Oplaat, C.; Charnikhova, T.; Cristescu, S.; Michieli, P.; Wolters-Arts, M.; Bouwmeester, H.; Mariani, C.; Vriezen, W. ABA-deficiency results in reduced plant and fruit size in tomato. J. Plant Physiol. 2012, 169, 878–883. [Google Scholar] [CrossRef] [PubMed]
  12. Xin, T.; Zhang, Z.; Li, S.; Zhang, S.; Li, Q.; Zhang, Z.-H.; Huang, S.; Yang, X. Genetic regulation of ethylene dosage for cucumber fruit elongation. Plant Cell 2019, 31, 1063–1076. [Google Scholar] [CrossRef] [PubMed]
  13. Wang, L.; Luo, Z.; Wang, L.; Deng, W.; Wei, H.; Liu, P.; Liu, M. Morphological, cytological and nutritional changes of autotetraploid compared to its diploid counterpart in Chinese jujube (Ziziphus jujuba Mill.). Sci. Hortic. 2019, 249, 263–270. [Google Scholar] [CrossRef]
  14. Upadhyay, R.K.; Gupta, A.; Ranjan, S.; Singh, R.; Pathre, U.V.; Nath, P.; Sane, A.P. The EAR motif controls the early flowering and senescence phenotype mediated by over-expression of SlERF36 and is partly responsible for changes in stomatal density and photosynthesis. PLoS ONE 2014, 9, e101995. [Google Scholar] [CrossRef] [PubMed]
  15. Yuste-Lisbona, F.J.; Fernández-Lozano, A.; Pineda, B.; Bretones, S.; Ortíz-Atienza, A.; García-Sogo, B.; Müller, N.A.; Angosto, T.; Capel, J.; Moreno, V. ENO regulates tomato fruit size through the floral meristem development network. Proc. Natl. Acad. Sci. USA 2020, 117, 8187–8195. [Google Scholar] [CrossRef] [PubMed]
  16. Mantegazza, O.; Gregis, V.; Mendes, M.A.; Morandini, P.; Alves-Ferreira, M.; Patreze, C.M.; Nardeli, S.M.; Kater, M.M.; Colombo, L. Analysis of the Arabidopsis REM gene family predicts functions during flower development. Ann. Bot. 2014, 114, 1507–1515. [Google Scholar] [CrossRef] [PubMed]
  17. Pinyopich, A.; Ditta, G.S.; Savidge, B.; Liljegren, S.J.; Baumann, E.; Wisman, E.; Yanofsky, M.F. Assessing the redundancy of MADS-box genes during carpel and ovule development. Nature 2003, 424, 85–88. [Google Scholar] [CrossRef] [PubMed]
  18. Li, H.; Suo, Y.; Li, H.; Sun, P.; Han, W.; Fu, J. Cytological, Phytohormone, and transcriptome analyses provide insights into persimmon fruit shape formation (Diospyros kaki Thunb.). Int. J. Mol. Sci. 2024, 25, 4812. [Google Scholar] [CrossRef] [PubMed]
  19. Li, H.; Sun, P.; Wang, Y.; Zhang, Z.; Yang, J.; Suo, Y.; Han, W.; Diao, S.; Li, F.; Fu, J. Allele-aware chromosome-level genome assembly of the autohexaploid Diospyros kaki Thunb. Sci. Data 2023, 10, 270. [Google Scholar] [CrossRef]
  20. Yamane, H.; Ichiki, M.; Tao, R.; Esumi, T.; Yonemori, K.; Niikawa, T.; Motosugi, H. Growth characteristics of a small-fruit dwarf mutant arising from bud sport mutation in Japanese persimmon (Diospyros kaki Thunb.). HortScience 2008, 43, 1726–1730. [Google Scholar] [CrossRef]
  21. Zhao, J.; Jiang, L.; Che, G.; Pan, Y.; Li, Y.; Hou, Y.; Zhao, W.; Zhong, Y.; Ding, L.; Yan, S. A functional allele of CsFUL1 regulates fruit length through repressing CsSUP and inhibiting auxin transport in cucumber. Plant Cell 2019, 31, 1289–1307. [Google Scholar] [CrossRef] [PubMed]
  22. Wang, L.; Cao, C.; Zheng, S.; Zhang, H.; Liu, P.; Ge, Q.; Li, J.; Ren, Z. Transcriptomic analysis of short-fruit 1 (sf1) reveals new insights into the variation of fruit-related traits in Cucumis sativus. Sci. Rep. 2017, 7, 2950. [Google Scholar] [CrossRef] [PubMed]
  23. Harada, T.; Kurahashi, W.; Yanai, M.; Wakasa, Y.; Satoh, T. Involvement of cell proliferation and cell enlargement in increasing the fruit size of Malus species. Sci. Hortic. 2005, 105, 447–456. [Google Scholar] [CrossRef]
  24. Li, Y.-H.; Zhang, Z.; Sun, G.-M. Changes in cell number and cell size during pineapple (Ananas comosus L.) fruit development and their relationship with fruit size. Aust. J. Bot. 2010, 58, 673–678. [Google Scholar] [CrossRef]
  25. Higashi, K.; Hosoya, K.; Ezura, H. Histological analysis of fruit development between two melon (Cucumis melo L. reticulatus) genotypes setting a different size of fruit. J. Exp. Bot. 1999, 50, 1593–1597. [Google Scholar]
  26. Olmstead, J.W.; Iezzoni, A.F.; Whiting, M.D. Genotypic differences in sweet cherry fruit size are primarily a function of cell number. J. Am. Soc. Hortic. Sci. 2007, 132, 697–703. [Google Scholar] [CrossRef]
  27. Scorzal, R.; May, L.G.; Purnell, B.; Upchurch, B. Differences in number and area of mesocarp cells between small-and large-fruited peach cultivars. J. Am. Soc. Hortic. Sci. 1991, 116, 861–864. [Google Scholar] [CrossRef]
  28. Zhang, C.; Tanabe, K.; Tani, H.; Nakajima, H.; Mori, M.; Sakuno, E. Biologically active gibberellins and abscisic acid in fruit of two late-maturing Japanese pear cultivars with contrasting fruit size. J. Am. Soc. Hortic. Sci. 2007, 132, 452–458. [Google Scholar] [CrossRef]
  29. Frary, A.; Nesbitt, T.C.; Frary, A.; Grandillo, S.; Knaap, E.V.D.; Cong, B.; Liu, J.; Meller, J.; Elber, R.; Alpert, K.B. fw2. 2: A quantitative trait locus key to the evolution of tomato fruit size. Science 2000, 289, 85–88. [Google Scholar] [CrossRef]
  30. Cong, B.; Liu, J.; Tanksley, S.D. Natural alleles at a tomato fruit size quantitative trait locus differ by heterochronic regulatory mutations. Proc. Natl. Acad. Sci. USA 2002, 99, 13606–13611. [Google Scholar] [CrossRef]
  31. Guo, M.; Rupe, M.A.; Dieter, J.A.; Zou, J.; Spielbauer, D.; Duncan, K.E.; Howard, R.J.; Hou, Z.; Simmons, C.R. Cell Number Regulator1 affects plant and organ size in maize: Implications for crop yield enhancement and heterosis. Plant Cell 2010, 22, 1057–1073. [Google Scholar] [CrossRef] [PubMed]
  32. Klucher, K.M.; Chow, H.; Reiser, L.; Fischer, R.L. The AINTEGUMENTA gene of Arabidopsis required for ovule and female gametophyte development is related to the floral homeotic gene APETALA2. Plant Cell 1996, 8, 137–153. [Google Scholar]
  33. Mizukami, Y.; Fischer, R.L. Plant organ size control: AINTEGUMENTA regulates growth and cell numbers during organogenesis. Proc. Natl. Acad. Sci. USA 2000, 97, 942–947. [Google Scholar] [CrossRef] [PubMed]
  34. Kohoutová, L.; Kourová, H.; Nagy, S.K.; Volc, J.; Halada, P.; Mészáros, T.; Meskiene, I.; Bögre, L.; Binarová, P. The Arabidopsis mitogen—Activated protein kinase 6 is associated with γ-tubulin on microtubules, phosphorylates EB 1c and maintains spindle orientation under nitrosative stress. New Phytol. 2015, 207, 1061–1074. [Google Scholar] [CrossRef] [PubMed]
  35. Wei, X.; Ding, H.; Fan, Y.; Wu, X.; Liu, X.; Niu, J.; Cao, F.; Li, M. Overexpression of a laccase gene, DiLAC17, from Davidia involucrata causes severe seed abortion in Arabidopsis. Plant Physiol. Biochem. 2023, 202, 107956. [Google Scholar] [CrossRef] [PubMed]
  36. Vandenbussche, F.; Vaseva, I.; Vissenberg, K.; Van Der Straeten, D. Ethylene in vegetative development: A tale with a riddle. New Phytol. 2012, 194, 895–909. [Google Scholar] [CrossRef] [PubMed]
  37. Christians, M.J.; Robles, L.M.; Zeller, S.M.; Larsen, P.B. The eer5 mutation, which affects a novel proteasome—Related subunit, indicates a prominent role for the COP9 signalosome in resetting the ethylene—Signaling pathway in Arabidopsis. Plant J. 2008, 55, 467–477. [Google Scholar] [CrossRef] [PubMed]
  38. Byers, R.E.; Carbaugh, D.H.; Combs, L.D. Ethylene inhibitors delay fruit drop, maturity, and increase fruit size of ‘Arlet’ apples. HortScience 2005, 40, 2061–2065. [Google Scholar] [CrossRef]
  39. Zhang, Y.; Park, C.; Bennett, C.; Thornton, M.; Kim, D. Rapid and accurate alignment of nucleotide conversion sequencing reads with HISAT-3N. Genome Res. 2021, 31, 1290–1295. [Google Scholar] [CrossRef]
  40. Shumate, A.; Wong, B.; Pertea, G.; Pertea, M. Improved transcriptome assembly using a hybrid of long and short reads with StringTie. PLoS Comput. Biol. 2022, 18, e1009730. [Google Scholar] [CrossRef]
  41. Liao, Y.; Smyth, G.K.; Shi, W. featureCounts: An efficient general purpose program for assigning sequence reads to genomic features. Bioinformatics 2014, 30, 923–930. [Google Scholar] [CrossRef] [PubMed]
  42. Du, G.; Wang, L.; Li, H.; Sun, P.; Fu, J.; Suo, Y.; Han, W.; Diao, S.; Mai, Y.; Li, F. Selection and validation of reference genes for quantitative gene expression analyses in persimmon (Diospyros kaki Thunb.) using real-time quantitative PCR. Biol. Futur. 2019, 70, 261–267. [Google Scholar] [CrossRef] [PubMed]
Figure 1. Morphological change in the ‘Yaoxianwuhua’ fruit. The figure in the white frame is from the following research ‘Cytological, phytohormone, and transcriptome analyses provide insights into persimmon fruit shape formation (Diospyros kaki Thunb.)’ [18].
Ijms 25 07238 g001
Figure 2. The difference of FW between LF and SF during fruit development. ** p < 0.01. In all figures, the note for ‘small fruit at stage 3’ was represented by ‘small flat fruit’.
Ijms 25 07238 g002
Figure 3. Cytological observations of fruit. Transverse section: (a) LF in stage 3; (b) SFF in stage 3; (c) LF in stage 4; (d) SFF in stage 4; (e) SLF in stage 4. Longitudinal section: (f) LF in stage 3; (g) SFF in stage 3; (h) LF in stage 4; (i) SFF in stage 4; (j) SLF in stage 4.
Ijms 25 07238 g003
Figure 4. Statistics on fruit cell size and number: (a) cell size on the transverse section of fruit; (b) cell size on the longitudinal section of fruit; (c) cell number on the transverse section of fruit; (d) cell number on the longitudinal section of fruit. *: p < 0.05; **: p < 0.01.
Ijms 25 07238 g004
Figure 5. The number, Venn diagram and heat map of DEGs: (a) number classification of DEGs in LF3 vs. SFF3, LF4 vs. SFF4 and LF4 vs. SLF4; (b) Venn diagram of all DEGs; (c) heat map of DEGs shared by LF3 vs. SFF3, LF4 vs. SFF4 and LF4 vs. SLF4. The original expression values of the DEGs FPKM were normalized by Z-score.
Ijms 25 07238 g005
Figure 6. KEGG pathway enrichment analyses of DEGs. (a) LF3 vs. SFF3, (b) LF4 vs. SFF4 and (c) LF4 vs. SLF4.
Ijms 25 07238 g006
Figure 7. Venn diagram and heat map of DEGs: (a) Venn diagram of downregulated DEGs; (b) Venn diagram of upregulated DEGs; (c) heat map of co-upregulated and co-downregulated DEGs in SFF3, SFF4 and SLF4; (d) heat map of DEGs related to plant hormone and cell division. The original expression values of the DEGs FPKM were normalized by Z-score.
Ijms 25 07238 g007
Figure 8. Weighted gene co-expression network: (a) module detection using the WGCNA; (b) co-expression network of genes in the bisque4 module.
Ijms 25 07238 g008
Figure 9. Changes in FW after application of ethrel and AVG: (a) changes in FW after application of ethrel in stage 3; (b) changes in FW after application of ethrel in stage 4; (c) changes in FW after application of AVG in stage 3; (d) changes in FW after application of AVG in stage 4. *: p < 0.05; **: p < 0.01.
Ijms 25 07238 g009
Figure 10. The relative expression of LAC17 and ERF114 after ethrel treatment.
Ijms 25 07238 g010
Disclaimer/Publisher’s Note: The statements, opinions and data contained in all publications are solely those of the individual author(s) and contributor(s) and not of MDPI and/or the editor(s). MDPI and/or the editor(s) disclaim responsibility for any injury to people or property resulting from any ideas, methods, instructions or products referred to in the content.

