Article

Association between Visceral Adipose Tissue Metabolism and Cerebral Glucose Metabolism in Patients with Cognitive Impairment

1
Department of Nuclear Medicine, Keimyung University Dongsan Hospital, Daegu 42601, Republic of Korea
2
Department of Neurology, Keimyung University Dongsan Hospital, Daegu 42601, Republic of Korea
*
Author to whom correspondence should be addressed.
Int. J. Mol. Sci. 2024, 25(13), 7479; https://doi.org/10.3390/ijms25137479
Submission received: 5 June 2024 / Revised: 2 July 2024 / Accepted: 3 July 2024 / Published: 8 July 2024

Abstract

:
Visceral adipose tissue (VAT) dysfunction has been recently recognized as a potential contributor to the development of Alzheimer’s disease (AD). This study aimed to explore the relationship between VAT metabolism and cerebral glucose metabolism in patients with cognitive impairment. This cross-sectional prospective study included 54 patients who underwent 18F-fluorodeoxyglucose (18F-FDG) brain and torso positron emission tomography/computed tomography (PET/CT), and neuropsychological evaluations. VAT metabolism was measured by 18F-FDG torso PET/CT, and cerebral glucose metabolism was measured using 18F-FDG brain PET/CT. A voxel-based analysis revealed that the high-VAT-metabolism group exhibited a significantly lower cerebral glucose metabolism in AD-signature regions such as the parietal and temporal cortices. In the volume-of-interest analysis, multiple linear regression analyses with adjustment for age, sex, and white matter hyperintensity volume revealed that VAT metabolism was negatively associated with cerebral glucose metabolism in AD-signature regions. In addition, higher VAT metabolism was correlated with poorer outcomes on cognitive assessments, including the Korean Boston Naming Test, Rey Complex Figure Test immediate recall, and the Controlled Oral Word Association Test. In conclusion, our study revealed significant relationships among VAT metabolism, cerebral glucose metabolism, and cognitive function. This suggests that VAT dysfunction actively contributes to the neurodegenerative processes characteristic of AD, making VAT dysfunction targeting a novel AD therapy approach.

1. Introduction

Alzheimer’s disease (AD), the most prevalent neurodegenerative disease, is characterized by progressive cognitive decline and the accumulation of amyloid-β (Aβ) plaques and tau tangles in the brain [1]. Although the exact cause of AD has not been confirmed, its etiology is multifactorial and involves a complex interplay of genetic, environmental, and lifestyle factors [2,3]. Recent studies have highlighted the role of metabolic disorders as significant risk factors for AD, indicating a complex relationship between systemic metabolic dysfunction and neurodegenerative processes [4]. This underscores the critical need to explore metabolic pathways related to neurodegeneration, given the established connections between chronic conditions such as diabetes, cardiovascular diseases, and AD [5,6].
Visceral adipose tissue (VAT), traditionally considered an energy store, is now acknowledged for its active endocrine role, which affects systemic health. Recent studies suggest that VAT dysfunction significantly contributes to the development of AD by exacerbating systemic inflammation and metabolic dysregulation, both of which are closely linked to neurodegenerative diseases [7,8]. The secretion of pro-inflammatory cytokines and adipokines from dysfunctional VAT has been implicated in the promotion of neuroinflammation, which may drive the neuropathological processes characteristic of AD [9]. Additionally, recent investigations suggest a correlation between VAT dysfunction and an increased cerebral Aβ burden, suggesting that VAT dysfunction might directly influence the pathogenesis of AD by exacerbating cerebral amyloidogenesis and tau pathology [10,11]. These findings suggest that VAT dysfunction is associated not only with metabolic syndrome but also with AD [12,13]. Despite these connections, a definitive link between VAT dysfunction and neurodegenerative processes in AD is yet to be firmly established. Given that neurodegeneration is often associated with an increase in Aβ burden, a clear correlation between VAT dysfunction and neurodegeneration could provide compelling evidence that VAT dysfunction contributes to the development and progression of AD.
2-Deoxy-2[fluorine-18]-fluoroglucose (18F-FDG) positron emission tomography/computed tomography (PET/CT) has proven to be an invaluable tool for simultaneously assessing VAT metabolism, indicative of VAT function, and quantifying cerebral glucose metabolism, indicative of cerebral function [14,15]. 18F-FDG PET/CT has been shown to be useful in evaluating VAT function with various systemic conditions, including metabolic syndrome, cardiovascular disease, and cancer, highlighting the clinical utility of this imaging modality in assessing VAT dysfunction [16,17,18]. By leveraging 18F-FDG PET/CT, this study aimed to explore the relationship between VAT metabolism and cerebral glucose metabolism in patients with cognitive impairment, potentially confirming the role of VAT dysfunction in AD progression and enhancing our understanding of the underlying mechanisms driving this devastating disease.

2. Results

2.1. Population Characteristics

Among the 101 eligible patients who attended our memory clinic for cognitive function assessment, those with a Mini-Mental State Examination (MMSE) score below 10, those who withdrew consent, those diagnosed with cognitive impairment resulting from conditions distinct from AD, and those currently suspected of acute infection or inflammatory states were systematically excluded from the study (Figure 1). This study included a total of 54 subjects (age: 66.4 ± 8.4 years; female, 34 (63.0%)). Among the total cohort, 28 subjects (51.9%) exhibited pathologic changes related to Alzheimer’s. Clinically, 18 were diagnosed as cognitively unimpaired (CU), 14 as having mild cognitive impairment (MCI), and 22 as having dementia. Specifically, among the 18 CU patients, 5 (27.8%) had Alzheimer pathology, as did 7 (50.0%) of the 14 MCI patients and 14 (63.6%) of the 22 dementia patients. The results of the neuropsychological assessment in the total cohort, including cognitively unimpaired, mild cognitive impairment, and dementia subjects, are summarized in Supplementary Table S1. The subjects were categorized into two groups based on VAT metabolism, using a cutoff value of 0.71, which represented the mean maximum standardized uptake value (SUVmax) in the total cohort: 27 in the low- and 27 in the high-VAT-metabolism group. The SUVmax of the VAT in the high-VAT-metabolism group was significantly higher than that in the low-VAT-metabolism group (0.8 ± 0.1 vs. 0.6 ± 0.1, p < 0.001). No significant differences were observed between the low- and high-VAT-metabolism groups in terms of sex; body mass index (BMI, kg/m2); years of education; prevalence of diabetes, hypertension, cardiovascular disease, and hyperlipidemia; or white matter hyperintensity (WMH) volume (Table 1). Cognitive function, evaluated using the Seoul Neuropsychological Screening Battery II (SNSB II), was significantly associated with age, education level, and WMH volume but not with sex, BMI, diabetes, hypertension, cardiovascular disease, or hyperlipidemia. All of the neuropsychological assessment scores except RCFT copy and COWAT were significantly associated with AD-signature region SUVR (Supplementary Table S2).

2.2. Association of VAT Metabolism with Cerebral Glucose Metabolism

Cerebral glucose metabolism was compared between the high- and low-VAT-metabolism groups based on voxel-wise analysis using statistical parametric mapping (SPM). This analysis revealed significantly decreased cerebral glucose metabolism in the high-VAT-metabolism group compared to the low-VAT-metabolism group across the bilateral parietal and temporal cortices (Figure 2). Table 2 shows the specific brain regions in which the high-VAT-metabolism group exhibited decreased cerebral glucose metabolism relative to the low-VAT-metabolism group.
In addition to voxel-wise analysis, the association between VAT metabolism and the AD-signature region SUVR, defined as cerebral glucose metabolism in regions affected by AD, was evaluated using volume of interest (VOI) analysis. In this VOI analysis, the AD signature SUVR was significantly lower in the high-VAT-metabolism group than in the low-VAT-metabolism group (0.96 ± 0.05 vs. 0.93 ± 0.05, p = 0.016) (Supplementary Table S3). Furthermore, Pearson’s correlation analyses showed that VAT SUVmax was negatively correlated with the AD-signature region SUVR (r = −0.340, p = 0.012). Multiple linear regression analysis, adjusted for age, sex, and WMH volume, revealed that VAT SUVmax was significantly associated with the AD-signature region SUVR (β = −0.252, p = 0.047). Detailed information regarding the association between VAT metabolism and the SUVR of the AD-signature region is presented in Supplementary Table S4.

2.3. Association between VAT Metabolism and Cognitive Function

The relationship between cognitive function and VAT SUVmax across the cohort was analyzed using both univariate and multivariate models (Table 3). In the univariable analysis, VAT SUVmax showed significant negative correlations with various cognitive assessments (Korean version of the Boston Naming Test (K-BNT) (r = −0.297, p = 0.034), Rey Complex Figure Test (RCFT) immediate recall (r = −0.302, p = 0.047), and Controlled Oral Word Association Test (COWAT) for supermarket items (r = −0.396, p = 0.010)), indicating an initial association between higher VAT metabolism and poorer cognitive performance. Subsequent multivariate analysis, which controlled for age, sex, BMI, education, and WMH volume, further substantiated these findings. Specifically, VAT SUVmax was significantly and negatively associated with the K-BNT (β = −0.271, p = 0.012), COWAT for supermarket items (β = −0.275, p = 0.025), phonemic fluency (β = −0.253, p = 0.024), Stroop Color Reading Test (β = −0.243, p = 0.034), and the Korean Mini-Mental State Examination (K-MMSE) score (β = −0.183, p = 0.041). These results highlight the significant negative correlation between VAT SUVmax and performance in specific cognitive domains, particularly naming ability, verbal fluency, and potentially visual memory and executive function, after adjusting for key demographic and clinical variables.

3. Discussion

Increased VAT metabolism, as measured using 18F-FDG PET/CT, has been demonstrated to indicate VAT dysfunction [16,19,20]. This study investigated the relationships between VAT metabolism, cerebral glucose metabolism, and cognitive function in individuals with cognitive impairment. Our findings indicate a significant negative correlation between VAT metabolism and cerebral glucose metabolism, particularly in regions known to be affected by AD. Additionally, even after controlling for demographic and clinical variables, higher VAT metabolism was correlated with poorer performance on cognitive tests, including naming ability, verbal fluency, and aspects of memory and executive function. These findings suggest that VAT dysfunction influences neurodegeneration in AD-associated brain regions, underscoring its potential role in the progression of AD.
VAT dysfunction, characterized by the abnormal release of pro-inflammatory cytokines and adipokines, plays a pivotal role in systemic inflammation and metabolic disturbances, both of which are intricately linked to AD development [21,22]. In this study, we measured VAT metabolism using 18F-FDG PET/CT as an indicator of VAT dysfunction. This noninvasive approach to assessing VAT metabolism using 18F-FDG PET/CT offers an innovative method for investigating the association between VAT dysfunction and neurodegenerative processes [23,24]. The relevance of this approach is supported by several studies that have highlighted the significant relationship between altered VAT metabolism and various health conditions, thus establishing 18F-FDG uptake in VAT as a reliable marker of VAT dysfunction [16,25]. For instance, a prospective study using 18F-FDG PET showed that 18F-FDG uptake in neck adipose tissue was a strong predictor of cardiovascular risk in a cohort of 173 individuals [17]. Similarly, another study using 18F-FDG PET/CT reported that 18F-FDG uptake in the VAT was positively correlated with high-sensitivity C-reactive protein (hsCRP) levels and the SUVmax of immune-related organs, indicating an association between VAT metabolism and systemic inflammation [16]. Furthermore, recent research has shown that 18F-FDG uptake in VAT is positively correlated with adiponectin levels and inversely correlated with insulin resistance, further substantiating the role of VAT metabolism as a proxy for assessing VAT dysfunction [15].
To substantiate the evidence that VAT dysfunction influences the development and progression of AD, our previous research established a significant correlation between increased VAT metabolism and elevated cerebral amyloid beta burden. These findings suggest that VAT dysfunction may contribute to its pathogenesis [10]. Furthermore, this study revealed a significant decrease in cerebral glucose metabolism in the high-VAT-metabolism group compared with the low-VAT-metabolism group, particularly across the parietal and temporal cortices. These regions are critical in AD, with impairments often indicating the onset and progression of the disease. The delineation of specific brain regions exhibiting decreased glucose metabolism in the high-VAT-metabolism group, as detailed in our results, not only supports the notion of a metabolic component of non-specific neurodegeneration but also indicates a possible direct or indirect influence of VAT dysfunction on AD pathology. This connection is substantiated by a broader research landscape. Clinical studies have demonstrated that increased VAT volume and associated metabolic dysfunction are linked with hallmark AD biomarkers, such as elevated leptin levels and decreased Aβ1-42 concentrations in the CSF [13,26,27]. Similarly, serum adiponectin levels have been shown to be higher in AD patients, potentially acting as a compensatory response to AD-related signaling deficits [13]. This suggests that higher adiponectin levels in AD may counteract the inflammatory and metabolic disturbances characteristic of the disease, potentially reflecting its neuroprotective properties [28]. Animal models have further elucidated this link, showing that high-fat-diet-induced VAT dysfunction can lead to increased levels of amyloid precursor protein (APP) in both adipose tissue and the brain, indicating a direct pathophysiological pathway that may contribute to AD development [29]. Recent clinical studies have investigated the correlation between VAT and AD [30]. A prospective study conducted on asymptomatic middle-aged adults with risk factors for AD revealed a significant association between VAT accumulation and the decline in brain Aβ burden [31]. Another recent study explored whether regional fat deposits, rather than central obesity, should be used to understand the mechanism underlying the association between adiposity and the brain and found that different regional fat deposits are likely associated with an increased risk of neurodegeneration and dementia, especially AD. These regional fat depots, including VAT, SAT, and hepatic fat, have been linked to cortical thinning, WMHs, reduced cerebral volumes, and smaller hippocampal volumes, the latter being one of the first regions affected by AD [32]. Collectively, these insights underscore VAT dysfunction’s critical role in cerebral metabolic and amyloidogenic processes central to AD, advocating systemic metabolic function as a key component of a holistic approach in understanding AD pathology and intervention.
Our study elucidates the critical link between increased VAT metabolism and cognitive decline, presenting a significant association with decreased performance in cognitive domains that are vulnerable to AD, such as naming ability, verbal fluency, and executive function. By revealing negative correlations between VAT metabolism and outcomes in cognitive tests, namely the K-BNT, COWAT for supermarket and phonemic categories, Stroop Color Reading Test, and K-MMSE, our research aligns with previous findings that metabolic dysfunctions, including those indicated by VAT metrics, are intricately linked to the pathogenesis of AD. These cognitive assessments are affected in AD, underscoring the relevance of our findings in identifying metabolic dysfunction as a contributing factor to neurodegenerative processes. Another study has revealed that visceral adipose NLRP3 in obesity impairs cognition via IL-1R1 in CX3CR1+ cells, leading to neuroinflammation and cognitive deficits. Activation of IL-1R1 in CX3CR1-expressing cells due to activation of the visceral adipose inflammasome results in deficits in hippocampus-dependent memory [33]. A recent study reported that the abnormal secretion of adipose factors, including inflammatory cytokines such as TNF-α, IL-6, and IL-1β, from VAT might penetrate the blood–brain barrier, leading to brain damage and cognitive decline [34,35]. Impaired vascular function from metabolic syndrome, often associated with VAT accumulation, may mediate the association between VAT and cognitive function [32]. This implies that VAT dysfunction could affect cognitive impairment not only in AD but also in cases of vascular dementia. Understanding the role of VAT in cognitive function could help to develop targeted interventions and personalized treatments for cognitive decline and dementia-related brain changes [32].
VAT metabolism increases can significantly impact the development and progression of Alzheimer’s disease (AD). Thus, controlling VAT metabolism could potentially mitigate the inflammatory and metabolic pathways that contribute to the progression of AD. Lifestyle interventions, such as diet and exercise, are foundational strategies. A Mediterranean diet, rich in anti-inflammatory foods like fruits, vegetables, and healthy fats, has been shown to reduce VAT and improve metabolic health [36]. Regular physical activity, particularly aerobic exercise, can decrease VAT mass and enhance insulin sensitivity, which may indirectly benefit cognitive function [37]. Pharmacological interventions also offer promising avenues. Metformin, a widely used antidiabetic drug, has been noted for its effects on reducing VAT and improving systemic inflammation and insulin sensitivity [38]. Thiazolidinediones, another class of antidiabetic medication, target peroxisome proliferator-activated receptor-gamma (PPAR-γ) and have been shown to reduce VAT and exert anti-inflammatory effects [39]. Additionally, GLP-1 receptor agonists, used in the management of diabetes, have demonstrated potential in reducing VAT and modulating inflammatory responses [40]. Furthermore, recent research highlights the role of the gut microbiome in regulating VAT metabolism and inflammation. Probiotics and prebiotics that modulate the gut microbiota composition could be another strategy to manage VAT and its systemic effects [41].
This study, while offering significant insights into the relationship between VAT dysfunction and neurodegeneration, has several limitations. The utilization of 18F-FDG uptake in VAT as a proxy for VAT function, despite the widespread acceptance of 18F-FDG PET/CT for assessing organ function, lacks direct histopathological validation linking 18F-FDG uptake to specific degrees of VAT dysfunction. Furthermore, the cross-sectional nature of this study precludes definitive causal inferences regarding the impact of VAT metabolism on cerebral glucose metabolism and AD progression. The modest sample size further constrains the extrapolation of our findings to broader populations. Despite these limitations, our study makes a pivotal contribution to the field by offering a novel perspective on the metabolic underpinnings of neurodegeneration. The application of 18F-FDG PET/CT to explore this link represents a methodological strength, providing a noninvasive means to assess metabolic activity and its association with cognitive decline. Future longitudinal studies, ideally with larger cohorts, are essential to corroborate our findings and deepen our understanding of the role of VAT in neurodegenerative diseases, reinforcing the potential for metabolic interventions in the prevention and management of cognitive impairment and AD.

4. Materials and Methods

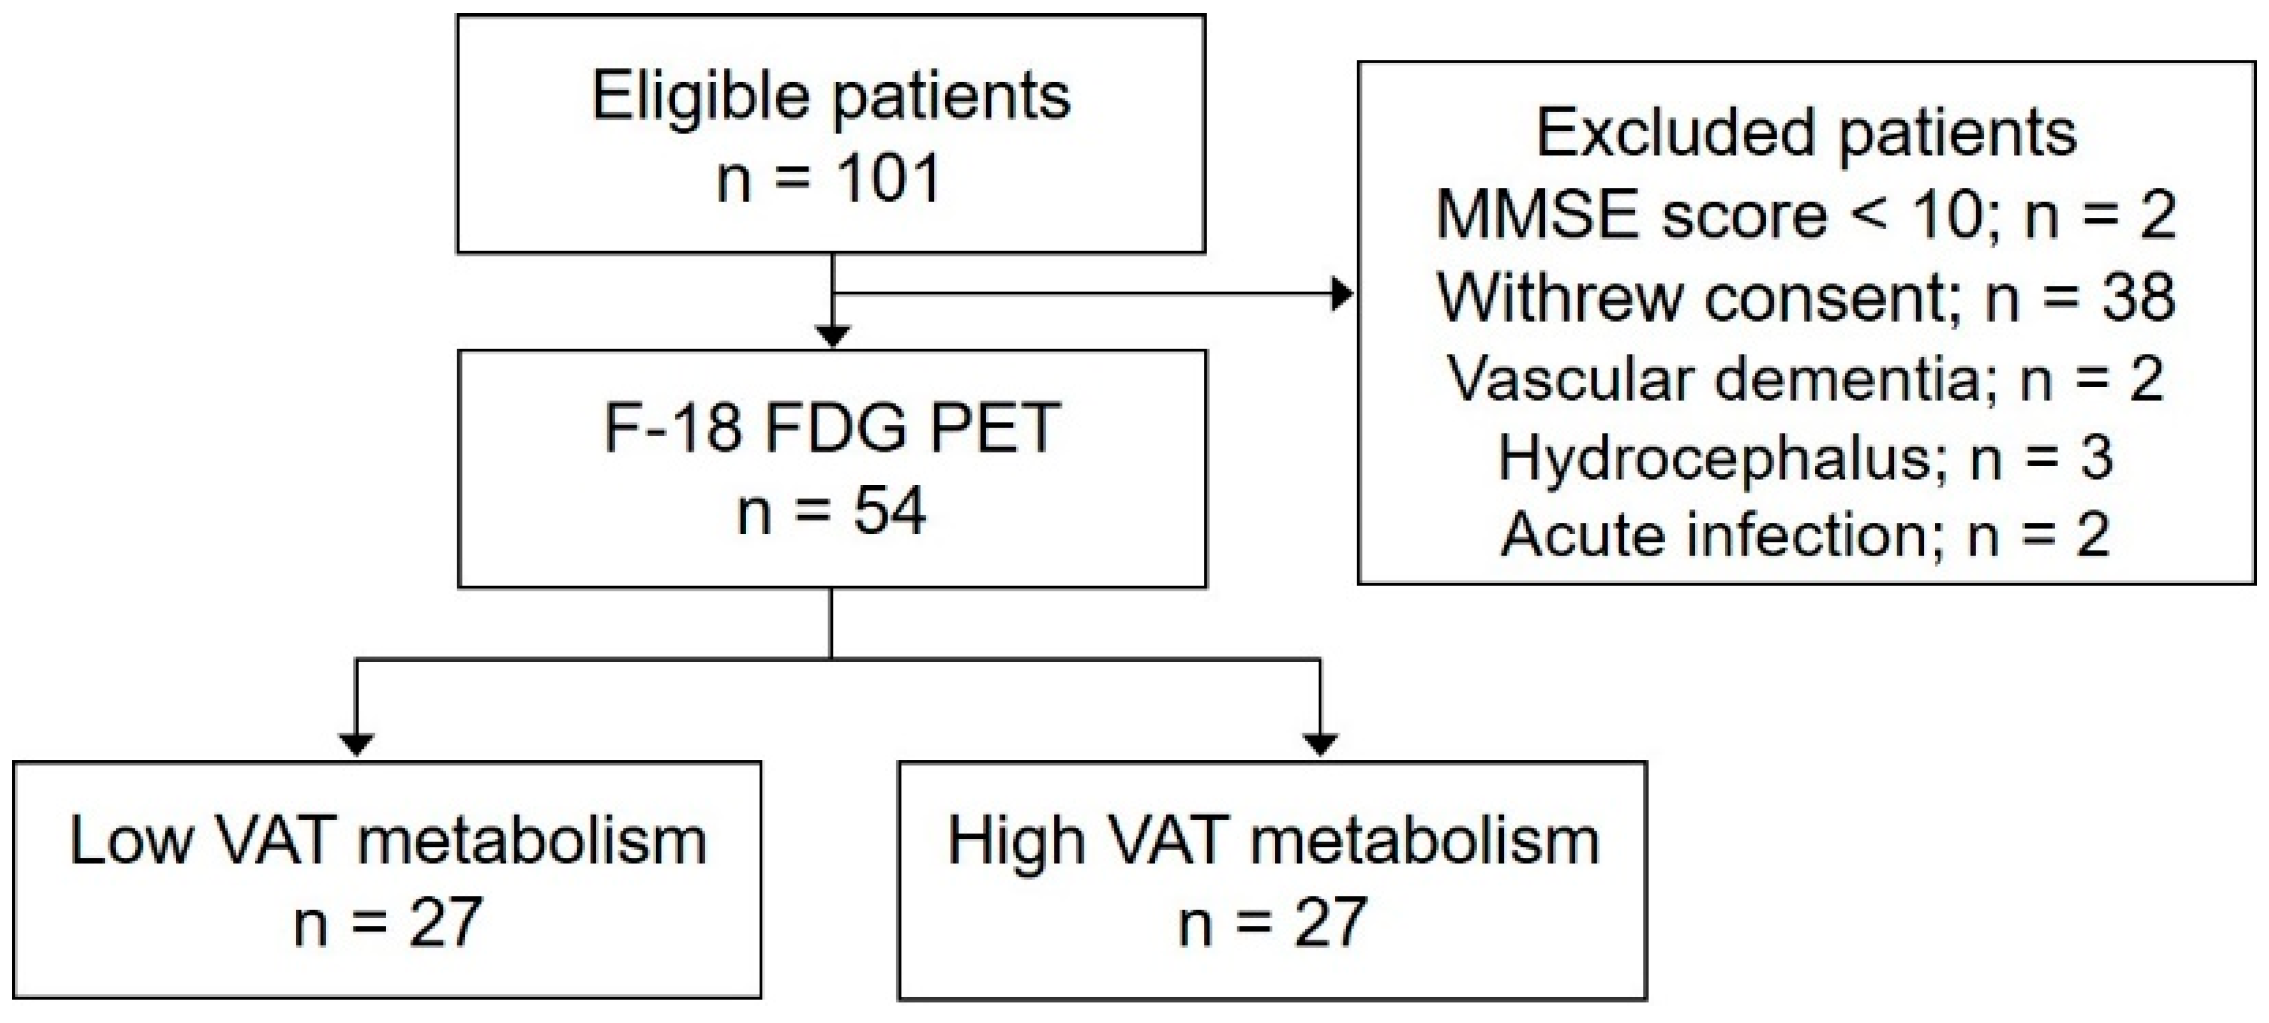
4.1. Study Design and Participants

This prospective study included a sequential cohort of individuals who attended our memory clinic for cognitive function assessment between June 2015 and January 2017. Designed as a cross-sectional analysis, the inclusion criteria were as follows: (1) individuals of either sex, between the ages of 50 and 90 years; (2) those who underwent a comprehensive imaging assessment within four weeks of their clinic visit, including volumetric 3-Tesla brain magnetic resonance imaging (MRI), 18F-florbetaben (18F-FBB) brain positron emission tomography (PET), torso 18F-fluorodeoxyglucose (18F-FDG) PET, and brain FDG PET; (3) participants who completed a neuropsychological assessment using the SNSB II; and (4) subjects with thoroughly documented clinical data, including age, gender, body mass index (BMI), educational level, and medical history of diabetes, hypertension, hyperlipidemia, and cardiovascular disease. Exclusion criteria were set to exclude individuals with a Mini-Mental State Examination (MMSE) score < 10, those who withdrew consent, those diagnosed with cognitive impairments due to conditions other than AD (e.g., vascular dementia, hydrocephalus, and acute infection), or those suspected of having current acute infectious or inflammatory states, as evidenced by CT or PET scans. Additionally, individuals taking medications that could affect VAT metabolism, such as antidiabetic and anti-inflammatory drugs, within 24 h prior to PET scans were excluded.
All patients were classified according to syndromal cognitive staging combined with biomarkers based on the 2018 National Institute on Aging-Alzheimer’s Association (NIA-AA) Research Framework: cognitively unimpaired (CU), mild cognitive impairment (MCI), and dementia with or without Alzheimer pathology [42]. For the evaluation of pathologic changes related to Alzheimer’s, composite 18F-FBB standardized uptake value ratios (SUVRFBB) were calculated from 18F-FBB brain PET scans, as previously described [43]. Patients with a composite SUVRFBB of ≥1.39, a cut-off value that reflects an abnormally high cerebral Aβ burden, were considered positive for amyloid-β (Aβ). Conversely, patients with a composite SUVRFBB of <1.39 were considered negative for Aβ [43]. This study conformed to the ethical guidelines of the Declaration of Helsinki and was approved by the Institutional Review Board of Dongsan Hospital (Approval No. 2018-02-011). Written informed consent was obtained from all participants or their legal guardians.

4.2. 18F-FDG Torso PET/CT Imaging

Torso 18F-FDG PET/CT was performed using a state-of-the-art Biograph mCT-64 system (Siemens Healthcare, Knoxville, TN, USA). To minimize variations in glucose metabolism and any potential interference with 18F-FDG uptake, 18F-FDG PET/CT imaging was conducted with standardized fasting (participants fasted for at least six hours before the scan), consistent timing (scans were scheduled in the morning), a controlled environment (maintaining a calm and stress-free setting), restricted physical activity (vigorous physical activity was restricted for 24 h prior to the scan), and maintaining blood glucose levels below 150 mg/dL. Following a tailored intravenous injection of 4.0 MBq/kg of 18F-FDG, dedicated PET images were systematically acquired in a three-dimensional acquisition mode approximately 50–60 min post-injection, allowing for optimal tracer distribution and uptake analysis. To complement PET imaging and facilitate accurate attenuation correction, non-enhanced low-dose CT scans were performed concurrently. These CT scans utilized a spiral scanning mode configured at 120 kVp and 150 mAs, employing the True X enhancement algorithm to improve image quality without significantly increasing radiation exposure.
To determine the degree of VAT metabolism, 18F-FDG uptake in the VAT was measured using a dedicated PET workstation (AdvantageWorkstation 4.3) on torso 18F-FDG PET/CT images, as previously described [17]. VAT was defined as intra-abdominal adipose tissue identified on CT images using predefined Hounsfield units (ranging from 70 to 110 HUs). 18F-FDG uptake in the VAT was quantified by drawing a region of interest (ROI) around each VAT on a CT slice, which led to the consistent generation of the same ROIs on the transaxial PET images. ROIs were drawn on each slice of the three VAT areas in the right colic, left colic, and sigmoid mesenteries. The standardized uptake value (SUV) ratio was calculated as follows: SUV = tracer activity in the ROI (MBq/mL)/injected dose (MBq)/total body weight (g). SUVmax was defined as the highest SUV within the ROI, and VAT SUVmax was defined as the average SUVmax in the three VAT areas. The VAT metabolism status was divided by the mean value of VAT SUVmax measured in the total cohort in a previous study [10]: subjects with VAT SUVmax < 0.71 were classified as the low-VAT-metabolism group, while subjects with VAT SUVmax ≥ 0.71 were classified as the high-VAT-metabolism group.

4.3. 18F-FDG Brain PET/CT Imaging

Brain 18F-FDG PET/CT imaging followed a similar protocol to torso imaging and was conducted within 40 to 50 min post-injection on the same day, before the 18F-FDG torso PET/CT scan. A specialized light foam rubber holder was employed to ensure that the participant’s head remained stable throughout the scan, thereby minimizing movement artifacts. Similar to torso imaging, non-enhanced low-dose CT scans were performed for attenuation correction and accurate localization of the cerebral 18F-FDG uptake.
For imaging analysis, we used SPM12 (Well Trust Center for Neuroimaging, London, UK) and MATLAB (R2018a, The MathWorks Inc., Natick, MA, USA) to conduct a voxel-based examination of the MRI and PET scans. The co-registration of these images was achieved using a mutual information algorithm, followed by spatial normalization for alignment with the whole brain. Subsequently, the images were smoothed using an 8 mm isotropic Gaussian filter for analysis uniformity. We performed voxel-wise t-statistics to identify the regions showing significant decreases in 18F-FDG uptake, setting the threshold for significance at p = 0.005 (uncorrected) with a minimum cluster size of 100 voxels. Areas with significant changes were then mapped onto a 3D brain model or high-resolution MRI template provided by SPM12 for accurate anatomical identification, with coordinates converted from MNI to Talairach space for precise localization.
To quantify cerebral glucose metabolism, volume of interest (VOI) analysis was conducted using the PMOD software program (PMOD Technologies Ltd., Zurich, Switzerland) as previously described [44]. The VOIs were individually defined on 18F-FDG PET images in the central region: the lateral, medial, and orbital frontal cortices; the lateral temporal cortex; the lateral and medial parietal cortices; the lateral and medial occipital cortices; and the limbic lobe. Standardized 18F-FDG uptake values were obtained from the defined regional VOIs, and the regional standardized 18F-FDG uptake value ratio (SUVR) was calculated by dividing the standardized 18F-FDG uptake value for the individual target region by that for the cerebellum [45]. The AD-signature region SUVR is defined as the weighted mean of the bilateral temporal, parietal, and insular cortices and limbic lobes, which are the regions specifically affected by AD [46].

4.4. Neuropsychological Assessment

All participants underwent a condensed version of the Seoul Neuropsychological Screening Battery II (SNSB II), focusing on critical cognitive domains. The assessment included the Digit Span Test for memory and attention, the Korean-Boston Naming Test for language (K-BNT), the Rey–Osterrieth Complex Figure Test (RCFT) for visuospatial skills and memory, he Seoul Verbal Learning Test (SVLT) for verbal memory, the Controlled Oral Word Association Test (COWAT) for verbal fluency, and the Stroop Color and Word Test for attention and cognitive flexibility. This streamlined battery aimed to provide a comprehensive overview of cognitive function, aiding in the diagnosis and understanding of cognitive impairments associated with neurodegenerative conditions.

4.5. Statistical Analyses

Statistical analyses were performed using IBM SPSS Statistics version 28. Continuous variables such as demographics, BMI, cerebral glucose metabolism, and cognitive function test scores were analyzed using means ± standard deviations and compared between the low- and high-VAT-metabolism groups using two-sample t-tests. Categorical variables, including sex and medical history, were evaluated using the chi-squared test. The relationship between VAT metabolism (assessed using SUVmax) and cerebral glucose metabolism was examined using voxel-based analysis with SPM for cerebral metabolism. Furthermore, the relationship between VAT metabolism and cerebral glucose metabolism, as evaluated by VOI analysis, and cognitive function test scores were assessed using Pearson’s correlation test. Variables showing significant correlations were further analyzed using regression models to assess the impact of VAT metabolism on cerebral glucose metabolism or cognitive function. Statistical significance was set at p < 0.05.

5. Conclusions

Our study revealed a significant relationship between increased VAT metabolism, decreased cerebral glucose metabolism, and impaired cognitive function. This supports the hypothesis that VAT dysfunction actively contributes to the neurodegenerative processes characteristic of AD, suggesting that targeting VAT dysfunction could offer a novel approach for AD therapy. Future research is crucial to deepen our understanding of VAT’s role in neurodegeneration and to explore the therapeutic potential of modulating VAT function in the management of AD.

Supplementary Materials

The following supporting information can be downloaded at: https://www.mdpi.com/article/10.3390/ijms25137479/s1.

Author Contributions

Conceptualization, H.W.K.; methodology, M.-H.Y. and J.S.L.; validation, H.-A.Y. and K.S.W.; formal analysis, M.-H.Y. and J.S.L.; data curation, H.-A.Y. and K.S.W.; writing—original draft preparation, M.-H.Y.; and writing—review and editing, H.W.K. All authors have read and agreed to the published version of the manuscript.

Funding

This research was funded by a National Research Foundation of Korea (NRF) grant from the Korean government (MSIP) (grant no. RS-2023-00243836) and a Technology development Program of the Ministry of SMEs and Startups (MSS) (RS-2023-00304371).

Institutional Review Board Statement

This study conformed to the ethical guidelines of the Declaration of Helsinki and was approved by the Institutional Review Board of Dongsan Hospital (Approval No. 2018-02-011).

Informed Consent Statement

All participants provided informed consent before participating in the study.

Data Availability Statement

Data are contained within the article.

Conflicts of Interest

The authors declare no conflicts of interest.

References

  1. Tang, Y.; Lutz, M.W.; Xing, Y. A systems-based model of Alzheimer’s disease. Alzheimer’s Dement. 2019, 15, 168–171. [Google Scholar] [CrossRef] [PubMed]
  2. Zhang, X.X.; Tian, Y.; Wang, Z.T.; Ma, Y.H.; Tan, L.; Yu, J.T. The Epidemiology of Alzheimer’s Disease Modifiable Risk Factors and Prevention. J. Prev. Alzheimer’s Dis. 2021, 8, 313–321. [Google Scholar] [CrossRef]
  3. Breijyeh, Z.; Karaman, R. Comprehensive Review on Alzheimer’s Disease: Causes and Treatment. Molecules 2020, 25, 5789. [Google Scholar] [CrossRef] [PubMed]
  4. Ezkurdia, A.; Ramírez, M.J.; Solas, M. Metabolic Syndrome as a Risk Factor for Alzheimer’s Disease: A Focus on Insulin Resistance. Int. J. Mol. Sci. 2023, 24, 4354. [Google Scholar] [CrossRef] [PubMed]
  5. Wang, M.; Lv, J.; Huang, X.; Wisniewski, T.; Zhang, W. High-fat diet-induced atherosclerosis promotes neurodegeneration in the triple transgenic (3 × Tg) mouse model of Alzheimer’s disease associated with chronic platelet activation. Alzheimer’s Res. Ther. 2021, 13, 144. [Google Scholar] [CrossRef] [PubMed]
  6. Capucho, A.M.; Chegão, A.; Martins, F.O.; Vicente Miranda, H.; Conde, S.V. Dysmetabolism and Neurodegeneration: Trick or Treat? Nutrients 2022, 14, 1425. [Google Scholar] [CrossRef] [PubMed]
  7. Nguyen, T.T.; Hulme, J.; Vo, T.K.; Van Vo, G. The Potential Crosstalk Between the Brain and Visceral Adipose Tissue in Alzheimer’s Development. Neurochem. Res. 2022, 47, 1503–1512. [Google Scholar] [CrossRef] [PubMed]
  8. Kim, J.; Choi, K.H.; Cho, S.G.; Kang, S.R.; Yoo, S.W.; Kwon, S.Y.; Min, J.J.; Bom, H.S.; Song, H.C. Association of muscle and visceral adipose tissues with the probability of Alzheimer’s disease in healthy subjects. Sci. Rep. 2019, 9, 949. [Google Scholar] [CrossRef]
  9. Kiliaan, A.J.; Arnoldussen, I.A.; Gustafson, D.R. Adipokines: A link between obesity and dementia? Lancet Neurol. 2014, 13, 913–923. [Google Scholar] [CrossRef] [PubMed]
  10. Kim, S.; Yi, H.A.; Won, K.S.; Lee, J.S.; Kim, H.W. Association between Visceral Adipose Tissue Metabolism and Alzheimer’s Disease Pathology. Metabolites 2022, 12, 258. [Google Scholar] [CrossRef]
  11. Fakih, W.; Zeitoun, R.; AlZaim, I.; Eid, A.H.; Kobeissy, F.; Abd-Elrahman, K.S.; El-Yazbi, A.F. Early metabolic impairment as a contributor to neurodegenerative disease: Mechanisms and potential pharmacological intervention. Obesity 2022, 30, 982–993. [Google Scholar] [CrossRef] [PubMed]
  12. Ishii, M.; Iadecola, C. Adipocyte-derived factors in age-related dementia and their contribution to vascular and Alzheimer pathology. Biochim. Biophys. Acta (BBA) Mol. Basis Dis. 2016, 1862, 966–974. [Google Scholar] [CrossRef] [PubMed]
  13. Letra, L.; Matafome, P.; Rodrigues, T.; Duro, D.; Lemos, R.; Baldeiras, I.; Patrício, M.; Castelo-Branco, M.; Caetano, G.; Seiça, R. Association between adipokines and biomarkers of Alzheimer’s disease: A cross-sectional study. J. Alzheimer’s Dis. 2019, 67, 725–735. [Google Scholar] [CrossRef] [PubMed]
  14. Nazeri, A.; Crandall, J.P.; Fraum, T.J.; Wahl, R.L. Repeatability of Radiomic Features of Brown Adipose Tissue. J. Nucl. Med. 2021, 62, 700–706. [Google Scholar] [CrossRef] [PubMed]
  15. Reijrink, M.; de Boer, S.A.; Antunes, I.F.; Spoor, D.S.; Heerspink, H.J.L.; Lodewijk, M.E.; Mastik, M.F.; Boellaard, R.; Greuter, M.J.W.; Benjamens, S.; et al. [18F]FDG Uptake in Adipose Tissue Is Not Related to Inflammation in Type 2 Diabetes Mellitus. Mol. Imaging Biol. 2021, 23, 117–126. [Google Scholar] [CrossRef]
  16. Pahk, K.; Kim, E.J.; Lee, Y.J.; Kim, S.; Seo, H.S. Characterization of glucose uptake metabolism in visceral fat by 18F-FDG PET/CT reflects inflammatory status in metabolic syndrome. PLoS ONE 2020, 15, e0228602. [Google Scholar] [CrossRef] [PubMed]
  17. Bucerius, J.; Mani, V.; Wong, S.; Moncrieff, C.; Izquierdo-Garcia, D.; Machac, J.; Fuster, V.; Farkouh, M.E.; Rudd, J.H.; Fayad, Z.A. Arterial and fat tissue inflammation are highly correlated: A prospective 18F-FDG PET/CT study. Eur. J. Nucl. Med. Mol. Imaging 2014, 41, 934–945. [Google Scholar] [CrossRef] [PubMed]
  18. Lee, J.H.; Kim, S.; Lee, H.S.; Park, E.J.; Baik, S.H.; Jeon, T.J.; Lee, K.Y.; Ryu, Y.H.; Kang, J. Different prognostic impact of glucose uptake in visceral adipose tissue according to sex in patients with colorectal cancer. Sci. Rep. 2021, 11, 21556. [Google Scholar] [CrossRef] [PubMed]
  19. Choi, K.-E.; Joung, C.; Pahk, K.J.; Kim, H.; Pahk, K. Metabolic activity of visceral adipose tissue is associated with age-related macular degeneration: A pilot 18F-FDG PET/CT study. Front. Endocrinol. 2024, 14, 1322326. [Google Scholar] [CrossRef] [PubMed]
  20. Pahk, K.; Kwon, Y.; Kim, M.-K.; Park, S.; Kim, S. Visceral fat metabolic activity evaluated by 18F-FDG PET/CT is associated with osteoporosis in healthy postmenopausal Korean women. Obes. Res. Clin. Pract. 2020, 14, 339–344. [Google Scholar] [CrossRef]
  21. Fontana, L.; Eagon, J.C.; Trujillo, M.E.; Scherer, P.E.; Klein, S. Visceral fat adipokine secretion is associated with systemic inflammation in obese humans. Diabetes 2007, 56, 1010–1013. [Google Scholar] [CrossRef]
  22. Chételat, G.; Arbizu, J.; Barthel, H.; Garibotto, V.; Law, I.; Morbelli, S.; van de Giessen, E.; Agosta, F.; Barkhof, F.; Brooks, D.J.; et al. Amyloid-PET and 18F-FDG-PET in the diagnostic investigation of Alzheimer’s disease and other dementias. Lancet Neurol. 2020, 19, 951–962. [Google Scholar] [CrossRef] [PubMed]
  23. Minoshima, S.; Cross, D.; Thientunyakit, T.; Foster, N.L.; Drzezga, A. 18F-FDG PET Imaging in Neurodegenerative Dementing Disorders: Insights into Subtype Classification, Emerging Disease Categories, and Mixed Dementia with Copathologies. J. Nucl. Med. 2022, 63, 2s–12s. [Google Scholar] [CrossRef]
  24. Kim, H.J.; Kim, D.; Bae, S.J.; Ahn, S.G.; Jeong, J.; Park, W.C.; Ryu, Y.H.; Jeon, T.J.; Lee, Y.; Cha, Y.J.; et al. 18F-FDG uptake of visceral adipose tissue on preoperative PET/CT as a predictive marker for breast cancer recurrence. Sci. Rep. 2022, 12, 21109. [Google Scholar] [CrossRef]
  25. Pahk, K.; Ryu, K.J.; Joung, C.; Kwon, H.W.; Lee, S.; Park, H.; Kim, T.; Song, J.Y.; Kim, S. Metabolic Activity of Visceral Adipose Tissue Is Associated with Metastatic Status of Lymph Nodes in Endometrial Cancer: A 18F-FDG PET/CT Study. Int. J. Environ. Res. Public Health 2021, 19, 92. [Google Scholar] [CrossRef] [PubMed]
  26. Lewczuk, P.; Łukaszewicz-Zając, M.; Mroczko, P.; Kornhuber, J. Clinical significance of fluid biomarkers in Alzheimer’s Disease. Pharmacol. Rep. 2020, 72, 528–542. [Google Scholar] [CrossRef]
  27. Arjunan, A.; Song, J. Pharmacological and physiological roles of adipokines and myokines in metabolic-related dementia. Biomed. Pharmacother. 2023, 163, 114847. [Google Scholar] [CrossRef] [PubMed]
  28. Dezonne, R.S.; Pereira, C.M.; de Moraes Martins, C.J.; de Abreu, V.G.; Francischetti, E.A. Adiponectin, the adiponectin paradox, and Alzheimer’s Disease: Is this association biologically plausible? Metab. Brain Dis. 2023, 38, 109–121. [Google Scholar] [CrossRef] [PubMed]
  29. Puig, K.L.; Floden, A.M.; Adhikari, R.; Golovko, M.Y.; Combs, C.K. Amyloid precursor protein and proinflammatory changes are regulated in brain and adipose tissue in a murine model of high fat diet-induced obesity. PLoS ONE 2012, 7, e30378. [Google Scholar] [CrossRef]
  30. Furiya, Y.; Ryo, M.; Kawahara, M.; Kiriyama, T.; Morikawa, M.; Ueno, S. Renin-angiotensin system blockers affect cognitive decline and serum adipocytokines in Alzheimer’s disease. Alzheimer’s Dement. 2013, 9, 512–518. [Google Scholar] [CrossRef]
  31. DeTure, M.A.; Dickson, D.W. The neuropathological diagnosis of Alzheimer’s disease. Mol. Neurodegener. 2019, 14, 32. [Google Scholar] [CrossRef]
  32. Boccara, E.; Golan, S.; Beeri, M.S. The association between regional adiposity, cognitive function, and dementia-related brain changes: A systematic review. Front. Med. 2023, 10, 1160426. [Google Scholar] [CrossRef]
  33. Guo, D.H.; Yamamoto, M.; Hernandez, C.M.; Khodadadi, H.; Baban, B.; Stranahan, A.M. Visceral adipose NLRP3 impairs cognition in obesity via IL-1R1 on CX3CR1+ cells. J. Clin. Investig. 2020, 130, 1961–1976. [Google Scholar] [CrossRef]
  34. Al-Roub, A.; Al Madhoun, A.; Akhter, N.; Thomas, R.; Miranda, L.; Jacob, T.; Al-Ozairi, E.; Al-Mulla, F.; Sindhu, S.; Ahmad, R. IL-1β and TNFα Cooperativity in Regulating IL-6 Expression in Adipocytes Depends on CREB Binding and H3K14 Acetylation. Cells 2021, 10, 3228. [Google Scholar] [CrossRef] [PubMed]
  35. Takata, F.; Nakagawa, S.; Matsumoto, J.; Dohgu, S. Blood-Brain Barrier Dysfunction Amplifies the Development of Neuroinflammation: Understanding of Cellular Events in Brain Microvascular Endothelial Cells for Prevention and Treatment of BBB Dysfunction. Front. Cell. Neurosci. 2021, 15, 661838. [Google Scholar] [CrossRef]
  36. Zelicha, H.; Kloting, N.; Kaplan, A.; Yaskolka Meir, A.; Rinott, E.; Tsaban, G.; Chassidim, Y.; Bluher, M.; Ceglarek, U.; Isermann, B. The effect of high-polyphenol Mediterranean diet on visceral adiposity: The DIRECT PLUS randomized controlled trial. BMC Med. 2022, 20, 327. [Google Scholar] [CrossRef]
  37. Pahk, K.; Kim, E.J.; Joung, C.; Seo, H.S.; Kim, S. Exercise training reduces inflammatory metabolic activity of visceral fat assessed by 18F-FDG PET/CT in obese women. Clin. Endocrinol. 2020, 93, 127–134. [Google Scholar] [CrossRef]
  38. Ziyrek, M.; Kahraman, S.; Ozdemir, E.; Dogan, A. Metformin monotherapy significantly decreases epicardial adipose tissue thickness in newly diagnosed type 2 diabetes patients. Rev. Port. Cardiol. 2019, 38, 419–423. [Google Scholar] [CrossRef] [PubMed]
  39. Zhang, F.; Pan, X.; Zhang, X.; Tong, N. The effect of thiazolidinediones on body fat redistribution in adults: A systematic review and meta-analysis of randomized controlled trials. Obes. Rev. 2024, 25, e13675. [Google Scholar] [CrossRef]
  40. Liu, F.; Yang, Q.; Zhang, H.; Zhang, Y.; Yang, G.; Ban, B.; Li, Y.; Zhang, M. The effects of glucagon-like peptide-1 receptor agonists on adipose tissues in patients with type 2 diabetes: A meta-analysis of randomized controlled trials. PLoS ONE 2022, 17, e0270899. [Google Scholar] [CrossRef]
  41. McFarlin, B.K.; Tanner, E.A.; Hill, D.W.; Vingren, J.L. Prebiotic/probiotic supplementation resulted in reduced visceral fat and mRNA expression associated with adipose tissue inflammation, systemic inflammation, and chronic disease risk. Genes Nutr. 2022, 17, 15. [Google Scholar] [CrossRef] [PubMed]
  42. Jack, C.R., Jr.; Bennett, D.A.; Blennow, K.; Carrillo, M.C.; Dunn, B.; Haeberlein, S.B.; Holtzman, D.M.; Jagust, W.; Jessen, F.; Karlawish, J.; et al. NIA-AA Research Framework: Toward a biological definition of Alzheimer’s disease. Alzheimer’s Dement. 2018, 14, 535–562. [Google Scholar] [CrossRef] [PubMed]
  43. Barthel, H.; Gertz, H.J.; Dresel, S.; Peters, O.; Bartenstein, P.; Buerger, K.; Hiemeyer, F.; Wittemer-Rump, S.M.; Seibyl, J.; Reininger, C.; et al. Cerebral amyloid-beta PET with florbetaben (18F) in patients with Alzheimer’s disease and healthy controls: A multicentre phase 2 diagnostic study. Lancet Neurol. 2011, 10, 424–435. [Google Scholar] [CrossRef] [PubMed]
  44. Jeong, J.; Jeong, Y.J.; Park, K.W.; Kang, D.-Y. Correlation of early-phase F-18 florapronal PET with F-18 FDG PET in Alzheimer’s disease and normal brain. Nucl. Med. Mol. Imaging 2019, 53, 328–333. [Google Scholar] [CrossRef]
  45. Li, Y.; Ng, Y.L.; Paranjpe, M.D.; Ge, Q.; Gu, F.; Li, P.; Yan, S.; Lu, J.; Wang, X.; Zhou, Y.; et al. Tracer-specific reference tissues selection improves detection of 18F-FDG, 18F-florbetapir, and 18F-flortaucipir PET SUVR changes in Alzheimer’s disease. Hum. Brain Mapp. 2022, 43, 2121–2133. [Google Scholar] [CrossRef]
  46. Lee, J.J.; Earnest, T.; Ha, S.M.; Bani, A.; Kothapalli, D.; Liu, P.; Sotiras, A. Patterns of Glucose Metabolism in [18F] FDG PET Indicate Regional Variability and Neurodegeneration in the Progression of Alzheimer’s Dementia. medRxiv 2023. [Google Scholar] [CrossRef]
Figure 1. Flow diagram of the study population.
Ijms 25 07479 g001
Figure 2. Voxel-based comparison of cerebral glucose metabolism between the high- and low-visceral adipose tissue (VAT)-metabolism groups. The statistical parameter mapping t-maps were su-perimposed on the volume-rendered magnetic resonance imaging (MRI) and T1-weighted template in the axial plane for the high-VAT-metabolism group < low-VAT-metabolism group (p < 0.005, uncorrected at voxel level, cluster size > 100 voxels).
Ijms 25 07479 g002
Table 1. Comparison of clinical variables between low- and high-VAT-metabolism groups.
CharacteristicsTotal
(n = 54)
Low-VAT-Metabolism Group (n = 27)High-VAT-Metabolism Group (n = 27)p
Age, years (SD)66.4 (8.4)65.4 (8.1)67.5 (8.8)0.181
Sex, female, n (%)34 (63.0)16 (59.3)18 (66.7)0.291
Body mass index (SD)23.3 (3.4)23.6 (2.8)23 (4.0)0.263
Education, years (SD)11.5 (6.1)11.4 (6.0)11.5 (6.3)0.474
Diabetes, n (%)8 (14.8)4 (14.8)4 (14.8)0.500
Hypertension, n (%)16 (29.6)10 (37.0)6 (22.2)0.121
Cardiovascular disease, n (%)6 (11.1)4 (14.8)2 (7.4)0.198
Hyperlipidemia, n (%)9 (16.7)5 (18.5)4 (14.8)0.361
WMH volume (SD)3.4 (5.1)2.4 (3.1)4.4 (6.4)0.083
VAT SUVmax0.7 (0.2)0.6 (0.1)0.8 (0.1)<0.001
SD, standard deviation; WMH, white matter hyperintensity; VAT, visceral adipose tissue; SUVmax, maximum standardized uptake value.
Table 2. Regions with significantly increased cerebral glucose metabolism in the high-VAT-metabolism group compared to the low-VAT-metabolism group in the SPM analysis (p < 0.005, uncorrected, k = 100).
RegionsBrodmann AreaSizeMINI CoordinatesT Valuep
XYZ
Right parietal lobe, postcentral gyrusBA4022860−22204.14<0.001
Right parietal lobe, superior parietal lobuleBA739324−62503.70<0.001
Right parietal lobe, superior parietal lobuleBA7 30−52523.35 0.001
Right parietal lobe, inferior parietal lobuleBA40 38−32463.30 0.001
Left parietal lobe, superior parietal lobuleBA7161−10−64523.65<0.001
Left parietal lobe, precuneusBA7 −12−74383.01 0.002
Left parietal lobe, superior parietal lobuleBA7 −26−66502.77 0.004
Left temporal lobe, superior temporal gyrusBA38182−426−103.36 0.001
Left temporal lobe, middle temporal gyrusBA21 −484−182.96 0.002
VAT, visceral adipose tissue; BA, Brodmann’s area.
Table 3. Association between neuropsychological variables and VAT metabolism in the overall cohort.
Cognitive DomainNeuropsychological VariablesUnivariable ModelMultivariable Model
rpAdjusted R2Standardized β *p
AttentionDigit span forward−0.1400.3130.430−0.1450.178
Working MemoryDigit span backward−0.1820.1910.416−0.1800.090
Language AbilityK-BNT−0.2970.0340.684−0.2710.012
Visuospatial AbilityRCFT copy−0.0980.5130.498−0.1700.138
MemorySVLT immediate recall−0.1220.3830.570−0.1350.182
MemorySVLT delayed recall−0.1950.1610.457−0.2060.068
MemorySVLT recognition−0.2120.1310.323−0.2250.071
MemoryRCFT immediate recall−0.3020.0470.287−0.2390.097
MemoryRCFT delayed recall −0.2340.1270.397−0.1560.266
Verbal FluencyCOWAT animal−0.1370.3310.442−0.1610.163
Verbal FluencyCOWAT supermarket−0.3960.0100.488−0.2750.025
Verbal FluencyCOWAT phonemic−0.3000.0600.574−0.2530.024
Executive FunctionStroop color reading−0.2730.0770.502−0.2430.034
Global CognitionK-MMSE score−0.2320.0910.619−0.1830.041
K-BNT, Korean Boston Naming Test; RCFT, Rey Complex Figure Test; SVLT, Seoul Verbal Learning Test; COWAT, Controlled Oral Word Association Test; K-MMSE, Korean-Mini-Mental State Examination. * Values represent the standardized linear regression coefficients (β) of the correlation between the visceral adipose tissue’s maximum standardized uptake value (SUVmax) and neuropsychological test scores, after adjusting for age, sex, BMI, education, and white matter hyperintensity volume.
Disclaimer/Publisher’s Note: The statements, opinions and data contained in all publications are solely those of the individual author(s) and contributor(s) and not of MDPI and/or the editor(s). MDPI and/or the editor(s) disclaim responsibility for any injury to people or property resulting from any ideas, methods, instructions or products referred to in the content.

