Abstract
Plant flowering time is affected by endogenous and exogenous factors, but its variation patterns among different populations of a species has not been fully established. In this study, 27 Arabidopsis thaliana accessions were used to investigate the relationship between autonomous pathway gene methylation, gene expression and flowering time variation. DNA methylation analysis, RT-qPCR and transgenic verification showed that variation in the flowering time among the Arabidopsis populations ranged from 19 to 55 days and was significantly correlated with methylation of the coding regions of six upstream genes in the autonomous pathway, FLOWERING LOCUS VE (FVE), FLOWERING LOCUS Y (FY), FLOWERING LOCUS D (FLD), PEPPER (PEP), HISTONE DEACETYLASE 5 (HAD5) and Pre-mRNA Processing Protein 39-1 (PRP39-1), as well as their relative expression levels. The expression of FVE and FVE(CS) was modified separately through degenerate codon substitution of cytosine and led to earlier flowering of transgenic plants by 8 days and 25 days, respectively. An accurate determination of methylated sites in FVE and FVE(CS) among those transgenic plants and the recipient Col-0 verified the close relationship between the number of methylation sites, expression and flowering time. Our findings suggest that the methylation variation of these six key upstream transcription factors was associated with the gene expression level of the autonomous pathway and flowering time in Arabidopsis. The FVE(CS) and FVE genes in transgenic plants tended to be hypermethylated, which could be a protective mechanism for plants. However, modification of gene sequences through degenerate codon substitution to reduce cytosine can avoid hypermethylated transferred genes in transgenic plants. It may be possible to partially regulate the flowering of plants by modified trans-epigenetic technology.
1. Introduction
Flowering is the most important life-history trait of plants, representing a fundamental transition in development from vegetative growth to reproductive growth. Plants have evolved a complex network of regulatory pathways to sense and integrate exogenous and endogenous signals to precisely control flowering time [1]. Flowering time varies significantly among plant species, ranging from a few days to years [2]. Flowering time can also differ greatly within a species. Arabidopsis thaliana (A. thaliana henceforth) grows throughout the Northern Hemisphere, and wild accessions show extensive flowering time variation [3,4]. The extensive variation in flowering time may contribute to the survival range of this species. Many factors may lead to differences in flowering time in A. thaliana, such as differential expression of flowering-related genes and biotic or abiotic factors [5,6,7,8,9,10].
The flowering time of A. thaliana has been extensively studied, and eight pathways have been found to participate in flowering time regulation, including pathways related to the photoperiod, vernalization, temperature, gibberellins, autonomy, age, the circadian clock and the sugar budget [9,11,12]. Among these pathways, the autonomous pathway controls the flowering of A. thaliana through the complicated regulation of FLOWERING LOCUS C (FLC), involving mainly RNA processing, chromatin modification, post-translational modification and other mechanisms [7,13] (Figure 1). An autonomous pathway complex (AuPC) containing FLOWERING LOCUS D (FLD), LUMINIDEPENDENS (LD) and SET DOMAIN GROUP 26 (SDG26) suppresses the FLC expression partly through histone modifications [14]. The SDG26 also regulates the FLC expression and flowering time independently [14,15]. 5-Azacytidine (5-azaC), a potent inhibitor of DNA methyltransferases, offers a straightforward method for experimentally altering the DNA methylation landscape in plants. Utilizing 5-azaC has been critical for elucidating the complexities of DNA methylation patterns, gene regulatory mechanisms and epigenetic reprogramming. Previous studies with 5-azaC-treated [16], ddm1-mutant or MET1 antisense plants [17] have revealed the influence of methylation on the transcription of certain genes in the autonomous pathway by changing the plant’s DNA methylation status at the genomic level. Tools targeting the removal of DNA methylation at specific loci in the genome with high specificity have also been established [18]. Based on these techniques, a stable fwa epiallele consisting of the loss of DNA methylation in the promoter of the FLOWERING WAGENINGEN (FWA) gene was obtained and well characterized [18,19]. However, the functions of DNA methylation of specific genes involved in flowering time variation still need to be further illustrated.
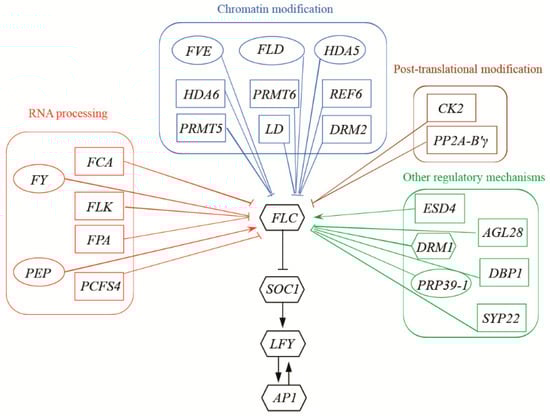
Figure 1.
Methylation levels of gene coding regions in A. thaliana autonomous pathway. Ellipses: genes with methylation related to flowering time and leaf number; Rectangles: gene coding regions universally methylated in the 27 A. thaliana accessions but not related to flowering time or leaf number; and Hexagons: gene coding regions generally not methylated in 27 A. thaliana accessions and not related to flowering time or leaf number.
DNA methylation is associated with various processes, such as transposon silencing, gene expression and stress responses [20,21,22,23,24]. Although DNA methylation has been extensively studied, most of the studies related to DNA methylation function have been based on epigenomic analyses [20,25]; the effects of DNA methylation of a single gene still need further study. Our previous studies showed that the methylation of the ICE1 gene may play an important role in the cold tolerance evolution of the invasive plant species Ageratina adenophora (crofton weed), weedy rice (Oryza sativa L. f. spontanea) and A. thaliana [24,26,27]. Some studies have also investigated the role of DNA methylation in the floral regulation of A. thaliana [17,28]. However, conclusions regarding the function of cytosine methylation of gene coding regions in plants are inconsistent [20,21,29,30,31,32,33]. Therefore, in this study, epigenomic analysis was performed to establish correlations between the methylation and expression levels of specific genes in the autonomous pathway and the flowering time of A. thaliana, after which the identified methylated gene was transformed to verify the effects of its methylation level. The main objective was to investigate the effects of methylation of specific genes involved in the autonomous pathway on flowering time variation in A. thaliana.
2. Results
2.1. Relationship between Flowering Time and the Methylation of Autonomous Pathway Genes
The 27 A. thaliana accessions displayed various flowering times ranging from 19–55.4 days, which corresponded to different total numbers of leaves after flowering (Table S1). Methylomic analysis revealed no significant variations (p > 0.05) in CG, CHG, and CHH methylation of protein-coding genes across most A. thaliana accessions, with the exception of CG methylation in Cvi-0 and Bs-1 (Figure S1). However, methylomic analysis revealed that 27 genes in the A. thaliana autonomous pathway were differentially methylated, with decreasing methylation of the upstream genes to the downstream genes, with the exception of Developmentally Retarded Mutant 1 (DRM1) (Figure 1; Tables S2–S5). In all of these genes, most of the methylated sites occurred at CG sites (Table S3). The CHG and CHH sites were generally not methylated among 25 of the 27 genes, while DOMAINS REARRANGED METHYLTRANSFERASE 2 (DRM2) and AGAMOUS-LIKE 28 (AGL28) showed variable CHG and CHH methylation sites among different A. thaliana populations (Tables S4 and S5). However, methylation levels in the coding regions of only six genes—FVE, FY, FLD, PEP, HDA5 and PRP39-1—were related to flowering time and total number of leaves after flowering (Figure 1, Table S6) in the different A. thaliana accessions (p < 0.05). The A. thaliana accessions with higher methylation levels of the six genes tended to flower later than those with the lower methylation levels of the genes. The CG methylation levels in the six genes were positively correlated (p < 0.05) with flowering time and leaf number (Figure 2, Table S7), whereas the methylation levels of CHG and CHH had no correlations with these characteristics (Tables S8 and S9). The other four downstream genes in the autonomous pathway showed low methylation levels, and the methylation levels of the coding regions of the other 17 genes were not correlated with flowering time or leaf number (Figure 1, Tables S6–S9). The methylation levels of the promoters of the 27 genes were not related to flowering time or leaf number (Tables S10 and S11). The methylation level of the coding regions of the FWA gene and its promoter region showed no correlation with flowering time (Figure S2). DNA polymorphisms of FVE, FY, FLD, PEP, HDA5 and PRP39-1 showed no significant influence on their methylation levels (Figure S3). The results suggested that CG coding region methylation of the FVE, FY, FLD, PEP, HDA5 and PRP39-1 genes was likely to be involved in the regulation of flowering time in A. thaliana.
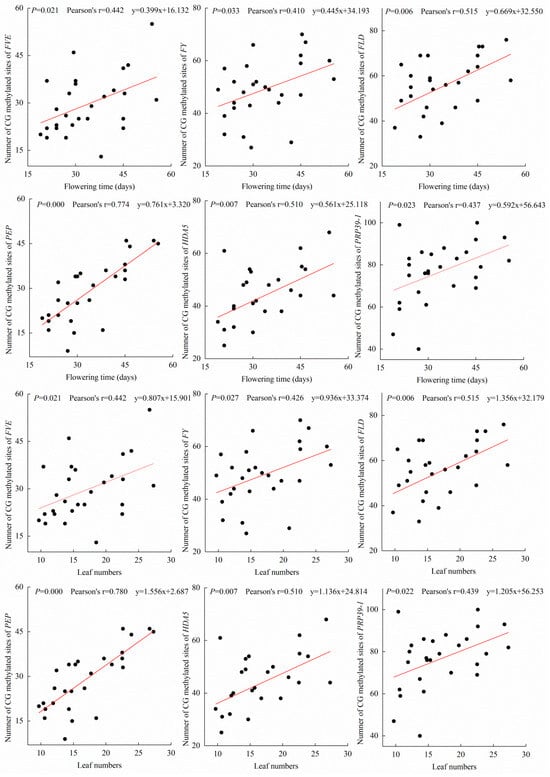
Figure 2.
Correlation plot of methylation levels of the coding regions of A. thaliana autonomous pathway genes, flowering time and leaf number. mC: total number of methylated sites of coding regions.
2.2. Relationship between the Methylation Level and Expression Level of Autonomous Pathway Genes
Compared with the middle-flowering accession Br-0 and the late-flowering accession Tscha-1, the early-flowering A. thaliana accession Col-0 presented the highest expression levels of FVE, FY, FLD, PEP, HDA5 and PRP39-1, while Tscha-1 had the lowest expression levels (Figure 3). There were no significant difference in the expression level of FLD between Col-0 and Br-0 (Figure 3C) and in the expression level of PRP39-1 between Br-0 and Tscha-1 (Figure 3F). The results were consistent with the methylation levels of the two genes among these accessions (Table S2). The expression levels of the six genes were negatively correlated (p < 0.001) with the CG methylation levels in Col-0, Br-0 and Tscha-1 (Figure 3G–L). As CHG and CHH were generally not methylated in FVE, FY, FLD, PEP, HDA5 and PRP39-1, we did not analyze the correlations between the expression levels and the CHG and CHH methylation levels (Tables S4 and S5). Because only a portion of the 27 A. thaliana accessions were used for transcriptome determination in the previous study [20,30], a correlation analysis of the autonomous pathway genes of 15 accessions was conducted using transcriptome and epigenome data. The methylation levels of the coding regions of the six genes were correlated with the expression levels (Table S12). RT-qPCR (real-time quantitative polymerase chain reaction) analysis of the four downstream genes (FLC, SOC1, LFY and AP1) showed that among the accessions of Col-0, Br-0 and Tscha-1, late-flowering Tscha-1 showed the highest expression of FLC, which negatively regulates A. thaliana flowering (Figure S4A). Early-flowering Col-0 had the highest expression levels of the SOC1, LFY and AP1 genes, while Tscha-1 had the lowest expression levels (Figure S4B–D).
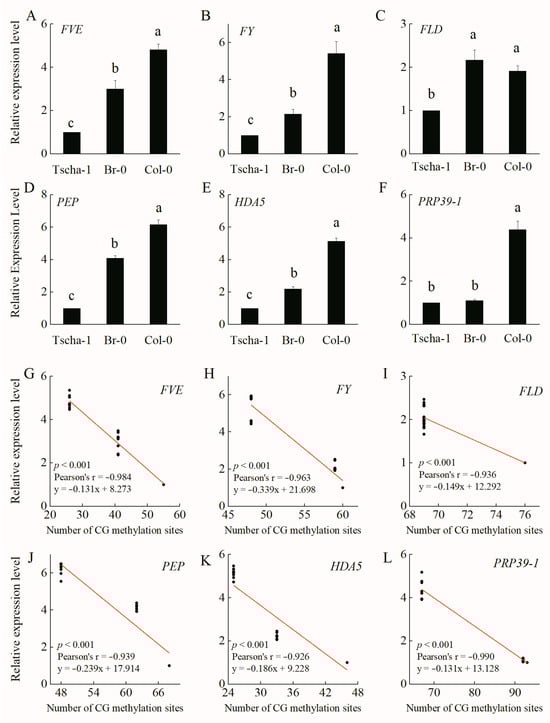
Figure 3.
Relative expression levels of the FVE (A), FY (B), FLD (C), PEP (D), HDA5 (E) and PRP39-1 (F) genes and correlations with coding region methylation levels among Col-0, Br-0 and Tscha-1 (G–L). The different letters indicate significant differences among the different accessions, p < 0.05.
2.3. Reduction in the Flowering Variation Caused by 5-azaC Treatment
After the 5-azaC treatment, the diversity in flowering time across the different A. thaliana accessions decreased (Figure S5A), ranging from 22 to 47.6 days. This treatment led to significant hypomethylation in the coding regions of FVE, FY, FLD, PEP, HDA5, and PRP39-1 genes compared to untreated controls (Table S13). Methylation levels in these genes decreased by 14–56% in the 5-azaC-treated Col-0, Br-0, and Tscha-1 accessions, compared to their controls. Notably, this decrease in methylation was primarily attributed to a reduction in the number of methylated CG sites (Table S13). Furthermore, a reduction in the variability of DNA methylation levels was observed across the three accessions for each of the six genes examined (Figure S5B). This suggests that 5-azaC treatment may lead to a more uniform methylation pattern among the accessions. The relative expression levels of these genes (FVE, FY, FLD, PEP, HDA5, and PRP39-1) increased among Col-0, Br-0 and Tscha-1 after 5-azaC treatment; however, the range of variation in these relative expression levels decreased (Figure S5C). The relative expression levels of these six genes were correlated with both the total number of methylated sites and the number of CG methylated sites in the gene coding regions after 5-azaC treatment (p < 0.05) (Figure S5D). These results indicated that the 5-azaC treatment reduced the flowering diversity, probably due to decreases in both the variation in the methylation level and the relative expression levels of the FVE, FY, FLD, PEP, HDA5 and PRP39-1 genes.
2.4. Restoration of the Flowering Phenotype of fve-3 by Expression of FVE or FVE(CS)
FVE and the modified FVE gene sequence named FVE(CS) (reduced theoretical methylation sites in the gene coding region, details in Section 4.4) shared similar CAI values of 0.69 and 0.66, respectively. Five individual A. thaliana plants expressing FVE (named fve-3+pFVE::FVE) and nine individual plants expressing FVE(CS) (named fve-3+pFVE::FVE(CS)) were obtained (Figure 4A). The two types of transgenic plants (fve-3+pFVE::FVE and fve-3+pFVE::FVE(CS)) flowered significantly earlier (at 23 days and 40 days after planting, respectively) than the fve-3 mutants (48 days after planting). Flowering occurred much earlier in fve-3+pFVE::FVE(CS) than in fve-3+pFVE::FVE. However, the transgenic plants still flowered later than the Col-0 plants (21.6 days) (Figure 4B,C). At the flowering stage, the fve-3+pFVE::FVE(CS) and fve-3+pFVE::FVE plants had fewer leaves than the fve-3 mutants, but more leaves than the Col-0 plants (Figure 4D). The results indicated that FVE(CS) partially restored the function of FVE in fve-3 relative to Col-0.
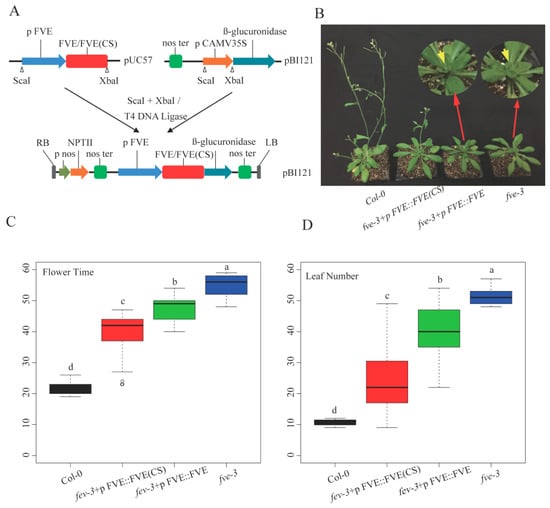
Figure 4.
Expression analysis of FVE(CS) and FVE in fve-3 and their flowering phenotype. (A), Construction of FVE and FVE(CS) plant expression vectors; (B), Phenotypes of six-week-old seedlings of Col-0, fve-3+pFVE::FVE(CS), fve-3+pFVE::FVE and fve-3; (C), Flowering time differences among these plants; and (D), Leaf number differences among these plants. The different letters indicate significant differences among the different plants, p < 0.05.
2.5. Expression Levels of the Autonomous Pathway Genes in fve-3+pFVE::FVE(CS) and fve-3+pFVE::FVE Plants
The relative expression level of FVE in Col-0 was significantly higher than in the transgenic plants, and the expression of FVE was nearly undetectable in fve-3 (Figure 5). The relative expression level of FVE(CS) in fve-3+pFVE::FVE(CS) was significantly higher than the expression level of FVE in fve-3+pFVE::FVE (Figure 5). Expression of the downstream gene FLC was nearly undetectable in the Col-0 and fve-3+pFVE::FVE(CS) plants, and FLC was expressed at a low level in the fve-3+pFVE::FVE individuals, whereas the fve-3 mutants showed the highest expression level (Figure 5). The positive flowering regulators SOC1, LFY and AP1 were barely expressed in the fve-3 mutants; the fve-3+pFVE::FVE(CS) plants had higher expression levels of these genes than in the fve-3+pFVE::FVE plants, while the Col-0 plants presented the highest expression level of these genes (Figure 5). Differences in the expression of the FVE, FLC, SOC1, LFY and AP1 genes may lead to differences in flowering time between these plants.
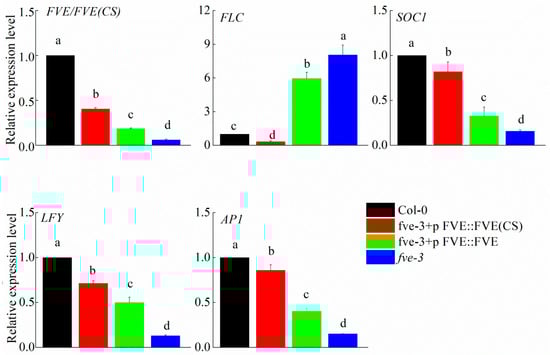
Figure 5.
RT-qPCR analysis of the autonomous pathway genes FVE, FLC, SOC1, LFY and AP1 of Col-0, fve-3+pFVE::FVE(CS), fve-3+pFVE::FVE and fve-3. The letters indicate significant differences among the different transgenic plants, p < 0.05.
2.6. Methylation Levels of FVE and FVE(CS) in Col-0 and Transgenic Plants
The FVE(CS) and FVE genes had methylated sites of 30 and 57, respectively, in the transgenic plants (Figure 6; Table S14). There were only 20 methylated sites within the FVE gene in the Col-0 plants, which is fewer than the corresponding number in the transgenic plants (Figure 6; Table S14). Only five methylated sites within the FVE(CS) gene in the fve-3+pFVE::FVE(CS) plants were the same as those in the Col-0 plants, and the other 25 methylated sites were novel and not methylated in Col-0 (Figure 6; Table S14). However, 16 methylated sites within the FVE gene in the fve-3+pFVE::FVE plants were the same as those in the Col-0 plants. The other 39 methylated sites within the FVE gene were novel compared to those in Col-0 (Figure 6; Table S14). The FVE(CS) gene in the fve-3+pFVE::FVE(CS) plants had more CHG and CHH methylated sites and fewer CG methylated sites than the FVE gene in Col-0 (Figure 6; Table S14). The FVE gene in the fve-3+pFVE::FVE plants had higher methylation levels of CG, CHG and CHH than the FVE gene in Col-0 (Figure 6; Table S14). The higher methylation levels of the FVE and FVE(CS) genes were associated with the lower expression levels and late flowering of the fve-3+pFVE::FVE and fve-3+pFVE::FVE(CS) compared to Col-0 plants.
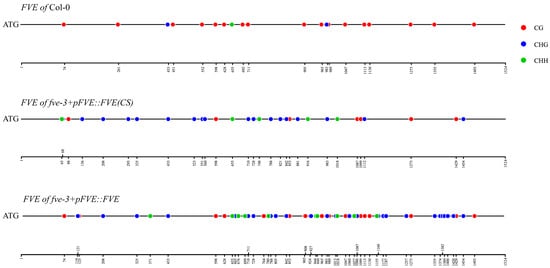
Figure 6.
Methylated sites of FVE and FVE(CS) genes in Col-0, fve-3+pFVE::FVE and fve-3+pFVE::FVE(CS) plants.
3. Discussion
In this study, all 27 A. thaliana accessions were grown in a controlled environment that eliminated the influence of environmental factors [9]. However, different A. thaliana accessions still showed various flowering times (Table S1), indicating that the flowering of A. thaliana was also affected by endogenous factors [34]. DNA methylation has been shown to be involved in the regulation of flowering time in A. thaliana, such as FWA [18,19]. However, the methylation level of the FWA gene showed no correlation with the flowering time of the 27 A. thaliana accessions (Figure S2). The CG methylation levels of six genes (FVE, FY, FLD, PEP, HDA5 and PRP39-1) in the autonomous pathway were significantly correlated with the corresponding gene expressions and the phenotypic differences in flowering time, indicating that CG coding region methylation of the six genes might be associated with the regulation of the expressions, leading to variations in flowering time. In addition, DNA polymorphisms of these six genes showed no significant influence on their methylation levels (Figure S3). Our results suggested that DNA methylation of certain key genes might play important roles in flowering time variation in A. thaliana.
These six genes act as upstream components in the autonomous pathway, indicating that the pathway’s function is likely influenced by the DNA methylation of these regulatory genes. For all 27 upstream genes, most methylated sites were CG sites, consistent with the notion that CG gene-body methylation is a common feature of animal and plant genomes [35,36]. Studies have shown that FY, PEP, PRP39-1, FVE, FLD, FLC and HDA5 are involved in RNA processing, transcription, post-transcription and chromatin modification [5]. We hypothesized that the methylation levels of the upstream regulators of the six genes studied here (FVE, FY, FLD, PEP, HDA5 and PRP39-1) could be closely related to flowering time variation and their expression levels.
All the downstream genes in the autonomous pathway generally had lower methylation levels and were not related to flowering time (Figure 1; Table S2). Considering the methylation levels of the ICE1 gene in crofton weed, A. thaliana and weedy rice [24,26,27], we infer that the DNA methylation of upstream regulators likely plays a role in the pathways responsible for environmental responses. This is consistent with the known function of DNA methylation, in which plants respond quickly to different environmental conditions through DNA methylation independent of gene sequence changes, leading to differential expressions [37,38]. This process greatly benefits plant survival in different environments, as changes in DNA methylation are much easier and more flexible than gene mutations [39,40]. Responding to environmental changes through the methylation of upstream regulators in transduction pathways could improve the sensitivity of plant responses and benefit plant survival.
In this study, the complemented lines fve-3+pFVE::FVE(CS) and fve-3+pFVE::FVE showed distinct patterns in terms of DNA methylation, flowering time and gene expression. The different methylation levels of FVE(CS) and FVE corresponded to the differential expressions of the downstream genes in the autonomous pathway and flowering time variation. Since FVE and FVE(CS) shared similar CAI values, the difference in codon usage caused by degenerate codon substitution cannot explain the remarkable difference in translation efficiency. These results suggested that methylation of the FVE gene may be involved in flowering time variation in A. thaliana. The flowering phenotypes of Col and fve-3 were both highly synchronized; in contrast, the spreading of flowering time over a broader time interval in the transgenic plants could be a hallmark of an epigenetic effect. Both the FVE(CS) and FVE genes in the transgenic plants fve-3+pFVE::FVE(CS) and fve-3+pFVE::FVE were methylated, and the methylation levels of the FVE(CS) and FVE gene were higher in the transgenic plants than in the Col-0 plants. The results implied that expressing FVE(CS) or FVE in fve-3 could only partially restore the flowering phenotype. Transgenes tend to be hypermethylated in transgenic plants; this hypermethylation could be a protective mechanism in plants. However, modification of the gene sequence through codon degeneracy substitution to reduce the number of cytosine nucleotides can relatively avoid hypermethylation of transgenes, although methylation of plants expressing FVE(CS) appears more stochastic compared with those expressing FVE (Figure 4C). Thus, it may be possible to partially regulate the flowering of plants via this technology. In addition, crop production and environmental adaptability may be improved by changing the relevant gene methylations using this relatively safe and effective approach—codon degeneracy substitution—in the future.
In conclusion, our study indicates that methylation of the FVE gene is likely to be associated with flowering time variations in A. thaliana through regulating the gene expression. The AuPC promotes plant flowering by repressing the FLC expression, and each of the AuPC components could also be involved in the plant flowering regulation independently [14]. The AuPC-based molecular mechanism provides a precise network for plant flowering regulation. Methylation alterations of the key genes seem to be an effective way to adapt to a changing environment rapidly. The question of whether key gene methylation is involved in other plant phenotypic variations needs to be further studied.
4. Materials and Methods
4.1. Plant Materials, Growth Conditions and Flowering Time Statistical Analysis
In this study, 27 A. thaliana accessions were selected to represent a wide range of flowering times, from early-flowering to late-flowering phenotypes. These accessions, which exhibited flowering times ranging from 19 to 55.4 days under our experimental conditions, were purchased from the Arabidopsis Biological Resource Center (Table S1). The plants were grown in a controlled-environment chamber (23 °C, 16/8-h photoperiod, 120 μmol photons m−2 s−1, humidity 60–70%). The descendants of a single mother plant of each A. thaliana accession were used in this study. The seeds were sterilized and cold-stratified in the dark at 4 °C for 2 days before sowing, followed by transplant on Murashige and Skoog (MS) media consisting of 0 (WT) or 50 µM 5-azaC (T-5azaC). After 7 days, the seedlings were transferred to plastic pots filled with a 3.5:1 mixture of peat moss–vermiculite and grown under the conditions described above. The flowering times of 15 individual plants and the total number of leaves were observed for each accession, and the experiment was repeated three times. Bivariate correlation analysis of flowering time, leaf number and DNA methylation level was conducted using SPSS 20 software (IBM, Armonk, NY, USA). R 3.6.3(R Foundation for Statistical Computing, Vienna, Austria) and Origin 8 (OriginLab Corporation, Northampton, MA, USA) were used for statistical analysis, and the Mann–Whitney U test was used to analyze significant differences at the level of p < 0.05 in flowering time between the WT and T-5azaC accessions. Linear correlation analysis of the relative expression level and number of methylated sites was performed using Origin 8 (p < 0.05). The correlations between DNA methylation and relative expression levels were analyzed using SPSS 20 software, and the results were plotted with the Origin 8 and R 3.6.3 (p < 0.05).
4.2. Extraction of Epigenome and Transcriptome Data and Analysis of the DNA Methylation of Autonomous Pathway Genes and Its Correlations with Flowering Time and Leaf Numbers
Epigenomic data of different A. thaliana accessions collected by Schmitz et al. [41] were downloaded. In their study, custom algorithms were used to identify mC sites as described by Lister et al. [42]. The methylation information for the coding regions and their promoter regions (1500 bp upstream of ATG) of autonomous pathway genes from 27 A. thaliana accessions was extracted using the R 3.6.3. In addition, the CG, CHG and CHH (where H is A, C, or T) methylated sites in the coding regions of the genes were determined. The RNA-Seq data of GSE43858 [41] and GSE80744 [20] were downloaded from The Gene Expression Omnibus (GEO). The autonomous pathway gene expression level was estimated using FPKM (fragments per kilobase per million reads) values, which were extracted using R 3.6.3. The correlations among DNA methylation, flowering time, the total number of leaves after flowering and gene expression levels of the different A. thaliana accessions were determined using SPSS 20 software, and the data were plotted via R 3.6.3. GWAS (Genome Wide Association Study) was conducted using 1001 Genomes Project public tools: GWAPP (https://gwas.gmi.oeaw.ac.at/, accessed on 18 November 2022) with the “1001 Fullsequence Dataset”. The gene body methylation levels of FVE, FY, FLD, PEP, HDA5 and PRP39-1 were retrieved from http://neomorph.salk.edu/downloads/1001/ (accessed on 22 June 2021). A total of 23 A. thaliana ecotypes were included in the GWAS analysis, as methylome or genome data were missing for Tu-0, Hey-1, Ty-0 and Rd-0.
4.3. Expression Dectection of Autonomous Pathway Genes
In this study, three A. thaliana accessions were used for Real-time quantitative polymerase chain reaction (RT-qPCR) analysis: the early-flowering accession Col-0, middle-flowering accession Br-0 and late-flowering accession Tscha-1. The expression levels of six upstream methylated genes, FLOWERING LOCUS VE (FVE), FLOWERING LOCUS Y (FY), FLOWERING LOCUS D (FLD), PEPPER (PEP), HISTONE DEACETYLASE5 (HDA5) and Pre-mRNA Processing Protein39-1 (PRP39-1) correlated with flowering time, and those of four downstream genes in the autonomous pathway, FLC, SUPPRESSOR OF OVEREXPRESSION OF CONSTANS 1/AGAMOUS-LIKE20 (SOC1/AGL20), LEAFY (LFY), and APETALA1 (AP1), were determined by RT-qPCR with the primers listed in Table S15. The expression levels of the six methylated genes were also determined in 5-azaC-treated Col-0, Br-0 and Tscha-1 plants. Three-week-old Col-0, Br-0 and Tscha-1 seedlings were used for RT-qPCR analysis. The expression levels were normalized to that of the beta-actin gene and calculated for each population using the 2−ΔΔCt method [43]. Fold changes in the expression of autonomous pathway genes in the 5-azaC-treated plants were calculated relative to their expressions in untreated plants. Three biological replicates were included for each gene, and three different seedlings were used for RT-qPCR in each replicate. The differences were analyzed by one-way analysis of variance (ANOVA) using SPSS 20 software.
4.4. Codon Degeneracy-Based Nucleotide Substitution of the FVE Gene and Transgenic Verification
According to the codon degeneracy of amino acids, the nucleotides CG, CHG and CHH of the FVE gene were substituted to minimize its methylation sites. There were 225 cytosine nucleotides within the FVE gene that could theoretically be methylated, and a total of 127 cytosine nucleotides were substituted according to codon degeneracy (Figure S6). The modified FVE gene sequence was named as FVE(CS) and was synthesized by Sangon Biotech (201611, Shanghai, China). The codon adaptation index (CAI) value was calculated using EMBOSS (http://www.bioinformatics.nl/emboss-explorer/, accessed on 13 May 2019). FVE and FVE(CS) were used for plant expression vector construction and A. thaliana fve-3 [5] transformation.
The primers used for pFVE-FVE-pBI121 and pFVE-FVE(CS)-pBI121 vector construction are listed in Table S16. The vectors were then used for A. thaliana transformation via the floral dip method [44]. After transgenic A. thaliana seeds were harvested, the seeds were cultivated on MS media consisting of 50 μg ml−1 kanamycin without vernalization for screening. Transgenic plants with a single copy of the exogenous gene were identified and used for subsequent experiments. The flowering times and leaf numbers of 15 individuals each of Col-0, fve-3 plants and homozygotes of the third generation of each transgenic individual were determined. Three-week-old young leaves of the earliest flowering plants of Col-0, fve-3+pFVE::FVE(CS), fve-3+pFVE::FVE and fve-3 were selected, and three individuals of each plant were used for RT-qPCR analysis and methylation determination.
4.5. Methylation Determination
Ten individuals of Col-0, fve-3 and the two transgenic plants were used for methylation determination. The methylated sites in the FVE and FVE(CS) genes were determined using bisulfite modification (EZ DNA Methylation-GoldTM Kit) with the primers listed in Table S17. The PCR products were ligated into pMDTM19-T vectors (pMDTM19-T Vector Cloning Kit, TaKaRa, Tokyo, Japan), and 10 clones were sequenced for each sample. The obtained sequences (GenScript USA Inc., Nanjing, China) of each sample were compared with the original FVE sequence or FVE(CS) sequence, and a converted cytosine indicated an unmethylated site. The thresholds for labeling a cytosine as methylated in the CG, CHG or CHH contexts were set to 50%, 20% and 20%, respectively. Six individuals each from the 5-azaC-treated Col-0, Br-0 and Tscha-1 accessions were also used for the FVE, FY, FLD, PEP, HDA5 and PRP39-1 methylation determination using the primers listed in Table S17.
Supplementary Materials
The following supporting information can be downloaded at: https://www.mdpi.com/article/10.3390/ijms25137478/s1.
Author Contributions
Conceptualization, H.X. and S.Q.; Formal analysis, H.X., X.L., L.L., H.L., S.X. and D.C.; Funding acquisition, H.X. and H.L.; Project administration, S.Q.; Supervision, S.Q.; Validation, H.X., Y.S., K.X. and B.C.; Writing—original draft, H.X.; Writing—review & editing, X.L. and S.Q. All authors have read and agreed to the published version of the manuscript.
Funding
This study was supported by the National Natural Science Foundation of China (32102238, 32202330 and 31870526) and the China Transgenic Organism Research and Commercialization Project (2016ZX08011-001).
Institutional Review Board Statement
Not applicable.
Informed Consent Statement
Not applicable.
Data Availability Statement
The original contributions presented in the study are included in the article/Supplementary Material, further inquiries can be directed to the corresponding author.
Acknowledgments
We thank Martínez-Zapater JM (ICVV, CSIC, Universidad de La Rioja, Gobierno de la Rioja, Logroño, Spain) for sharing the fve-3 mutant.
Conflicts of Interest
The authors declare no conflict of interest.
References
- Bouché, F.; Lobet, G.; Tocquin, P.; Périlleux, C. FLOR-ID: An interactive database of flowering-time gene networks in Arabidopsis thaliana. Nucleic Acids Res. 2015, 44, 1167–1171. [Google Scholar] [CrossRef] [PubMed]
- Schemske, D.W.; Willson, M.F.; Melampy, M.N.; Miller, L.J.; Verner, L.; Schemske, K.M.; Best, L.B. Flowering ecology of some spring woodland herbs. Ecology 1978, 59, 351–366. [Google Scholar] [CrossRef]
- Lempe, J.; Balasubramanian, S.; Sureshkumar, S.; Singh, A.; Schmid, M.; Weigel, D. Diversity of flowering responses in wild Arabidopsis thaliana strains. PLoS Genet. 2005, 1, 109–118. [Google Scholar] [CrossRef]
- Wilczek, A.M.; Roe, J.L.; Knapp, M.C.; Cooper, M.D.; Lopez-Gallego, C.; Martin, L.J.; Muir, C.D.; Sim, S.; Walker, A.; Anderson, J.; et al. Effects of genetic perturbation on seasonal life history plasticity. Science 2009, 323, 930–934. [Google Scholar] [CrossRef]
- Ausín, I.; Alonsoblanco, C.; Jarillo, J.A.; Ruizgarcía, L.; Martínezzapater, J.M. Regulation of flowering time by FVE, a retinoblastoma-associated protein. Nature Genet. 2004, 36, 162–166. [Google Scholar] [CrossRef] [PubMed]
- Levy, Y.Y.; Dean, C. Control of flowering time. Curr. Opin. Plant Biol. 1998, 1, 49–54. [Google Scholar] [CrossRef]
- Reeves, P.H.; Murtas, G.; Dash, S.; Coupland, G. Early in short days 4, a mutation in Arabidopsis that causes early flowering and reduces the mRNA abundance of the floral repressor FLC. Development 2002, 129, 5349–5361. [Google Scholar] [CrossRef] [PubMed][Green Version]
- Samis, K.E.; Heath, K.D.; Stinchcombe, J.R. Discordant longitudinal clines in flowering time and phytochrome C in Arabidopsis thaliana. Evolution 2008, 62, 2971–2983. [Google Scholar] [CrossRef]
- Srikanth, A.; Schmid, M. Regulation of flowering time: All roads lead to Rome. Cell. Mol. Life Sci. 2011, 68, 2013–2037. [Google Scholar] [CrossRef]
- Wagner, M.R.; Lundberg, D.S.; Colemanderr, D.; Tringe, S.G.; Dangl, J.L.; Mitchellolds, T. Natural soil microbes alter flowering phenology and the intensity of selection on flowering time in a wild Arabidopsis relative. Ecol. Lett. 2014, 17, 717–726. [Google Scholar] [CrossRef]
- Blumel, M.; Dally, N.; Jung, C. Flowering time regulation in crops-what did we learn from Arabidopsis? Curr. Opin. Biotech. 2015, 32, 121–129. [Google Scholar] [CrossRef]
- Quiroz, S.; Yustis, J.C.; Chávez-Hernández, E.C.; Martínez, T.; Sanchez, M.D.L.P.; Garay-Arroyo, A.; Álvarez-Buylla, E.R.; García-Ponce, B. Beyond the genetic pathways, flowering regulation complexity in Arabidopsis thaliana. Int. J. Mol. Sci. 2021, 22, e5716. [Google Scholar] [CrossRef]
- Cheng, J.Z.; Zhou, Y.P.; Lv, T.X.; Xie, C.P.; Tian, C.E. Research progress on the autonomous flowering time pathway in Arabidopsis. Physiol. Mol. Biol. Plants 2017, 23, 477–485. [Google Scholar] [CrossRef]
- Qi, P.-L.; Zhou, H.-R.; Zhao, Q.-Q.; Feng, C.; Ning, Y.-Q.; Su, Y.-N.; Cai, X.-W.; Yuan, D.-Y.; Zhang, Z.-C.; Su, X.-M.; et al. Characterization of an autonomous pathway complex that promotes flowering in Arabidopsis. Nucleic Acids Res. 2022, 50, 7380–7395. [Google Scholar] [CrossRef] [PubMed]
- Zeng, J.; Yang, L.; Tian, M.; Xie, X.; Liu, C.; Ruan, Y. SDG26 is involved in trichome control in Arabidopsis thaliana: Affecting phytohormones and adjusting accumulation of H3K27me3 on genes related to trichome growth and development. Plants 2023, 12, e1651. [Google Scholar] [CrossRef] [PubMed]
- Burn, J.E.; Bagnall, D.J.; Metzger, J.D.; Dennis, E.S.; Peacock, W.J. DNA methylation, vernalization, and the initiation of flowering. Proc. Natl. Acad. Sci. USA 1993, 90, 287–291. [Google Scholar] [CrossRef] [PubMed]
- Sheldon, C.C.; Burn, J.E.; Perez, P.P.; Metzger, J.; Edwards, J.A.; Peacock, W.J.; Dennis, E.S. The FLF MADS box gene: A repressor of flowering in Arabidopsis regulated by vernalization and methylation. Plant Cell 1999, 11, 445–458. [Google Scholar] [CrossRef]
- Gallego-Bartolomé, J.; Gardiner, J.; Liu, W.; Papikian, A.; Ghoshal, B.; Kuo, H.Y.; Zhao, J.M.-C.; Segal, D.J.; Jacbsen, S.E. Targeted DNA demethylation of the Arabidopsis genome using the human TET1 catalytic domain. Proc. Natl. Acad. Sci. USA 2018, 115, 2125–2134. [Google Scholar] [CrossRef]
- Johnson, L.M.; Du, J.; Hale, C.J.; Bischof, S.; Feng, S.; Chodavarapu, R.K.; Zhong, X.; Marson, G.; Pellegrini, M.; Segal, D.J.; et al. SRA- and SET-domain-containing proteins link RNA polymerase V occupancy to DNA methylation. Nature 2015, 507, 124–128. [Google Scholar] [CrossRef]
- Kawakatsu, T.; Huang, S.C.; Jupe, F.; Sasaki, E.; Schmitz, R.J.; Urich, M.A.; Castanon, R.; Nery, J.R.; Barragan, C.; He, Y.; et al. Epigenomic diversity in a global collection of Arabidopsis thaliana accessions. Cell 2016, 166, 492–505. [Google Scholar] [CrossRef]
- Sanchez, D.H.; Paszkowski, J. Heat-induced release of epigenetic silencing reveals the concealed role of an imprinted plant gene. PLoS Genet. 2014, 10, e1004806. [Google Scholar] [CrossRef] [PubMed]
- Schübeler, D. Function and information content of DNA methylation. Nature 2015, 517, 321–326. [Google Scholar] [CrossRef] [PubMed]
- Wolf, S.F.; Jolly, D.J.; Lunnen, K.D.; Friedmann, T.; Migeon, B.R. Methylation of the hypoxanthine phosphoribosyltransferase locus on the human X chromosome: Implications for X-chromosome inactivation. Proc. Natl. Acad. Sci. USA 1984, 81, 2806–2810. [Google Scholar] [CrossRef]
- Xie, H.J.; Li, H.; Liu, D.; Dai, W.; He, J.; Lin, S.; Duan, H.; Liu, L.; Chen, S.; Song, X.; et al. ICE1 demethylation drives the range expansion of a plant invader through cold tolerance divergence. Mol. Ecol. 2015, 24, 835–850. [Google Scholar] [CrossRef]
- Zilberman, D.; Gehring, M.; Tran, R.K.; Ballinger, T.; Henikoff, S. Genome-wide analysis of Arabidopsis thaliana DNA methylation uncovers an interdependence between methylation and transcription. Nature Genet. 2007, 39, 61–69. [Google Scholar] [CrossRef] [PubMed]
- Xie, H.J.; Sun, Y.; Cheng, B.; Xue, S.; Cheng, D.; Liu, L.; Meng, L.; Qiang, S. Variation in ICE1 methylation primarily determines phenotypic variation in freezing tolerance in Arabidopsis thaliana. Plant Cell Physiol. 2019, 60, 152–165. [Google Scholar] [CrossRef] [PubMed]
- Xie, H.J.; Han, Y.; Li, X.; Dai, W.; Song, X.; Olsen, K.M.; Qiang, S. Climate-dependent variation in cold tolerance of weedy rice and rice mediated by OsICE1 promoter methylation. Mol. Ecol. 2020, 29, 121–137. [Google Scholar] [CrossRef] [PubMed]
- Johannes, F.; Porcher, E.; Teixeira, F.K.; Saliba-Colombani, V.; Simon, M.; Agier, N.; Bulski, A.; Albuisson, J.; Heredia, F.; Audigier, P.; et al. Assessing the impact of transgenerational epigenetic variation on complex traits. PLoS Genet. 2009, 5, e1000530. [Google Scholar] [CrossRef] [PubMed]
- Bewick, A.J.; Schmitz, R.J. Gene body DNA methylation in plants. Curr. Opin. Plant Biol. 2017, 36, 103–110. [Google Scholar] [CrossRef]
- Pecinka, A.; Abdelsamad, A.; Vu, G. Hidden genetic nature of epigenetic natural variation in plants. Trends Plant Sci. 2013, 18, 625–632. [Google Scholar] [CrossRef]
- Schmitz, R.J.; Ecker, J.R. Epigenetic and epigenomic variation in Arabidopsis thaliana. Trends Plant Sci. 2012, 17, 149–154. [Google Scholar] [CrossRef] [PubMed]
- Soppe, W.; Jacobsen, S.E.; Alonso-Blanco, C.; Jackson, J.P.; Kakutani, T.; Koornneef, M.; Peeters, A.J. The late flowering phenotype of fwa mutants is caused by gain-of-function epigenetic alleles of a homeodomain gene. Mol. Cell 2000, 6, 791–802. [Google Scholar] [CrossRef] [PubMed]
- Teixeira, F.K.; Colot, V. Gene body DNA methylation in plants: A means to an end or an end to a means? EMBO J. 2014, 28, 997–998. [Google Scholar] [CrossRef]
- Boss, P.K.; Bastow, R.M.; Mylne, J.S.; Dean, C. Multiple pathways in the decision to flower: Enabling, promoting, and resetting. Plant Cell 2004, 16, S18–S31. [Google Scholar] [CrossRef] [PubMed]
- Feng, S.; Cokus, S.J.; Zhang, X.; Chen, P.-Y.; Bostick, M.; Goll, M.G.; Hetzel, J.; Jain, J.; Strauss, S.H.; Halpern, M.E.; et al. Conservation and divergence of methylation patterning in plants and animals. Proc. Natl. Acad. Sci. USA 2010, 107, 8689–8694. [Google Scholar] [CrossRef]
- Zemach, A.; McDaniel, I.E.; Silva, P.; Zilberman, D. Genome-wide evolutionary analysis of eukaryotic DNA methylation. Science 2010, 328, 916–919. [Google Scholar] [CrossRef]
- Dowen, R.H.; Pelizzola, M.; Schmitz, R.J.; Lister, R.; Dowen, J.M.; Nery, J.R.; Dixon, J.E.; Ecker, J.R. Widespread dynamic DNA methylation in response to biotic stress. Proc. Natl. Acad. Sci. USA 2012, 109, 2183–2191. [Google Scholar] [CrossRef]
- Dubin, M.J.; Zhang, P.; Meng, D.; Remigereau, M.-S.; Osborne, E.J.; Casale, F.P.; Drewe, P.; Kahles, A.; Jean, G.; Vilhjálmsson, B.; et al. DNA methylation in Arabidopsis has a genetic basis and shows evidence of local adaptation. eLife 2014, 4, e05255. [Google Scholar] [CrossRef]
- Ramchandani, S.; Bhattacharya, S.K.; Cervoni, N.; Szyf, M. DNA methylation is a reversible biological signal. Proc. Natl. Acad. Sci. USA 1999, 96, 6107–6112. [Google Scholar] [CrossRef]
- Secco, D.; Wang, C.; Shou, H.; Schultz, M.D.; Chiarenza, S.; Nussaume, L.; Ecker, J.R.; Whelan, J.; Lister, R. Stress induced gene expression drives transient DNA methylation changes at adjacent repetitive elements. eLife 2015, 4, e09343. [Google Scholar] [CrossRef]
- Schmitz, R.J.; Schultz, M.D.; Urich, M.A.; Nery, J.R.; Pelizzola, M.; Libiger, O.; Alix, A.; McCosh, R.B.; Chen, H.; Schork, N.J.; et al. Patterns of population epigenomic diversity. Nature 2013, 495, 193–198. [Google Scholar] [CrossRef] [PubMed]
- Lister, R.; Pelizzola, M.; Dowen, R.H.; Hawkins, R.D.; Hon, G.; Tonto-Filippini, J.; Nery, J.R.; Lee, L.; Ye, Z.; Ngo, Q.-M.; et al. Human DNA methylomes at base resolution show widespread epigenomic differences. Nature 2009, 462, 315–322. [Google Scholar] [CrossRef] [PubMed]
- Livak, K.J.; Schmittgen, T.D. Analysis of relative gene expression data using real-time quantitative PCR and the 2−ΔΔCT Method. Methods 2001, 25, 402–408. [Google Scholar] [CrossRef]
- Miura, K.; Jin, J.B.; Lee, J.; Yoo, C.Y.; Stirm, V.; Miura, T.; Ashworth, E.N.; Bressan, R.A.; Yun, D.-J.; Hasegawa, P.M. SIZ1-mediated sumoylation of ICE1 controls CBF3/DREB1A expression and freezing tolerance in Arabidopsis. Plant Cell 2007, 194, 1403–1414. [Google Scholar] [CrossRef] [PubMed]


Disclaimer/Publisher’s Note: The statements, opinions and data contained in all publications are solely those of the individual author(s) and contributor(s) and not of MDPI and/or the editor(s). MDPI and/or the editor(s) disclaim responsibility for any injury to people or property resulting from any ideas, methods, instructions or products referred to in the content. |
© 2024 by the authors. Licensee MDPI, Basel, Switzerland. This article is an open access article distributed under the terms and conditions of the Creative Commons Attribution (CC BY) license (https://creativecommons.org/licenses/by/4.0/).