
A Bioinformatic Assay of Quercetin in Gastric Cancer

 , , , ,
Abstract
:1. Introduction
2. Results
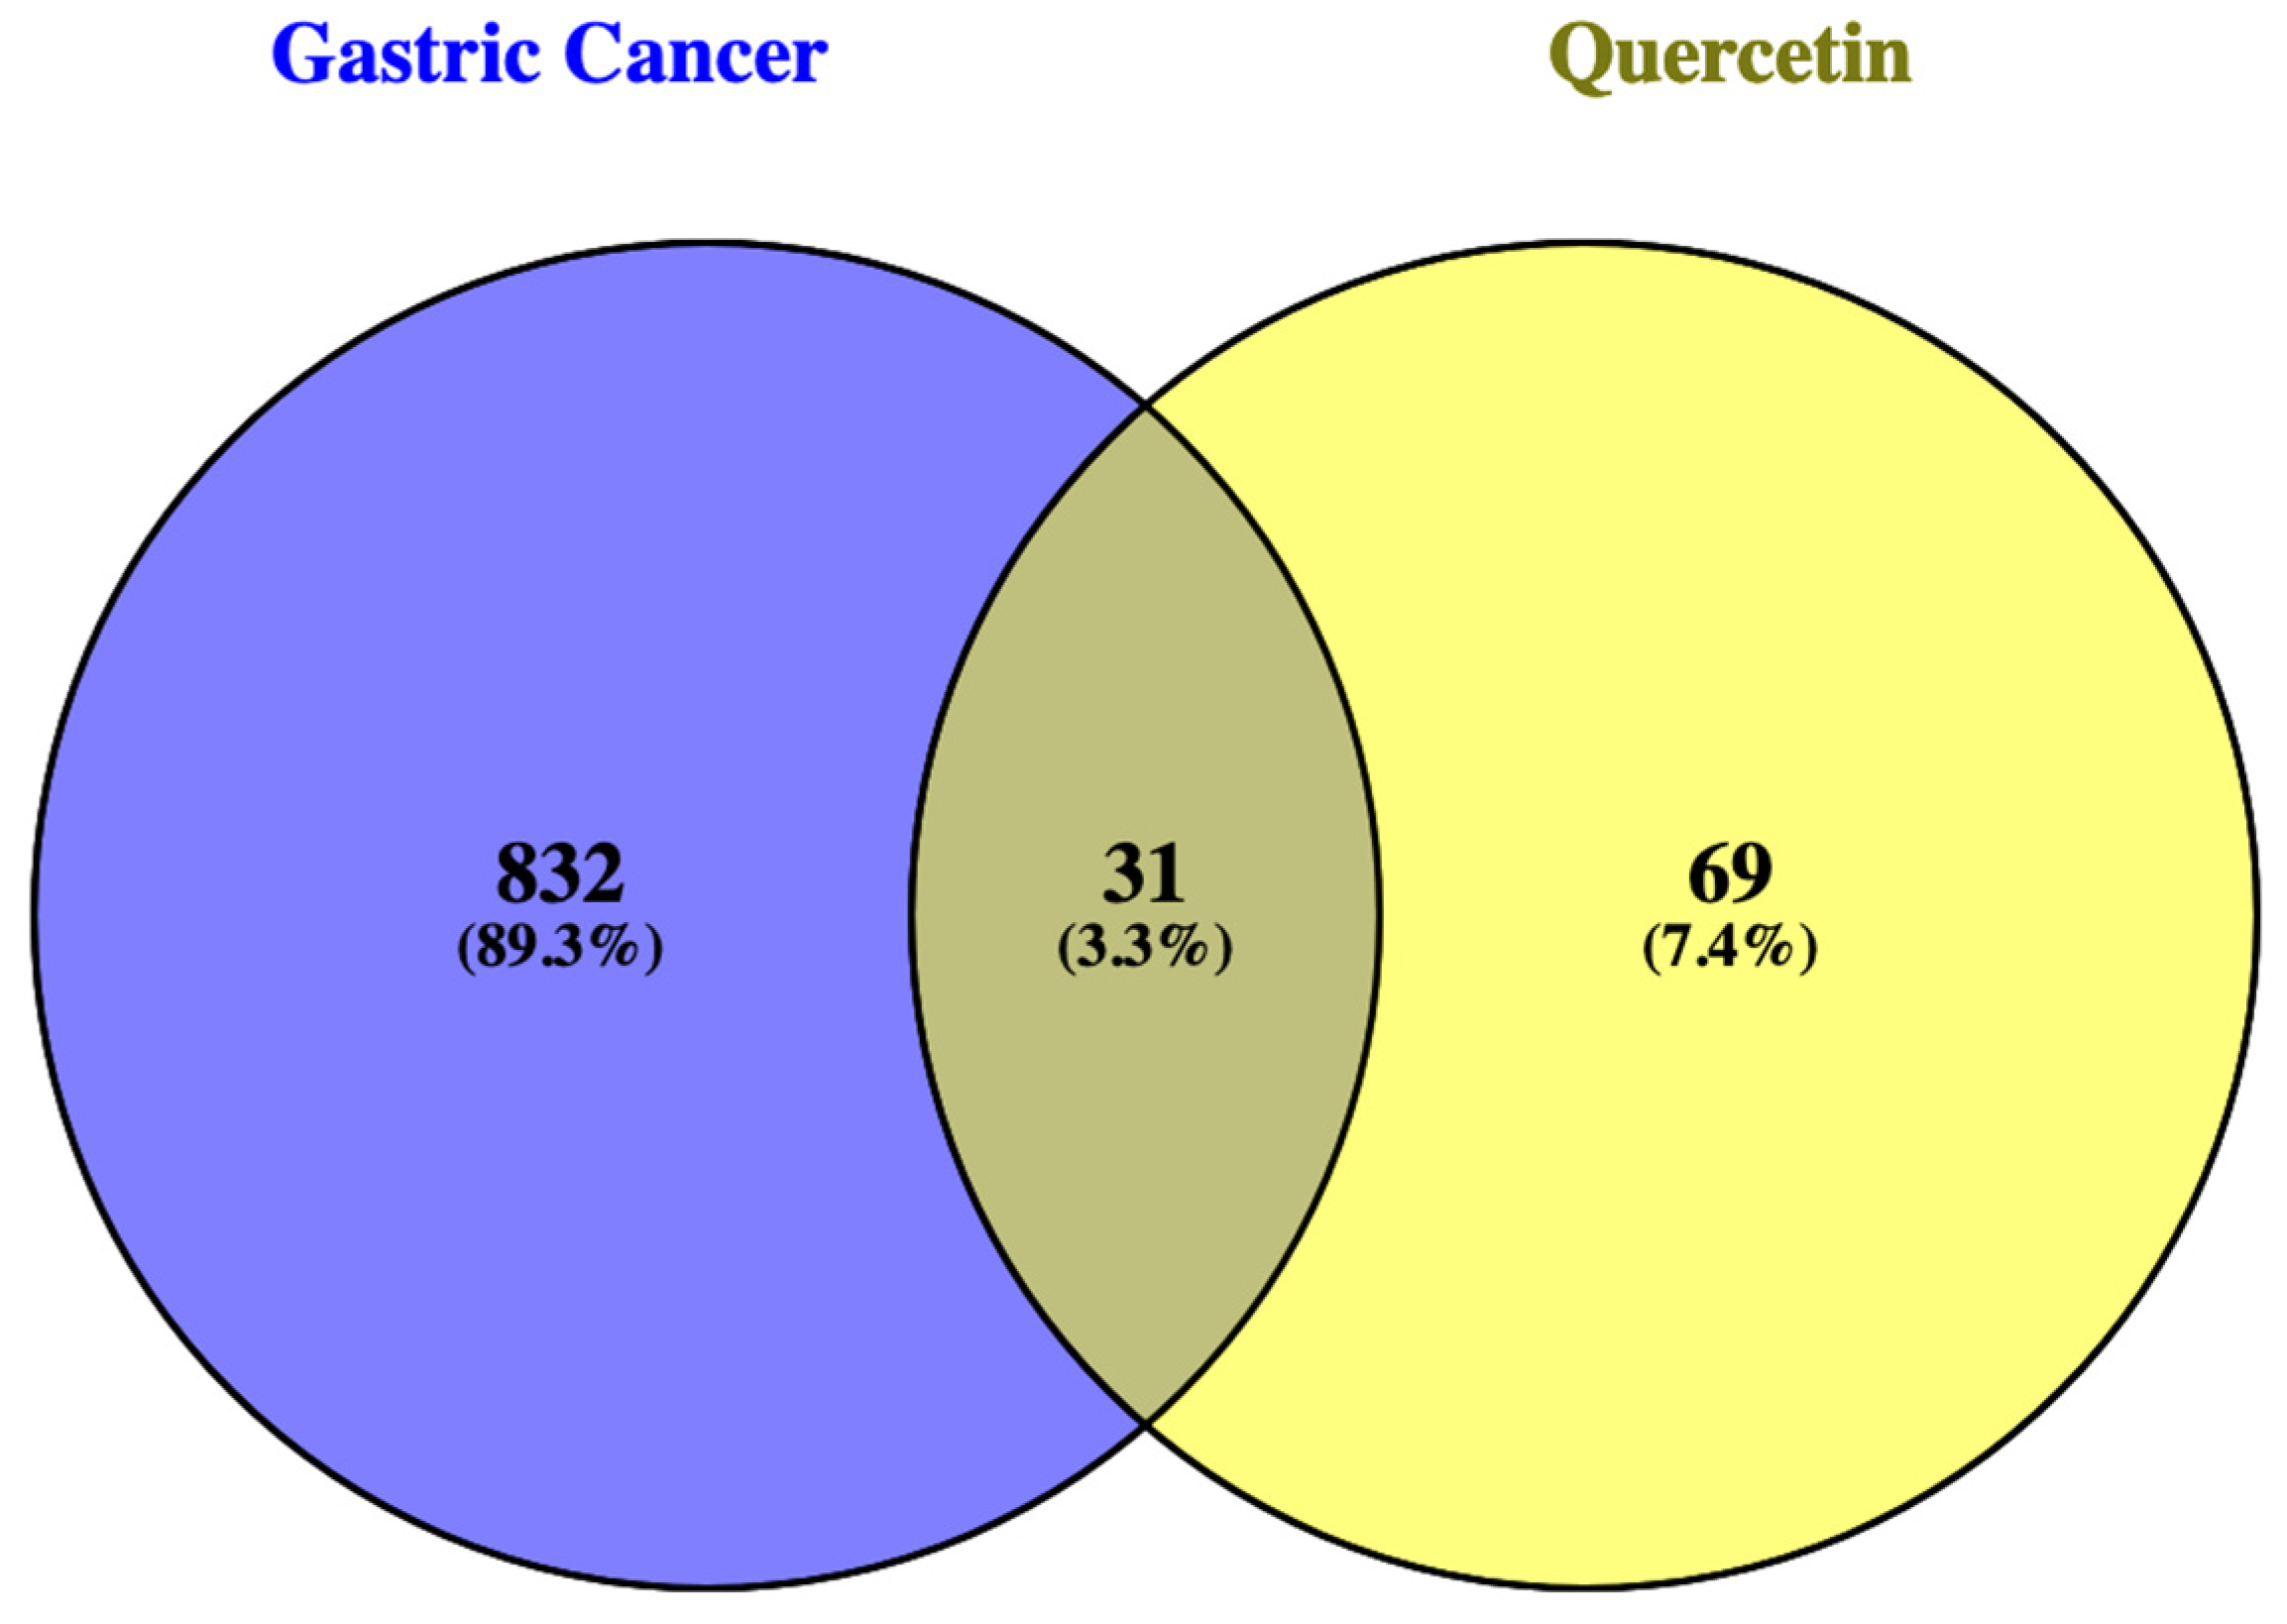
2.1. Target Genes
Common Genes between GC and QRC
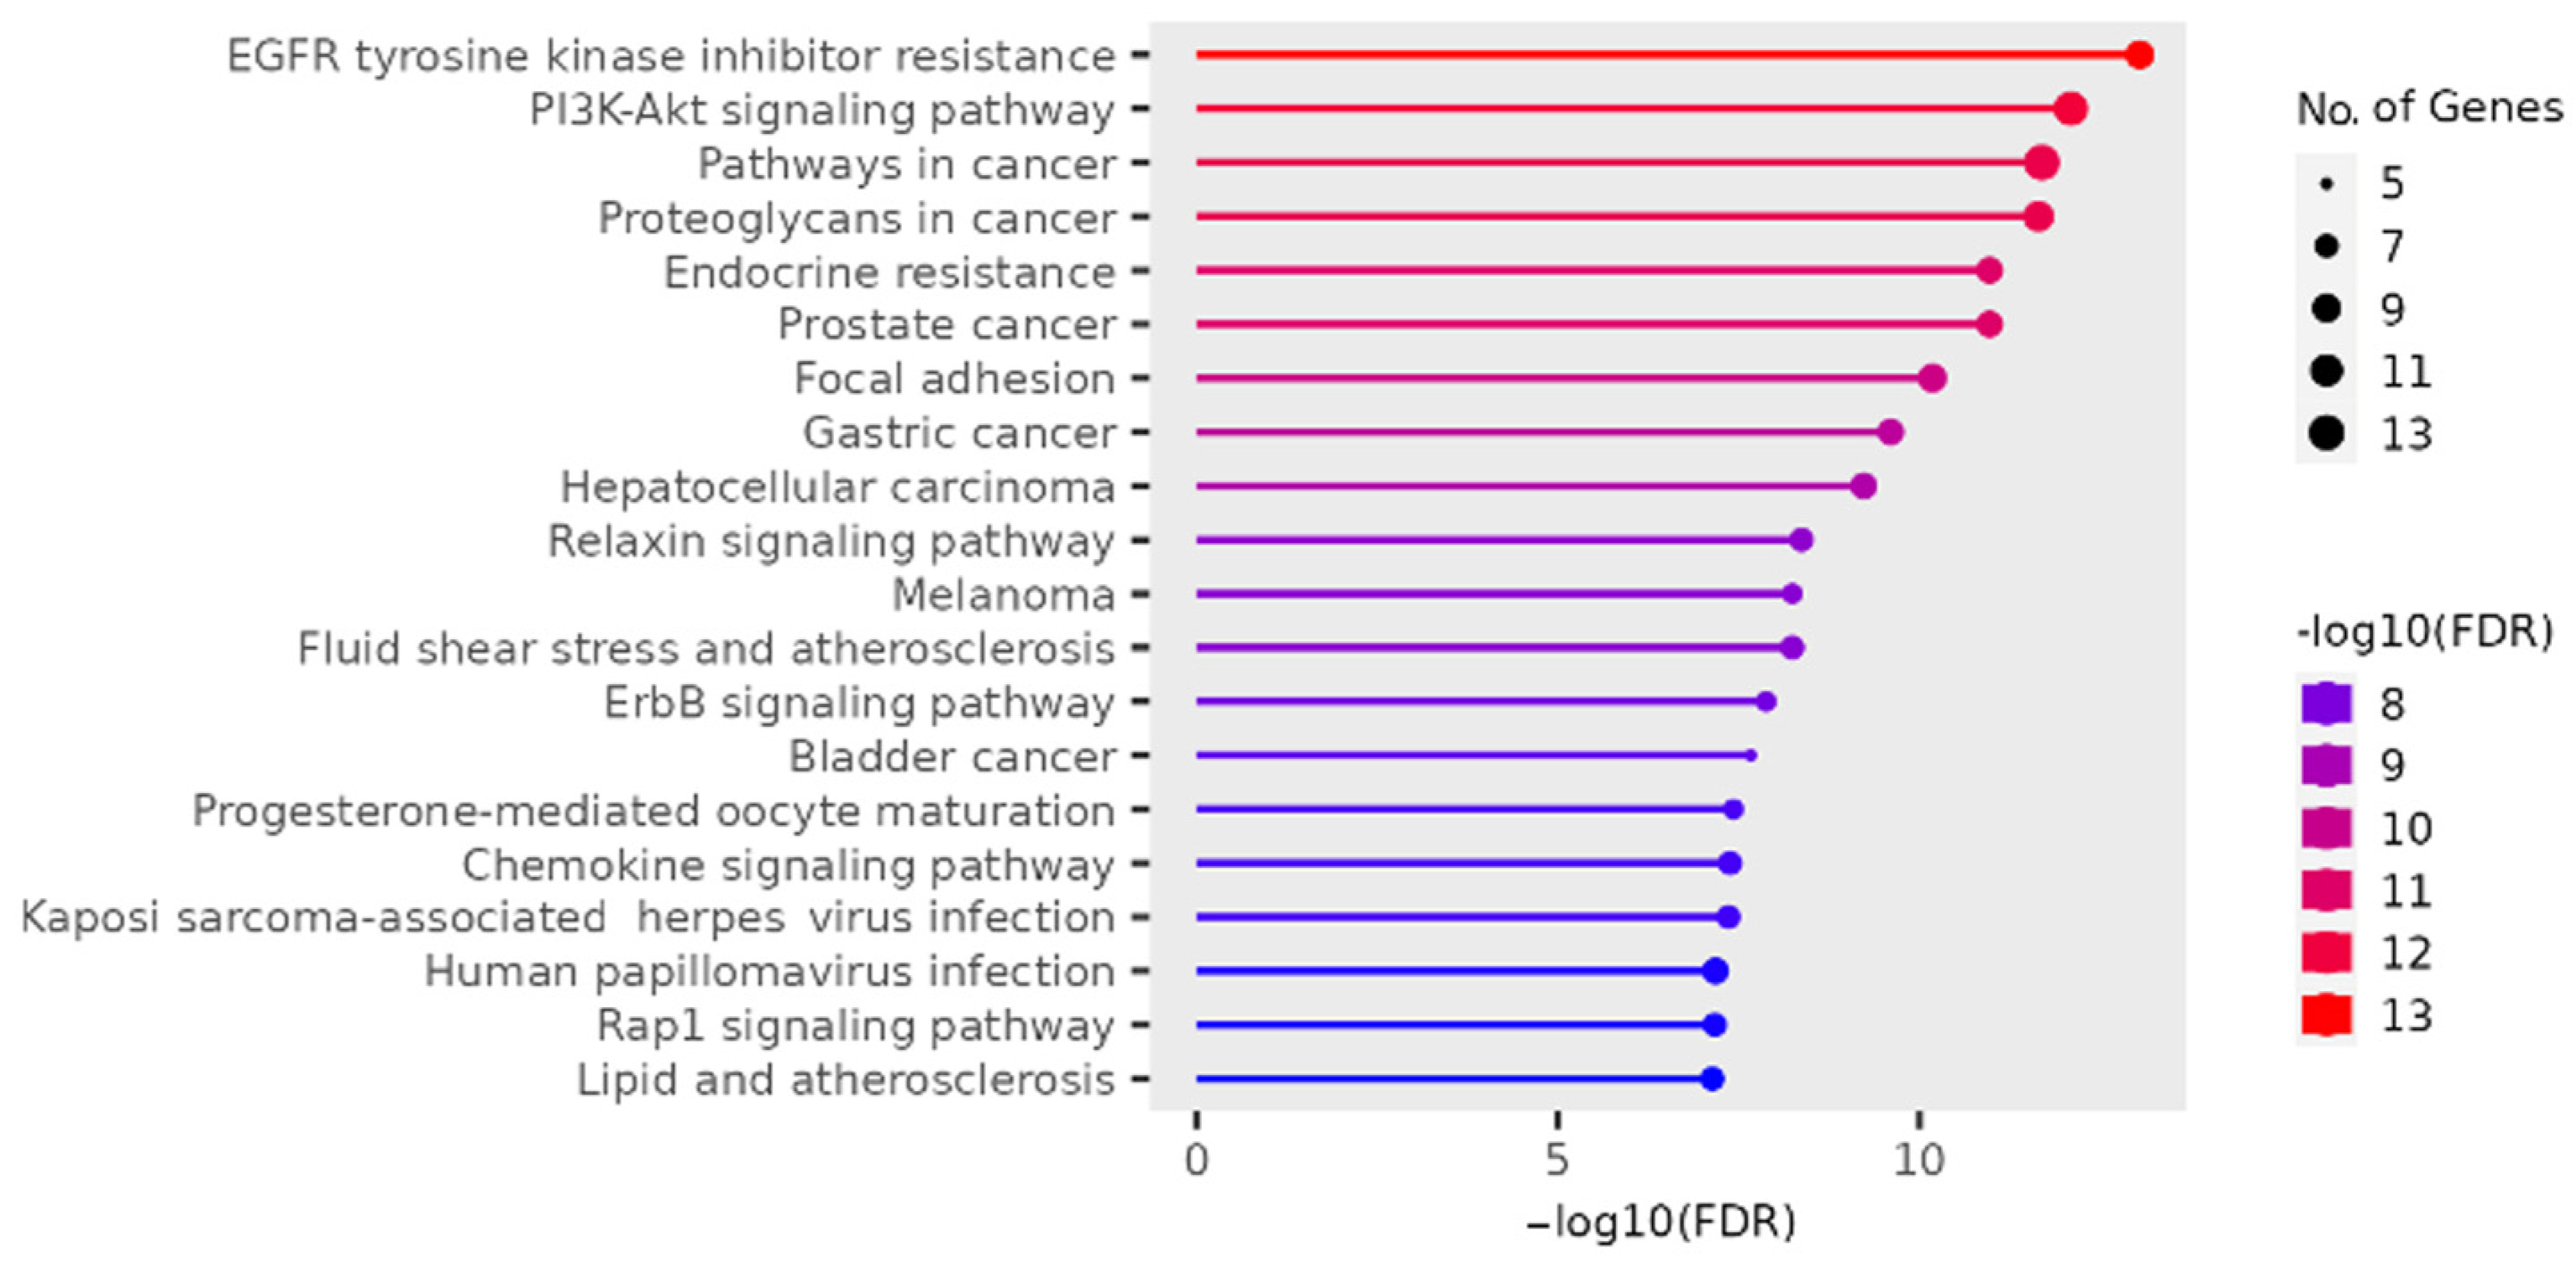
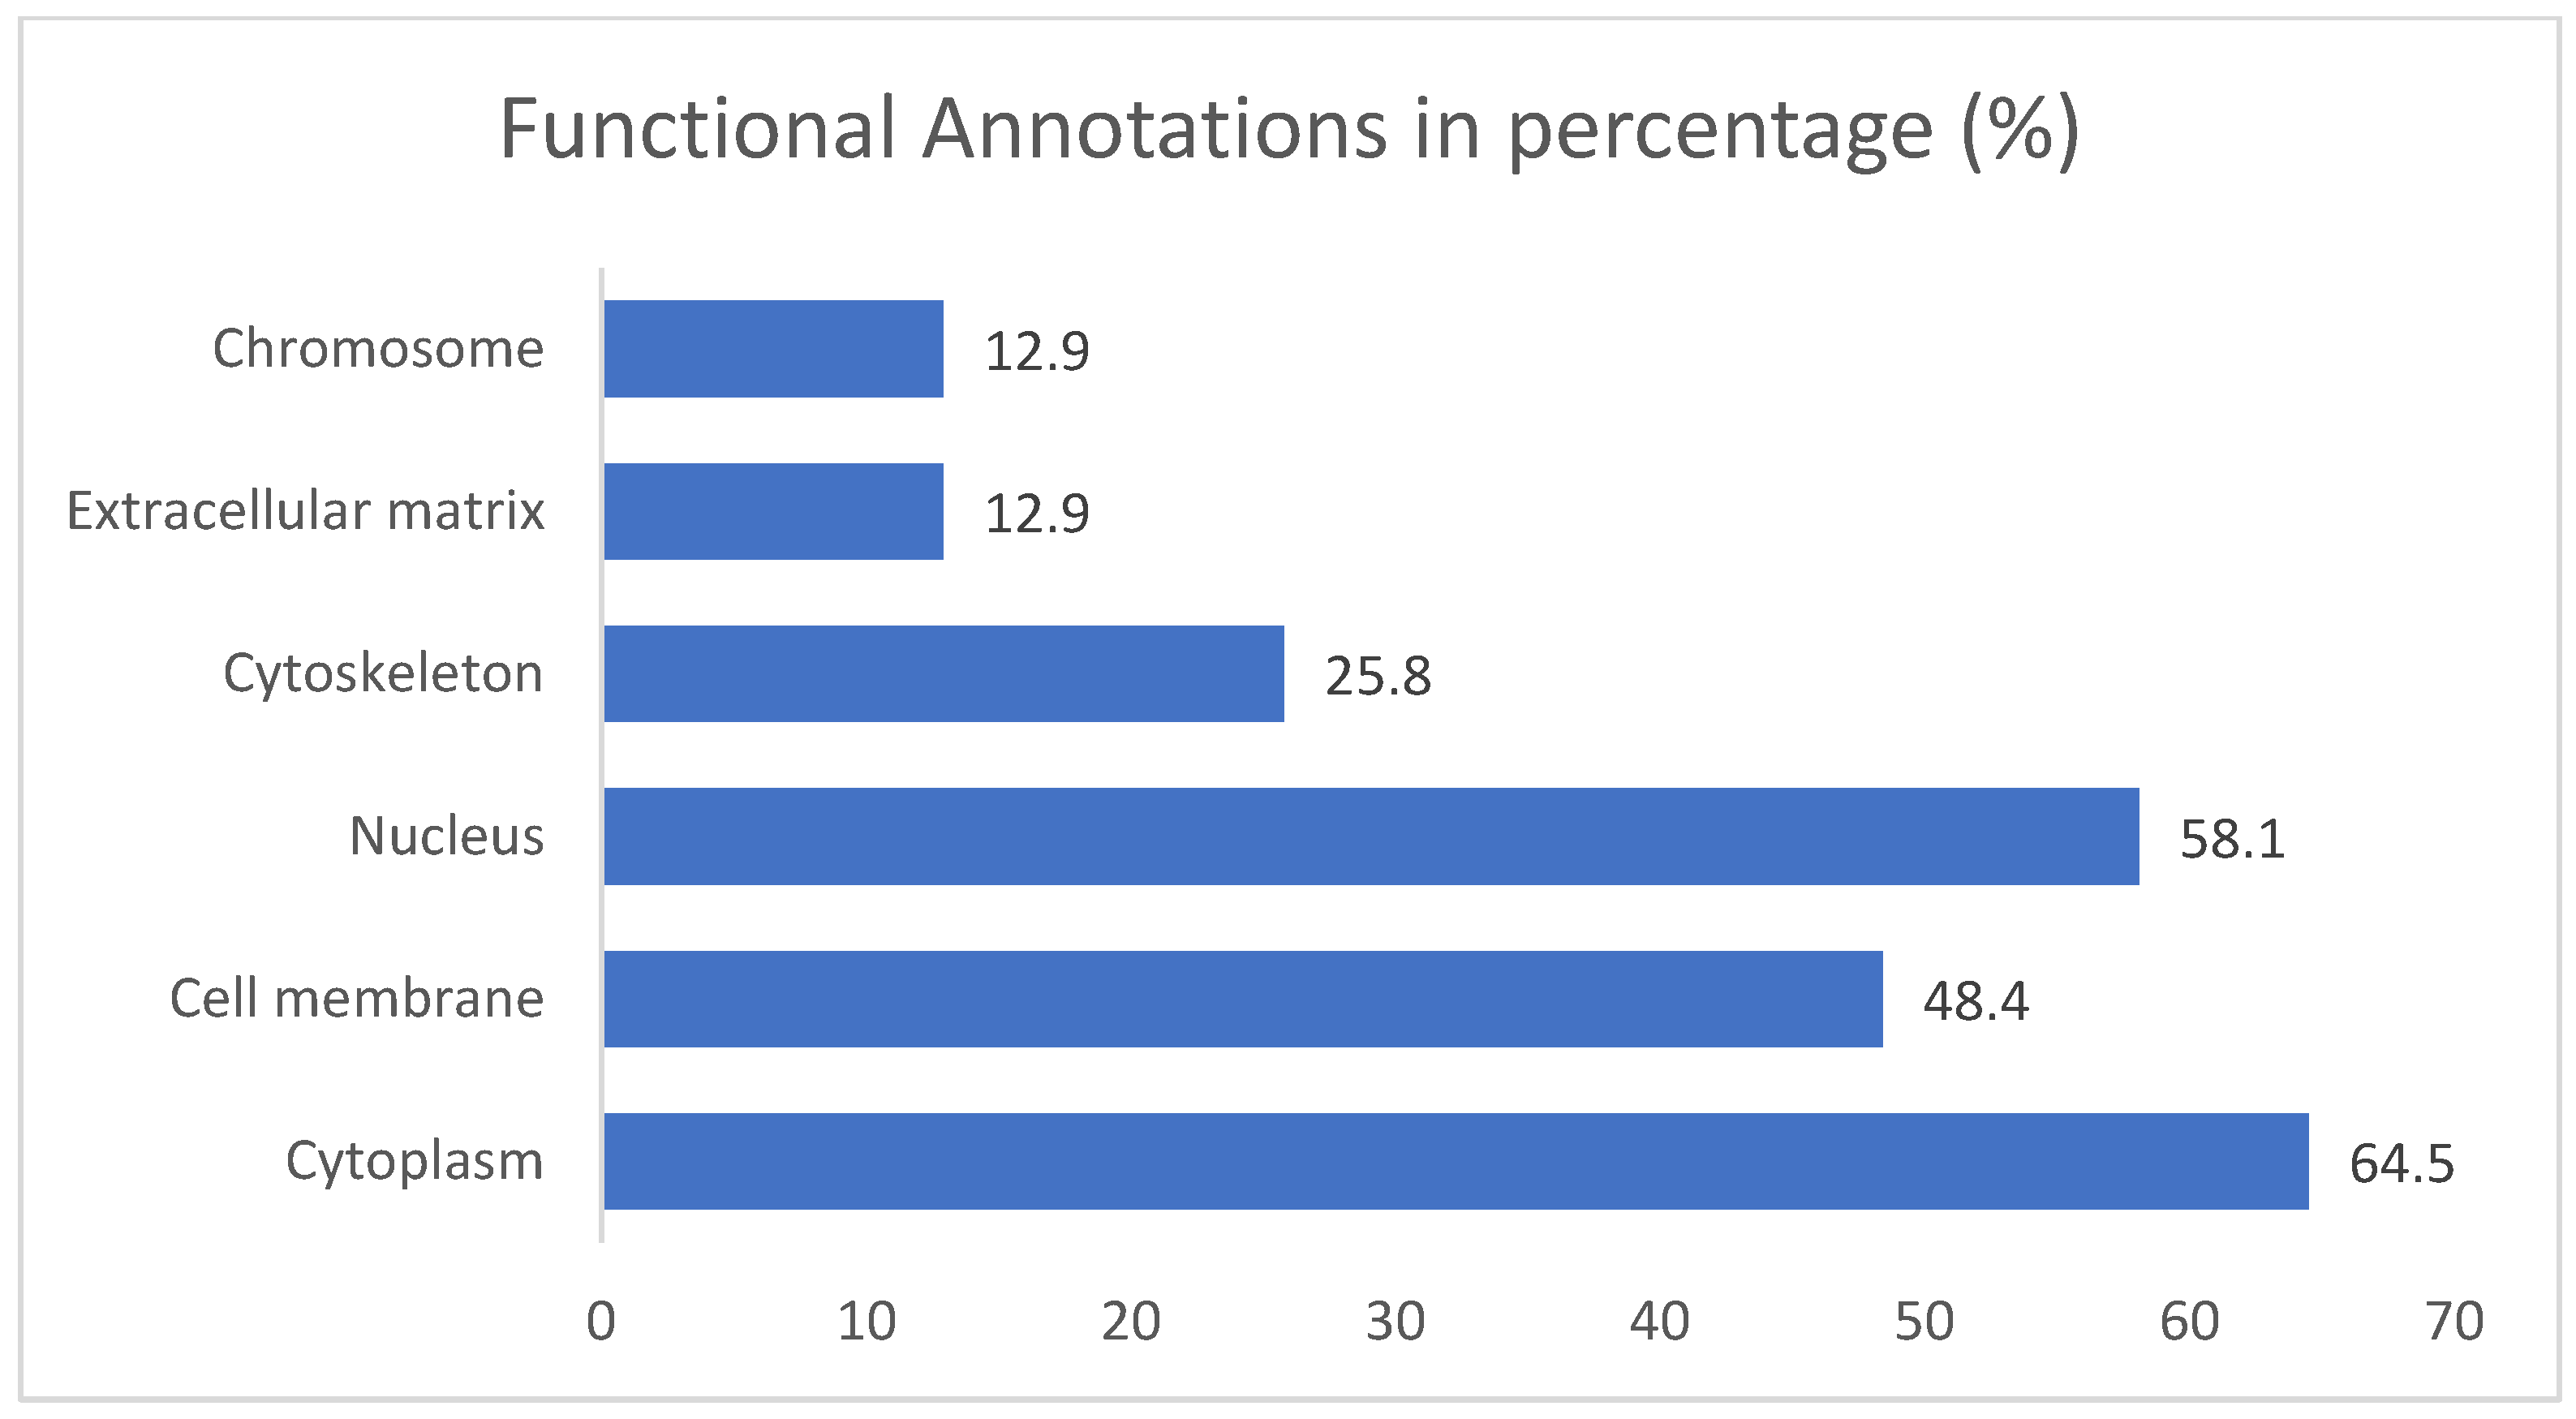
2.2. Gene Ontology Test (GO)
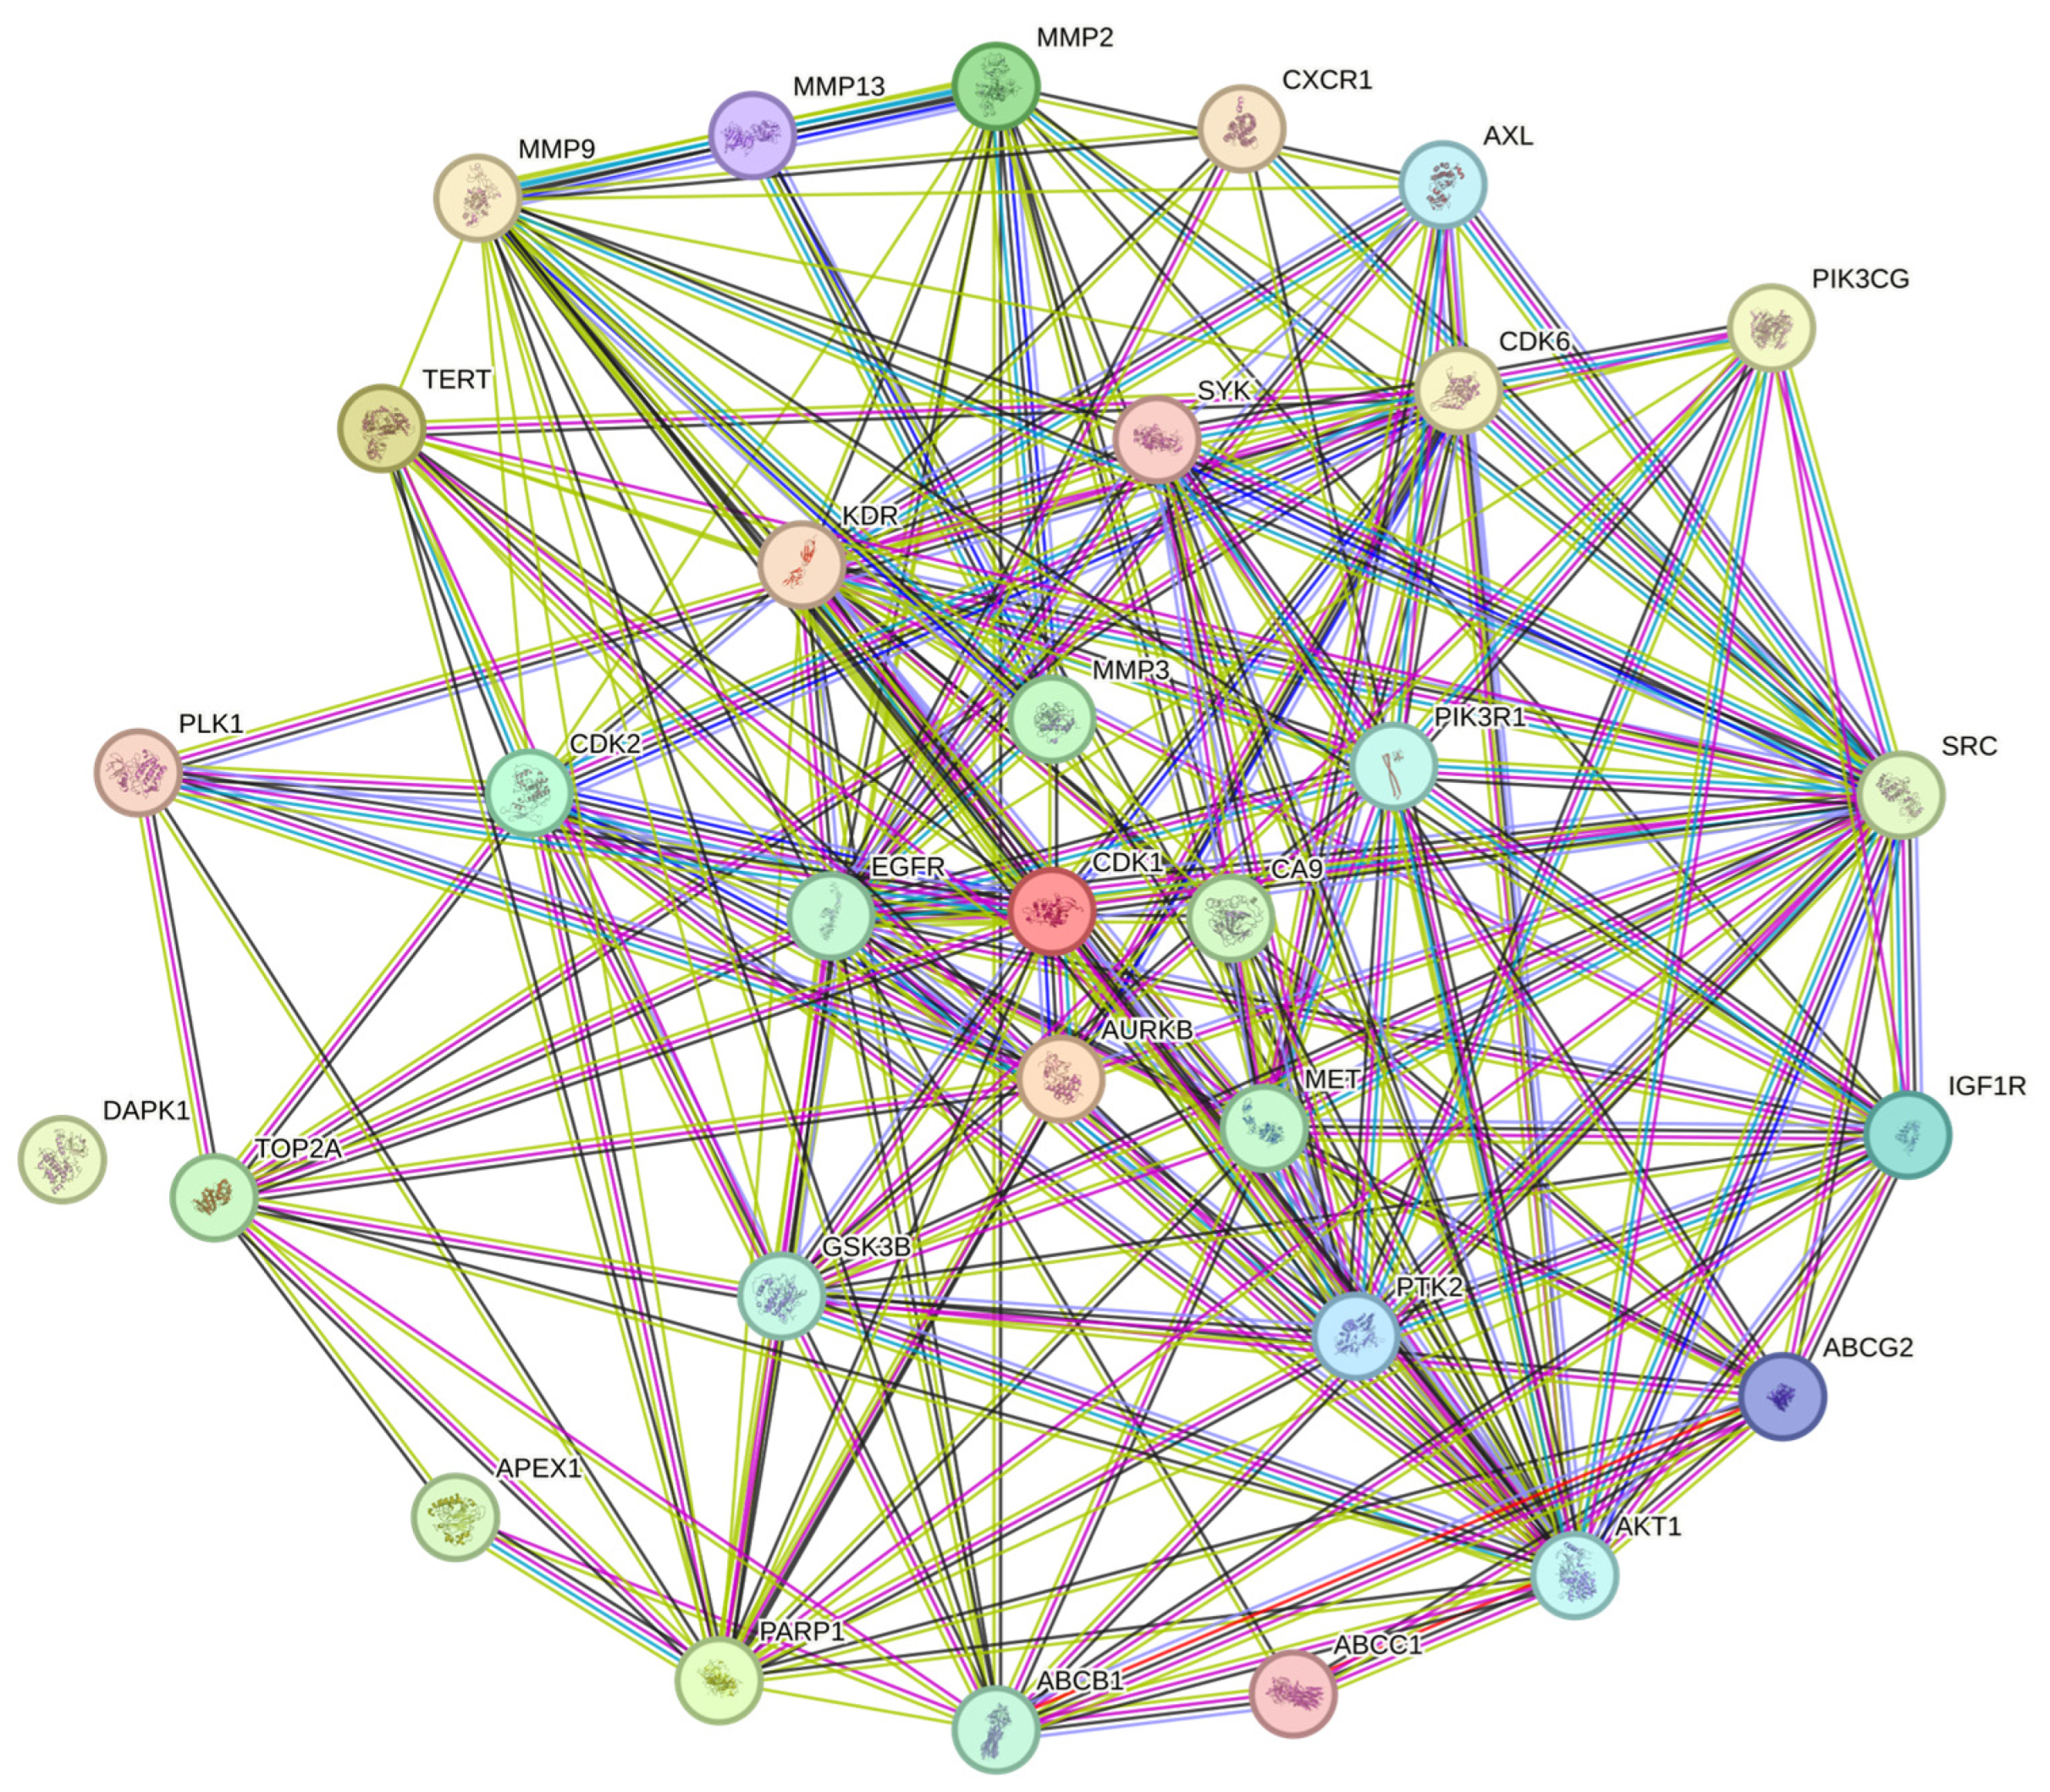
2.3. Protein-to-Protein Analysis
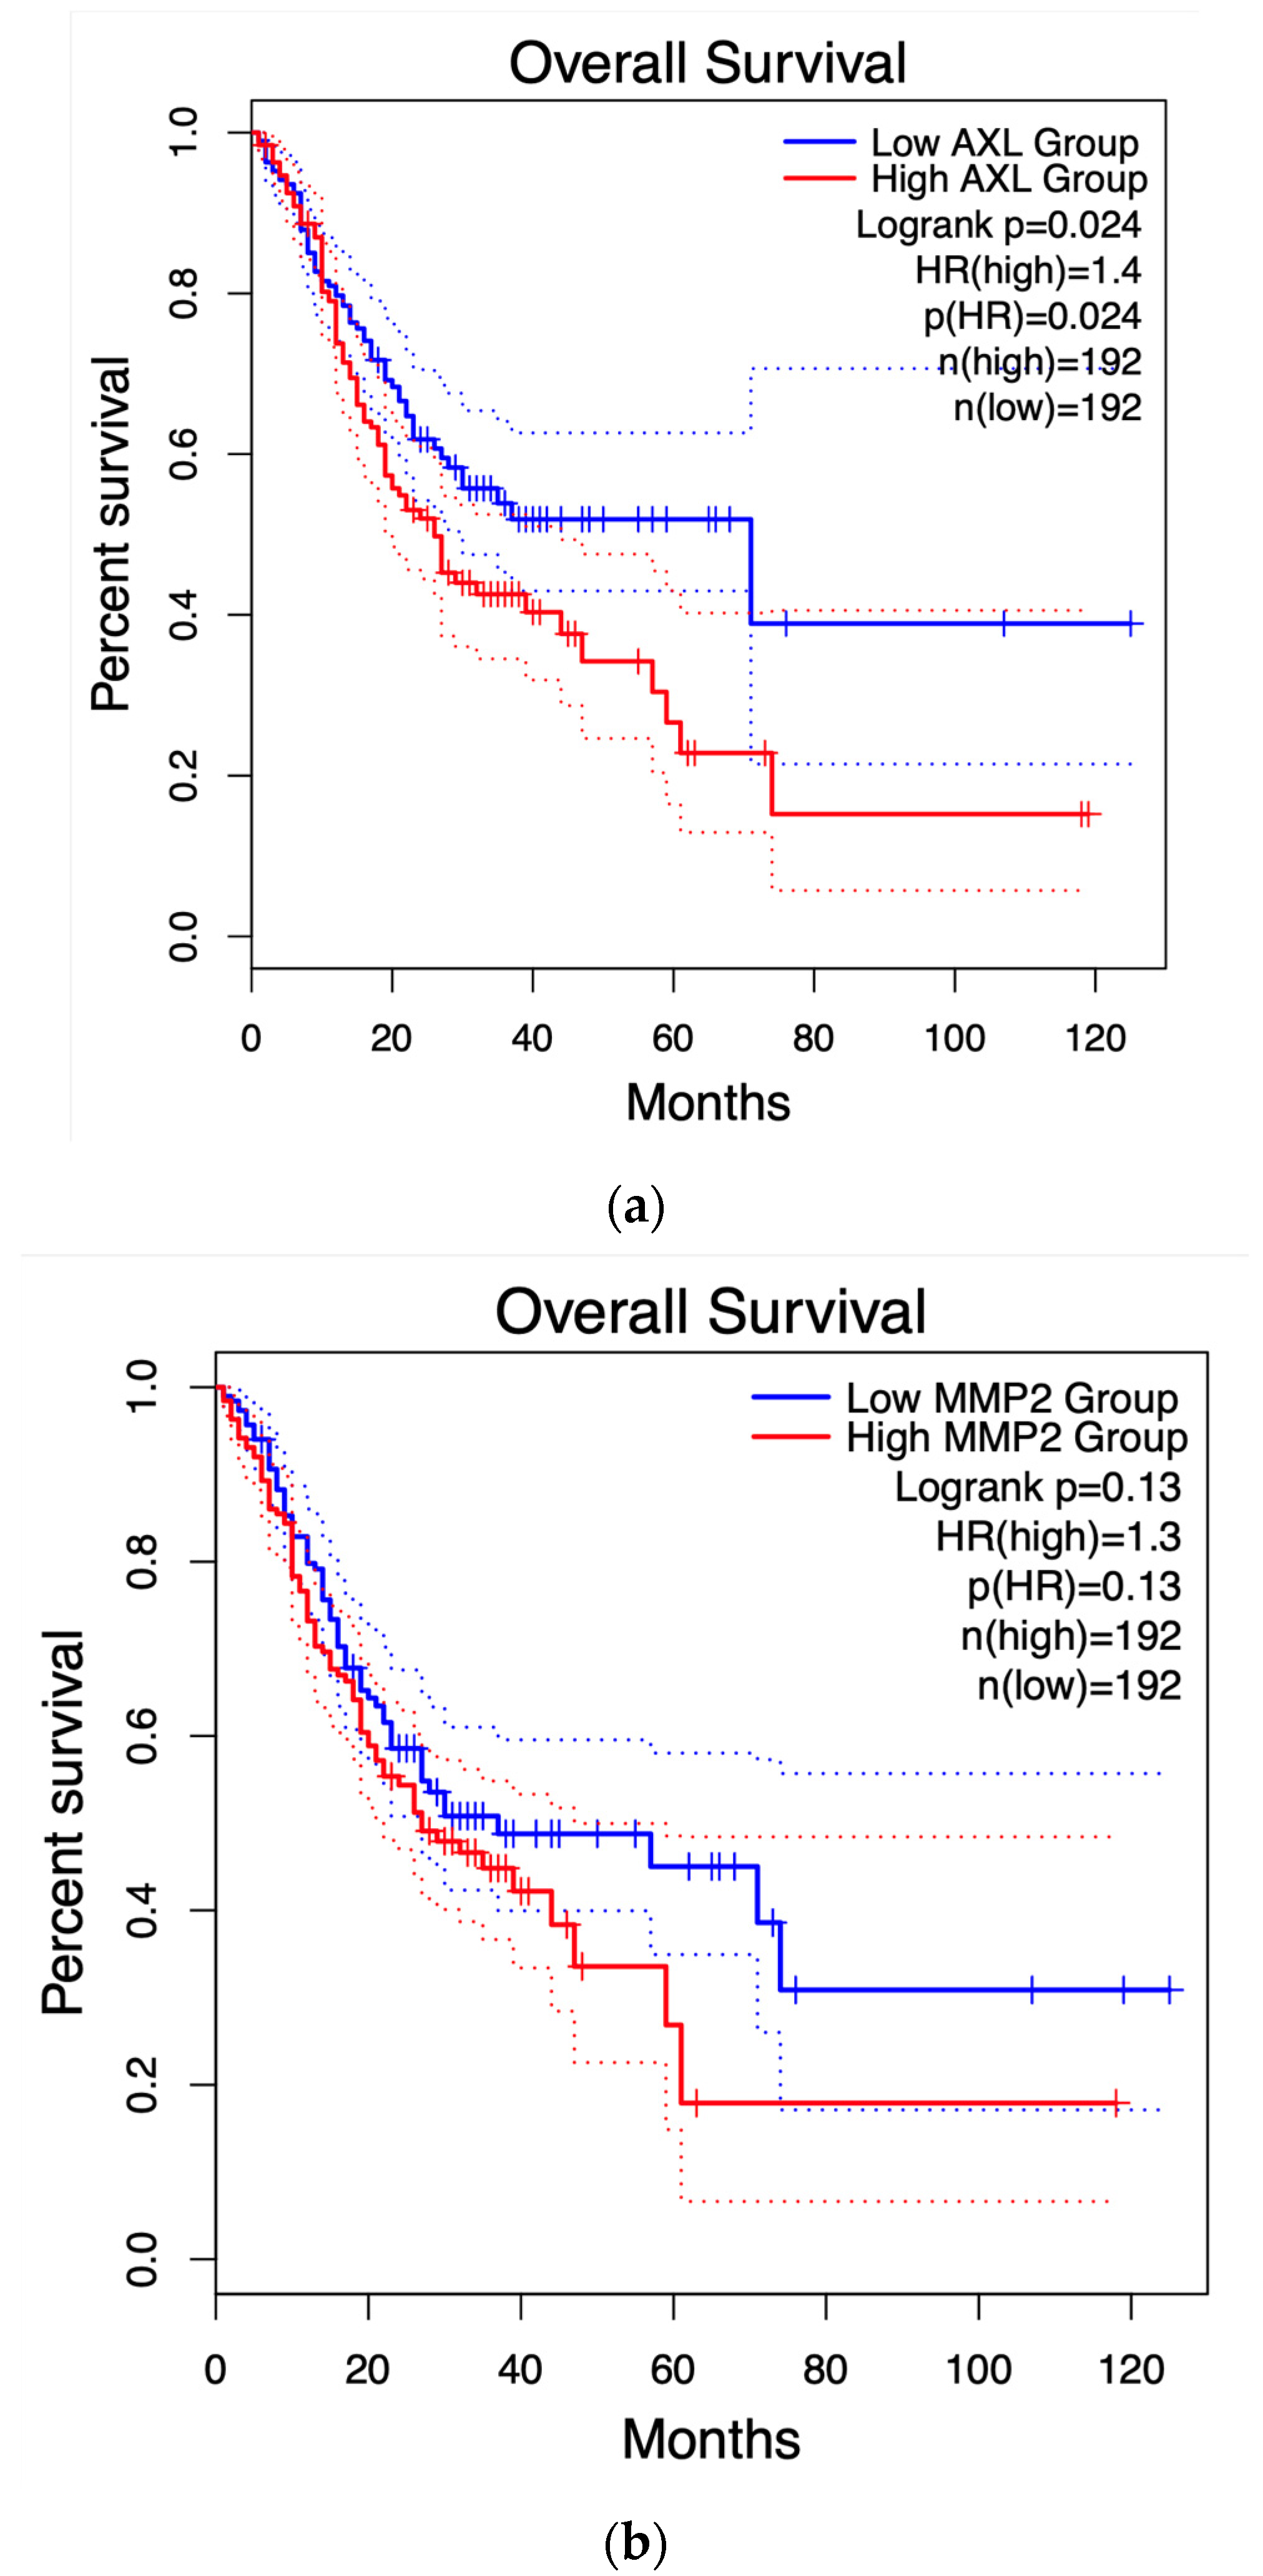
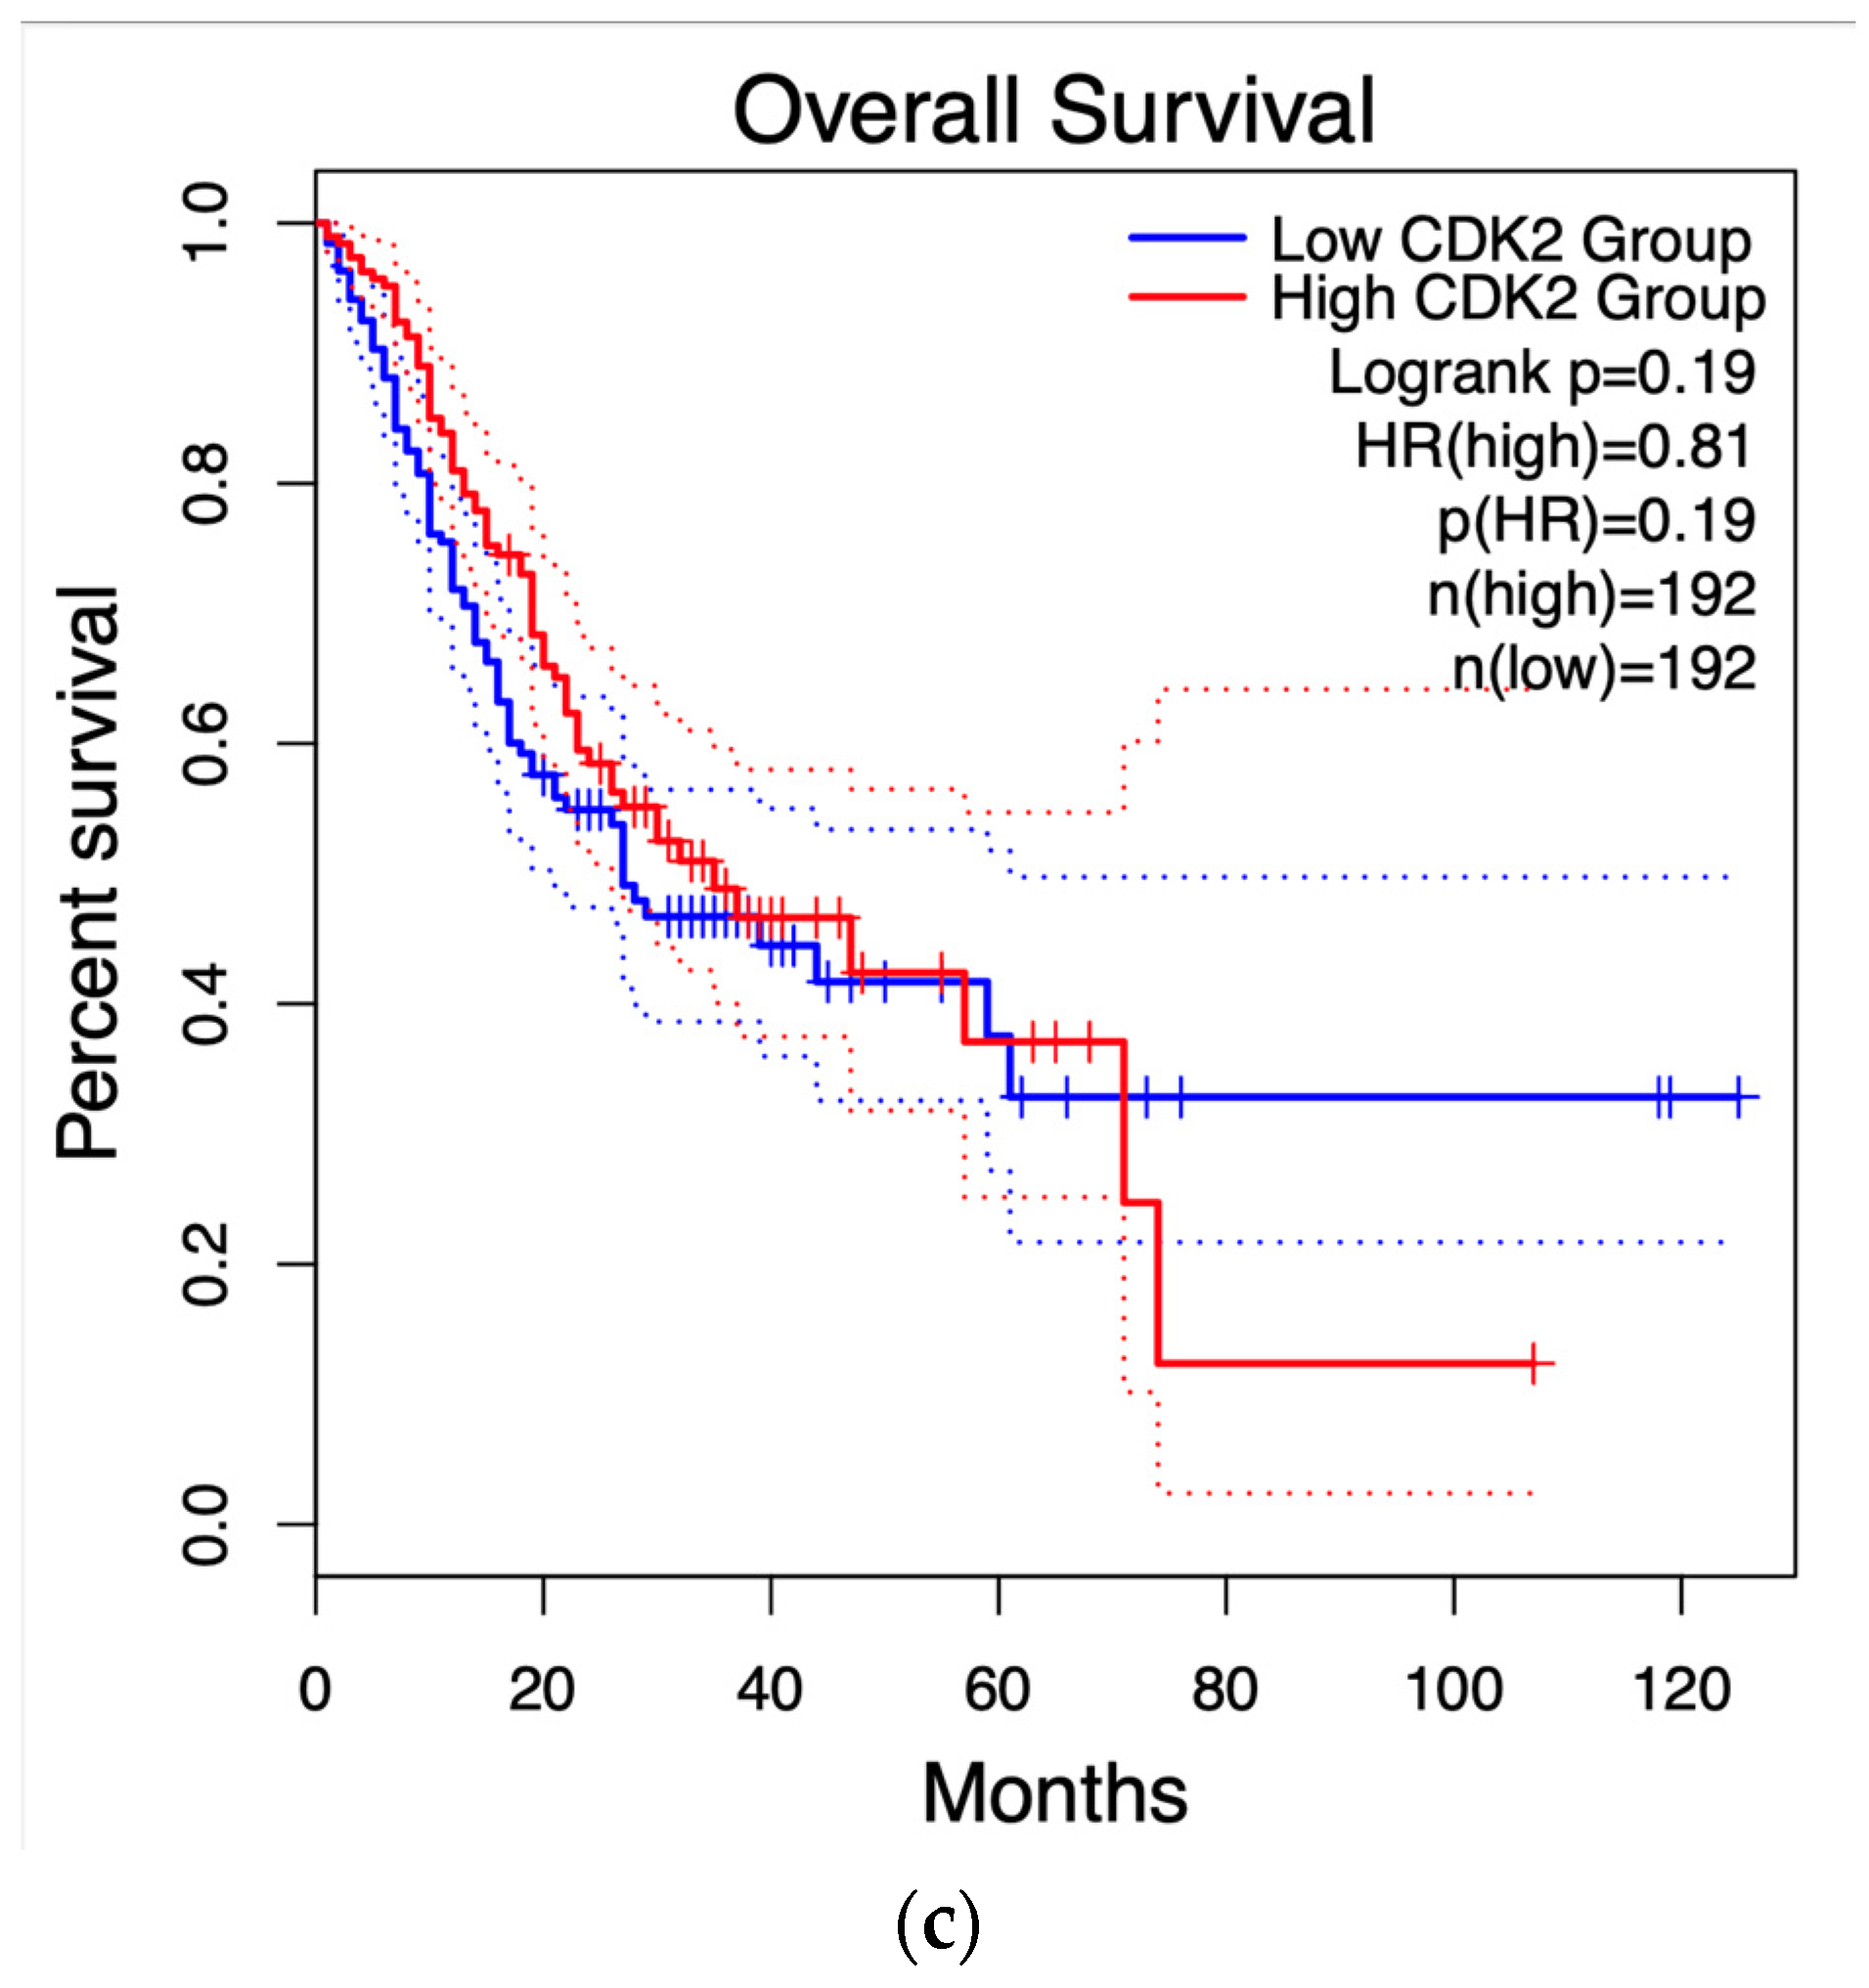
2.4. Survival Graphs
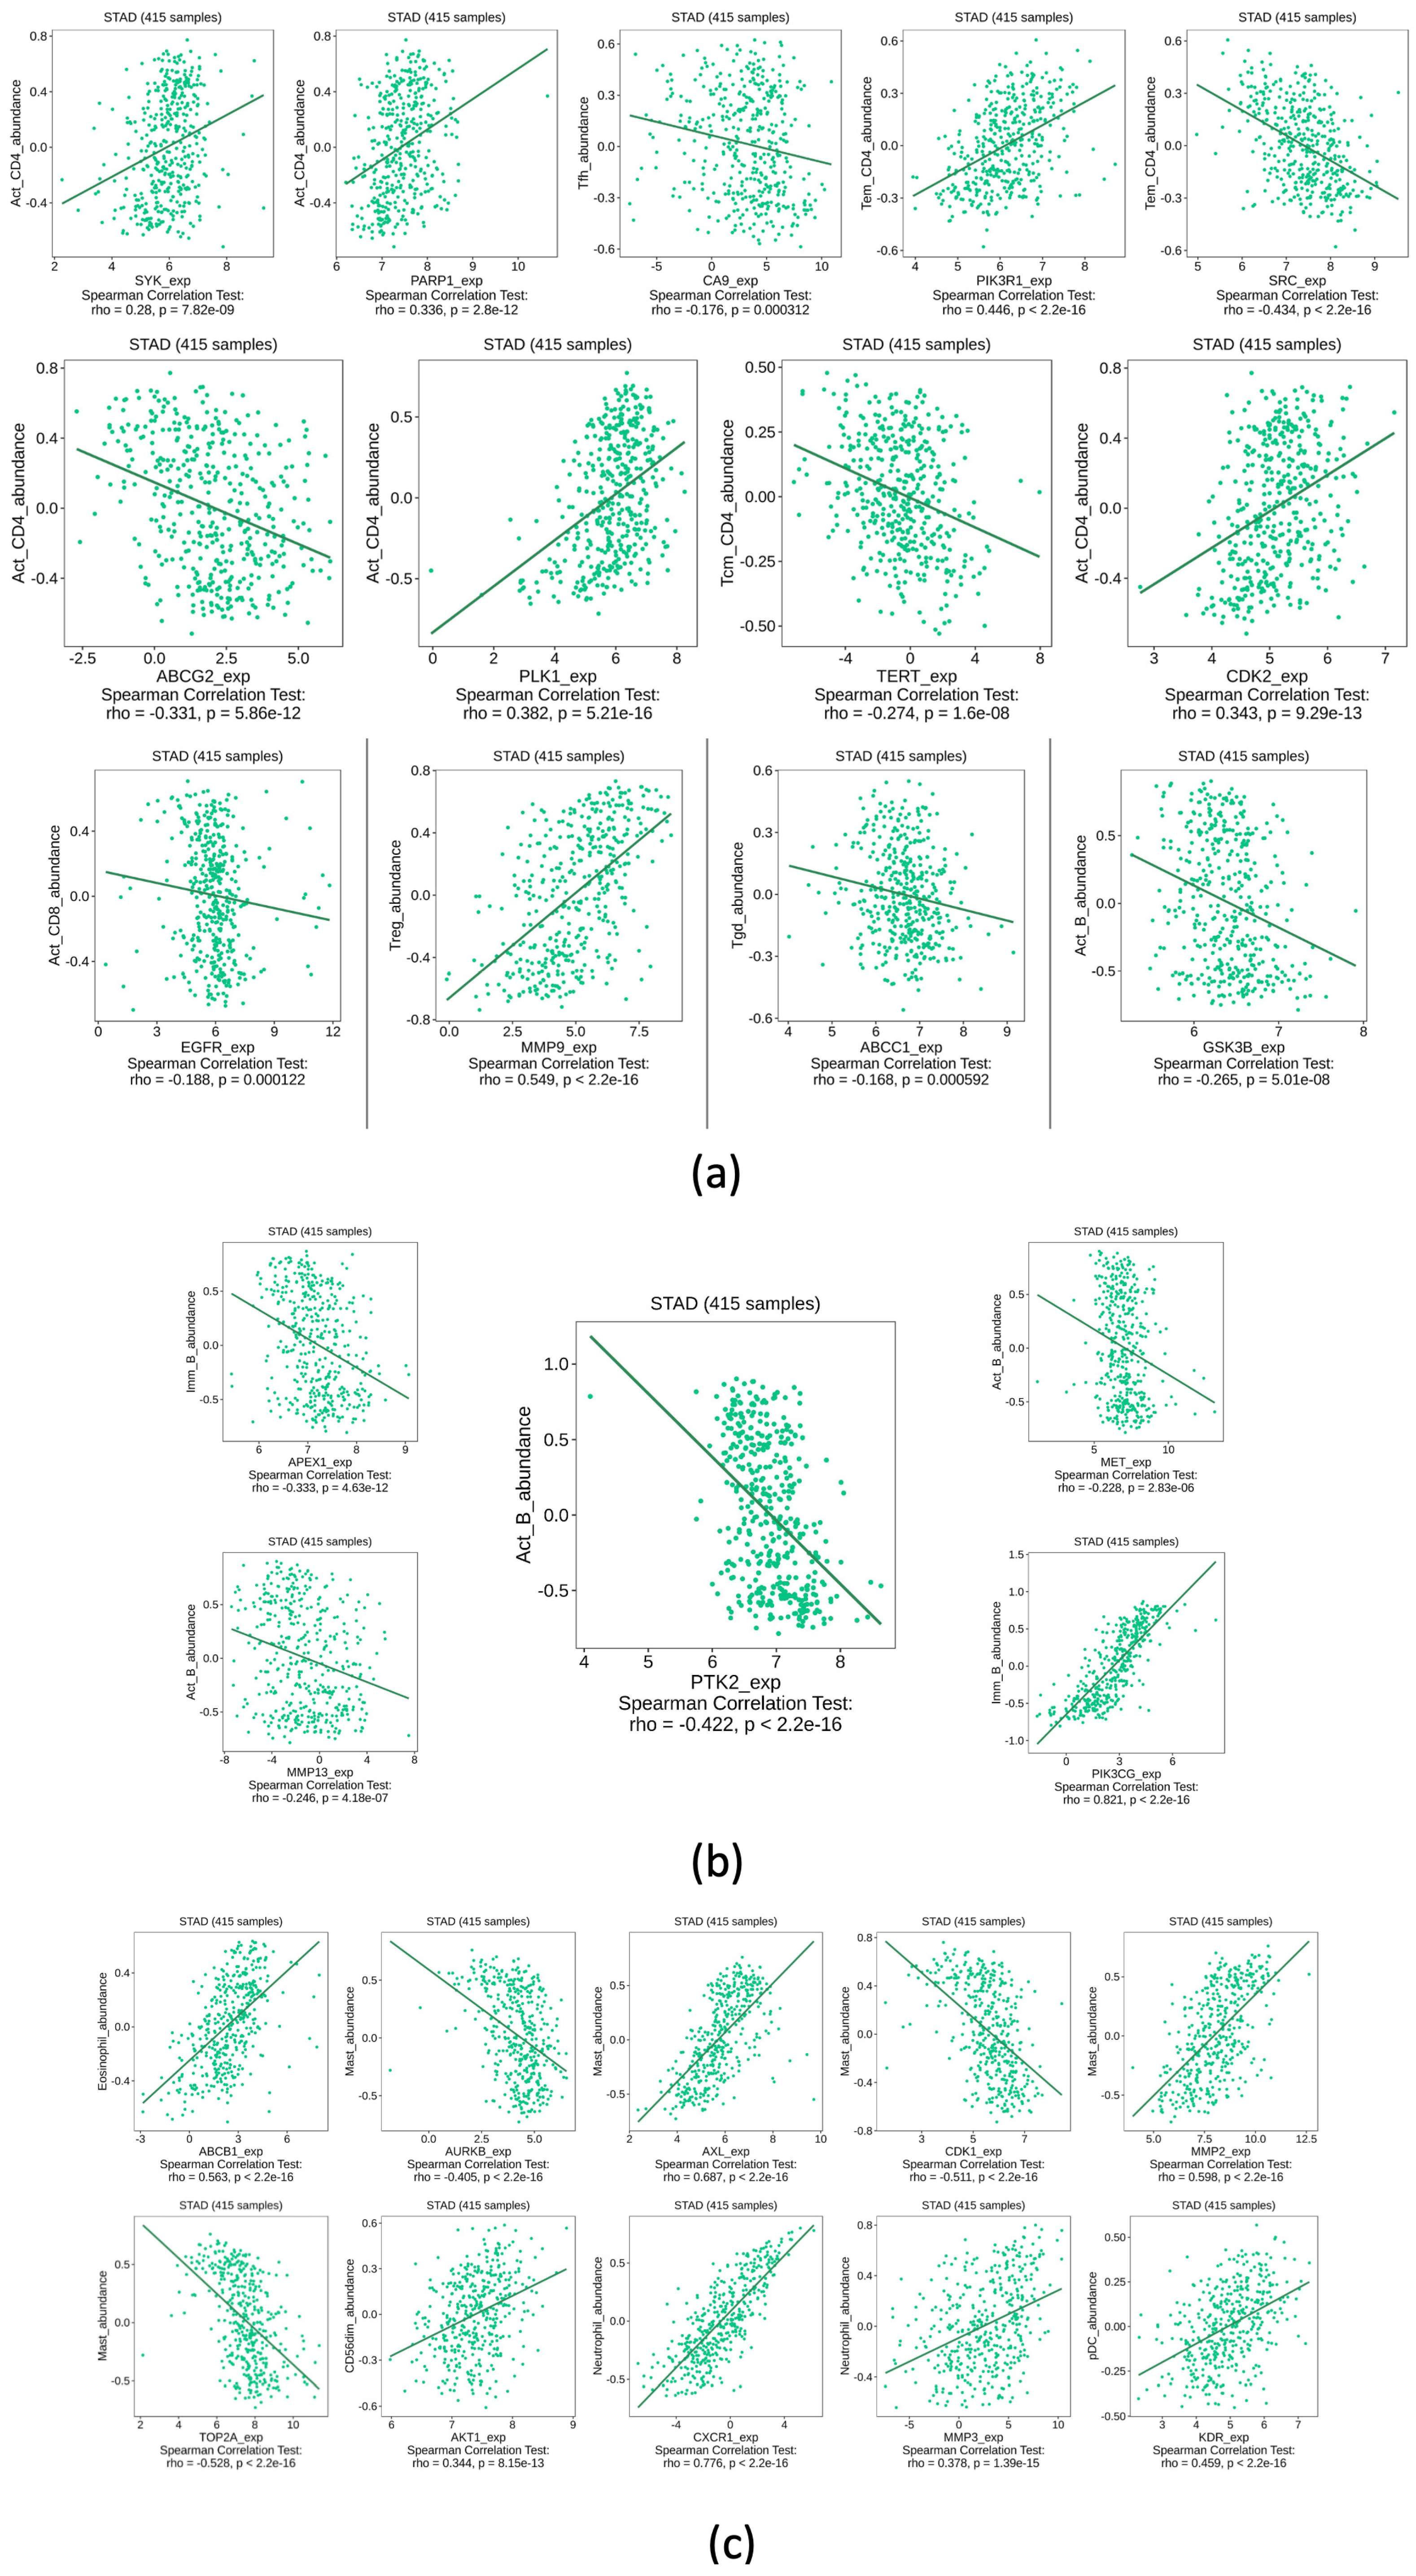
2.5. Immune System Infiltration
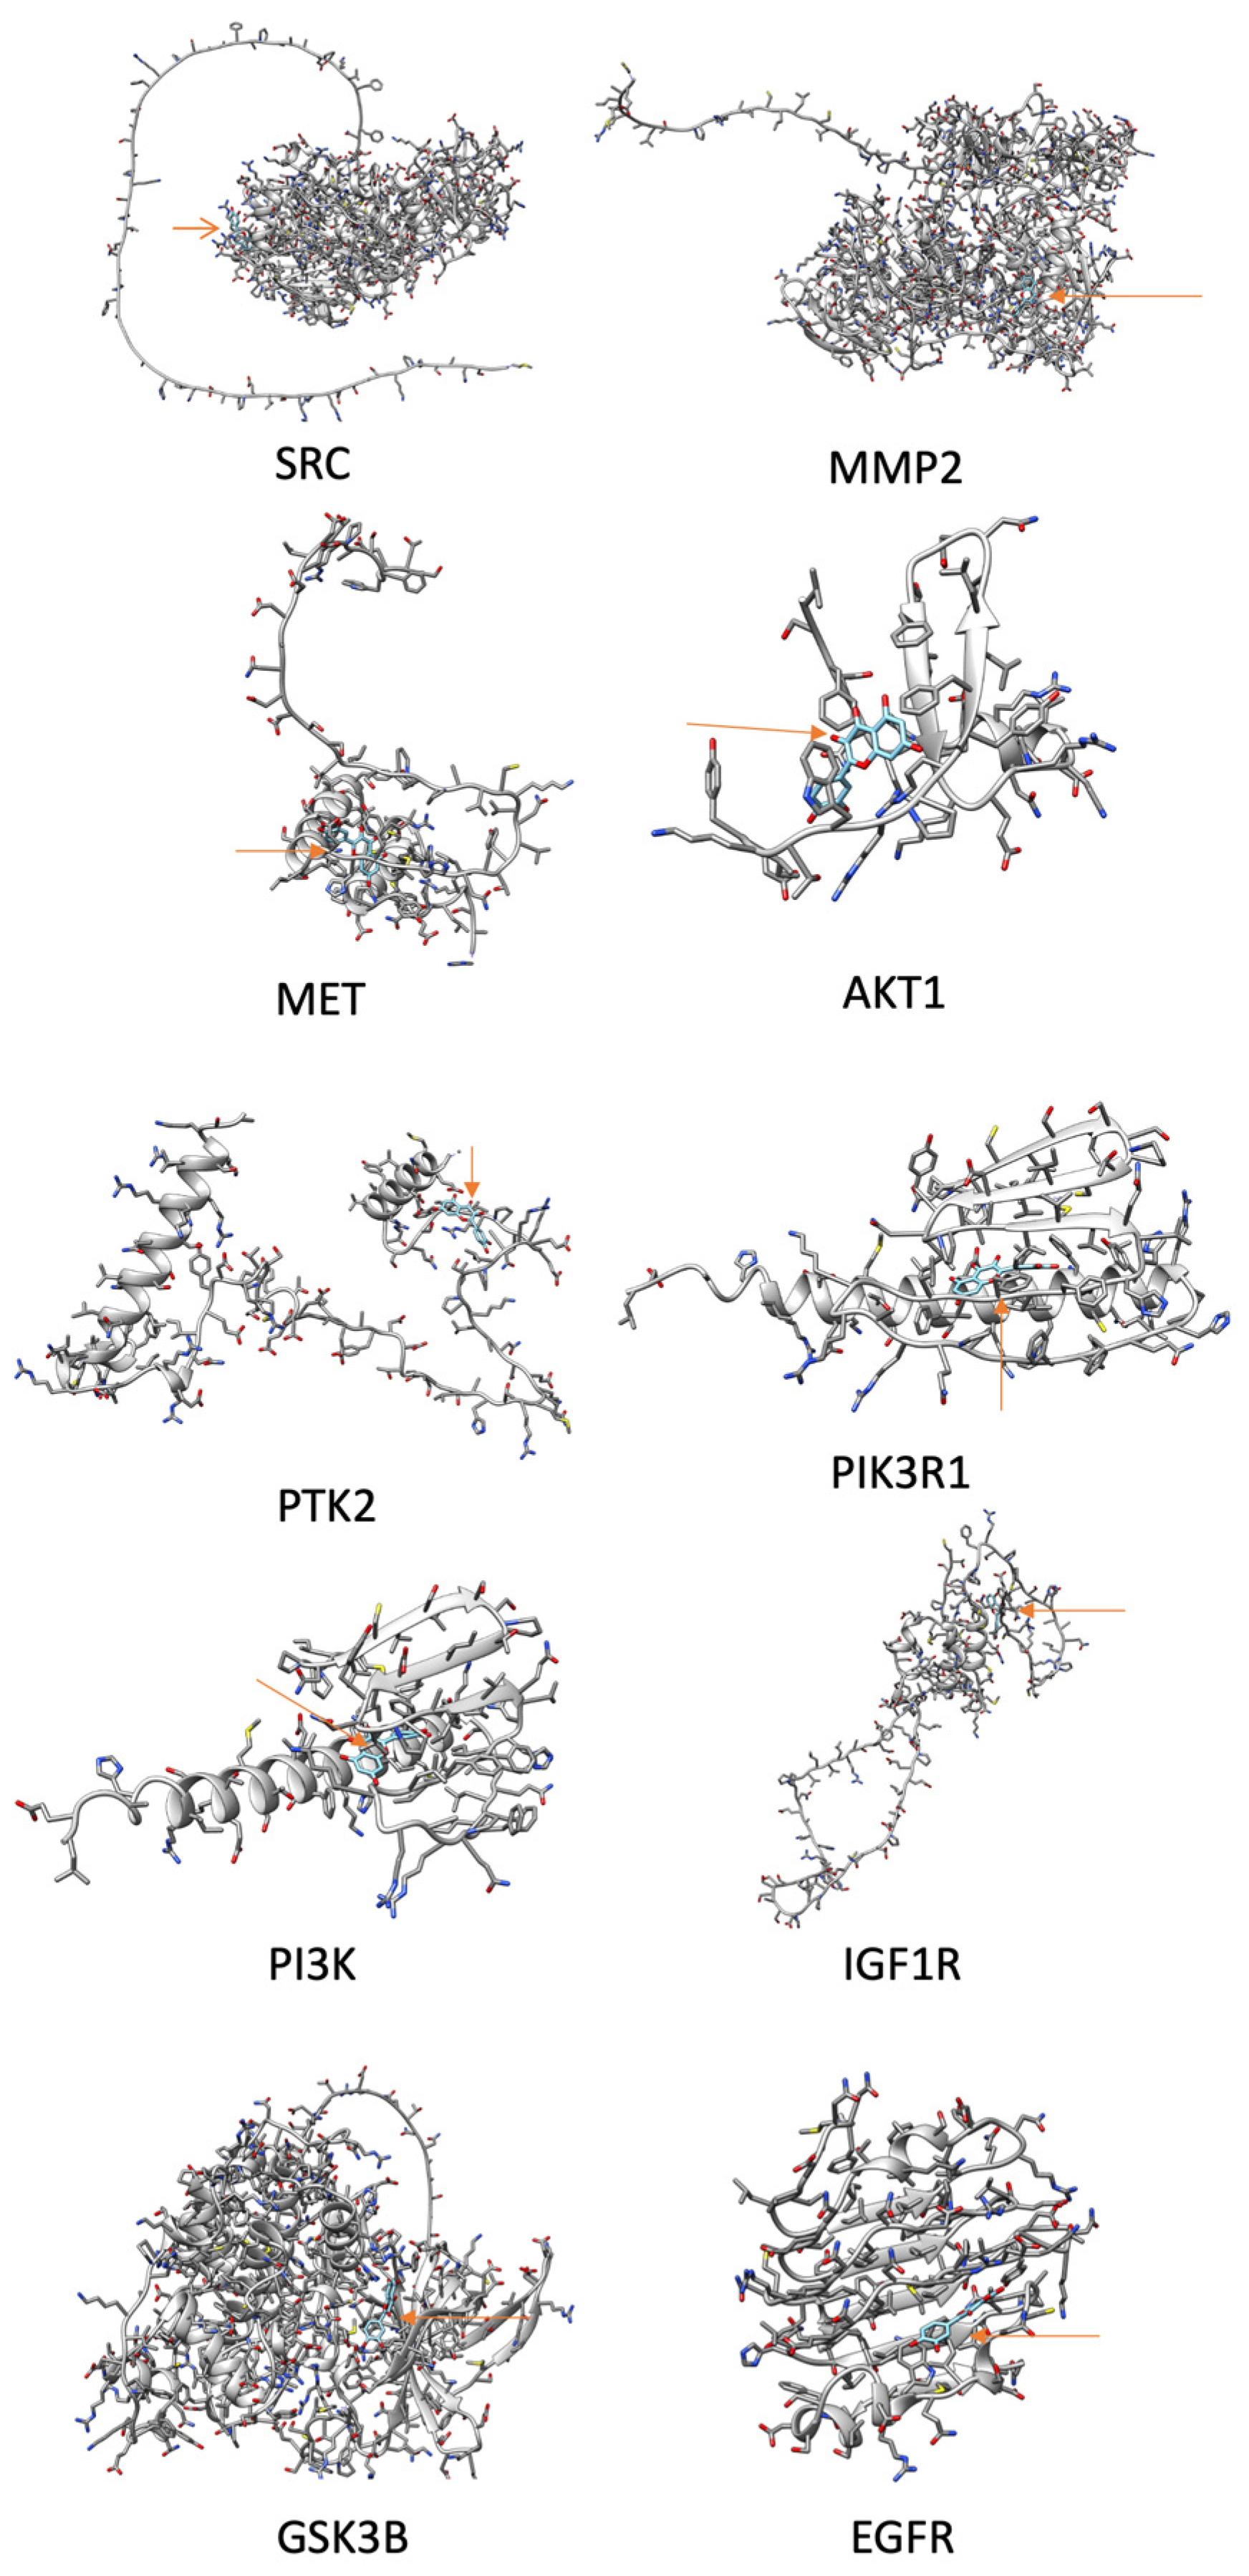
2.6. Docking Analysis
3. Discussion
4. Materials and Methods
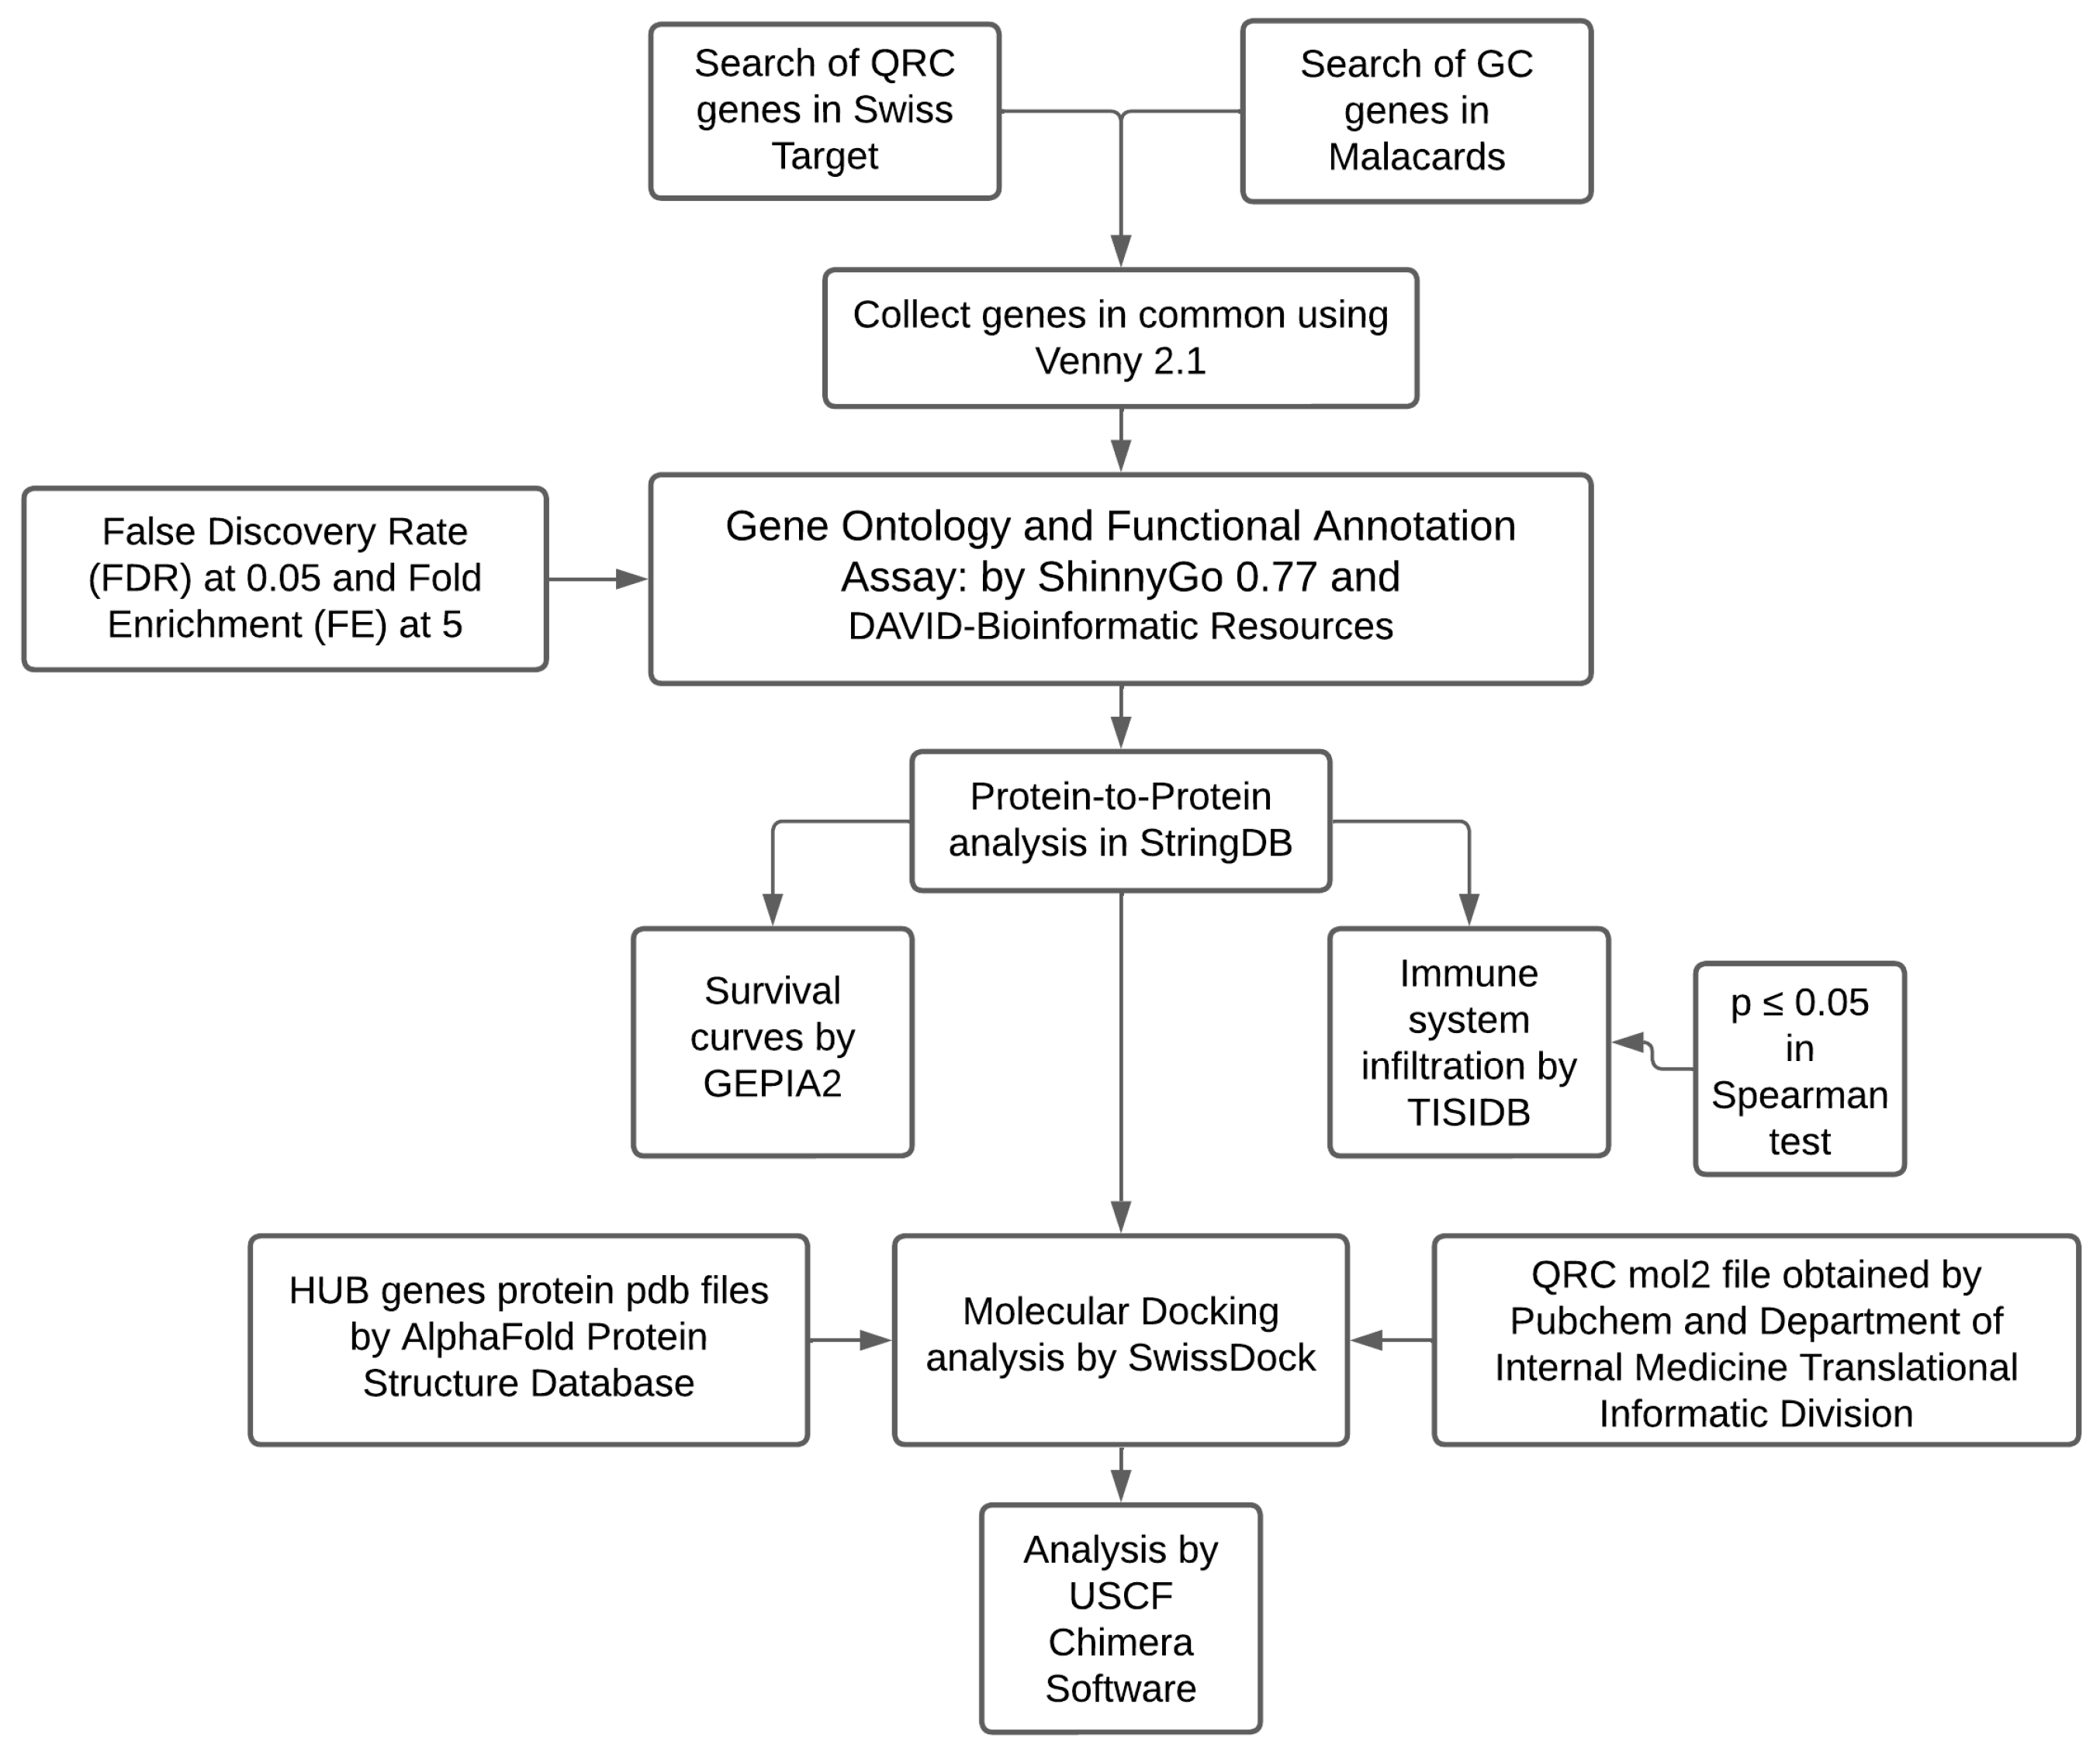
4.1. Bioinformatic Analysis
4.1.1. Gathering of Target Genes
QRC Target Genes
GC Target Genes
4.1.2. Common Genes Analysis
4.1.3. Gene Ontology and Functional Annotation Assay
4.1.4. Protein-to-Protein Analysis
4.1.5. Survival Curves and Immune System Infiltration
4.1.6. Molecular Docking Analysis
5. Conclusions
Author Contributions
Funding
Institutional Review Board Statement
Informed Consent Statement
Data Availability Statement
Conflicts of Interest
References
- Sitarz, R.; Skierucha, M.; Mielko, J.; Offerhaus, J.; Maciejewski, R.; Polkowski, W. Gastric cancer: Epidemiology, prevention, classification, and treatment. Cancer Manag. Res. 2018, 10, 239–248. [Google Scholar] [CrossRef]
- Mukkamalla, S.K.R.; Recio-Boiles, A.; Babiker, H.M. Gastric Cancer. 2024. Available online: https://www.ncbi.nlm.nih.gov/books/NBK459142/ (accessed on 18 March 2024).
- World Health Organization. Global Cancer Observatory. 2022. Available online: https://gco.iarc.fr/en (accessed on 18 March 2024).
- Wipperman, J.; Neil, T.; Williams, T. Cervical Cancer: Evaluation and Management. Am. Fam. Physician 2018, 97, 4449–4454. [Google Scholar]
- Herranz-López, M.; Olivares-Vicente, M.; Rodríguez Gallego, E.; Encinar, J.A.; Pérez-Sánchez, A.; Ruiz-Torres, V.; Joven, V.; Ruiz-Torres, J.; Roche, E.; Micol, V. Quercetin metabolites from Hibiscus sabdariffa contribute to alleviate glucolipotoxicity-induced metabolic stress in vitro. Food Chem. Toxicol. 2020, 144, 111606. [Google Scholar] [CrossRef]
- Azizi, E.; Fouladdel, S.; Komeili Movahhed, T.; Modaresi, F.; Barzegar, E.; Ghahremani, M.H.; Ostad, S.N.; Atashpour, S. Quercetin Effects on Cell Cycle Arrest and Apoptosis and Doxorubicin Activity in T47D Cancer Stem Cells. Asian Pac. J. Cancer Prev. 2022, 23, 4145–4154. [Google Scholar] [CrossRef]
- Chen, K.; Rekep, M.; Wei, W.; Wu, Q.; Xue, Q.; Li, S.; Tian, J.; Yi, Q.; Zhang, G.; Zhang, G.; et al. Quercetin Prevents In Vivo and In Vitro Myocardial Hypertrophy Through the Proteasome-GSK-3 Pathway. Cardiovasc. Drugs Ther. 2018, 32, 5–21. [Google Scholar] [CrossRef]
- Dhanya, R.; Arun, K.B.; Syama, H.P.; Nisha, P.; Sundaresan, A.; Santhosh Kumar, T.R.; Jayamurthy , P. Rutin and quercetin enhance glucose uptake in L6 myotubes under oxidative stress induced by tertiary butyl hydrogen peroxide. Food Chem. 2014, 158, 546–554. [Google Scholar] [CrossRef]
- Chen, W.J.; Tsai, J.H.; Hsu, L.S.; Lin, C.L.; Hong, H.M.; Pan, M.H. Quercetin blocks the aggressive phenotype of triple-negative breast cancer by inhibiting igf1/ igf1r-mediated emt program. J. Food Drug Anal. 2021, 29, 98–112. [Google Scholar] [CrossRef]
- Henning, S.M.; Wang, P.; Lee, R.P.; Trang, A.; Husari, G.; Yang, J.; Grojean, E.M.; Ly, A.; Hsu, M.; Heber, D.; et al. Prospective randomized trial evaluating blood and prostate tissue concentrations of green tea polyphenols and quercetin in men with prostate cancer. Food Funct. 2020, 11, 4114–4122. [Google Scholar] [CrossRef]
- Costa, L.G.; Garrick, J.M.; Roquè, P.J.; Pellacani, C. Mechanisms of Neuroprotection by Quercetin: Counteracting Oxidative Stress and More. Oxid Med Cell Longev [Internet]. 2016. Available online: https://pubmed.ncbi.nlm.nih.gov/26904161/ (accessed on 19 May 2022).
- Srivastava, S.; Somasagara, R.R.; Hegde, M.; Nishana, M.; Tadi, S.K.; Srivastava, M.; Choudhary, B.; Raghavan, S.C. Quercetin, a Natural Flavonoid Interacts with DNA, Arrests Cell Cycle and Causes Tumor Regression by Activating Mitochondrial Pathway of Apoptosis. Sci. Rep. 2016, 6, 24049. [Google Scholar] [CrossRef]
- Zúñiga-Hernández, S.R.; García-Iglesias, T.; Macías-Carballo, M.; Pérez-Larios, A.; Gutiérrez-Mercado, Y.K.; Camargo-Hernández, G.; Rodríguez-Razon, C.M. Targets and Effects of Common Biocompounds of Hibiscus sabdariffa (Delphinidin-3-Sambubiosid, Quercetin, and Hibiscus Acid) in Different Pathways of Human Cells According to a Bioinformatic Assay. Nutrients 2024, 16, 566. [Google Scholar] [CrossRef]
- Rappaport, N.; Nativ, N.; Stelzer, G.; Twik, M.; Guan-Golan, Y.; Iny Stein, T.; Bahir, I.; Belinky, F.; Morrey, C.P.; Safran, M. MalaCards: An integrated compendium for diseases and their annotation. Database 2013, 2013, 018. [Google Scholar]
- Huang, A.Y.; Xiong, Z.; Liu, K.; Chang, Y.; Shu, L.; Gao, G.; Zhang, C. Identification of kaempferol as an OSX upregulator by network pharmacology-based analysis of qianggu Capsule for osteoporosis. Front. Pharmacol. 2022, 13, 1011561. [Google Scholar] [CrossRef]
- Kolobkov, D.S.; Sviridova, D.A.; Abilev, S.K.; Kuzovlev, A.N.; Salnikova, L.E. Genes and Diseases: Insights from Transcriptomics Studies. Genes 2022, 13, 1168. [Google Scholar] [CrossRef] [PubMed]
- Daina, A.; Michielin, O.; Zoete, V. Swiss Target Prediction: Updated data and new features for efficient prediction of protein targets of small molecules. Nucleic Acids Res. 2019, 47, W357–W364. [Google Scholar] [CrossRef]
- Yan, L.; Zhang, Z.; Liu, Y.; Ren, S.; Zhu, Z.; Wei, L.; Feng, J.; Duan, T.; Sun, X.; Xie, T.; et al. Anticancer Activity of Erianin: Cancer-Specific Target Prediction Based on Network Pharmacology. Front. Mol. Biosci. 2022, 9, 862932. [Google Scholar] [CrossRef]
- Reya, T.; Morrison, S.J.; Clarke, M.F.; Weissman, I.L. Stem cells, cancer, and cancer stem cells. Nature 2001, 414, 105–111. [Google Scholar] [CrossRef]
- Harrison, P.T.; Vyse, S.; Huang, P.H. Rare epidermal growth factor receptor (EGFR) mutations in non-small cell lung cancer. Semin. Cancer Biol. 2020, 61, 167–179. [Google Scholar] [CrossRef]
- Levantini, E.; Maroni, G.; Del Re, M.; Tenen, D.G. EGFR signaling pathway as therapeutic target in human cancers. Semin Cancer Biol. 2022, 85, 253–275. [Google Scholar] [CrossRef]
- Lin, X.; Zhuang, S.; Chen, X.; Du, J.; Zhong, L.; Wang, L.; Yi, J.; Hu, G.; Tang, G.; Ding, J.; et al. lncRNA ITGB8-AS1 functions as a ceRNA to promote colorectal cancer growth and migration through integrin-mediated focal adhesion signaling. Mol. Ther. 2022, 30, 688–702. [Google Scholar]
- Song, X.; Traub, B.; Shi, J.; Kornmann, M. Possible Roles of Interleukin-4 and -13 and Their Receptors in Gastric and Colon Cancer. Int. J. Mol. Sci. 2021, 22, 727. [Google Scholar] [CrossRef]
- Zhang, S.C.; Hu, Z.Q.; Long, J.H.; Zhu, G.M.; Wang, Y.; Jia, Y.; Zhou, J.; Ouyang, Y.; Zeng, Z. Clinical Implications of Tumor-Infiltrating Immune Cells in Breast Cancer. J. Cancer 2019, 10, 6175–6184. [Google Scholar] [CrossRef]
- Lei, Z.N.; Teng, Q.X.; Tian, Q.; Chen, W.; Xie, Y.; Wu, K.; Zeng, Q.; Zeng, L.; Pan, Y.; Chen, Z.S.; et al. Signaling pathways and therapeutic interventions in gastric cancer. Signal Transduct. Target. Ther. 2022, 7, 358. [Google Scholar] [CrossRef]
- Chou, C.C.; Yang, J.S.; Lu, H.F.; Ip, S.W.; Lo, C.; Wu, C.C.; Lin, J.P.; Tang, N.Y.; Chung, J.G.; Chou, M.J.; et al. Quercetin-mediated cell cycle arrest and apoptosis involving activation of a caspase cascade through the mitochondrial pathway in human breast cancer MCF-7 cells. Arch. Pharm. Res. 2010, 33, 1181–1191. [Google Scholar] [CrossRef]
- Kim, M.; Park, J.; Bouhaddou, M.; Kim, K.; Rojc, A.; Modak, M.; Soucheray, M.; McGregor, M.J.; O'Leary, P.; Wolf, D.; et al. A protein interaction landscape of breast cancer. Science 2021, 374, eabf3066. [Google Scholar] [CrossRef]
- Kim, J.; Yoo, J.M.; Park, J.S.; Kim, J.; Kim, S.G.; Seok, Y.J.; Son, J.H.; Kim, H.J. Anti-angiogenic effect of mountain ginseng in vitro and in vivo: Comparison with farm-cultivated ginseng. Mol. Med. Rep. 2021, 24, 615. [Google Scholar] [CrossRef]
- Sigstedt, S.C.; Hooten, C.J.; Callewaert, M.C.; Jenkins, A.R.; Romero, A.E.; Pullin, M.J.; Kornienko, A.; Lowrey, T.K.; Slambrouck, S.V.; Steelant, W.F. Evaluation of aqueous extracts of Taraxacum officinale on growth and invasion of breast and prostate cancer cells. Int. J. Oncol. 2008, 32, 1085–1090. [Google Scholar] [CrossRef]
- Villegas-Comonfort, S.; Serna-Marquez, N.; Galindo-Hernandez, O.; Navarro-Tito, N.; Salazar, E.P. Arachidonic acid induces an increase of β-1,4-galactosyltransferase I expression in MDA-MB-231 breast cancer cells. J. Cell. Biochem. 2012, 113, 3330–3341. [Google Scholar] [CrossRef]
- Wei, C.; Wang, B.; Peng, D.; Zhang, X.; Li, Z.; Luo, L.; He, Y.; Liang, H.; Du, X.; Li, S.; et al. Pan-Cancer Analysis Shows That ALKBH5 Is a Potential Prognostic and Immunotherapeutic Biomarker for Multiple Cancer Types Including Gliomas. Front. Immunol. 2022, 3, 849592. [Google Scholar]
- Zhu, C.; Wei, Y.; Wei, X. AXL receptor tyrosine kinase as a promising anti-cancer approach: Functions, molecular mechanisms and clinical applications. Mol. Cancer 2019, 18, 153. [Google Scholar] [CrossRef]
- Han, S.; Wang, Y.; Ge, C.; Gao, M.; Wang, X.; Wang, F.; Sun, L.; Li, S.; Dong, T.; Dang, Z.; et al. Pharmaceutical inhibition of AXL suppresses tumor growth and invasion of esophageal squamous cell carcinoma. Exp. Ther. Med. 2020, 20, 41. [Google Scholar] [CrossRef]
- Tai, K.Y.; Shieh, Y.S.; Lee, C.S.; Shiah, S.G.; Wu, C.W. Axl promotes cell invasion by inducing MMP-9 activity through activation of NF-κB and Brg-1. Oncogene 2008, 27, 4044–4055. [Google Scholar] [CrossRef]
- Hanahan, D.; Weinberg, R.A. Hallmarks of Cancer: The Next Generation. Cell 2011, 144, 646–674. [Google Scholar] [CrossRef]
- Genin, M.; Clement, F.; Fattaccioli, A.; Raes, M.; Michiels, C. M1 and M2 macrophages derived from THP-1 cells differentially modulate the response of cancer cells to etoposide. BMC Cancer 2015, 15, 577. [Google Scholar] [CrossRef]
- MacLeod, M.K.L.; Clambey, E.T.; Kappler, J.W.; Marrack, P. CD4 memory T cells: What are they and what can they do? Semin Immunol. 2009, 21, 53–61. [Google Scholar] [CrossRef]
- Duan, Z.; Li, Y.; Qiu, Y.; Shen, Y.; Wang, Y.; Zhang, Y.; Zhu, B.H.; Yu, X.H.; Tan, X.L.; Chen, W.; et al. CD39 expression defines exhausted CD4 + T cells associated with poor survival and immune evasion in human gastric cancer. Clin. Transl. Immunol. 2024, 13, e1499. [Google Scholar] [CrossRef]
- Dolina, J.S.; Van Braeckel-Budimir, N.; Thomas, G.D.; Salek-Ardakani, S. CD8+ T Cell Exhaustion in Cancer. Front. Immunol. 2021, 12, 715234. [Google Scholar] [CrossRef]
- Reina-Campos, M.; Scharping, N.E.; Goldrath, A.W. CD8+ T cell metabolism in infection and cancer. Nat. Rev. Immunol. 2021, 21, 718–738. [Google Scholar] [CrossRef]
- Rao, S.; Schieber, A.M.P.; O’Connor, C.P.; Leblanc, M.; Michel, D.; Ayres, J.S. Pathogen-Mediated Inhibition of Anorexia Promotes Host Survival and Transmission. Cell 2017, 168, 503–516.e12. [Google Scholar] [CrossRef]
- Komi, D.E.A.; Redegeld, F.A. Role of Mast Cells in Shaping the Tumor Microenvironment. Clin. Rev. Allergy Immunol. 2020, 58, 313–325. [Google Scholar] [CrossRef]
- Davis, B.P.; Rothenberg, M.E. Eosinophils and Cancer. Cancer Immunol. Res. 2014, 2, 1–8. [Google Scholar] [CrossRef]
- Grosdidier, A.; Zoete, V.; Michielin, O. SwissDock, a protein-small molecule docking web service based on EADock DSS. Nucleic Acids Res. 2011, 39, W270–W277. [Google Scholar] [CrossRef]
- Grosdidier, A.; Zoete, V.; Michielin, O. Fast docking using the CHARMM force field with EADock DSS. J. Comput. Chem. 2011, 32, 2149–2159. [Google Scholar] [CrossRef]
- Ge, S.X.; Jung, D.; Yao, R. ShinyGO: A graphical gene-set enrichment tool for animals and plants. Bioinformatics 2020, 36, 2628–2629. [Google Scholar] [CrossRef]
- Dennis, G.; Sherman, B.T.; Hosack, D.A.; Yang, J.; Gao, W.; Lane, H.C.; Lempicki, R.A. DAVID: Database for Annotation, Visualization, and Integrated Discovery. Genome Biol. 2003, 4, R60. [Google Scholar] [CrossRef]
- Pawitan, Y.; Michiels, S.; Koscielny, S.; Gusnanto, A.; Ploner, A. False discovery rate, sensitivity and sample size for microarray studies. Bioinformatics 2005, 21, 3017–3024. [Google Scholar] [CrossRef]
- Szklarczyk, D.; Franceschini, A.; Wyder, S.; Forslund, K.; Heller, D.; Huerta-Cepas, J.; Simonovic, M.; Roth, A.; Santos, A.; Tsafou, K.; et al. STRING v10: Protein–protein interaction networks, integrated over the tree of life. Nucleic Acids Res. 2015, 43, D447–D452. [Google Scholar] [CrossRef]
- Franceschini, A.; Szklarczyk, D.; Frankild, S.; Kuhn, M.; Simonovic, M.; Roth, A.; Lin, J.; Minguez, P.; Bork, P.; Von Mering, C.; et al. STRING v9.1: Protein-protein interaction networks, with increased coverage and integration. Nucleic Acids Res. 2012, 41, D808–D815. [Google Scholar] [CrossRef]
- von Mering, C.; Jensen, L.J.; Kuhn, M.; Chaffron, S.; Doerks, T.; Kruger, B.; Snel, B.; Bork, P. STRING 7—Recent developments in the integration and prediction of protein interactions. Nucleic Acids Res. 2007, 35, D358–D362. [Google Scholar] [CrossRef]
- Szklarczyk, D.; Franceschini, A.; Kuhn, M.; Simonovic, M.; Roth, A.; Minguez, P.; Doerks, T.; Stark, M.; Muller, J.; Bork, P.; et al. The STRING database in 2011: Functional interaction networks of proteins, globally integrated and scored. Nucleic Acids Res. 2011, 39, D561–D568. [Google Scholar] [CrossRef]
- Szklarczyk, D.; Morris, J.H.; Cook, H.; Kuhn, M.; Wyder, S.; Simonovic, M.; Santos, A.; Doncheva, N.; Roth, A.; Bork, P.; et al. The STRING database in 2017: Quality-controlled protein–protein association networks, made broadly accessible. Nucleic Acids Res. 2017, 45, D362–D368. [Google Scholar] [CrossRef]
- Jensen, L.J.; Kuhn, M.; Stark, M.; Chaffron, S.; Creevey, C.; Muller, J.; Doerks, T.; Julien, P.; Roth, A.; Simonovic, M.; et al. STRING 8—A global view on proteins and their functional interactions in 630 organisms. Nucleic Acids Res. 2009, 37, D412–D416. [Google Scholar] [CrossRef]
- Szklarczyk, D.; Gable, A.L.; Lyon, D.; Junge, A.; Wyder, S.; Huerta-Cepas, J.; Simonovic, M.; Doncheva, T.; Morris, H.; Bork, P.; et al. STRING v11: Protein–protein association networks with increased coverage, supporting functional discovery in genome-wide experimental datasets. Nucleic Acids Res. 2019, 47, D607–D613. [Google Scholar] [CrossRef]
- Szklarczyk, D.; Gable, A.L.; Nastou, K.C.; Lyon, D.; Kirsch, R.; Pyysalo, S.; Doncheva, N.T.; Legeay, M.; Fang, T.; Bork, P.; et al. The STRING database in 2021: Customizable protein–protein networks, and functional characterization of user-uploaded gene/measurement sets. Nucleic Acids Res. 2021, 49, D605–D612. [Google Scholar]
- Szklarczyk, D.; Kirsch, R.; Koutrouli, M.; Nastou, K.; Mehryary, F.; Hachilif, R.; Gable, L.; Fang, T.; Doncheva, T.; Pyysalo, S.; et al. The STRING database in 2023: Protein–protein association networks and functional enrichment analyses for any sequenced genome of interest. Nucleic Acids Res. 2023, 51, D638–D646. [Google Scholar] [CrossRef]
- Tang, Z.; Kang, B.; Li, C.; Chen, T.; Zhang, Z. GEPIA2: An enhanced web server for large-scale expression profiling and interactive analysis. Nucleic Acids Res. 2019, 47, W556–W560. [Google Scholar] [CrossRef]
- Shannon, P.; Markiel, A.; Ozier, O.; Baliga, N.S.; Wang, J.T.; Ramage, D.; Amin, N.; Schwikowski, B.; Ideker, T. Cytoscape: A Software Environment for Integrated Models of Biomolecular Interaction Networks. Genome Res. 2003, 13, 2498–2504. [Google Scholar] [CrossRef]
- Burley, S.K.; Bhikadiya, C.; Bi, C.; Bittrich, S.; Chao, H.; Chen, L.; Craig, A.; Crichlow, V.; Dalenberg, K.; Duarte, M.; et al. RCSB Protein Data Bank (RCSB.org): Delivery of experimentally-determined PDB structures alongside one million computed structure models of proteins from artificial intelligence/machine learning. Nucleic Acids Res. 2023, 51, D488–D508. [Google Scholar] [CrossRef]
- Jumper, J.; Evans, R.; Pritzel, A.; Green, T.; Figurnov, M.; Ronneberger, O.; Tunyasuvunakool, K.; Bates, R.; Zidek, O.; Potapenko, A.; et al. Highly accurate protein structure prediction with AlphaFold. Nature 2021, 596, 583–589. [Google Scholar] [CrossRef]
- Sayers, E.W.; Bolton, E.E.; Brister, J.R.; Canese, K.; Chan, J.; Comeau, D.C.; Connor, R.; Funk, K.; Kelly, C.; Kim, S.; et al. Database resources of the national center for biotechnology information. Nucleic Acids Res. 2022, 50, D20–D26. [Google Scholar] [CrossRef]
- Pettersen, E.F.; Goddard, T.D.; Huang, C.C.; Couch, G.S.; Greenblatt, D.M.; Meng, E.C.; Ferrin, T.E. UCSF Chimera—A visualization system for exploratory research and analysis. J. Comput. Chem. 2004, 25, 1605–1612. [Google Scholar] [CrossRef]

Disclaimer/Publisher’s Note: The statements, opinions and data contained in all publications are solely those of the individual author(s) and contributor(s) and not of MDPI and/or the editor(s). MDPI and/or the editor(s) disclaim responsibility for any injury to people or property resulting from any ideas, methods, instructions or products referred to in the content. |
© 2024 by the authors. Licensee MDPI, Basel, Switzerland. This article is an open access article distributed under the terms and conditions of the Creative Commons Attribution (CC BY) license (https://creativecommons.org/licenses/by/4.0/).
Share and Cite
Zúñiga-Hernández, S.R.; García-Iglesias, T.; Macías-Carballo, M.; Pérez-Larios, A.; Gutiérrez-Mercado, Y.K.; Camargo-Hernández, G.; Rodríguez-Razón, C.M. A Bioinformatic Assay of Quercetin in Gastric Cancer. Int. J. Mol. Sci. 2024, 25, 7934. https://doi.org/10.3390/ijms25147934
Zúñiga-Hernández SR, García-Iglesias T, Macías-Carballo M, Pérez-Larios A, Gutiérrez-Mercado YK, Camargo-Hernández G, Rodríguez-Razón CM. A Bioinformatic Assay of Quercetin in Gastric Cancer. International Journal of Molecular Sciences. 2024; 25(14):7934. https://doi.org/10.3390/ijms25147934
Chicago/Turabian StyleZúñiga-Hernández, Sergio Raúl, Trinidad García-Iglesias, Monserrat Macías-Carballo, Alejandro Pérez-Larios, Yanet Karina Gutiérrez-Mercado, Gabriela Camargo-Hernández, and Christian Martín Rodríguez-Razón. 2024. "A Bioinformatic Assay of Quercetin in Gastric Cancer" International Journal of Molecular Sciences 25, no. 14: 7934. https://doi.org/10.3390/ijms25147934