

Effect of Lanthanide Ions and Triazole Ligands on the Molecular Properties, Spectroscopy and Pharmacological Activity

 ,
,  , ,
, , 
Abstract
1. Introduction
2. Results and Discussion
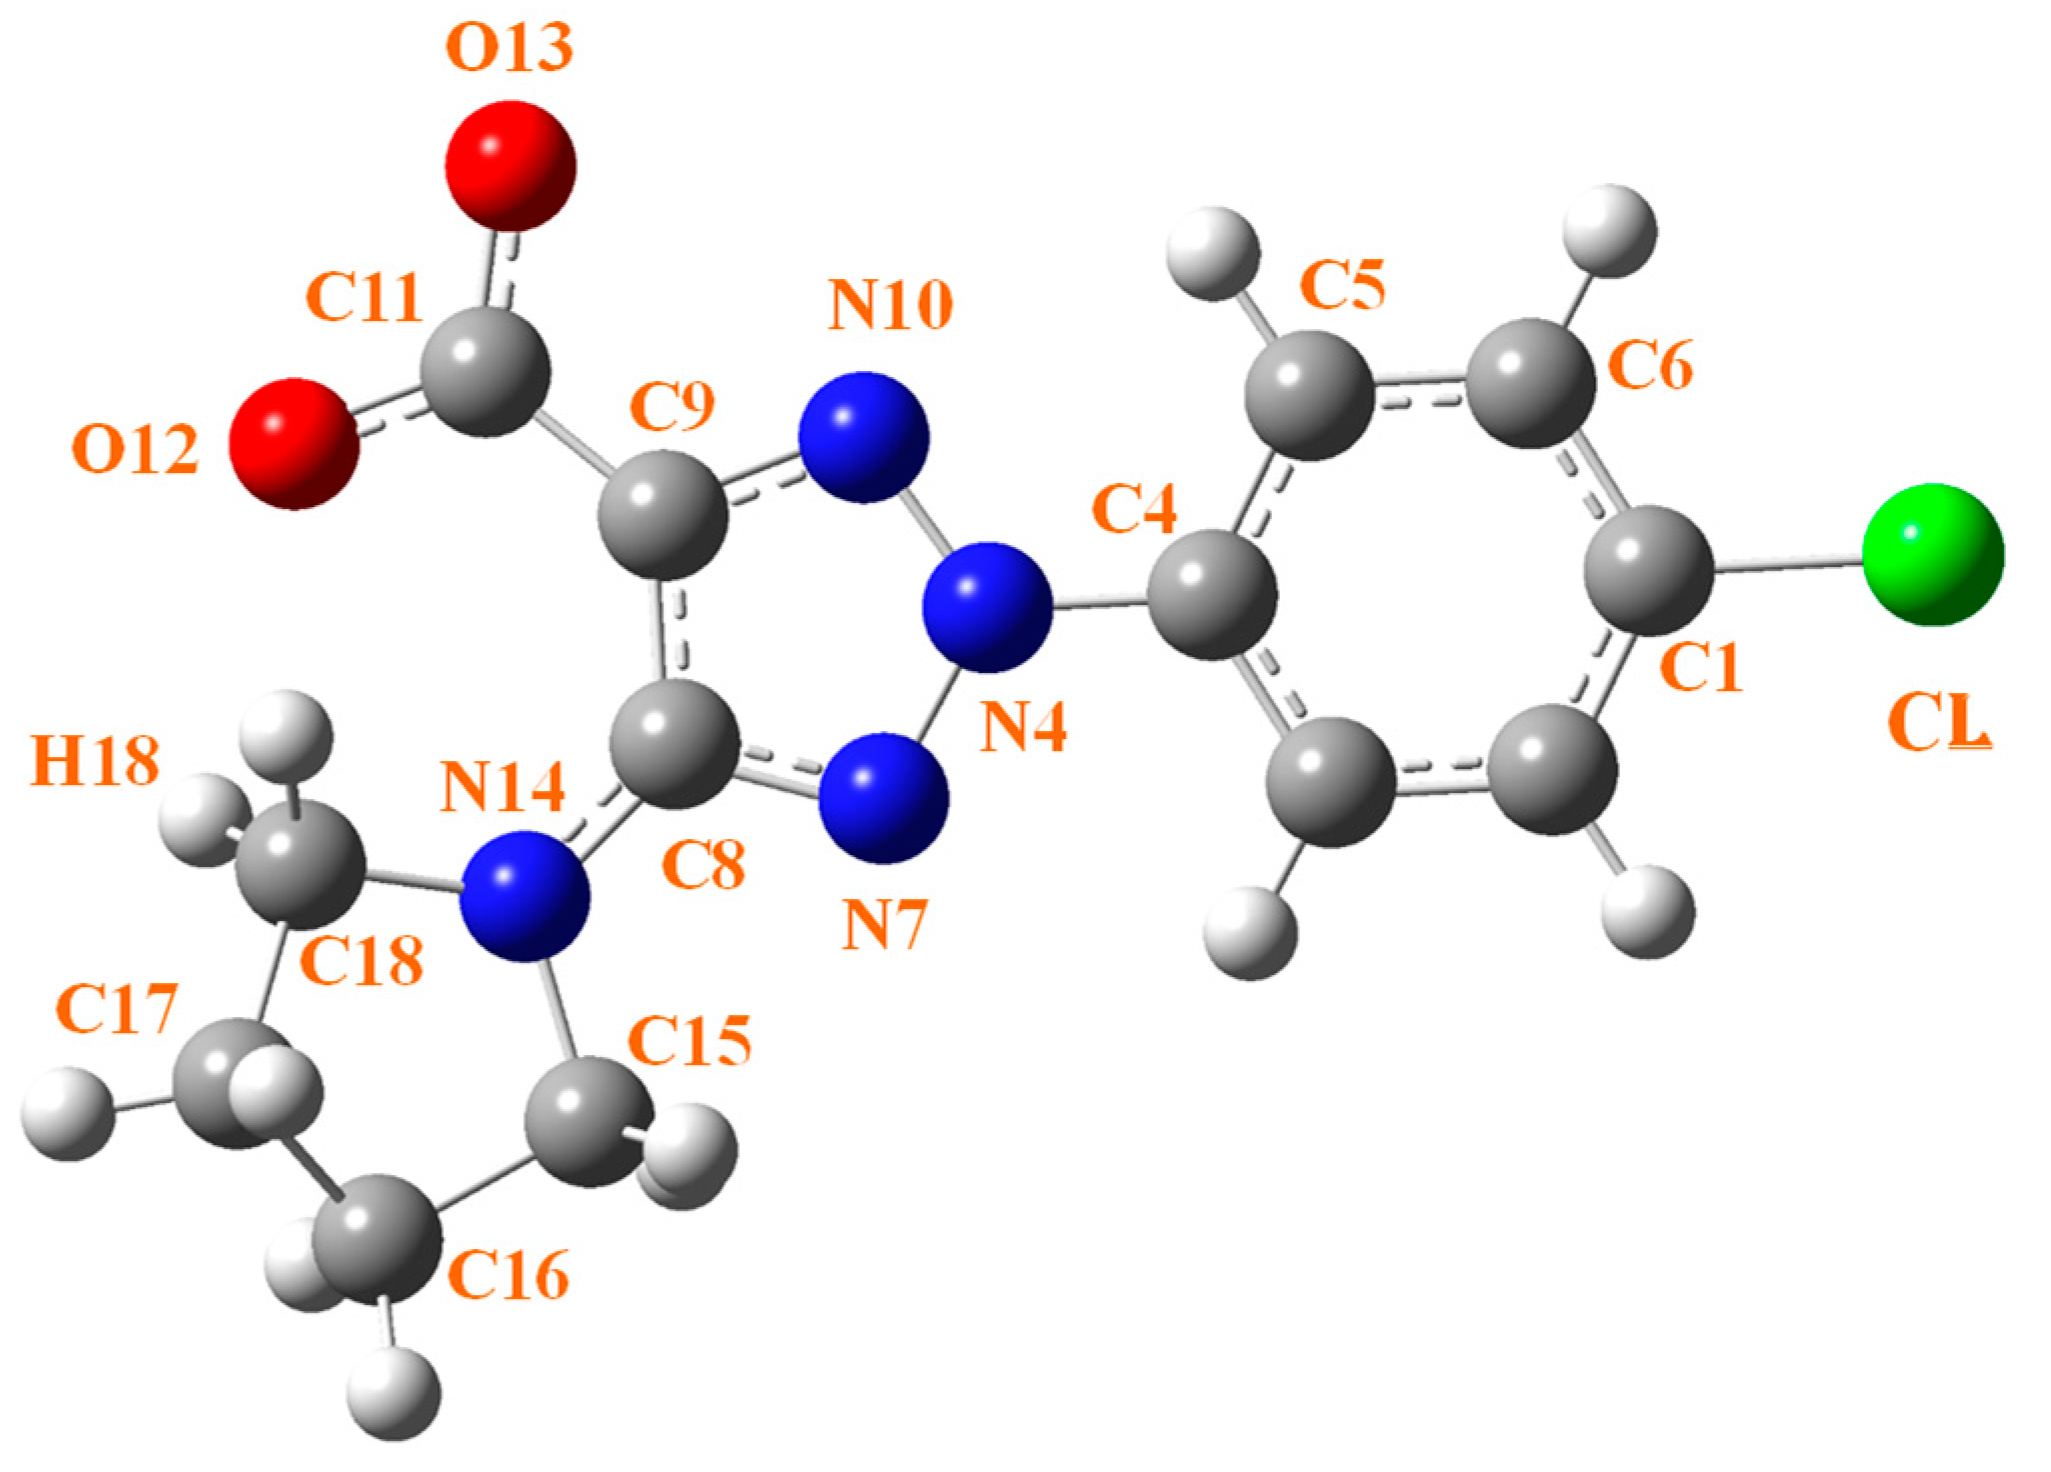
2.1. Molecular Structure
- (i)
- The Ln-O12 bond length value depends mainly on the nature of the Ln ion, with the longest value for complexes with La(III) ion and the shortest one for complexes with Ce(III) ion. Close values appear for those with Ce and Nd ions. Similar features are obtained for the Ln-O13 bond length.
- (ii)
- With the CAM-B3LYP method, the Ln-O12 bond length seems to be little affected by the ligand size in the complexes with the Ce(III) ion with values in the 2.256–2.264 Å range, but it seems to be strongly affected in the complexes with Nd(III) ion, with values in the 2.226–2.291 Å range. A strong effect with Nd ion is also observed with the M06-2X method, but the range is slightly shorter at 2.268–2.295 Å.
- (iii)
- As expected, the effect of the Ln ion nature is significantly reduced as the bond length increases. Therefore, the C11-O12 bond length varies in the short 1.406–1.425 Å range by CAM-B3LYP and 1.390–1.415 Å by M06-2X, with the shortest value in La complexes and the largest one in Ce complexes.
- (iv)
- The C11-O12 bond length seems to be less affected by the ligand effect than the Ln-O12 bond. Thus, the values appear in the shortest 1.422–1.425 Å range for the Ce complexes and in the 1.408–1.424 Å range for the Nd complexes.
- (v)
- Lengthening of the Ln-O12 bond leads, as expected, to a shortening of the C11-O12 bond lengths, but this shortening is large in the Nd complexes and smaller in the other lanthanide complexes. A linear relationship between the Ln-O12 and C11-O12 bond lengths can be established in the Ce and Nd complexes and in the La and Pr complexes by both CAM-B3LYP (Figure 5a) and M06–2X (Figure 5b).
- (vi)
- The C9-C11 bond length is noticeably affected by both Ln charge and ligand bonded. Therefore, its value varies in the long 1.556–1.647 Å range by M06-2X and similar long-range by CAM-B3LYP, 1.562–1.656 Å, indicating a large flexibility of this C9-C11 bond for adapting new bonded ligands.
- (vii)
- In the smallest A-complexes, the value of the O12-Ln-O13 angle has no effect on the dipole moment of the complex. However, for larger ligands, it has a noticeable effect. Therefore, as the size of the ligand is increased, the dipole moment is increased (Figure 5f). This effect is further enhanced by increasing the positive charge on the Ln ion. Thus, the Ce(2b′)3 complex has a huge dipole moment, followed by the Nd(2b′)3 complex. The large dipole moment value in these complexes indicates that they may have a large water solubility, which could facilitate their biomedical use. By contrast, La and Pr complexes with small dipole moment values are not useful for this purpose. The large increment in the dipole moment with the increase in the Ln charge can be explained by the opening of the O12-Ln-O13 angle and a rotation of the ligands to avoid steric interactions. A relationship between this angle and the dipole moment can be established for each type of complex (Figure 5f). A good linear relationship can be established between the dipole moment and the Ln charge for the C-complexes and the Ln(2b′)3 complexes, Figure 6e. The relationship seems to be worse for the O12 charge, Figure 6f.
- (viii)
- The C9–C11···C11′–C9′ torsional angle between the ligands in C- and Ln(2b′)3 complexes also has a noticeable effect on the dipole moment. An increase in its value in Ln(2b′)3 complexes seems to be well linearly related to a remarkable reduction in the dipole moment by both CAM-B3LYP and M06-2X methods (Figure S2). La-complexes do not follow this relationship.
2.2. Atomic Charges
- (i)
- The atomic charge of Ce and Nd ions is significantly higher than that of Pr and La ions, with the value of La ion being the lowest in all their complexes. These lowest values on La complexes lead to the longest La-O12 and La-O13 bond lengths. By contrast, the highest values on Ce complexes lead to the shortest La-O12 and La-O13 bonds. A clear relationship between Ln charge and Ln-O12 bond length can be established for each type of complex; Figure 5c by M06-2X and Figure S3a by CAM-B3LYP.
- (ii)
- The complexity of the ligand has a noticeable effect on the positive Ln charge. As the ligand becomes larger and more complex, the Ln charge increases up to a level, such as in C-complex, where further increases in ligand size have little effect on the Ln charge (Figure 5c). The effect of the ligand size is noticeably higher for Ln ions with a large positive charge, such as the Ce ion than for those with a small charge, the La ion. This can be explained by the ability of the Ln ions to donate electrons to the ligands, and the amount of electronic charge to be transferred is increased with large ligands because it can be more easily distributed on the molecular structure.
- (iii)
- An increase in Ln charge appears to be somewhat linearly related to a lengthening of the C11-O12 bond (Figure 5d). The values in A-complex do not appear to follow this relationship, nor do the Ce values, which follow another similar linear relationship. The CAM-B3LYP and B3LYP relationships appear worse and have therefore been included as Supplementary Material (Figure S3).
- (iv)
- The increase in the positive Ln charge is well linear and related to an increase in the negative charge on O12 by both CAM-B3LYP and M06-2X methods, in Figure 6a and Figure 6b, respectively. This relationship is also well established with the atomic charge on O13 (Figure S4) as well as by B3LYP. The complexes with the Ce ion follow a similar linear relationship. This withdrawal of electronic density by the carboxylate oxygen atoms comes from both the Ln ion and the C11 atom, increasing its positive charge. A good linear relationship with the C11 atom has also been obtained with the M06-2X method (Figure 6c) and with CAM-B3LYP (Figure S4f).
- (v)
- Since the Ln charge value affects the Ln-O12, Ln-O13 and C11-O12 bond lengths, as well as the atomic charges O12, O13 and C11, the C9-C11 bond length also appears to be affected by the Ln charge with a somewhat linear relationship (Figure 5e). The values in A-complex do not seem to follow this relationship.
- (vi)
- The nitrogen atoms N4 and N7 have a negative charge, while the charge in N10 is slightly positive, mainly due to the withdrawal of electronic charge from the C9 atom. A relationship between this C9 charge and the Ln charge can be established, especially for the Ce and Nd complexes; Figure 6d with the M06-2X method and Figure S5b with CAM-B3LYP. Relationships were not observed by B3LYP (Figure S5a) nor with the N4 atomic charge (Figure S5c,f).
2.3. Molecular Properties
- (i)
- In absolute values, the HOMO and LUMO energy values in La and Pr complexes are significantly lower than in Ce and Nd complexes. Increasing the ligand size noticeably decreases the HOMO energy, especially in Ce and Nd complexes. In these complexes, an almost linear relationship related to the Ln charge can be observed (Figure 7a) by M06-2X and (Figure S6c) by CAM-B3LYP.
- (ii)
- The ionization potential (IP) values are the lowest for the Ln(2b′)3 complexes, corresponding to the largest reactivity of these complexes due to their large size, while the IP values are the highest for the A-complexes (Table S3).
- (iii)
- The LUMO energy value does not change significantly with increasing Ln charge increase in Ce and Nd complexes, except for Ce(2b′)3 and Nd(2b′)3 complexes, while it is slightly increased in La and Pr complexes, by M06-2X in Figure 7b and by CAM-B3LYP in Figure S6d.
- (iv)
- Although band gaps calculated at the DFT level are typically underestimated, a high energy gap Eg is calculated in A- and B-complexes, especially in La and Pr complexes, indicating that these complexes are poorly polarizable, with low chemical reactivity and high kinetic stability. In contrast, C- and Ln(2b′)3 complexes with Ce and Nd ions have very low Eg values by all DFT methods, indicating high chemical reactivity and low excitation energies to the manifold of excited states of these complexes. A somewhat linear relationship of the decrease in Eg with the increment of Ln charge has been established by M06-2X in Figure 7c and by CAM-B3LYP in Figure S7a.
- (v)
- A similar relationship but with the O12 charge appears plotted in Figure 7d, where an increase in the negative charge of O12 leads to a low value of Eg. Two linear relationships can be established, one with the Ce and Nd complexes and another with the La and Pr complexes.
- (vi)
- Chemical hardness (η) and global softness (S) indicate the resistance of a system to a change in its number of electrons. For simplicity, Table 3 only includes the values of S, while Table S3 collects both S and η. The lowest values of η and S correspond to C- and Ln(2b′)3 complexes with Ce and Nd ions, and because of their low values, these complexes can be called soft, indicating a small gap and an electron density that can easily change.
- (vii)
- The Cv values strongly depend on the ligand size, as expected. The CAM-B3LYP method calculates them slightly higher than M06-2X, around 1–4 cal/mol·K in Ln(2b′)3 complex. The Ln ion has little effect on this value, with the highest value in Ce(2b′)3 complex, 225.9 cal/mol·K by M06-2X, and the lowest in Pr(2b′)3 complex, 221.9 cal/mol·K (Figure 7f). A similar small difference has also been calculated by CAM-B3LYP (Table 3). A clear relationship between the increment of Cv value and the increase in the Ln charge for each Ln complex has been plotted in Figure 7e by M06-2X and in Figure S7d by CAM-B3LYP.
- (viii)
- The entropy (S) values depend on the ligand size and the symmetry of the complex. Therefore, it has the highest value in the La(2b′)3 complex determined by B3LYP due to its lowest symmetry obtained by this method. Due to the large flexibility of the carboxylate group and the different arrangement of the ligands in the complex, the S value shows slight variations among the complexes (Table S3).
- (ix)
- The rotational constants in the three directions (A, B, C) have different values, with one being the highest (A-axis) in all complexes and one being the lowest (C-axis). As the ligands are most flexible in the A-complexes, the values of the rotational constant are the largest in these complexes, whereas the calculated smallest values appear in the Ln(2b′)3 complexes.
2.4. Infrared and Raman Spectra
- (i)
- The spectra appear very close in both IR intensity and wavenumber position of all bands. This means that the ligands are very little affected by the different Ln ions. Therefore, the characterization and assignment previously carried out for La(2b′)3 and Ce(2b′)3 complexes [15,25] can largely be applied to the bands of the remaining lanthanide Ln(2b′)3 complexes.
- (ii)
- The very broad band at 3400 cm−1 corresponding to the O-H stretching ν(O-H) mode of the hydration water molecules H-bonded to the oxygen and nitrogen atoms of the ligands shows small shifts in its maximum in the different Ln complexes. Compared to the La complex, the highest blue-shift in its wavenumber up to 3421 cm−1 was observed in the Gd and Dy complexes, indicating that in them, the water molecules appear slightly less H-bonded to the ligands, while the highest red-shift up to 3392 cm−1 corresponds to the Er complex. In the latter case, the lowest ionic radius of Er seems to facilitate the entry of the hydration water molecules associated with the complex synthesis into enter inside of the carboxylate region and to have slightly stronger H-bonds.
- (iii)
- The δ(O-H) in-plane bending mode of the hydrated water molecules appears to make a large contribution to the broadening of the broad and very strong experimental band centered at 1578 cm−1 and assigned to the stretching ν(C8-N14) + 8a, ν(CC) mode [15]. The lowest ionic radius of Ho and Er appears to increase the amount of H-bonded water molecules in these complexes. Therefore, the width of this band significantly increases in the spectra of these complexes.
- (iv)
- A very weak band at ca. 1895 cm−1 appears in all spectra that, by theoretical calculations [15], can be assigned to water molecules strongly H-bonded and, therefore, with large O-H bond lengths. The very weak intensity indicates that very few water molecules are involved in this H-bond, and the very large red-shift in its wavenumber indicates that this H-bond should have highly positively (Ln) or negatively (oxygen) charged atoms.
- (i)
- The large similarity among the Raman spectra confirms what was observed in the IR spectra, where the ligands are very little affected by the different Ln ions.
- (ii)
- A strong and broad band appears at 72 cm−1 in La complex, where the wavenumber varies in the 68−73 cm−1 range for each Ln complex. Small peaks at 77 and 96 cm−1 are also observed within this broad band. Its intensity is significantly enhanced in Sm, Dy and especially in Nd complexes. This band has been assigned to an out-of-plane vibrational mode of the lattice net, mainly involving the Ln ion. The width of this band and the peaks at 68, 72, 77 and 96 cm−1 can be interpreted by the different and close arrangement of the three ligands in the complex by the effect of the water molecules and the Ln ion.
- (iii)
- Only in the spectrum of the Nd complex appears a broad and weak band centered at 1888 cm−1, and only in this spectrum is the broad band at 73 cm−1 noticeably enhanced. Because of these two characteristics, it is possible to relate them, and it may be due to the special and different environment in which the Raman spectrum of the sample was recorded.
- (iv)
- The band at 1167 cm−1 in the La complex and assigned to the νs(NNN) of the triazole ring, is the one with the higher wavenumber shift and intensity with the different Ln ions, although the shifts are small, around 6 cm−1. The bands at 1375 and 970 cm−1 are also assigned to this stretching mode and are strongly coupled with the ν(COO) mode, as well as with other ring modes.
2.5. Participation in HAT and SET
- (1)
- 2,2-diphenyl-1-picrylhydrazyl (DPPH) assay, involving the stable radical DPPH●. This radical helps to assess the ability of a compound to participate in HAT reactions.
- (2)
- 2,2’-azino-bis(3-ethylbenzothiazoline-6-sulfonic acid) (ABTS) assay, involving the stable radical-ion ABTS●+. This stable radical-ion is regularly used to investigate the ability of a compound to participate in SET reactions;
3. Methods and Materials
3.1. Experimental Details
3.2. Computational Details
4. Conclusions
- The spatial arrangement of the ligands in these complexes depends on the theoretical method, the basis set used and the lanthanide atom. This arrangement is nearly symmetric by CAM-B3LYP and M06-2X methods and the Lanl2dz basis set, while it is deformed by B3LYP and the Cep-4g and Lanl2mb basis sets.
- Relationships have been established between the geometric parameters, atomic charges, HOMO-LUMO energies and other molecular properties. As the size of the ligand increases, the dipole moment is incremented. The reduction in the Ln atomic charge leads to a lengthening of the La-O12 and La-O13 bonds. As the ligand becomes larger and more complex, the Ln charge is increased, and this effect is more pronounced in Ln ions with large positive charge.
- Increasing the ligand size significantly reduces the HOMO energy. The high energy gap Eg calculated in A- and B-complexes reveal that they have low polarizability, with low chemical reactivity and high kinetic stability, while C- and Ln(2b′)3 complexes with very low Eg values indicate that they have large chemical reactivity and small excitation energies to the manifold of excited states.
- Due to the lowest values of η and S in C- and Ln(2b′)3 complexes, they can be described as soft with a small gap and with an electron density that can change easily.
- Due to the spatial arrangement of the ligands in the Ln(2b′)3 complexes, hydrated water molecules appear in their structure by the appearance of a broad ν(O-H) stretching band corresponding to water molecules in the experimental IR spectrum to the solid-state sample. These hydrated water molecules are H-bonded to the nitrogen atoms and to a large negative charge around three carboxylate groups.
- The experimental IR and Raman spectra of Ln(2b′)3 complexes where Ln = La, Ce, Pr, Nd, Sm, Gd, Dy, Ho and Er ions were recorded and compared.
- The arrangement of the hydrated water molecules little changes in the Ln(2b′)3 complexes with the lanthanide ion according to similar wave number of the experimental ν(O-H) stretching IR band position, but its amount especially increases in the Ho and Er complexes with a broadening of the very strong band at ca. 1578 cm−1.
- Coordination of 2b′ with Ln(III) ions seems to improve HAT with DPPH● the complexes exhibit a mild activity compared to the ligand, which is inactive in this model system. This increase in HAT activity is most pronounced in the lanthanum and samarium complexes.
- In the ABTS model system, contrary to DPPH, coordination of 2b′ with Ln(III) ions seems to generally suppress SET activity—the complexes generally scavenge ABTS●+ to a lesser extent, compared to the ligand 2b′ at three times higher concentration. The cerium and holmium complexes seem to be an exception to this trend, as their SET activity is higher than that of 2b′ at three times the concentration.
- Similarities in the IR and Raman spectra seem to be reflected as similarities in the activities of the Ln(III) complexes in the presence of the tested in vitro model systems.
Supplementary Materials
Author Contributions
Funding
Data Availability Statement
Conflicts of Interest
References
- Ambika, S.; Manojkumar, Y.; Arunachalam, S.; Gowdhami, B.; Sundaram, K.K.M.; Solomon, R.V.; Venuvanalingam, P.; Akbarsha, M.A.; Sundararaman, M. Biomolecular Interaction, Anti-Cancer and Anti-Angiogenic Properties of Cobalt(III) Schiff Base Complexes. Sci. Rep. 2019, 9, 2721. [Google Scholar] [CrossRef] [PubMed]
- Odularu, A.T.; Ajibade, P.A.; Mbese, J.Z. Impact of Molybdenum Compounds as Anticancer Agents. Bioinorg. Chem. Appl. 2019, 2019, 6416198. [Google Scholar] [CrossRef] [PubMed]
- Patyal, M.; Kaur, K.; Bala, N.; Gupta, N.; Malik, A.K. Innovative Lanthanide Complexes: Shaping the future of cancer/tumor Chemotherapy. J. Trace Elem. Med. Biol. 2023, 80, 127277. [Google Scholar] [CrossRef]
- Wang, J.; Li, S. Applcatiions of rare earth elements in cancer: Evidence mapping and scientometric analysis. Front. Med. 2022, 9, 946100. [Google Scholar] [CrossRef]
- Ascenzi, P.; Bettinelli, M.; Boffi, A.; Botta, M.; De Simone, G.; Luchinat, C.; Marengo, E.; Mei, H.; Aime, S. Rare earth elements (REE) in biology and medicine. Rend. Fis. Acc. Lincei. 2020, 31, 821–833. [Google Scholar] [CrossRef]
- Fouad, R. Synthesis and characterization of lanthanide complexes as potential therapeutic agents. J. Coord. Chem. 2020, 73, 2015–2028. [Google Scholar] [CrossRef]
- Song, J.; Zhang, S.; Zhang, B.; Ma, J. The anti-breast cancer therapeutic potential of 1,2,3-triazole-containing hybrids. Arch. Pharm. 2023, 357, e2300641. [Google Scholar] [CrossRef]
- Alam, M.M. 1,2,3-Triazole hybrids as anticancer agents: A review. Arch. Der Pharm. 2022, 355, 2100158. [Google Scholar] [CrossRef]
- Bozorov, K.; Zhao, J.; Aisa, H.A. 1,2,3-Triazole-containing hybrids as leads in medicinal chemistry: A recent overview. Bioorg. Med. Chem. 2019, 27, 3511–3531. [Google Scholar] [CrossRef]
- Hrimla, M.; Oubella, A.; Laamari, Y.; Bahsis, L.; Ghaleb, A.; Itto, M.Y.A.; Auhmani, A.; Morjani, H.; Julve, M.; Stiriba, S.-E. Click synthesis, anticancer activity, and molecular docking investigation of some functional 1,2,3-triazole derivatives. Biointerface Res. Appl. Chem. 2022, 12, 7633–7667. [Google Scholar] [CrossRef]
- Wu, X.; Wang, J.; Xia, S.; Cheng, S.; Shi, Y. 1,2,3-Triazole Derivatives with Anti-breast Cancer Potential. Curr. Top. Med. Chem. 2022, 22, 1406–1425. [Google Scholar] [CrossRef] [PubMed]
- Poonia, N.; Kumar, A.; Kumar, V.; Yadav, M.; Lal, K. Recent progress in 1H-1,2,3-triazoles as potential antifungal agents. Curr. Top. Med. Chem. 2021, 21, 2109–2133. [Google Scholar] [CrossRef] [PubMed]
- Safronov, N.E.; Kostova, I.P.; Palafox, M.A.; Belskaya, N.P. Combined NMR Spectroscopy and Quantum-Chemical Calculations in Fluorescent 1, 2, 3-Triazole-4-carboxylic Acids Fine Structures Analysis. Int. J. Mol. Sci. 2023, 24, 8947. [Google Scholar] [CrossRef] [PubMed]
- Palafox, M.A.; Belskaya, N.P.; Kostova, I.P. Study of the Molecular Architectures of 2-(4-Chlorophenyl)-5-(Pyrrolidin-1-Yl)-2H-1,2,3-Triazole-4-Carboxylic Acid as the Potential Anticancer Drug by Their Vibrational Spectra and Quantum Chemical Calculations. Pharmaceutics 2023, 15, 2686. [Google Scholar] [CrossRef] [PubMed]
- Alcolea Palafox, M.; Belskaya, N.P.; Todorov, L.T.; Kostova, I.P. Structural Study of a La (III) Complex of a 1,2,3-Triazole Ligand with Antioxidant Activity. Antioxidants 2023, 12, 1872. [Google Scholar] [CrossRef] [PubMed]
- Todorov, L.T.; Traykova, M.L.; Kostova, I.P. In Vitro Interaction of 5-aminoorotic Acid and Its Lanthanum (III) Complex with Superoxide and Hypochlorite Radicals. Der Pharma Chemica 2020, 12, 26–35. [Google Scholar]
- Paswan, S.; Anjum, A.; Yadav, N.; Jaiswal, N.; Singh, R.K.P. Synthesis, thermal, photo-physical, and biological properties of mononuclear Yb3+, Nd3+, and Dy3+ complexes derived from Schiff base ligands. J. Coord. Chem. 2020, 73, 686–701. [Google Scholar] [CrossRef]
- Hosseinzadeh, R.; Khorsandi, K.; Sadat Esfahani, H.; Habibi, M.; Hosseinzadeh, G. Preparation of cerium-curcumin and cerium-quercetin complexes and their LEDs irradiation assisted anticancer effects on MDA-MB-231 and A375 cancer cell lines. Photodiagnosis Photodyn. Ther. 2021, 34, 102326. [Google Scholar] [CrossRef] [PubMed]
- Zhang, H.; Feng, J.; Zhu, W.; Liu, C.; Gu, J. Bacteriostatic effects of cerium-humic acid complex-An experimental study. Biol. Trace Elem. Res. 2000, 73, 29–36. [Google Scholar] [CrossRef]
- Lee, C.; Yang, W.; Parr, R.G. Development of the Colle-Salvetti Correlation-Energy Formula into a Functional of the Electron Density. Phys. Rev. B 1988, 37, 785–789. [Google Scholar] [CrossRef]
- Yanai, T.; Tew, D.P.; Handy, N.C. A new hybrid exchange–correlation functional using the Coulomb-attenuating method (CAM-B3LYP). Chem. Phys. Lett. 2004, 393, 51–57. [Google Scholar] [CrossRef]
- Zhao, Y.; Truhlar, D.G. The M06 suite of density functionals for main group thermochemistry, thermochemical kinetics, noncovalent interactions, excited states, and transition elements: Two new functionals and systematic testing of four M06-class functionals and 12 other functionals. Theor. Chem. Acc. 2008, 120, 215–241. [Google Scholar] [CrossRef]
- Mishra, V.R.; Sekar, N. Photostability of coumarin laser dyes-a mechanistic study using global and local reactivity descriptors. J. Fluoresc. 2017, 27, 1101–1108. [Google Scholar] [CrossRef]
- Pearson, R.G. Chemical hardness and density functional theory. J. Chem. Sci. 2005, 117, 369–377. [Google Scholar] [CrossRef]
- Alcolea Palafox, M.; Belskaya, N.P.; Todorov, L.; Hristiva-Avakumova, N.; Kostova, I.P. Ligand Impact on the Charge and Molecular Properties of 1,2,3-Triazole-Ce(III) Complex with Antioxidant Activity: Structure, Spectroscopy and Relationships. Preprints 2024, 2024010798. [Google Scholar]
- Kostova, I.; Valcheva-Traykova, M. New samarium (III) complex of 5-aminoorotic acid with antioxidant activity. Appl. Organomet. Chem. 2015, 29, 815–824. [Google Scholar] [CrossRef]
- Zou, H.-H.; Meng, T.; Chen, Q.; Zhang, Y.-Q.; Wang, H.-L.; Li, B.; Wang, K.; Chen, Z.-L.; Liang, F. Bifunctional mononuclear dysprosium complexes: Single-ion magnet behaviors and antitumor activities. Inorg. Chem. 2019, 58, 2286–2298. [Google Scholar] [CrossRef]
- Chrzczanowicz, J.; Gawron, A.; Zwolinska, A.; de Graft-Johnson, J.; Krajewski, W.; Krol, M.; Markowski, J.; Kostka, T.; Nowak, D. Simple method for determining human serum 2, 2-diphenyl-1-picryl-hydrazyl (DPPH) radical scavenging activity–possible application in clinical studies on dietary antioxidants. Clin. Chem. Lab. Med. 2008, 46, 342–349. [Google Scholar] [CrossRef]
- Molyneux, P. The use of the stable free radical diphenylpicrylhydrazyl (DPPH) for estimating antioxidant activity. Songklanakarin J. Sci. Technol. 2004, 26, 211–219. [Google Scholar]
- Erel, O. A novel automated direct measurement method for total antioxidant capacity using a new generation, more stable ABTS radical cation. Clin. Biochem. 2004, 37, 277–285. [Google Scholar] [CrossRef]
- Erel, O. A novel automated method to measure total antioxidant response against potent free radical reactions. Clin. Biochem. 2004, 37, 112–119. [Google Scholar] [CrossRef] [PubMed]
- Seminario, J.M. Modern Density Functional Theory: A Tool for Chemistry; Elsevier: Amsterdam, The Netherlands, 1995; p. 0080536700. [Google Scholar]
- Brovarets’, O.H.O.; Hovorun, D.M. Prototropic tautomerism and basic molecular principles of hypoxanthine mutagenicity: An exhaustive quantum-chemical analysis. J. Biomol. Struct. Dyn. 2013, 31, 913–936. [Google Scholar] [CrossRef] [PubMed]
- Riley, K.E.; Hobza, P. Noncovalent interactions in biochemistry. Wiley Interdiscip. Rev. Comput. Mol. Sci. 2011, 1, 3–17. [Google Scholar] [CrossRef]
- Riley, K.E.; Pitonák, M.; Jurecka, P.; Hobza, P. Stabilization and structure calculations for noncovalent interactions in extended molecular systems based on wave function and density functional theories. Chem. Rev. 2010, 110, 5023–5063. [Google Scholar] [CrossRef]
- Zhao, Y.; Truhlar, D.G. Applications and validations of the Minnesota density functionals. Chem. Phys. Lett. 2011, 502, 1–13. [Google Scholar] [CrossRef]
- Palafox, M.A. DFT computations on vibrational spectra: Scaling procedures to improve the wavenumbers. Phys. Sci. Rev. 2018, 3, 20170184. [Google Scholar] [CrossRef]
- Frisch, M.E.; Trucks, G.W.; Schlegel, H.B.; Scuseria, G.E.; Robb, M.; Cheeseman, J.R.; Scalmani, G.; Barone, V.P.G.A.; Petersson, G.A.; Nakatsuji, H.J.R.A.; et al. Gaussian 16, Revision C. 01; Gaussian, Inc.: Wallingford, CT, USA, 2016. [Google Scholar]


| Bond Length | Ln= | B3LYP | CAM-B3LYP | M06-2X | |||||||||
|---|---|---|---|---|---|---|---|---|---|---|---|---|---|
| A | B | C | Ln(2b′)3 | A | B | C | Ln(2b′)3 | A | B | C | Ln(2b′)3 | ||
| Ln-O12 | La | 2.473 | 2.478 | 2.478 | 2.257 | 2.453 | 2.463 | 2.465 | 2.441 | 2.468 | 2.466 | 2.472 | 2.472 |
| Ce | 2.287 | 2.29 | 2.288 | 2.304 | 2.256 | 2.26 | 2.257 | 2.264 | 2.248 | 2.261 | 2.253 | 2.26 | |
| Pr | 2.376 | 2.376 | 2.375 | 2.386 | 2.373 | 2.362 | 2.353 | 2.366 | 2.354 | 2.363 | 2.36 | 2.367 | |
| Nd | 2.28 | 2.277 | 2.313 | 2.35 | 2.248 | 2.291 | 2.226 | 2.265 | 2.285 | 2.295 | 2.268 | 2.274 | |
| Ln-O13 | La | 2.465 | 2.449 | 2.448 | 3.646 | 2.46 | 2.445 | 2.439 | 2.427 | 2.432 | 2.424 | 2.418 | 2.417 |
| Ce | 2.286 | 2.282 | 2.281 | 2.275 | 2.255 | 2.251 | 2.251 | 2.231 | 2.253 | 2.24 | 2.245 | 2.224 | |
| Pr | 2.363 | 2.372 | 2.369 | 2.346 | 2.346 | 2.351 | 2.363 | 2.348 | 2.357 | 2.354 | 2.365 | 2.346 | |
| Nd | 2.27 | 2.268 | 2.285 | 2.324 | 2.217 | 2.183 | 2.236 | 2.187 | 2.181 | 2.165 | 2.192 | 2.162 | |
| C11-O12 | La | 1.421 | 1.419 | 1.418 | 1.418 | 1.411 | 1.407 | 1.406 | 1.407 | 1.395 | 1.393 | 1.392 | 1.39 |
| Ce | 1.434 | 1.434 | 1.436 | 1.437 | 1.423 | 1.422 | 1.423 | 1.425 | 1.413 | 1.41 | 1.413 | 1.415 | |
| Pr | 1.42 | 1.42 | 1.421 | 1.421 | 1.409 | 1.408 | 1.409 | 1.409 | 1.399 | 1.395 | 1.398 | 1.396 | |
| Nd | 1.432 | 1.435 | 1.431 | 1.43 | 1.419 | 1.408 | 1.424 | 1.418 | 1.397 | 1.395 | 1.404 | 1.405 | |
| C9-C11 | La | 1.644 | 1.594 | 1.593 | 1.579 | 1.635 | 1.589 | 1.589 | 1.574 | 1.627 | 1.584 | 1.584 | 1.581 |
| Ce | 1.657 | 1.587 | 1.583 | 1.576 | 1.648 | 1.581 | 1.577 | 1.563 | 1.638 | 1.575 | 1.571 | 1.556 | |
| Pr | 1.667 | 1.619 | 1.618 | 1.612 | 1.656 | 1.611 | 1.611 | 1.606 | 1.647 | 1.605 | 1.606 | 1.598 | |
| Nd | 1.659 | 1.588 | 1.592 | 1.599 | 1.65 | 1.581 | 1.578 | 1.562 | 1.639 | 1.575 | 1.572 | 1.557 | |
| Atom | Ln= | B3LYP | CAM-B3LYP | M06-2X | |||||||||
|---|---|---|---|---|---|---|---|---|---|---|---|---|---|
| A | B | C | Ln(2b′)3 | A | B | C | Ln(2b′)3 | A | B | C | Ln(2b′)3 | ||
| Ln | La | 2.253 | 2.584 | 2.947 | 2.884 | 2.296 | 2.593 | 2.885 | 2.816 | 2.344 | 2.637 | 2.926 | 2.841 |
| Ce | 2.366 | 2.982 | 3.657 | 2.844 | 2.814 | 3.464 | 4.147 | 4.457 | 2.752 | 3.436 | 4.117 | 4.494 | |
| Pr | 2.301 | 2.709 | 3.137 | 3.276 | 2.339 | 2.717 | 3.043 | 3.16 | 2.408 | 2.764 | 3.117 | 3.235 | |
| Nd | 2.333 | 2.342 | 0.851 | 0.526 | 2.372 | 2.917 | 3.615 | 3.874 | 2.583 | 3.19 | 3.88 | 4.165 | |
| O12 | La | −0.761 | −0.798 | −0.932 | −1.014 | −0.811 | −0.832 | −0.945 | −1.002 | −0.808 | −0.856 | −0.962 | −0.948 |
| Ce | −0.733 | −0.921 | −1.205 | −0.909 | −0.819 | −0.995 | −1.241 | −1.323 | −0.794 | −0.989 | −1.260 | −1.363 | |
| Pr | −0.743 | −0.822 | −0.979 | −1.005 | −0.772 | −0.854 | −0.988 | −1.005 | −0.825 | −0.878 | −1.052 | −1.053 | |
| Nd | −0.739 | −0.828 | −0.356 | −0.227 | −0.768 | −0.858 | −1.235 | −1.263 | −0.697 | −0.903 | −1.187 | −1.287 | |
| O13 | La | −0.776 | −0.837 | −0.956 | −1.089 | −0.800 | −0.866 | −0.964 | −1.065 | −0.876 | −0.930 | −1.039 | −1.078 |
| Ce | −0.747 | −0.937 | −1.167 | −0.925 | −0.823 | −1.011 | −1.224 | −1.380 | −0.797 | −0.992 | −1.201 | −1.413 | |
| Pr | −0.762 | −0.837 | −0.972 | −1.059 | −0.799 | −0.859 | −0.952 | −1.030 | −0.832 | −0.918 | −1.014 | −1.109 | |
| Nd | −0.788 | −0.894 | −0.333 | −0.161 | −0.825 | −0.983 | −1.196 | −1.339 | −0.873 | −1.060 | −1.379 | −1.434 | |
| C11 | La | 0.732 | 1.032 | 1.261 | 1.381 | 0.782 | 1.002 | 1.272 | 1.368 | 0.863 | 1.162 | 1.359 | 1.258 |
| Ce | 0.83 | 1.459 | 1.954 | 1.458 | 0.831 | 1.446 | 1.871 | 2.071 | 0.81 | 1.441 | 1.9 | 2.134 | |
| Pr | 0.689 | 1.001 | 1.24 | 1.363 | 0.73 | 1.045 | 1.238 | 1.353 | 0.81 | 1.123 | 1.348 | 1.485 | |
| Nd | 0.913 | 1.577 | 0.529 | 0.259 | 0.954 | 1.522 | 2.019 | 2.375 | 0.884 | 1.511 | 2.136 | 2.208 | |
| μ | La | 0.069 | 0.042 | 0.734 | 4.377 | 0.044 | 0.028 | 0.861 | 2.909 | 0.571 | 0.463 | 0.527 | 8.038 |
| Ce | 0.101 | 0.117 | 4.595 | 11.523 | 0.098 | 0.04 | 5.416 | 10.916 | 0.13 | 0.036 | 2.571 | 10.604 | |
| Pr | 0.111 | 0.211 | 2.394 | 9.726 | 0.233 | 0.17 | 1.114 | 4.375 | 0.159 | 0.294 | 1.277 | 3.802 | |
| Nd | 0.143 | 0.243 | 1.589 | 6.885 | 0.162 | 0.958 | 5.268 | 7.513 | 0.152 | 0.3 | 4.161 | 6.175 | |
| Atom | Ln= | B3LYP | CAM-B3LYP | M06-2X | |||||||||
|---|---|---|---|---|---|---|---|---|---|---|---|---|---|
| A | B | C | Ln(2b′)3 | A | B | C | Ln(2b′)3 | A | B | C | Ln(2b′)3 | ||
| HOMO | La | −0.296 | −0.316 | −0.302 | −0.253 | −0.357 | −0.378 | −0.352 | −0.300 | −0.372 | −0.390 | −0.349 | −0.300 |
| Ce | −0.490 | −0.456 | −0.375 | −0.342 | −0.553 | −0.512 | −0.423 | −0.390 | −0.565 | −0.513 | −0.421 | −0.390 | |
| Pr | −0.296 | −0.320 | −0.302 | −0.252 | −0.358 | −0.381 | −0.351 | −0.300 | −0.371 | −0.391 | −0.349 | −0.300 | |
| Nd | −0.489 | −0.455 | −0.377 | −0.337 | −0.554 | −0.506 | −0.424 | −0.384 | −0.566 | −0.510 | −0.419 | −0.389 | |
| LUMO | La | −0.090 | −0.145 | −0.159 | −0.146 | −0.034 | −0.093 | −0.110 | −0.096 | −0.052 | −0.105 | −0.122 | −0.121 |
| Ce | −0.367 | −0.361 | −0.347 | −0.306 | −0.290 | −0.288 | −0.279 | −0.239 | −0.350 | −0.346 | −0.337 | −0.296 | |
| Pr | −0.122 | −0.149 | −0.158 | −0.140 | −0.079 | −0.091 | −0.108 | −0.092 | −0.068 | −0.103 | −0.122 | −0.107 | |
| Nd | −0.389 | −0.383 | −0.362 | −0.316 | −0.325 | −0.329 | −0.315 | −0.277 | −0.341 | −0.338 | −0.331 | −0.289 | |
| Eg | La | 0.206 | 0.171 | 0.143 | 0.107 | 0.323 | 0.285 | 0.242 | 0.204 | 0.32 | 0.285 | 0.227 | 0.179 |
| Ce | 0.123 | 0.095 | 0.028 | 0.107 | 0.263 | 0.224 | 0.144 | 0.151 | 0.214 | 0.167 | 0.083 | 0.093 | |
| Pr | 0.174 | 0.171 | 0.144 | 0.112 | 0.279 | 0.29 | 0.243 | 0.208 | 0.303 | 0.288 | 0.227 | 0.193 | |
| Nd | 0.1 | 0.072 | 0.015 | 0.021 | 0.229 | 0.177 | 0.109 | 0.107 | 0.225 | 0.172 | 0.088 | 0.1 | |
| S | La | 0.051 | 0.043 | 0.036 | 0.027 | 0.081 | 0.071 | 0.06 | 0.051 | 0.08 | 0.071 | 0.057 | 0.045 |
| Ce | 0.1 | 0.024 | 0.007 | 0.009 | 0.066 | 0.056 | 0.036 | 0.038 | 0.054 | 0.042 | 0.021 | 0.023 | |
| Pr | 0.043 | 0.043 | 0.036 | 0.028 | 0.07 | 0.072 | 0.061 | 0.052 | 0.076 | 0.072 | 0.057 | 0.048 | |
| Nd | 0.025 | 0.018 | 0.004 | 0.005 | 0.057 | 0.044 | 0.027 | 0.027 | 0.056 | 0.043 | 0.022 | 0.025 | |
| Cv | La | 56.2 | 89.2 | 167.5 | 229.9 | 51.6 | 87 | 163.5 | 224.8 | 55.2 | 85.5 | 161.7 | 222.1 |
| Ce | 58.5 | 89.3 | 168.1 | 231.5 | 51.7 | 86.8 | 163.8 | 231 | 53.6 | 83.8 | 162.4 | 225.9 | |
| Pr | 52.4 | 89.6 | 167.9 | 231 | 57.6 | 87.3 | 163.8 | 225.9 | 55.4 | 85.9 | 162.2 | 221.9 | |
| Nd | 58.5 | 89.3 | 168.4 | 231.9 | 53.7 | 86.7 | 161.8 | 224.2 | 53.5 | 83.7 | 160.3 | 223.8 | |
Disclaimer/Publisher’s Note: The statements, opinions and data contained in all publications are solely those of the individual author(s) and contributor(s) and not of MDPI and/or the editor(s). MDPI and/or the editor(s) disclaim responsibility for any injury to people or property resulting from any ideas, methods, instructions or products referred to in the content. |
© 2024 by the authors. Licensee MDPI, Basel, Switzerland. This article is an open access article distributed under the terms and conditions of the Creative Commons Attribution (CC BY) license (https://creativecommons.org/licenses/by/4.0/).
Share and Cite
Alcolea Palafox, M.; Belskaya, N.P.; Todorov, L.T.; Hristova-Avakoumova, N.G.; Kostova, I.P. Effect of Lanthanide Ions and Triazole Ligands on the Molecular Properties, Spectroscopy and Pharmacological Activity. Int. J. Mol. Sci. 2024, 25, 7964. https://doi.org/10.3390/ijms25147964
Alcolea Palafox M, Belskaya NP, Todorov LT, Hristova-Avakoumova NG, Kostova IP. Effect of Lanthanide Ions and Triazole Ligands on the Molecular Properties, Spectroscopy and Pharmacological Activity. International Journal of Molecular Sciences. 2024; 25(14):7964. https://doi.org/10.3390/ijms25147964
Chicago/Turabian StyleAlcolea Palafox, Mauricio, Nataliya P. Belskaya, Lozan T. Todorov, Nadya G. Hristova-Avakoumova, and Irena P. Kostova. 2024. "Effect of Lanthanide Ions and Triazole Ligands on the Molecular Properties, Spectroscopy and Pharmacological Activity" International Journal of Molecular Sciences 25, no. 14: 7964. https://doi.org/10.3390/ijms25147964
APA StyleAlcolea Palafox, M., Belskaya, N. P., Todorov, L. T., Hristova-Avakoumova, N. G., & Kostova, I. P. (2024). Effect of Lanthanide Ions and Triazole Ligands on the Molecular Properties, Spectroscopy and Pharmacological Activity. International Journal of Molecular Sciences, 25(14), 7964. https://doi.org/10.3390/ijms25147964