
Impact of Different Anti-Hyperglycaemic Treatments on Bone Turnover Markers and Bone Mineral Density in Type 2 Diabetes Mellitus Patients: A Systematic Review and Meta-Analysis

 , , ,
, , ,
Abstract
:1. Introduction
2. Materials and Methods
2.1. Search Strategy
2.2. Inclusion and Exclusion Criteria
2.3. Data Extraction and Risk of Bias
2.4. Statistical Analysis
3. Results
3.1. Identified and Included Studies
3.2. Study Characteristics
3.3. Risk of Bias Assessment
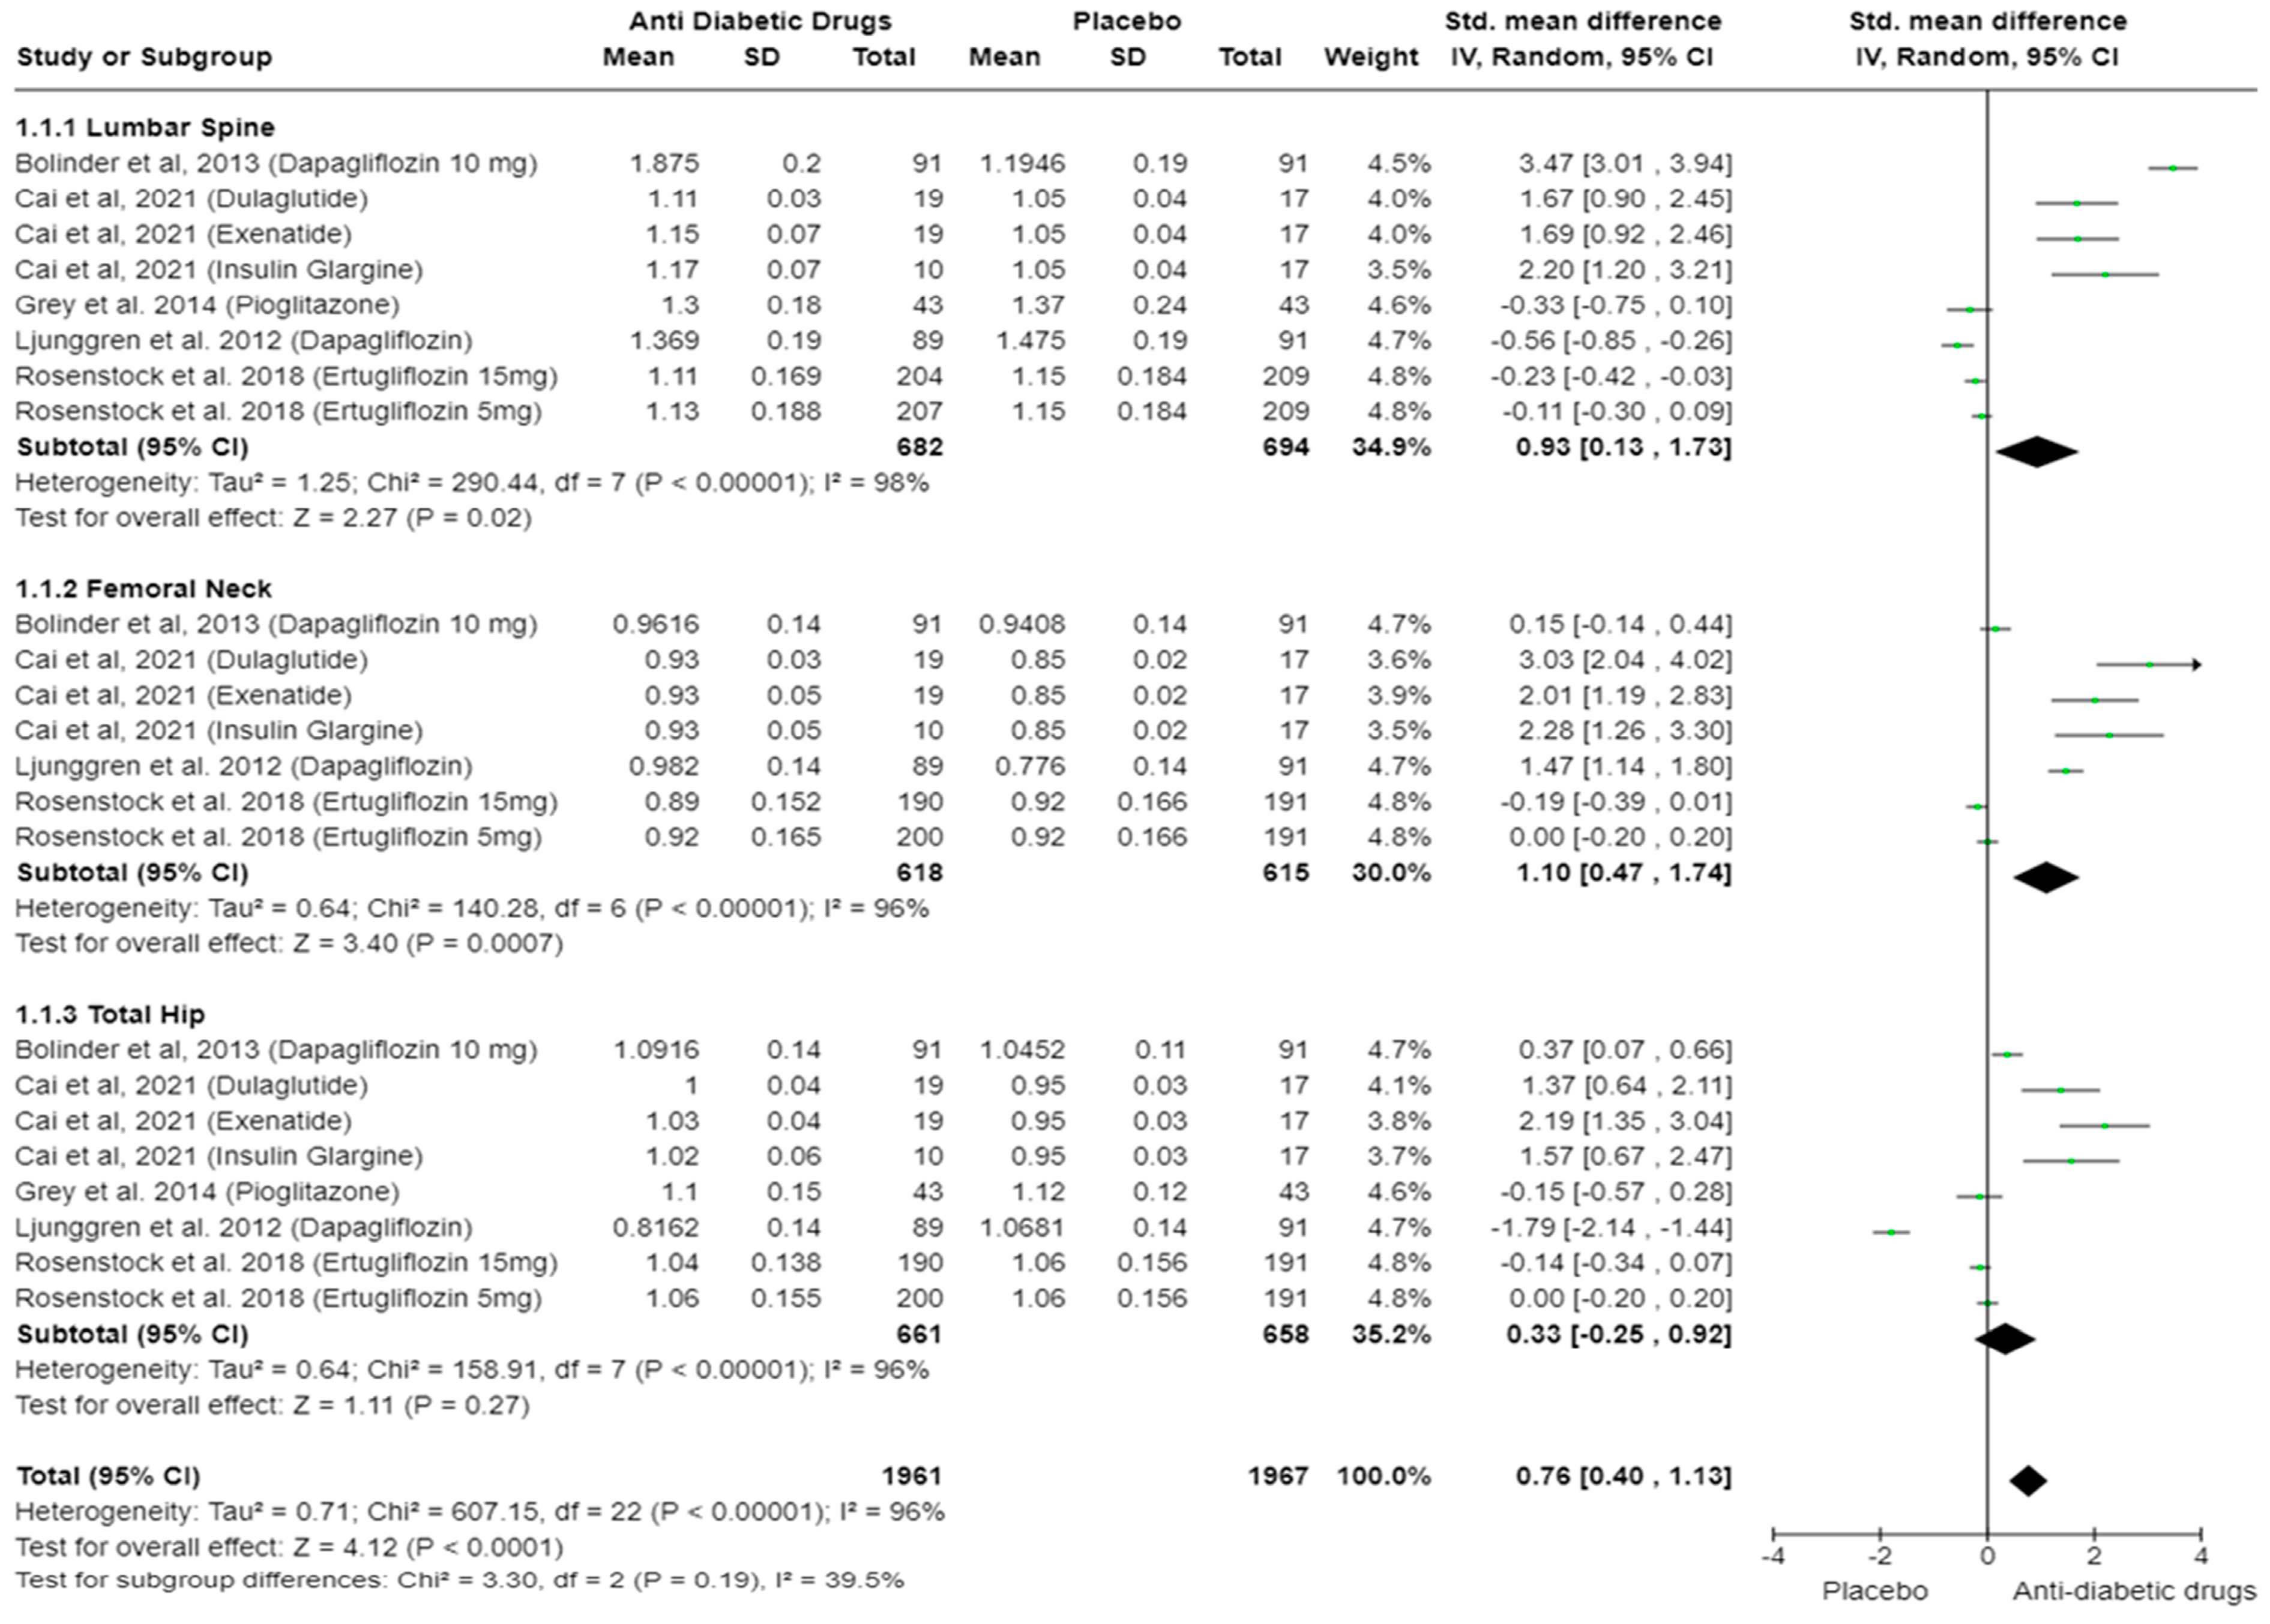
3.4. Body Mineral Density (Anti-Diabetic Drug vs. Placebo)
3.5. Body Mineral Density (Anti-Diabetic Drug vs. Metformin)
3.6. P1NP (Anti-Diabetic Drugs vs. Placebo)
3.7. P1NP (Anti-Diabetic Drugs vs. Metformin)
3.8. CTX (Anti-Diabetic Drugs vs. Placebo)
3.9. CTX (Anti-Diabetic Drugs vs. Metformin)
3.10. Other Bone Turnover Markers
4. Discussion
5. Conclusions
Supplementary Materials
Author Contributions
Funding
Institutional Review Board Statement
Informed Consent Statement
Data Availability Statement
Acknowledgments
Conflicts of Interest
References
- Guthrie, R.A.; Guthrie, D.W. Pathophysiology of diabetes mellitus. Crit. Care Nurs. Q. 2004, 27, 113–125. [Google Scholar] [CrossRef] [PubMed]
- Nathan, D.M.; Genuth, S.; Lachin, J.; Cleary, P.; Crofford, O.; Davis, M.; Rand, L.; Siebert, C. The effect of intensive treatment of diabetes on the development and progression of long-term complications in insulin-dependent diabetes mellitus. N. Engl. J. Med. 1993, 329, 977–986. [Google Scholar] [CrossRef] [PubMed]
- Lotfy, M.; Adeghate, J.; Kalasz, H.; Singh, J.; Adeghate, E. Chronic Complications of Diabetes Mellitus: A Mini Review. Curr. Diabetes Rev. 2017, 13, 3–10. [Google Scholar] [CrossRef] [PubMed]
- Isidro, M.L.; Ruano, B. Bone disease in diabetes. Curr. Diabetes Rev. 2010, 6, 144–155. [Google Scholar] [CrossRef] [PubMed]
- Xu, Y.; Wu, Q. Trends in osteoporosis and mean bone density among type 2 diabetes patients in the US from 2005 to 2014. Sci. Rep. 2021, 11, 3693. [Google Scholar] [CrossRef] [PubMed]
- Janghorbani, M.; Van Dam, R.M.; Willett, W.C.; Hu, F.B. Systematic review of type 1 and type 2 diabetes mellitus and risk of fracture. Am. J. Epidemiol. 2007, 166, 495–505. [Google Scholar] [CrossRef] [PubMed]
- Hadjidakis, D.J.; Androulakis, I.I. Bone remodeling. Ann. N. Y. Acad. Sci. 2006, 1092, 385–396. [Google Scholar] [CrossRef] [PubMed]
- Kanakis, I.; Kousidou, O.; Karamanos, N.K. In vitro and in vivo antiresorptive effects of bisphosphonates in metastatic bone disease. In Vivo 2005, 19, 311–318. [Google Scholar] [PubMed]
- Sims, N.A.; Gooi, J.H. Bone remodeling: Multiple cellular interactions required for coupling of bone formation and resorption. In Seminars in Cell & Developmental Biology; Academic Press: Cambridge, MA, USA, 2008; pp. 444–451. [Google Scholar]
- Shieh, A.; Han, W.; Ishii, S.; Greendale, G.A.; Crandall, C.J.; Karlamangla, A.S. Quantifying the balance between total bone formation and total bone resorption: An index of net bone formation. J. Clin. Endocrinol. Metab. 2016, 101, 2802–2809. [Google Scholar] [CrossRef]
- Joshi, A.; Varthakavi, P.; Chadha, M.; Bhagwat, N. A study of bone mineral density and its determinants in type 1 diabetes mellitus. J. Osteoporos. 2013, 2013, 397814. [Google Scholar] [CrossRef]
- Saito, M.; Marumo, K. Collagen cross-links as a determinant of bone quality: A possible explanation for bone fragility in aging, osteoporosis, and diabetes mellitus. Osteoporos. Int. 2010, 21, 195–214. [Google Scholar] [CrossRef] [PubMed]
- Romero-Diaz, C.; Duarte-Montero, D.; Gutierrez-Romero, S.A.; Mendivil, C.O. Diabetes and Bone Fragility. Diabetes Ther. 2021, 12, 71–86. [Google Scholar] [CrossRef] [PubMed]
- Vashishth, D.; Gibson, G.J.; Khoury, J.I.; Schaffler, M.B.; Kimura, J.; Fyhrie, D.P. Influence of nonenzymatic glycation on biomechanical properties of cortical bone. Bone 2001, 28, 195–201. [Google Scholar] [CrossRef] [PubMed]
- Napoli, N.; Chandran, M.; Pierroz, D.D.; Abrahamsen, B.; Schwartz, A.V.; Ferrari, S.L.; Bone, I.; Group, D.W. Mechanisms of diabetes mellitus-induced bone fragility. Nat. Rev. Endocrinol. 2017, 13, 208–219. [Google Scholar] [CrossRef] [PubMed]
- Seibel, M.J. Biochemical markers of bone turnover: Part I: Biochemistry and variability. Clin. Biochem. Rev. 2005, 26, 97–122. [Google Scholar] [PubMed]
- Meier, C.; Eastell, R.; Pierroz, D.D.; Lane, N.E.; Al-Daghri, N.; Suzuki, A.; Napoli, N.; Mithal, A.; Chakhtoura, M.; Fuleihan, G.E.; et al. Biochemical Markers of Bone Fragility in Patients with Diabetes. J. Clin. Endocrinol. Metab. 2023, 108, e923–e936. [Google Scholar] [CrossRef]
- Coleman, R.E. The clinical use of bone resorption markers in patients with malignant bone disease. Cancer 2002, 94, 2521–2533. [Google Scholar] [CrossRef] [PubMed]
- Kanakis, I.; Nikolaou, M.; Pectasides, D.; Kiamouris, C.; Karamanos, N.K. Determination and biological relevance of serum cross-linked type I collagen N-telopeptide and bone-specific alkaline phosphatase in breast metastatic cancer. J. Pharm. Biomed. Anal. 2004, 34, 827–832. [Google Scholar] [CrossRef]
- Dedes, P.G.; Kanakis, I.; Gialeli, C.; Theocharis, A.D.; Tsegenidis, T.; Kletsas, D.; Tzanakakis, G.N.; Karamanos, N.K. Preclinical evaluation of zoledronate using an in vitro mimetic cellular model for breast cancer metastatic bone disease. Biochim. Biophys. Acta 2013, 1830, 3625–3634. [Google Scholar] [CrossRef] [PubMed]
- Gundberg, C.M. Biochemical markers of bone formation. Clin. Lab. Med. 2000, 20, 489–502. [Google Scholar] [CrossRef]
- Pectasides, D.; Farmakis, D.; Nikolaou, M.; Kanakis, I.; Kostopoulou, V.; Papaconstantinou, I.; Karamanos, N.K.; Economopoulos, T.; Raptis, S.A. Diagnostic value of bone remodeling markers in the diagnosis of bone metastases in patients with breast cancer. J. Pharm. Biomed. Anal. 2005, 37, 171–176. [Google Scholar] [CrossRef]
- Pectasides, D.; Nikolaou, M.; Farmakis, D.; Kanakis, I.; Gaglia, A.; Kountourakis, P.; Karamanos, N.K.; Economopoulos, T.; Raptis, S.A. Clinical value of bone remodelling markers in patients with bone metastases treated with zoledronic acid. Anticancer Res. 2005, 25, 1457–1463. [Google Scholar] [PubMed]
- Chi, G.; Qiu, L.; Ma, J.; Wu, W.; Zhang, Y. The association of osteoprotegerin and RANKL with osteoporosis: A systematic review with meta-analysis. J. Orthop. Surg. Res. 2023, 18, 839. [Google Scholar] [CrossRef] [PubMed]
- Boyce, B.F.; Xing, L. The RANKL/RANK/OPG pathway. Curr. Osteoporos. Rep. 2007, 5, 98–104. [Google Scholar] [CrossRef] [PubMed]
- Hofbauer, L.C.; Schoppet, M. Clinical implications of the osteoprotegerin/RANKL/RANK system for bone and vascular diseases. JAMA 2004, 292, 490–495. [Google Scholar] [CrossRef] [PubMed]
- Adil, M.; Khan, R.A.; Kalam, A.; Venkata, S.K.; Kandhare, A.D.; Ghosh, P.; Sharma, M. Effect of anti-diabetic drugs on bone metabolism: Evidence from preclinical and clinical studies. Pharmacol. Rep. 2017, 69, 1328–1340. [Google Scholar] [CrossRef] [PubMed]
- Cortizo, A.M.; Sedlinsky, C.; McCarthy, A.D.; Blanco, A.; Schurman, L. Osteogenic actions of the anti-diabetic drug metformin on osteoblasts in culture. Eur. J. Pharmacol. 2006, 536, 38–46. [Google Scholar] [CrossRef] [PubMed]
- Stage, T.B.; Christensen, M.-M.H.; Jørgensen, N.R.; Beck-Nielsen, H.; Brøsen, K.; Gram, J.; Frost, M. Effects of metformin, rosiglitazone and insulin on bone metabolism in patients with type 2 diabetes. Bone 2018, 112, 35–41. [Google Scholar] [CrossRef] [PubMed]
- Lecka-Czernik, B. Diabetes, bone and glucose-lowering agents: Basic biology. Diabetologia 2017, 60, 1163–1169. [Google Scholar] [CrossRef] [PubMed]
- Zhu, Z.N.; Jiang, Y.F.; Ding, T. Risk of fracture with thiazolidinediones: An updated meta-analysis of randomized clinical trials. Bone 2014, 68, 115–123. [Google Scholar] [CrossRef]
- Deeba, F.; Younis, S.; Qureshi, N.; Mustafa, T.; Iqbal, N.; Hussain, S. Effect of diabetes mellitus and anti-diabetic drugs on bone health-A review. J. Bioresour. Manag. 2021, 8, 13. [Google Scholar] [CrossRef]
- Glorie, L.; Behets, G.J.; Baerts, L.; De Meester, I.; d’Haese, P.C.; Verhulst, A. DPP IV inhibitor treatment attenuates bone loss and improves mechanical bone strength in male diabetic rats. Am. J. Physiol. -Endocrinol. Metab. 2014, 307, E447–E455. [Google Scholar] [CrossRef]
- Aroda, V.R.; Henry, R.R.; Han, J.; Huang, W.; DeYoung, M.B.; Darsow, T.; Hoogwerf, B.J. Efficacy of GLP-1 receptor agonists and DPP-4 inhibitors: Meta-analysis and systematic review. Clin. Ther. 2012, 34, 1247–1258.e1222. [Google Scholar] [CrossRef]
- Helsted, M.M.; Gasbjerg, L.S.; Lanng, A.R.; Bergmann, N.C.; Stensen, S.; Hartmann, B.; Christensen, M.B.; Holst, J.J.; Vilsbøll, T.; Rosenkilde, M.M. The role of endogenous GIP and GLP-1 in postprandial bone homeostasis. Bone 2020, 140, 115553. [Google Scholar] [CrossRef]
- Ljunggren, Ö.; Bolinder, J.; Johansson, L.; Wilding, J.; Langkilde, A.; Sjöström, C.; Sugg, J.; Parikh, S. Dapagliflozin has no effect on markers of bone formation and resorption or bone mineral density in patients with inadequately controlled type 2 diabetes mellitus on metformin. Diabetes Obes. Metab. 2012, 14, 990–999. [Google Scholar] [CrossRef] [PubMed]
- Lee, H.S.; Hwang, J.S. Impact of type 2 diabetes mellitus and antidiabetic medications on bone metabolism. Curr. Diabetes Rep. 2020, 20, 1–8. [Google Scholar] [CrossRef] [PubMed]
- Chaudhary, S.; Kulkarni, A. Metformin: Past, Present, and Future. Curr. Diab. Rep. 2024, 24, 119–130. [Google Scholar] [CrossRef] [PubMed]
- Sarkis-Onofre, R.; Catalá-López, F.; Aromataris, E.; Lockwood, C. How to properly use the PRISMA Statement. Syst. Rev. 2021, 10, 117. [Google Scholar] [CrossRef]
- Page, M.J.; McKenzie, J.E.; Bossuyt, P.M.; Boutron, I.; Hoffmann, T.C.; Mulrow, C.D.; Shamseer, L.; Tetzlaff, J.M.; Akl, E.A.; Brennan, S.E.; et al. The PRISMA 2020 statement: An updated guideline for reporting systematic reviews. Int. J. Surg. 2021, 88, 105906. [Google Scholar] [CrossRef]
- Jadad, A.R.; Moore, R.A.; Carroll, D.; Jenkinson, C.; Reynolds, D.J.; Gavaghan, D.J.; McQuay, H.J. Assessing the quality of reports of randomized clinical trials: Is blinding necessary? Control. Clin. Trials. 1996, 17, 1–12. [Google Scholar] [CrossRef]
- Hozo, S.P.; Djulbegovic, B.; Hozo, I. Estimating the mean and variance from the median, range, and the size of a sample. BMC Med. Res. Methodol. 2005, 5, 13. [Google Scholar] [CrossRef]
- Higgins, J.P.; Thompson, S.G.; Deeks, J.J.; Altman, D.G. Measuring inconsistency in meta-analyses. BMJ 2003, 327, 557–560. [Google Scholar] [CrossRef] [PubMed]
- Cai, T.-T.; Li, H.-Q.; Jiang, L.-L.; Wang, H.-Y.; Luo, M.-H.; Su, X.-F.; Ma, J.-H. Effects of GLP-1 receptor agonists on bone mineral density in patients with type 2 diabetes mellitus: A 52-week clinical study. BioMed Res. Int. 2021, 2021, 3361309. [Google Scholar] [CrossRef] [PubMed]
- Gallo, S.; Charbonnel, B.; Goldman, A.; Shi, H.; Huyck, S.; Darekar, A.; Lauring, B.; Terra, S.G. Long-term efficacy and safety of ertugliflozin in patients with type 2 diabetes mellitus inadequately controlled with metformin monotherapy: 104-week VERTIS MET trial. Diabetes Obes. Metab 2019, 21, 1027–1036. [Google Scholar] [CrossRef] [PubMed]
- Grey, A.; Bolland, M.; Fenwick, S.; Horne, A.; Gamble, G.; Drury, P.L.; Reid, I.R. The skeletal effects of pioglitazone in type 2 diabetes or impaired glucose tolerance: A randomized controlled trial. Eur. J. Endocrinol. 2014, 170, 255–262. [Google Scholar] [CrossRef] [PubMed]
- Hygum, K.; Harsløf, T.; Jørgensen, N.R.; Rungby, J.; Pedersen, S.B.; Langdahl, B.L. Bone resorption is unchanged by liraglutide in type 2 diabetes patients: A randomised controlled trial. Bone 2020, 132, 115197. [Google Scholar] [CrossRef] [PubMed]
- Rosenstock, J.; Frias, J.; Páll, D.; Charbonnel, B.; Pascu, R.; Saur, D.; Darekar, A.; Huyck, S.; Shi, H.; Lauring, B. Effect of ertugliflozin on glucose control, body weight, blood pressure and bone density in type 2 diabetes mellitus inadequately controlled on metformin monotherapy (VERTIS MET). Diabetes Obes. Metab. 2018, 20, 520–529. [Google Scholar] [CrossRef]
- Henriksen, K.; Byrjalsen, I.; Qvist, P.; Beck-Nielsen, H.; Hansen, G.; Riis, B.J.; Perrild, H.; Svendsen, O.L.; Gram, J.; Karsdal, M.A. Efficacy and safety of the PPARγ partial agonist balaglitazone compared with pioglitazone and placebo: A phase III, randomized, parallel-group study in patients with type 2 diabetes on stable insulin therapy. Diabetes/Metab. Res. Rev. 2011, 27, 392–401. [Google Scholar] [CrossRef] [PubMed]
- Bolinder, J.; Ljunggren, Ö.; Johansson, L.; Wilding, J.; Langkilde, A.; Sjöström, C.; Sugg, J.; Parikh, S. Dapagliflozin maintains glycaemic control while reducing weight and body fat mass over 2 years in patients with type 2 diabetes mellitus inadequately controlled on metformin. Diabetes Obes. Metab. 2014, 16, 159–169. [Google Scholar] [CrossRef]
- Van Lierop, A.; Hamdy, N.; Van der Meer, R.; Jonker, J.; Lamb, H.; Rijzewijk, L.; Diamant, M.; Romijn, J.; Smit, J.; Papapoulos, S. Distinct effects of pioglitazone and metformin on circulating sclerostin and biochemical markers of bone turnover in men with type 2 diabetes mellitus. Eur. J. Endocrinol. 2012, 166, 711–716. [Google Scholar] [CrossRef]
- Zinman, B.; Haffner, S.M.; Herman, W.H.; Holman, R.R.; Lachin, J.M.; Kravitz, B.G.; Paul, G.; Jones, N.P.; Aftring, R.P.; Viberti, G. Effect of rosiglitazone, metformin, and glyburide on bone biomarkers in patients with type 2 diabetes. J. Clin. Endocrinol. Metab. 2010, 95, 134–142. [Google Scholar] [CrossRef]
- Borges, J.; Bilezikian, J.; Jones-Leone, A.; Acusta, A.; Ambery, P.; Nino, A.; Grosse, M.; Fitzpatrick, L.; Cobitz, A. A randomized, parallel group, double-blind, multicentre study comparing the efficacy and safety of Avandamet (rosiglitazone/metformin) and metformin on long-term glycaemic control and bone mineral density after 80 weeks of treatment in drug-naive type 2 diabetes mellitus patients. Diabetes Obes. Metab. 2011, 13, 1036–1046. [Google Scholar] [PubMed]
- Rubin, M.; Manavalan, J.; Agarwal, S.; McMahon, D.; Nino, A.; Fitzpatrick, L.; Bilezikian, J. Effects of rosiglitazone vs metformin on circulating osteoclast and osteogenic precursor cells in postmenopausal women with type 2 diabetes mellitus. J. Clin. Endocrinol. Metab. 2014, 99, E1933–E1942. [Google Scholar] [CrossRef] [PubMed]
- Nybo, M.; Preil, S.R.; Juhl, H.F.; Olesen, M.; Yderstræde, K.; Gram, J.; Henriksen, J.E.; Rasmussen, L.M. Rosiglitazone decreases plasma levels of osteoprotegerin in a randomized clinical trial with type 2 diabetes patients. Basic Clin. Pharmacol. Toxicol. 2011, 109, 481–485. [Google Scholar] [CrossRef] [PubMed]
- Akyay, O.Z.; Canturk, Z.; Selek, A.; Cetinarslan, B.; Tarkun, İ.; Cakmak, Y.; Baydemir, C. The effects of exenatide and insulin glargine treatments on bone turnover markers and bone mineral density in postmenopausal patients with type 2 diabetes mellitus. Medicine 2023, 102, e35394. [Google Scholar] [CrossRef]
- Hegazy, S.K. Evaluation of the anti-osteoporotic effects of metformin and sitagliptin in postmenopausal diabetic women. J. Bone Miner. Metab. 2015, 33, 207–212. [Google Scholar] [CrossRef]
- Kanazawa, I.; Yamaguchi, T.; Yano, S.; Yamamoto, M.; Yamauchi, M.; Kurioka, S.; Sugimoto, T. Baseline atherosclerosis parameter could assess the risk of bone loss during pioglitazone treatment in type 2 diabetes mellitus. Osteoporos Int. 2010, 21, 2013–2018. [Google Scholar] [CrossRef] [PubMed]
- Li, R.; Xu, W.; Luo, S.; Xu, H.; Tong, G.; Zeng, L.; Zhu, D.; Weng, J. Effect of exenatide, insulin and pioglitazone on bone metabolism in patients with newly diagnosed type 2 diabetes. Acta Diabetol. 2015, 52, 1083–1091. [Google Scholar] [CrossRef]
- Esteghamati, A.; Afarideh, M.; Feyzi, S.; Noshad, S.; Nakhjavani, M. Comparative effects of metformin and pioglitazone on fetuin-A and osteoprotegerin concentrations in patients with newly diagnosed diabetes: A randomized clinical trial. Diabetes Metab. Syndr. Clin. Res. Rev. 2015, 9, 258–265. [Google Scholar] [CrossRef]
- Bilezikian, J.P.; Josse, R.G.; Eastell, R.; Lewiecki, E.M.; Miller, C.G.; Wooddell, M.; Northcutt, A.R.; Kravitz, B.G.; Paul, G.; Cobitz, A.R. Rosiglitazone decreases bone mineral density and increases bone turnover in postmenopausal women with type 2 diabetes mellitus. J. Clin. Endocrinol. Metab. 2013, 98, 1519–1528. [Google Scholar] [CrossRef]
- Hidayat, K.; Du, X.; Shi, B.M. Risk of fracture with dipeptidyl peptidase-4 inhibitors, glucagon-like peptide-1 receptor agonists, or sodium-glucose cotransporter-2 inhibitors in real-world use: Systematic review and meta-analysis of observational studies. Osteoporos Int. 2019, 30, 1923–1940. [Google Scholar] [CrossRef]
- Ruanpeng, D.; Ungprasert, P.; Sangtian, J.; Harindhanavudhi, T. Sodium-glucose cotransporter 2 (SGLT2) inhibitors and fracture risk in patients with type 2 diabetes mellitus: A meta-analysis. Diabetes Metab Res. Rev. 2017, 33, e2903. [Google Scholar] [CrossRef] [PubMed]
- Azharuddin, M.; Adil, M.; Ghosh, P.; Sharma, M. Sodium-glucose cotransporter 2 inhibitors and fracture risk in patients with type 2 diabetes mellitus: A systematic literature review and Bayesian network meta-analysis of randomized controlled trials. Diabetes Res. Clin. Pract. 2018, 146, 180–190. [Google Scholar] [CrossRef] [PubMed]
- Daniilopoulou, I.; Vlachou, E.; Lambrou, G.I.; Ntikoudi, A.; Dokoutsidou, E.; Fasoi, G.; Govina, O.; Kavga, A.; Tsartsalis, A.N. The Impact of GLP1 Agonists on Bone Metabolism: A Systematic Review. Medicina 2022, 58, 224. [Google Scholar] [CrossRef] [PubMed]
- Meng, J.; Ma, X.; Wang, N.; Jia, M.; Bi, L.; Wang, Y.; Li, M.; Zhang, H.; Xue, X.; Hou, Z.; et al. Activation of GLP-1 Receptor Promotes Bone Marrow Stromal Cell Osteogenic Differentiation through beta-Catenin. Stem Cell Rep. 2016, 6, 633. [Google Scholar] [CrossRef] [PubMed]
- Cheng, L.; Hu, Y.; Li, Y.Y.; Cao, X.; Bai, N.; Lu, T.T.; Li, G.Q.; Li, N.; Wang, A.N.; Mao, X.M. Glucagon-like peptide-1 receptor agonists and risk of bone fracture in patients with type 2 diabetes: A meta-analysis of randomized controlled trials. Diabetes Metab. Res. Rev. 2019, 35, e3168. [Google Scholar] [CrossRef] [PubMed]
- Zhang, Y.; Chen, Q.; Liang, Y.; Dong, Y.; Mo, X.; Zhang, L.; Zhang, B. Insulin use and fracture risk in patients with type 2 diabetes: A meta-analysis of 138,690 patients. Exp. Ther. Med. 2019, 17, 3957–3964. [Google Scholar] [CrossRef] [PubMed]
- Kennedy, R.L.; Henry, J.; Chapman, A.J.; Nayar, R.; Grant, P.; Morris, A.D. Accidents in patients with insulin-treated diabetes: Increased risk of low-impact falls but not motor vehicle crashes—A prospective register-based study. J. Trauma 2002, 52, 660–666. [Google Scholar] [CrossRef] [PubMed]
- Hofbauer, L.C.; Busse, B.; Eastell, R.; Ferrari, S.; Frost, M.; Muller, R.; Burden, A.M.; Rivadeneira, F.; Napoli, N.; Rauner, M. Bone fragility in diabetes: Novel concepts and clinical implications. Lancet Diabetes Endocrinol. 2022, 10, 207–220. [Google Scholar] [CrossRef] [PubMed]
- Hu, J.; Han, J.; Jin, M.; Jin, J.; Zhu, J. Effects of metformin on bone mineral density and bone turnover markers: A systematic review and meta-analysis. BMJ Open 2023, 13, e072904. [Google Scholar] [CrossRef]
- Napoli, N.; Conte, C.; Eastell, R.; Ewing, S.K.; Bauer, D.C.; Strotmeyer, E.S.; Black, D.M.; Samelson, E.J.; Vittinghoff, E.; Schwartz, A.V. Bone Turnover Markers Do Not Predict Fracture Risk in Type 2 Diabetes. J. Bone Miner. Res. 2020, 35, 2363–2371. [Google Scholar] [CrossRef]


| First Author, Year | Country | Study Design | Sample Size | Mean Age | Dose Regimes | Follow-Up Period | Type of Diabetes | JADAD Score |
|---|---|---|---|---|---|---|---|---|
| Intervention/Control | Intervention/Control | |||||||
| Ljunggren et al., 2012 [36] | Multiple | Multicentre, parallel group, double-blinded, placebo-controlled RCT | Dapagliflozin (N = 89), Placebo (N = 91) | Dapagliflozin (60.6 ± 8.2) Placebo (60.8 ± 6.9) | Dapagliflozin 10 mg | 50 weeks | T2DM | 5/5 |
| Cai et al., 2021 [44] | China | Single-blinded RCT | Exenatide (N = 19), Dulaglutide (N = 19), Insulin Glargine (N = 10), Placebo (N = 17) | Exenatide: (62.95 ± 1.70), Dulaglutide (57.42 ± 1.81), Glargine (64.36 ± 2.93), Placebo (62.00 ± 1.21) | Exenatide (2 mg/week), Dulaglutide (1.5 mg/week), Insulin glargine (6 unit/day), Placebo (once a week) | 52 weeks | T2DM | 4/5 |
| Gallo et al., 2019 [45] (VERTIS MET extension) | Multiple | Double-blinded, placebo-controlled, 26-week treatment period (Phase A), and a double-blinded, 78-week treatment extension period (Phase B) | Ertugliflozin (N = 207), Ertugliflozin (N = 205), Placebo/Glimepiride (N = 209). | Ertugliflozin 5 mg (56.6 ± 8.2), Ertugliflozin 15 mg (56.9 ± 9.4), Placebo/Glimepiride (56.5 ± 8.7). | Ertugliflozin 5 mg, Ertugliflozin 15 mg, Placebo/Glimepiride. | 104 weeks (26 weeks Phase A, 78 weeks Phase B) | T2DM | 4/5 |
| Grey et al., 2014 [46] | Australia, New Zealand | Double-blinded, placebo-controlled RCT | Pioglitazone (N = 43), Placebo (N = 43) | Pioglitazone (38–84) Placebo (48–79) | Pioglitazone 30 mg daily | 12 months | T2DM | 5/5 |
| Hygum et al., 2020 [47] | Denmark | Double-blinded, placebo-controlled RCT | Liraglutide (N = 30), Placebo (N = 30) | Liraglutide (62 ± 8.38) Placebo (64 ± 3.83) | Liraglutide 1.8 mg daily | 26 weeks | T2DM | 4/5 |
| Rosenstock et al., 2018 [48] (VERTIS MET trial) | Multiple | Multicentre, parallel group, double-blinded RCT | Ertugliflozin 5 mg (N = 207), Ertugliflozin 15 mg (N = 205), Placebo (N = 209) | Ertugliflozin 5 mg (56.6 ± 8.1), Ertugliflozin 15 mg (56.9 ± 9.4), Placebo (56.5 ± 8.7) | Ertugliflozin 5 mg daily, Ertugliflozin 15 mg daily | 26 weeks | T2DM | 4/5 |
| Henriksen et al., 2011 [49] | Demark, Finland, Sweden | Phase 3, parallel group, multi-centred double-blinded RCT | Balaglitazone (N = 97), Balaglitazone (N = 97), Pioglitazone (N = 102), Placebo (N = 106) | Balaglitazone 10 mg (61.0 ± 8.8), Balaglitazone 20 mg (60.5 ± 9), Pioglitazone (60.1 ± 8.6) Placebo (60.9 ± 7.8) | Balaglitazone 10 mg daily, Balaglitazone 20 mg daily, Pioglitazone 45 mg daily | 26 weeks | T2DM | 4/5 |
| Bolinder et al., 2013 [50] | Bulgaria, Czech Republic, Hungary, Poland and Sweden | Double-blinded, placebo-controlled RCT | Dapagliflozin (N = 91), Placebo (N = 91) | Women (55–75) Men (30–75) | Dapagliflozin 10 mg daily | 102 weeks | T2DM | 5/5 |
| van Lierop et al., 2012 [51] | Netherlands | Prospective, double-blinded, two centred, parallel group RCT | Pioglitazone (N = 34), Metformin (N = 37), Placebo (N = 30) | Pioglitazone (56.5 ± 5.6) Metformin (55.0 ± 16.4) | Pioglitazone 30 mg daily, Metformin 1 gm twice daily | 24 weeks | T2DM | 4/5 |
| Zinman et al., 2010 [52] | 17 countries | Double-blinded, multi-centred, parallel group, RCT | Rosiglitazone (N = 549), Metformin (N = 551), Glyburide (N = 505) | Rosiglitazone (56.9 ± 10.0), Metformin (56.6 ± 9.4), Glyburide (66.7 ± 10.0) | Rosiglitazone 4 mg twice daily (N = 549), Metformin 1 gm twice daily (N = 551), Glyburide 7.5 mg twice daily (N = 505) | 12 months | T2DM | 4/5 |
| Borges et al., 2011 [53] | 9 countries | Phase 4. Multi-centred, double-blinded RCT | Rosiglitazone + Metformin (N = 344), Metformin (N = 334) | Rosiglitazone + Metformin (51.5 ± 10.5), Metformin (50.7 ± 10.5) | Rosiglitazone + Metformin 8 mg/200 mg, Metformin 2000 mg daily | 80 weeks | T2DM | 4/5 |
| Rubin et al., 2014 [54] | Multiple | Multi-centred, double-blinded RCT | Rosiglitazone (N = 38), Metformin (N = 35) | Rosiglitazone (62.8 ± 6), Metformin (62.0 ± 5) | Rosiglitazone 8 mg daily, Metformin 2000 mg daily | 52 weeks | T2DM (Post-menopausal women) | 4/5 |
| Nybo et al., 2011 [55] | Denmark | Multi-centred, double-blinded RCT | 371 (Male 229, female 142) | 56.2 ± 8.4 | Rosiglitazone 8 mg daily, Metformin 2000 mg daily | 24 months | T2DM | 3/5 |
| Akyay et al., 2023 [56] | Turkiye | Randomized, placebo-controlled, open-label, 2-arm parallel-group study | Exenatide (N = 15), Insulin Glargine (N = 15) | Exenatide (52.73 ± 4.68), Insulin Glargine (53.00 ± 4.07) | Exenatide 10 μg twice daily, Insulin Glargine 0.2 IU/Kg | 24 weeks | T2DM | 3/5 |
| Hegazy et al., 2015 [57] | Egypt | RCT | Metformin (N = 20), Sitagliptin (N = 20) | 58 to 66 years | Metformin 1000 mg daily, Sitagliptin 100 mg daily | 12 weeks | T2DM (Post-menopausal women) | 3/5 |
| Kanazawa et al., 2010 [58] | Japan | Open-label RCT | Pioglitazone 15–30 mg/day (n = 22), Metformin 500–750 mg/day (n = 23) | Pioglitazone (67 ± 10), Metformin (66 ± 10) | Pioglitazone 15–30 mg/day, Metformin 500–750 mg/day | 12 months | T2DM (Post-menopausal women) | 3/5 |
| Li et al., 2015 [59] | China | Two centres, parallel group RCT | Exenatide (N = 20), Pioglitazone (N = 21), Insulin (N = 21) | Exenatide (45.7 ± 10.5), Pioglitazone (51.3 ± 8.4), Insulin (53.0 ± 10.9) | Exenatide 10 μg twice daily, Pioglitazone 45 mg once daily, Insulin 0.4 IU/kg daily. | 24 weeks | T2DM | 3/5 |
| Esteghamati et al., 2015 [60] | Iran | open-label, parallel-group, RCT | Metformin (N = 42), Pioglitazone (N = 46) | Metformin: (49.00 ± 1.66) (Women), (49.37 ± 2.06) (men). Pioglitazone (53.52 ± 1.57) (women), (49.54 ± 1.98) (men) | Metformin 1000 mg daily, Pioglitazone 30 mg daily | 12 weeks | T2DM | 3/5 |
| Bilezikian et al., 2013 [61] | Multiple | Double-blinded, multicentred RCT | Rosiglitazone (N = 114), Metformin (N = 111) | Rosiglitazone (63.6 ± 6.61), Metformin (64.0 ± 6.46) | Rosiglitazone 8 mg daily, Metformin 2000 mg daily | 52 weeks | T2DM (Post-menopausal women) | 4/5 |
| First Author, Year | Intervention/Control with Dosage | Mean Changes from Baseline | |||
|---|---|---|---|---|---|
| OCN (Intervention/Control) | B-ALP (Intervention/Control) | OPG (Intervention/Control) | RANK-L (Intervention/Control) | ||
| Borges et al., 2011 [53] | Rosiglitazone + Metformin 8 mg/200 mg (N = 344) Metformin 2000 mg (N = 334) | Rosiglitazone + metformin: −27.1% Metformin: −20.9% | |||
| Rubin et al., 2014 [54] | Rosglitazone 8 mg daily (N = 38) Metformin 2000 mg daily (N = 35) | Rosiglitazone: −9.2% Metformin: −22.9% | |||
| Akyay et al., 2023 [56] | Exenatide 10 μg twice/day Insulin Glargine 0.2 IU/Kg | Exenatide: 3.4% Insulin Glargine: 7.6% | Exenatide: 45.07% Insulin Glargine: −9.1% | Exenatide: 40.1% Insulin Glargine: 31.4% | |
| Hegazy et al., 2015 [57] | Metformin 1000 mg daily (N = 20) Sitagliptin 100 mg daily (N = 20) | Metformin −1.3 ± 0.9 μg/L Sitagliptin −2.05 ± 5.4 μg/L | |||
| Esteghamati et al., 2015 [60] | Metformin 1000 mg daily (N = 42) Pioglitazone 30 mg daily (N = 46) | Metformin: Men −2.12 ± 1.62 pmol/L, Women −2.61 ± 1.08 pmol/L Pioglitazone: Men −1.18 ± 0.49 pmol/L, Women −0.39 ± 0.39 pmol/L | |||
| Li et al., 2015 [59] | Exenatide 10 μg 2xdaily (N = 20), Pioglitazone 45 mg daily (N = 21), Insulin 0.4 IU/kg daily (N = 21) | Exenatide −0.619 ± 0.728 ng/mL Pioglitazone −0.150 ± 0.691 ng/mL Insulin 0.637 ± 0.787 ng/mL | |||
| Henriksen et al., 2011 [49] | Balaglitazone 10 mg (N = 97), Balaglitazone 20 mg (N = 97), Pioglitazone 45 mg (N = 102), Placebo (N = 106) | Balaglitazone 10 mg 21% Balaglitazone 20 mg 18% Pioglitazone 14% Placebo 30% | |||
| Nybo et al., 2011 [55] | Rosiglitazone 8 mg daily, Metformin 2000 mg daily | Change from baseline of 8 different randomized groups: NPH + placebo: 20 ± 343 ng/L, NPH + Metformin: 110 ± 319 ng/L, NPH + Rosiglitazone: −90 ± 531 ng/L, NPH + metformin+ Rosiglitazone: −100 ± 409 ng/L, Aspart+ placebo: 5 ± 274 ng/L, Aspart + Metformin: 80 ± 389 ng/L, Aspart + Rosiglitazone: −53 ± 427 ng/L, Aspart + Metformin + Rosiglitazone: −48 ± 318 ng/L | |||
Disclaimer/Publisher’s Note: The statements, opinions and data contained in all publications are solely those of the individual author(s) and contributor(s) and not of MDPI and/or the editor(s). MDPI and/or the editor(s) disclaim responsibility for any injury to people or property resulting from any ideas, methods, instructions or products referred to in the content. |
© 2024 by the authors. Licensee MDPI, Basel, Switzerland. This article is an open access article distributed under the terms and conditions of the Creative Commons Attribution (CC BY) license (https://creativecommons.org/licenses/by/4.0/).
Share and Cite
Saadi, M.S.S.; Das, R.; Mullath Ullas, A.; Powell, D.E.; Wilson, E.; Myrtziou, I.; Rakieh, C.; Kanakis, I. Impact of Different Anti-Hyperglycaemic Treatments on Bone Turnover Markers and Bone Mineral Density in Type 2 Diabetes Mellitus Patients: A Systematic Review and Meta-Analysis. Int. J. Mol. Sci. 2024, 25, 7988. https://doi.org/10.3390/ijms25147988
Saadi MSS, Das R, Mullath Ullas A, Powell DE, Wilson E, Myrtziou I, Rakieh C, Kanakis I. Impact of Different Anti-Hyperglycaemic Treatments on Bone Turnover Markers and Bone Mineral Density in Type 2 Diabetes Mellitus Patients: A Systematic Review and Meta-Analysis. International Journal of Molecular Sciences. 2024; 25(14):7988. https://doi.org/10.3390/ijms25147988
Chicago/Turabian StyleSaadi, Md Sadman Sakib, Rajib Das, Adhithya Mullath Ullas, Diane E. Powell, Emma Wilson, Ioanna Myrtziou, Chadi Rakieh, and Ioannis Kanakis. 2024. "Impact of Different Anti-Hyperglycaemic Treatments on Bone Turnover Markers and Bone Mineral Density in Type 2 Diabetes Mellitus Patients: A Systematic Review and Meta-Analysis" International Journal of Molecular Sciences 25, no. 14: 7988. https://doi.org/10.3390/ijms25147988