Article

Analysis of Amyloid Fibrillation of Two Family 1 Glycoside Hydrolases

by
Miguel A. Rodríguez-López
1,2,
José María Coll-Marqués
3,
David Talens-Perales
3,
Julia Marín-Navarro
3,4,
Julio Polaina
3,* and
Edgar Vázquez-Contreras
2,*
1
Postgraduate in Natural Sciences and Engineering, Autonomous Metropolitan University, Cuajimalpa, Mexico City 05348, Mexico
2
Departament of Natural Sciences, Autonomous Metropolitan University, Cuajimalpa, Mexico City 05348, Mexico
3
Institute of Agrochemistry and Food Technology, Spanish National Research Council (IATA-CSIC), 46980 Paterna, Valencia, Spain
4
Departament of Biochemistry and Molecular Biology, University of Valencia, 46100 Burjassot, Valencia, Spain
*
Authors to whom correspondence should be addressed.
Int. J. Mol. Sci. 2024, 25(15), 8536; https://doi.org/10.3390/ijms25158536
Submission received: 18 June 2024 / Revised: 29 July 2024 / Accepted: 31 July 2024 / Published: 5 August 2024
(This article belongs to the Section Biochemistry)

Abstract

:
The formation and analysis of amyloid fibers by two β-glucosidases, BglA and BglB, belonging to the GH1 enzyme family, are reported. Both proteins have the (β/α)8 TIM-barrel fold, which is characteristic of this family and is also the most common protein structure. BglA is an octamer, whereas BglB is a monomer. Amyloid fibrillation using pH and temperature as perturbing agents was investigated using fluorescence spectroscopy as a preliminary approach and corroborated using wide-field optical microscopy, confocal microscopy, and field-emission scanning electron microscopy. These analyses showed that both enzymes fibrillate at a wide range of acidic and alkaline conditions and at several temperature conditions, particularly at acidic pH (3–4) and at temperatures between 45 and 65 °C. Circular dichroism spectroscopy corroborated the transition from an α-helix to a β-sheet secondary structure of both proteins in conditions where fibrillation was observed. Overall, our results suggest that fibrillation is a rather common phenomenon caused by protein misfolding, driven by a transition from an α-helix to a β-sheet secondary structure, that many proteins can undergo if subjected to conditions that disturb their native conformation.

1. Introduction

Amyloidoses are a type of deposition disease characterized by the formation and accumulation of protein complexes. They are generated by the coalescence of unfolded protein molecules that grow to form an orderly braid-shaped pattern. Amyloidoses include some of the most threatening human ailments because of their growing incidence, particularly among elderly people, such as type 2 diabetes, Alzheimer’s and Parkinson’s diseases, and many other disorders affecting heart, liver, kidneys, and virtually every other organ [1,2]. Whereas proteins with different structure can be precursors of the aggregates that give rise to deposition diseases, in all cases, the formation of fibrillar aggregates occurs by the adhesion of β-strand protein segments into β-sheet structures, which is considered a critical event at the onset of the pathological process [2,3,4,5,6]. Amyloid plaques, characteristically observed in the analysis of tissues affected by neurodegenerative diseases, are formed by the accumulation of protein fibrils [7,8,9,10,11].
In vitro analysis carried out with different proteins involved in amyloidoses constitutes a powerful approach to decipher the molecular mechanism of fibrillogenesis. These studies [12,13,14] eventually should lead to the discovery of molecules that inhibit the process and help design therapies against protein deposition diseases. We have studied the formation of amyloid fibers using two enzymes belonging to the glycoside hydrolase family 1 (GHF1). Proteins of this family are characterized by having a TIM-barrel structure, the most common structure cataloged in the Protein Data Bank [15]. Outstanding members of the GHF1 are the non-enzymatic Klotho proteins, whose deficiency has been found to be a determinant factor in human aging [16,17,18]. Another relevant member of this family is the human intestinal lactase-phlorizin hydrolase (LPH), whose deficiency causes lactose intolerance [19]. The two enzymes used here (BglA and BglB) are β-glucosidases isolated from the bacterium Paenibacillus polymyxa. They differ in their quaternary structure: BglA is as an octamer, whereas BglB is a monomer [20,21,22,23]. BglA and BglB were chosen for two reasons. Firstly, their common 3D structure (TIM barrel) makes them suitable representatives of the average protein. Secondly, their enzymatic activity can be measured very easily, which is a very convenient property to correlate the structure and functional state of a protein. As a first approach, structural changes that could result in fibrillation were induced by changing pH and temperature conditions and then monitored using fluorescence spectroscopy. Extrinsic fluorescence upon protein binding to thioflavin T (ThT) and 8-anilino-1-naphthalenesulfonic acid (ANS) fluorophores as well as intrinsic fluorescence and enzyme activity were measured. The formation of fibers was further characterized by optical and field-emission scanning electron microscopy. The results obtained supply relevant data relating to protein structure, amyloid fibrillation, and function.

2. Results and Discussion

2.1. Amylogenic Regions in BglA and BglB Structures

BglA and BglB were taken as representative examples of the most common protein structure, the TIM barrel [15]. The amino acid sequence of both proteins was analyzed using Waltz, an algorithm that predicts the existence of amylogenic regions in proteins based on the input of a large number of amylogenic peptides whose properties have been characterized experimentally [24,25]. It is becoming increasingly clear that amyloid fibrillogenesis is not restricted to a number of polypeptides associated with certain diseases but rather is a common feature of proteins determined by the presence of short hydrophobic stretches of amino acids [4,26,27,28,29]. Figure 1A shows the location of these regions, depicted in purple and red for BglA and BglB, respectively. Figure 1B summarizes the composition of the four potentially amylogenic sequence segments present in BglA and the eight in BglB. Figure 1C displays the superposition of the three-dimensional structures of the proteins, with the positions of the regions highlighted in the same colors used in panel A. Two of the BglA amylogenic regions are situated within the β-core of the TIM-barrel structure, involving loops and β-sheets, while the other two regions are in peripheral α-helices. For BglB, two regions appear in hydrophilic α-helices, whereas the others are in loops and β-sheets mostly in the interior of the barrel. Despite the close similarity between BglA and BglB, the regions predicted by Waltz are not found in the same positions, as shown in Figure 1C. There is only one predicted amylogenic region that is shared between both proteins, and it is located in their β-sheet core (shown in yellow in Figure 1C), spanning from residues 290 to 297 in BglA and from residues 299 to 306 in BglB (indicated by asterisks in Figure 1B). This suggests that despite their similarity in sequence and three-dimensional structure, BglA and BglB might have differences in their amylogenic properties.

2.2. Fluorometric and Microscopic Analysis of BglA and BglB Solutions at a Wide Range of pH and Temperature Conditions

Changes in pH and temperature affect protein conformation and hence have an impact on amyloid fibril formation [30]. ThT fluorescence is commonly used for detecting and quantifying amyloid fibrils [31,32]. Therefore, we monitored fluorescence upon the addition of ThT to BglA and BglB as an indication of fibrillation for these proteins. The results shown in Figure 2 show an increase in fluorescence after a few hours of incubation at both acidic and alkaline pH values for both proteins at a concentration of 1 mgmL−1. This suggests that they form amyloid structures, which is in agreement with the presence of amyloid regions in their sequences. In both cases, a maximum value of fluorescence is observed at a pH of 4.
As a complementary approach to monitor structural changes of the protein structure, we used ANS, another fluorophore frequently employed for studying protein folding and other questions related to protein structure, including the formation of amyloid fibers [33,34]. Similarly to what was observed for ThT, the results depicted in Figure 3 show an increase in ANS fluorescence for BglA and BglB at both acidic and alkaline pH values. However, for ANS, the fluorescence profiles of the two proteins are quite different (Figure 3C), with BglA showing a sharp increase at a pH of around 4. This likely reflects the main structural difference between the two proteins, which is their quaternary structure, as BglA is an octamer whereas BglB is a monomer. In oligomeric proteins, ANS binds with high affinity to hydrophobic regions that maintain the quaternary structure when they become exposed by partial unfolding, whereas it shows little interaction with fully unfolded proteins.
A further approach to investigate changes in the protein structure and its connection with amyloid fibrillation was measuring the intrinsic and extrinsic protein fluorescence, as well as residual catalytic activity, at different values of temperature and pH. Two procedures were used to measure intrinsic fluorescence. In the first method, the sample was irradiated at 280 nm, which excites all intrinsic fluorophores: tryptophan, tyrosine, and phenylalanine. In the second approach, the excitation wavelength was 295 nm, which selectively targets tryptophan residues. BglA and BglB are not ideal models for these studies due to their high number of aromatic residues. BglA has 61 aromatic residues while BglB has 59, which for both proteins constitute more than 13% of their respective amino acid content. Nevertheless, they still can provide useful information regarding major changes in the protein three-dimensional structure. Extrinsic fluorescence, with the same two fluorophores utilized in previous analyses, ThT and ANS, was also measured. Finally, the native, functional state of the enzymes was assessed by measuring their catalytic activity using p-nitrophenyl-β-D-glucopyranoside as the substrate. Table 1 shows the overall result of these experiments. Both proteins, BglA and BglB, remain stable at pH 7.0 and 25 ºC without significant changes in intrinsic or extrinsic florescence or enzyme activity. In general terms, all treatments departing from these conditions that represent a “comfort zone” for the proteins imply some degree of unfolding of the native structure, as indicated by changes in intrinsic or ANS fluorescence. When protein fibrillation was monitored with the ThT probe, the highest values were observed at pH 3 for both proteins. In the case of BglA, such an increase was similar at 25 or 65 °C. Surprisingly, at 45 °C, ThT fluorescence was reduced after 16 h of incubation. This may be caused by a partial, transitory denaturation of the enzyme that releases ThT bound to native β-structures (see below). For BglB, at pH 3, ThT fluorescence increased sharply at 45 and 65, being higher at 45 °C. At pH 7, increased ThT fluorescence was only observed for BglB at 45 and 65 °C. At pH 12, no increase in ThT fluorescence for either of the two proteins was observed. Remarkably, ThT fluorescence increase, henceforth fibrillation, in some conditions, i.e., pH 3, 25 °C for BglA and BglB; and pH 7, 45 °C for BglB, was not associated with a substantial loss of catalytic activity.
Hen egg white lysozyme (HEWL), a glycoside hydrolase belonging to the GH22 family, has been extensively used to study protein fibrillation [35]. The enzymes used in this study constitute a suitable alternative model system. The simplicity of their enzyme assay offers a robust method to monitor the functional state of the protein. Furthermore, the transitions of these enzymes into the amyloid state can be utilized for screening compounds that have the potential to interfere with or even reverse this process. This opens possibilities for identifying compounds that can modulate amyloid formation and potentially serve as therapeutic agents.
To establish a possible correlation between increased fluorescence and fibrillation, protein samples (1 mgmL−1) were incubated under the same pH and temperature conditions as in Table 1 and observed under the microscope after different incubation times. Bright-field illumination and ThT extrinsic fluorescence were used for the analysis. Figure 4 shows the results observed after 8 days of incubation. Some of the samples analyzed that showed protein aggregation under bright-field illumination displayed fibrillar structures when observed with ThT fluorescence. At pH 3, protein aggregates, reminiscent of amyloid plaques, appeared in BglA and BglB at all three tested temperatures, although fewer aggregates were observed at 25 °C. Unexpected ThT fluorescence decrease observed at 45 °C after 16 h for BglA (Table 1) should be a transient phase, as abundant fibrillation was observed at a later stage (8 days, Figure 4). At pH 7, BglA yielded “amyloid plaques” only at 45 °C, whereas for BglB, these aggregates were observed at 45 and 65 °C. No such structures appeared at pH 12.
Figure 5 shows the results of a more detailed analysis of the protein precipitates observed in Figure 4. For this analysis, the proteins were stained with ThT and Congo red, two dyes that specifically stain amyloid fibers. Microscopic observation, which was carried out at higher magnification, demonstrated that the glucosidases yielded fibrillar structures. Congo red staining and subsequent observation under polarized light, revealed birefringence in the samples, as it is characteristic for amyloid fibers. The birefringent colors observed were blue and red. Although it is generally assumed that the green color is crucial for diagnosing amyloid structures, it has been clearly shown that Congo red staining can result in other colors [36,37,38].

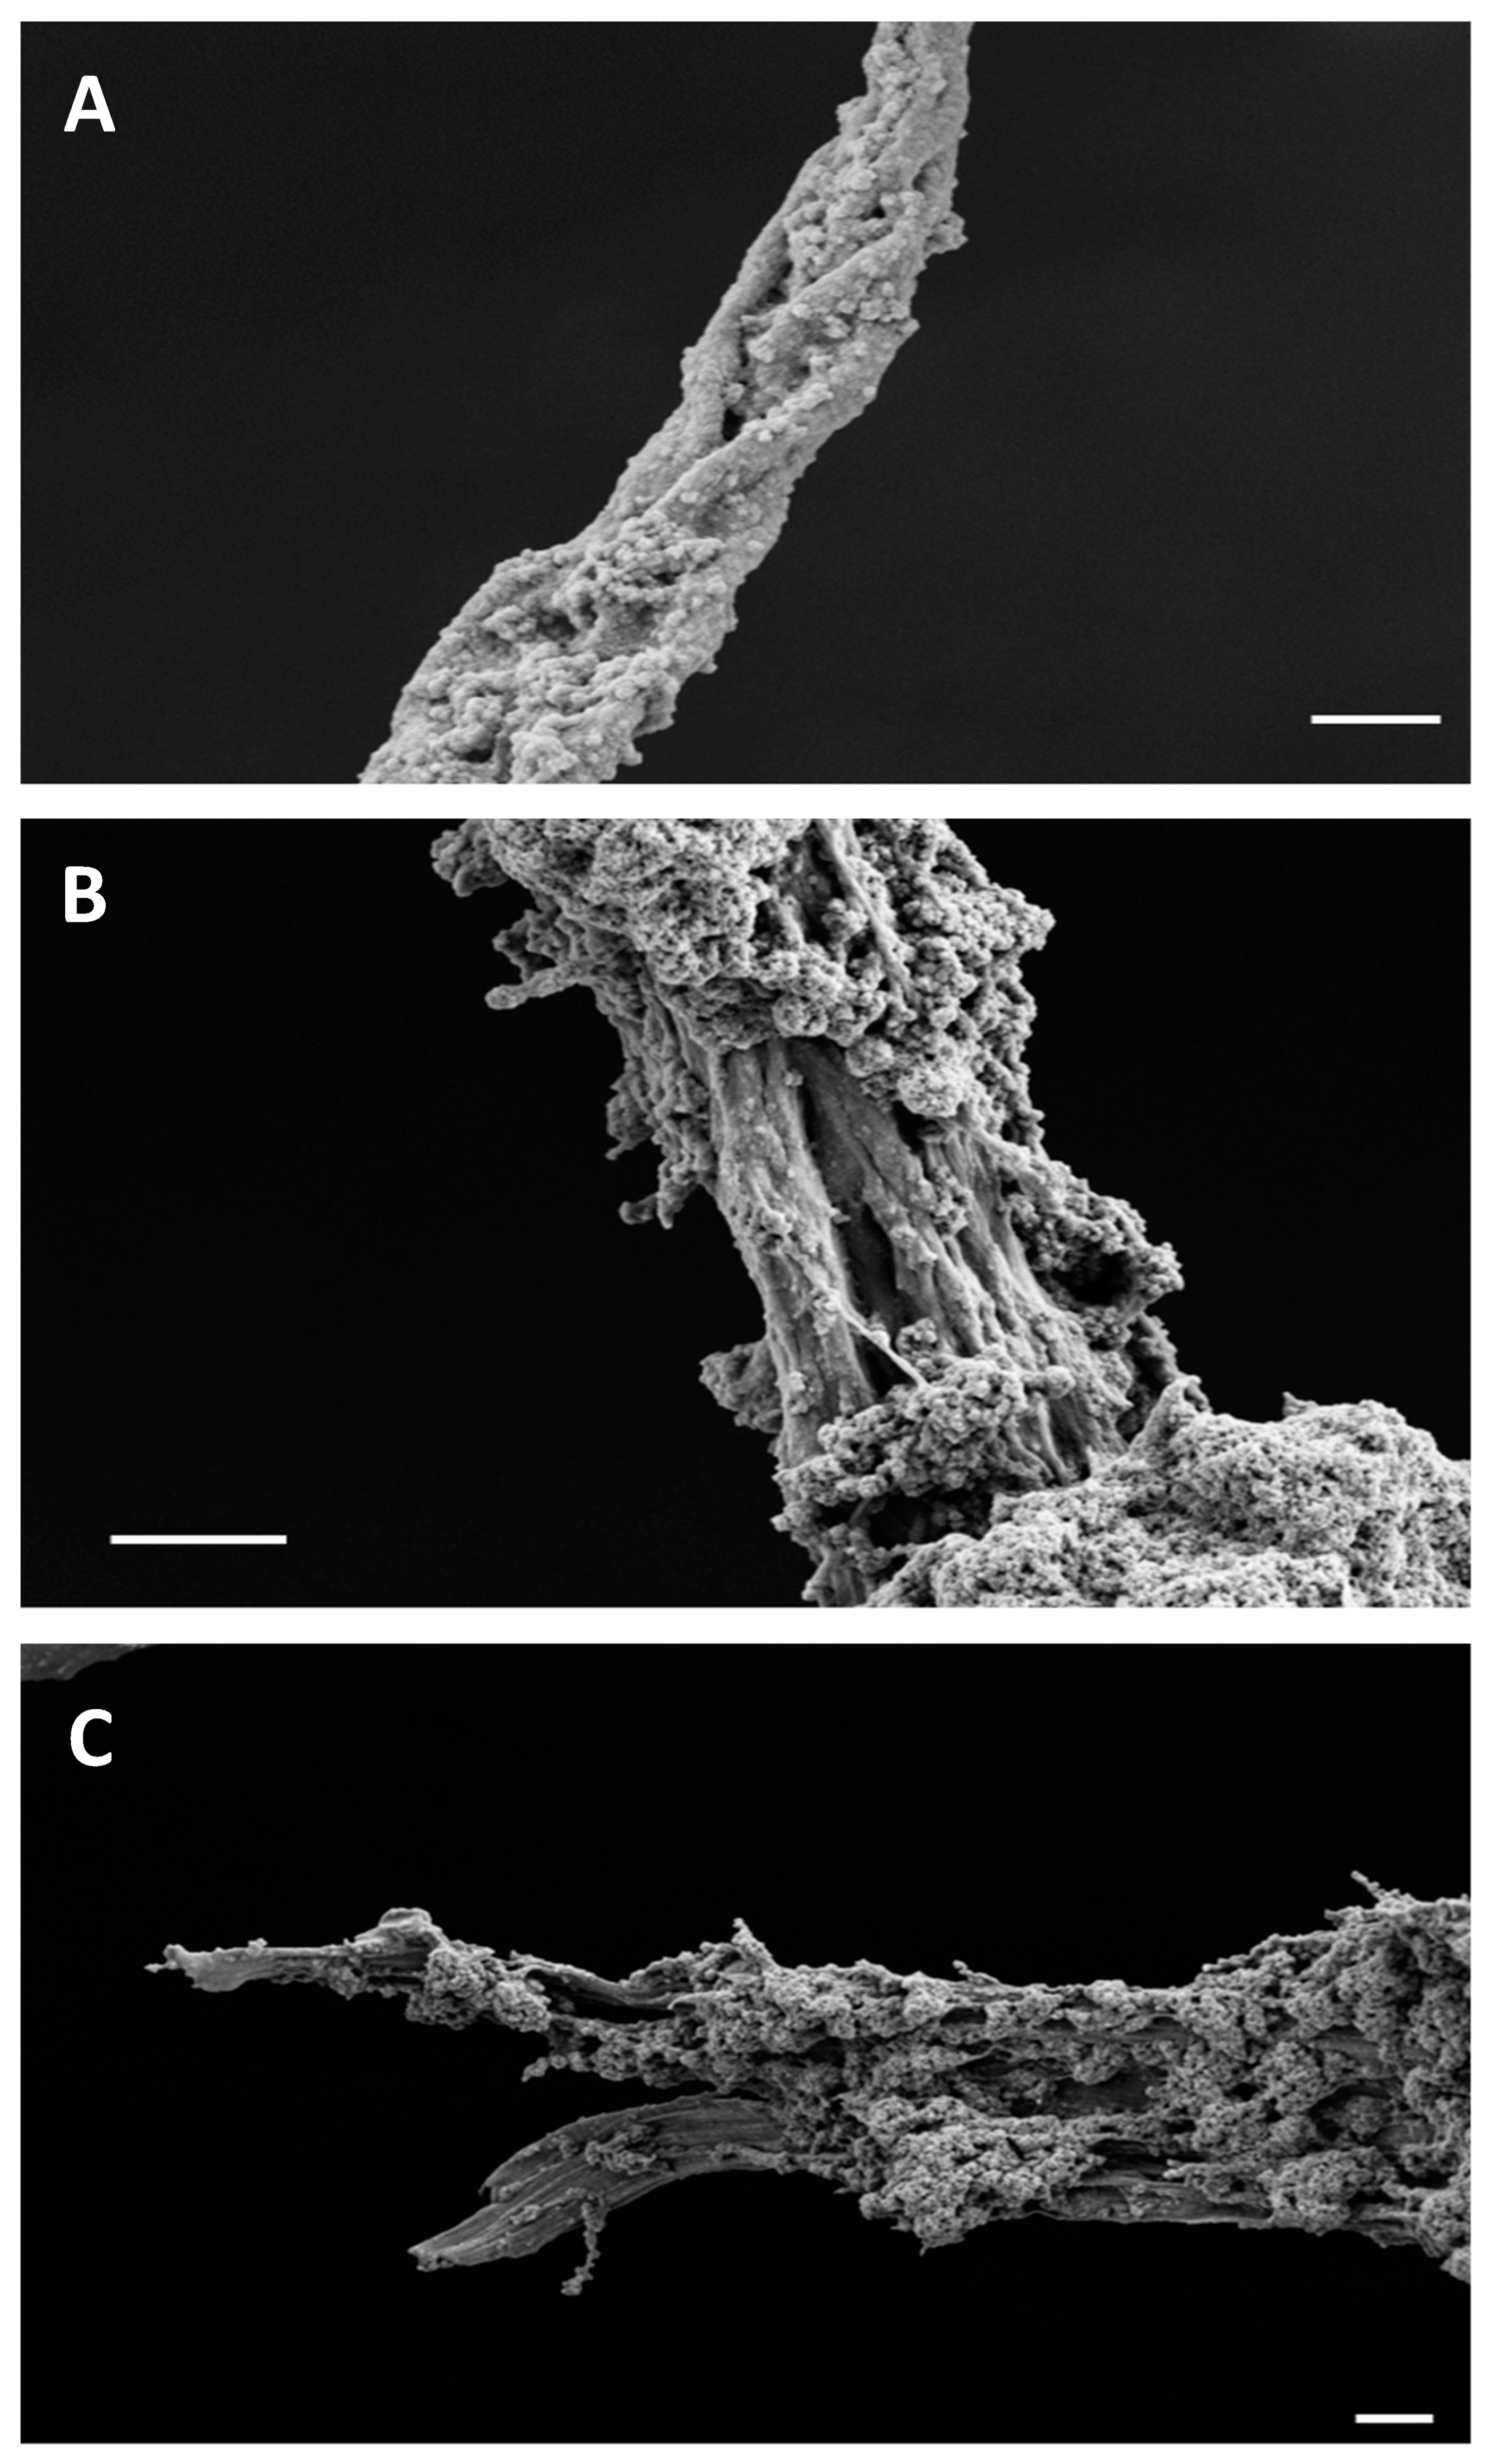
2.3. FESEM and Confocal Microscopy Analysis of Amyloid Fibers

The detailed morphology of the amyloid structures formed by BglA and BglB was investigated by field-emission scanning electron microscopy (FESEM). This procedure has been used in the study of these kinds of structures and provides valuable insights into their morphology and aggregation properties [39]. Figure 6A shows a BglB superstructure in which tightly packed protofilament bundles of around 200–300 nm each intertwine with each other, forming a braid-like structure with a thickness of approximately 1 µm. Each of these bundles is likely the result of the association of hundreds of protein protofilaments. Figure 6B illustrates another BglB superstructure formed by the coalescence of several 1 µm filaments. Intermediate 200 nm filaments are also visible. Figure 6C displays a view of the distal region of a mature superstructure of BglA protein. Amyloid fibrils have been reported to be generally composed by 2–6 protofilaments, showing diameters ranging from 5 to 15 nm, although fibrils with more than 100 protofilaments and a diameter of up to 150 nm have also been described [11,40]. FESEM observations reported here show very large braid-like structures with a thickness of 1 µm. These braids are formed by clearly visible fibers with a diameter of around 200–300 nm each, which in turn are likely composed by hundreds of tightly packed protofibrils. Thus, the large braid-like structures represent a superior degree of structure, comparable with what has been described for insulin upon multiple rounds of self-seeding [41]. The precise atomic arrangement of these structures can be revealed by CryoEM analysis [42].
Finally, confocal microscopy was also used to analyze the fibrillar material obtained with BglA and BglB samples, incubated under the conditions described for Figure 4 and stained with ThT. The results shown in Figure 7 allowed us to visualize an uninterrupted thread that clearly shows the expected properties of an amyloid fiber.

2.4. Circular Dichroism Spectroscopy Analysis

The results of the analysis of fluorescence emission mediated by the binding of ThT to BglA and BglB (Figure 2) suggested that both proteins could fibrillate under different conditions of pH. Moreover, fibril formation seemed to be favored at a pH of around 4. This observation was subsequently confirmed by both light and electron microscopy. At the molecular level, protein amyloid fibrillation is characterized in all cases by the formation of a β-sheet structure, which is preceded by a transition of the secondary structure elements of the protein involved from an α-helix to a β-strand [2,3,4,5,6]. This transition can be best analyzed by CD and is revealed by a shift in the spectrum with an increasing intensity of the β-sheet signal, showing a negative peak around 218 nm, the so called “β-sheet CD signature”. Therefore, we carried out a CD analysis of BglA and BglB, comparing the spectra of the proteins in their native state (25 °C, pH 7) with the conditions at which the ThT peak was observed (25 °C, pH 4). The results presented in Figure 8 clearly show the expected sharp transition to a β-sheet structure. Table 2 represents the numerical values of secondary structure content for both proteins.

3. Materials and Methods

3.1. Enzyme Production and Purification

Previously described mutant versions of BglA and BglB with increased stability were used in this study: BglA E96K, T385A, N411S, M416I, and N437K [22]; and BglB H62R, N223Y, and M319I [23]. The gene coding sequences were inserted in the E. coli expression vector pQE80L (Qiagen) and cloned in the strain Rosetta2 (EMD Millipore). His-tagged protein was purified from transformant clones using nickel-affinity chromatography. The purified protein was stored at 4 °C in a buffer containing Tris-HCl (20 mM) and NaCl (50 mM) at pH 7.2.

3.2. Extrinsic Fluorescence

Fluorescence caused by the binding of the proteins to either ThT or ANS was monitored on a CLARIOstar (BMG, LABTECH GmbH, Ortenberg, Germany) microplate reader with a gain setting of 1500 units under specific pH and temperature conditions. The protein concentration was 1 mgmL−1. ThT and ANS were added at a final concentration of 10 μM each in 50 mM sodium phosphate buffer at the different pH values. ThT fluorescence was measured at 450 nm (excitation) and 485 nm (emission), ANS fluorescence was measured at 380 nm (excitation) and 470 nm (emission). All experiments were performed in triplicate in a 96-well black plate with a final volume of 100 μL. Measurements were recorded every 30 min over a total time of 16 h. Temperature was controlled using the same CLARIOstar microplate reader, except in the case of 65 °C, where the 96-well plate was kept in a thermostated incubator.

3.3. Activity Assays

β-glucosidase activity was measured using p-nitrophenyl-β-D-glucopyranoside (PNP-Glu) (Merck), as the substrate according to the previously described procedures [23]. For the determination of the residual activity, aliquots of the protein solutions, taken at the indicated time, were added to the reaction medium containing PNP-Glu (5 mM final concentration) in 50 mM phosphate, 10 mM NaCl, 1 mM MgCl2, pH 6.5. The reactions were allowed to proceed for 5 min and finished by the addition of Na2CO3 (1 M). Absorbance was measured at 400 nm.

3.4. Intrinsic Fluorescence

Protein samples were added to pre-warmed tubes at the corresponding temperature, which contained 50 mM sodium phosphate buffer at the corresponding pH (3, 7, or 12). Measurements were performed in a quartz cell using a Hitachi F-2710 fluorescence spectrophotometer (Hitachi, Tokyo, Japan). Excitation wavelengths of 280 nm and 295 nm were used, and the maximum emissions were obtained at 300 nm and 310 nm, respectively. Aliquots were incubated in a heat block and measured at the corresponding times.

3.5. Microscopy

Optical microscopy images were recorded using an Eclipse 90i fluorescence microscope (Nikon Instruments Inc., Melville, N.Y., USA). The fluorescent filter blocks used were UV2-A [EX 330–380, DM 400, LP 420] for THT staining and G-2A [EX 510–560, DM 575, BA 590] for Congo red staining. Confocal images were obtained with a ZEISS LCS 980 with Airyscan 2 (Carl Zeiss Microscopy GmbH, Jena, Germany), a super-resolution confocal microscope.
Electron micrograph images were recorded using a ZEISS ULTRA 55 field-emission scanning electron microscope (FESEM) (FELMI-ZFE, Graz, Austria). The samples (2 μL) were added to a carbon tape and allowed to dry for 24 h. A platinum cover was added before observation.

3.6. Circular Dichroism

CD assays were carried out using a Jasco J-815 spectropolarimeter (JASCO, Tsukuba, Japan). Protein samples were diluted in 20 mM phosphate buffer at pH 7 and 25 °C to a final concentration of 0.05 mg/mL. The samples were read at wavelengths of 190–260 nm in a 0.2 cm pitch cell. Measurements were repeated three times. DichroWeb (http://dichroweb.cryst.bbk.ac.uk, accessed on 10 July 2024) was used for the analysis of the spectra with the following settings. Input units: millidegrees/theta; wavelength step (nm): 190; analysis program: CDSSTR; reference set: set 4 (optimized for 190–240 nm); output units: mean residue ellipticity.

Author Contributions

Conceptualization, J.P. and E.V.-C.; funding acquisition, J.P. and E.V.-C.; investigation, M.A.R.-L., J.M.C.-M., D.T.-P., J.M.-N. and E.V.-C.; methodology, M.A.R.-L., J.M.C.-M., D.T.-P., J.M.-N. and E.V.-C.; project administration, J.P.; writing—original draft, J.P. and E.V.-C.; writing—review and editing, J.M.-N., J.P. and E.V.-C. All authors have read and agreed to the published version of the manuscript.

Funding

This work was partially supported by Universidad Autónoma Metropolitana (Grant 47301018 to ECV) and Agència Valenciana de la Innovació (Grant INNEST/2021/7 to J.P.). M.A.R.-L was supported by CONACyT PhD scholarship 777818 and a short-term scholarship from UAMC to carry out research at IATA. E.V.-C was awarded Grant 18801 from CONACyT for a sabbatical stay at IATA. The Accreditation of IATA-CSIC as ‘Center of Excellence Severo Ochoa’ CEX2021-001189-S funded by MICIU/AEI/10.13039/501100011033 is also acknowledged.

Institutional Review Board Statement

Not applicable.

Informed Consent Statement

Not applicable.

Data Availability Statement

Data is contained within the article.

Acknowledgments

We thank Benito Alarcon for his assistance with some experiments and critical reading of the manuscript.

Conflicts of Interest

The authors have no conflicts of interest to declare.

References

  1. Gurung, R.; Li, T. Renal Amyloidosis: Presentation, Diagnosis, and Management. Am. J. Med. 2022, 135, S38–S43. [Google Scholar] [CrossRef] [PubMed]
  2. Sinnige, T. Molecular Mechanisms of Amyloid Formation in Living Systems. Chem. Sci. 2022, 13, 7080–7097. [Google Scholar] [CrossRef] [PubMed]
  3. Picken, M.M. The Pathology of Amyloidosis in Classification: A Review. Acta Haematol. 2020, 143, 322–334. [Google Scholar] [CrossRef] [PubMed]
  4. Fernandez-Escamilla, A.M.; Rousseau, F.; Schymkowitz, J.; Serrano, L. Prediction of Sequence-Dependent and Mutational Effects on the Aggregation of Peptides and Proteins. Nat. Biotechnol. 2004, 22, 1302–1306. [Google Scholar] [CrossRef] [PubMed]
  5. Nelson, R.; Sawaya, M.R.; Balbirnie, M.; Madsen, A.; Riekel, C.; Grothe, R.; Eisenberg, D. Structure of the Cross-β Spine of Amyloid-like Fibrils. Nature 2005, 435, 773–778. [Google Scholar] [CrossRef] [PubMed]
  6. Chiti, F.; Dobson, C.M. Protein Misfolding, Amyloid Formation, and Human Disease: A Summary of Progress over the Last Decade. Annu. Rev. Biochem. 2017, 86, 27–68. [Google Scholar] [CrossRef] [PubMed]
  7. Ladanza, M.G.; Jackson, M.P.; Hewitt, E.W.; Ranson, N.A.; Radford, S.E. A New Era for Understanding Amyloid Structures and Disease. Nat. Rev. Mol. Cell Biol. 2018, 19, 755–773. [Google Scholar] [CrossRef] [PubMed]
  8. Chen, G.F.; Xu, T.H.; Yan, Y.; Zhou, Y.R.; Jiang, Y.; Melcher, K.; Xu, H.E. Amyloid Beta: Structure, Biology and Structure-Based Therapeutic Development. Acta Pharmacol. Sin. 2017, 38, 1205–1235. [Google Scholar] [CrossRef] [PubMed]
  9. Penke, B.; Szucs, M.; Bogár, F. Oligomerization and Conformational Change Turn Monomeric β-Amyloid and Tau Proteins Toxic: Their Role in Alzheimer’s Pathogenesis. Molecules 2020, 25, 1659. [Google Scholar] [CrossRef]
  10. Dear, A.J.; Michaels, T.C.; Meisl, G.; Klenerman, D.; Wu, S.; Perrett, S.; Linse, S.; Dobson, C.M.; Knowles, T.P. Kinetic Diversity of Amyloid Oligomers. Proc. Natl. Acad. Sci. USA 2020, 117, 12087–12094. [Google Scholar] [CrossRef]
  11. Taylor, A.I.P.; Staniforth, R.A. General Principles Underpinning Amyloid Structure. Front. Neurosci. 2022, 16, 878869. [Google Scholar] [CrossRef]
  12. Wang, L.Q.; Ma, Y.; Yuan, H.Y.; Zhao, K.; Zhang, M.Y.; Wang, Q.; Huang, X.; Xu, W.C.; Dai, B.; Chen, J.; et al. Cryo-EM Structure of an Amyloid Fibril Formed by Full-Length Human SOD1 Reveals Its Conformational Conversion. Nat. Commun. 2022, 13, 3491. [Google Scholar] [CrossRef] [PubMed]
  13. Heerde, T.; Rennegarbe, M.; Biedermann, A.; Savran, D.; Pfeiffer, P.B.; Hitzenberger, M.; Baur, J.; Puscalau-Girtu, I.; Zacharias, M.; Schwierz, N.; et al. Cryo-EM Demonstrates the in Vitro Proliferation of an Ex Vivo Amyloid Fibril Morphology by Seeding. Nat. Commun. 2022, 13, 85. [Google Scholar] [CrossRef] [PubMed]
  14. Seidler, P.M.; Murray, K.A.; Boyer, D.R.; Ge, P.; Sawaya, M.R.; Hu, C.J.; Cheng, X.; Abskharon, R.; Pan, H.; DeTure, M.A.; et al. Structure-Based Discovery of Small Molecules That Disaggregate Alzheimer’s Disease Tissue Derived Tau Fibrils in Vitro. Nat. Commun. 2022, 13, 5451. [Google Scholar] [CrossRef] [PubMed]
  15. Wierenga, R.K. The TIM-Barrel Fold: A Versatile Framework for Efficient Enzymes. FEBS Lett. 2001, 492, 193–198. [Google Scholar] [CrossRef] [PubMed]
  16. Kurosu, H.; Yamamoto, M.; Clark, J.D.; Pastor, J.V.; Nandi, A.; Gurnani, P.; McGuinness, O.P.; Chikuda, H.; Yamaguchi, M.; Kawaguchi, H.; et al. Physiology: Suppression of Aging in Mice by the Hormone Klotho. Science 2005, 309, 1829–1833. [Google Scholar] [CrossRef] [PubMed]
  17. Chen, G.; Liu, Y.; Goetz, R.; Fu, L.; Jayaraman, S.; Hu, M.C.; Moe, O.W.; Liang, G.; Li, X.; Mohammadi, M. α-Klotho Is a Non-Enzymatic Molecular Scaffold for FGF23 Hormone Signalling. Nature 2018, 553, 461–466. [Google Scholar] [CrossRef] [PubMed]
  18. Lee, S.; Choi, J.; Mohanty, J.; Sousa, L.P.; Tome, F.; Pardon, E.; Steyaert, J.; Lemmon, M.A.; Lax, I.; Schlessinger, J. Structures of β-Klotho Reveal a ‘Zip Code’-like Mechanism for Endocrine FGF Signalling. Nature 2018, 553, 501–505. [Google Scholar] [CrossRef]
  19. Behrendt, M.; Polaina, J.; Naim, H.Y. Structural Hierarchy of Regulatory Elements in the Folding and Transport of an Intestinal Multidomain Protein. J. Biol. Chem. 2010, 285, 4143–4152. [Google Scholar] [CrossRef]
  20. Sanz-Aparicio, J.; Hermoso, J.A.; Martínez-Ripoll, M.; Lequerica, J.L.; Polaina, J. Crystal Structure of Beta-Glucosidase A from Bacillus Polymyxa: Insights into the Catalytic Activity in Family 1 Glycosyl Hydrolases. J. Mol. Biol. 1998, 275, 491–502. [Google Scholar] [CrossRef]
  21. Isorna, P.; Polaina, J.; Latorre-García, L.; Cañada, F.J.; González, B.; Sanz-Aparicio, J. Crystal Structures of Paenibacillus Polymyxa β-Glucosidase B Complexes Reveal the Molecular Basis of Substrate Specificity and Give New Insights into the Catalytic Machinery of Family I Glycosidases. J. Mol. Biol. 2007, 371, 1204–1218. [Google Scholar] [CrossRef] [PubMed]
  22. González-Blasco, G.; Sanz-Aparicio, J.; González, B.; Hermoso, J.A.; Polaina, J. Directed Evolution of β-Glucosidase A from Paenibacillus Polymyxa to Thermal Resistance. J. Biol. Chem. 2000, 275, 13708–13712. [Google Scholar] [CrossRef] [PubMed]
  23. Arrizubieta, M.J.; Polaina, J. Increased Thermal Resistance and Modification of the Catalytic Properties of a β-Glucosidase by Random Mutagenesis and in Vitro Recombination. J. Biol. Chem. 2000, 275, 28843–28848. [Google Scholar] [CrossRef] [PubMed]
  24. Navarro, S.; Ventura, S. Computational Methods to Predict Protein Aggregation. Curr. Opin. Struct. Biol. 2022, 73, 102343. [Google Scholar] [CrossRef]
  25. Louros, N.; Konstantoulea, K.; De Vleeschouwer, M.; Ramakers, M.; Schymkowitz, J.; Rousseau, F. WALTZ-DB 2.0: An Updated Database Containing Structural Information of Experimentally Determined Amyloid-Forming Peptides. Nucleic Acids Res. 2020, 48, D389–D393. [Google Scholar] [CrossRef] [PubMed]
  26. López De La Paz, M.; Serrano, L. Sequence Determinants of Amyloid Fibril Formation. Proc. Natl. Acad. Sci. USA 2004, 101, 87–92. [Google Scholar] [CrossRef] [PubMed]
  27. Teng, P.K.; Eisenberg, D. Short Protein Segments Can Drive a Non-Fibrillizing Protein into the Amyloid State. Protein Eng. Des. Sel. 2009, 22, 531–536. [Google Scholar] [CrossRef] [PubMed]
  28. Tsiolaki, P.L.; Louros, N.N.; Iconomidou, V.A. Hexapeptide Tandem Repeats Dictate the Formation of Silkmoth Chorion, a Natural Protective Amyloid. J. Mol. Biol. 2018, 430, 3774–3783. [Google Scholar] [CrossRef] [PubMed]
  29. Louros, N.N.; Bolas, G.M.P.; Tsiolaki, P.L.; Hamodrakas, S.J.; Iconomidou, V.A. Intrinsic Aggregation Propensity of the CsgB Nucleator Protein Is Crucial for Curli Fiber Formation. J. Struct. Biol. 2016, 195, 179–189. [Google Scholar] [CrossRef]
  30. Tian, Y.; Viles, J.H. PH Dependence of Amyloid-β Fibril Assembly Kinetics: Unravelling the Microscopic Molecular Processes. Angew. Chem. Int. Ed. 2022, 61, e202210675. [Google Scholar] [CrossRef]
  31. Biancalana, M.; Koide, S. Molecular Mechanism of Thioflavin-T Binding to Amyloid Fibrils. Biochim. Biophys. Acta 2010, 1804, 1405–1412. [Google Scholar] [CrossRef]
  32. Sulatsky, M.I.; Sulatskaya, A.I.; Povarova, O.I.; Antifeeva, I.A.; Kuznetsova, I.M.; Turoverov, K.K. Effect of the Fluorescent Probes ThT and ANS on the Mature Amyloid Fibrils. Prion 2020, 14, 67–75. [Google Scholar] [CrossRef]
  33. Younan, N.D.; Viles, J.H. A Comparison of Three Fluorophores for the Detection of Amyloid Fibers and Prefibrillar Oligomeric Assemblies. ThT (Thioflavin T); ANS (1-Anilinonaphthalene-8-Sulfonic Acid); and BisANS (4,4′-Dianilino-1,1′-Binaphthyl-5,5′-Disulfonic Acid). Biochemistry 2015, 54, 4297–4306. [Google Scholar] [CrossRef]
  34. Ábrahám, Á.; Massignan, F.; Gyulai, G.; Katona, M.; Taricska, N.; Kiss, É. Comparative Study of the Solid-Liquid Interfacial Adsorption of Proteins in Their Native and Amyloid Forms. Int. J. Mol. Sci. 2022, 23, 13219. [Google Scholar] [CrossRef] [PubMed]
  35. Chen, Y.; Liu, Q.; Yang, F.; Yu, H.; Xie, Y.; Yao, W. Lysozyme Amyloid Fibril: Regulation, Application, Hazard Analysis, and Future Perspectives. Int. J. Biol. Macromol. 2022, 200, 151–161. [Google Scholar] [CrossRef] [PubMed]
  36. Howie, A.J.; Brewer, D.B.; Howell, D.; Jones, A.P. Physical Basis of Colors Seen in Congo Red-Stained Amyloid in Polarized Light. Lab. Investig. 2008, 88, 232–242. [Google Scholar] [CrossRef] [PubMed]
  37. Howie, A.J.; Brewer, D.B. Optical Properties of Amyloid Stained by Congo Red: History and Mechanisms. Micron 2009, 40, 285–301. [Google Scholar] [CrossRef]
  38. Howie, A.J. Origins of a Pervasive, Erroneous Idea: The “Green Birefringence” of Congo Red-Stained Amyloid. Int. J. Exp. Pathol. 2019, 100, 208–221. [Google Scholar] [CrossRef]
  39. Brännström, K.; Gharibyan, A.L.; Islam, T.; Iakovleva, I.; Nilsson, L.; Lee, C.C.; Sandblad, L.; Pamren, A.; Olofsson, A. Scanning Electron Microscopy as a Tool for Evaluating Morphology of Amyloid Structures Formed on Surface Plasmon Resonance Chips. Data Brief 2018, 19, 1166–1170. [Google Scholar] [CrossRef]
  40. Chamberlain, A.K.; MacPhee, C.E.; Zurdo, J.; Morozova-Roche, L.A.; Hill, H.A.O.; Dobson, C.M.; Davis, J.J. Ultrastructural Organization of Amyloid Fibrils by Atomic Force Microscopy. Biophys. J. 2000, 79, 3282–3293. [Google Scholar] [CrossRef]
  41. Surmacz-Chwedoruk, W.; Babenko, V.; Dec, R.; Szymczak, P.; Dzwolak, W. The Emergence of Superstructural Order in Insulin Amyloid Fibrils upon Multiple Rounds of Self-Seeding. Sci. Rep. 2016, 6, 32022. [Google Scholar] [CrossRef] [PubMed]
  42. Lövestam, S.; Scheres, S.H.W. High-Throughput Cryo-EM Structure Determination of Amyloids. Faraday Discuss. 2022, 240, 243–260. [Google Scholar] [CrossRef] [PubMed]
Figure 1. Protein structure of BglA and BglB and mapping of the predicted amylogenic regions. (A) Alignment of BglA and BglB amino acid sequences. Predicted amylogenic regions in BglA and BglB are depicted in purple and red, respectively. (B) Sequences of predicted amylogenic regions in the BglA and BglB primary structures. Asterisks indicate the amylogenic region shared by both proteins. (C) Superimposed three-dimensional structure of a BglA monomer (cyan) and BglB (green), with PDB codes 1BGA and 2O9P, respectively. The color code is the same one used in panel (A), except the yellow region corresponds to the predicted amylogenic region shared by BglA and BglB.
Ijms 25 08536 g001
Figure 2. Fluorescence emission of thioflavin T (ThT) assay for BglA (panel (A)) and BglB (panel (B)) at different pH values. (C) ThT fluorescence after 16 h of incubation of BglA or BglB at different pH values. In all cases, ThT fluorescence intensity at 485 nm after excitation at 450 nm at time zero was assigned as the unit. All data are the average of three independent quantifications, and the standard deviation was less than 10% in all cases.
Ijms 25 08536 g002
Figure 3. Fluorescence emission of 8-anilino-1-naphthalenesulfonic acid (ANS) assay for BglA (panel (A)) and BglB (panel (B)) at different pH values. (C) ANS fluorescence after 16 h of incubation of BglA or BglB at different pH values. In all cases, ANS fluorescence intensity at 470 nm, after excitation at 380 nm at time zero, was assigned as the unit. All the data are the averages of three independent measurements, and the standard deviation was less than 10% in all cases.
Ijms 25 08536 g003
Figure 4. Wide-field optical microscopy of BglA and BglB protein aggregates after 8 days of incubation using either bright-field or epifluorescence illumination. The pictures in the upper half of the figure were imaged with bright-field illumination using a 2× objective lens combined with an optical zoom factor of 0.8. Scale bar, 1 mm. The pictures in the bottom half of the picture were taken with an epifluorescence illumination of the same samples, stained with ThT. A 40× objective lens combined with an optical zoom factor of 0.8 was used. Scale bar, 50 µm.
Ijms 25 08536 g004
Figure 5. Wide-field optical microscopy of BglB and BglA protein aggregates using either differential interference contrast microscopy Nomarsky (DIC/N) or epifluorescence illumination after ThT or Congo red staining. Panel (A): BglA, pH 7.0, 65 °C (DIC/N). Panels (BD): BglB, pH 3.0, 45 °C (ThT). Panel (E): BglB, pH 3.0, 45 °C (DIC/N). Panel (F): BglB, pH 3.0, 45 °C (CR). Scale bar: 20 µm in panels (A,B); 5 µm in panels (CF).
Ijms 25 08536 g005
Figure 6. Scanning electron microscopy (FESEM) pictures of amyloid fibers of BglB (panels (A,B)) and BglA (panel (C)). Samples of protein (1 mgmL−1) were incubated at pH 3 and room temperature for 96 h. Scale bar: 1 µm (panel (A)), 2 µm (panels (B,C)).
Ijms 25 08536 g006
Figure 7. Confocal microscopy of ThT-stained BglA (panels (A,B)) and BglB (panels (C,D)) protein aggregates. Images are the maximum projection of each Z-stack. Field of view: 26 × 26 µm. Z-step = 0.15 µm. Total depth: 2.7 µm (18 slices); panel (A): 8.3 µm (55 slices); panel (B): 9.0 µm (60 slices); panel (C): 8.7 µm (58 slices); panel (D): illumination: 405 nm laser.
Ijms 25 08536 g007
Figure 8. Far-UV CD spectra of BglA and BglB recorded after 16 h of incubation at 25 °C and pH 7 or 4.
Ijms 25 08536 g008
Table 1. Intrinsic fluorescence, extrinsic fluorescence, and activity of BglA and BglB subjected to different conditions of temperature and pH.
BglA
Temperature IF 280 nmIF 295 nmThTANSResidual
Activity
°CpH1 h1 h1 h16 h1 h16 h1 h16 h
2530.60.50.91.4140.60.9
71111.111.411
120.70.90.611.530.90.9
4530.50.80.40.1110.50.8
71.20.60.60.50.70.81.21
120.20.7001.52.30.71
6530.40.50.31.50.6100
70.90.30.310.50.61.10
120.150.20.90.80.90.800
BglB
Temperature IF 280 nmIF 295 nmThTANSResidual
Activity
°CpH1 h1 h1 h16 h1 h16 h1 h16 h
2531.50.50.91.311.40.80.7
71110.81111
120.90.70.601.57.80.80.6
4530.40.86.524.53.819.80.20
71.50.62.410.61.210.30.90.6
120.40.6000.8200
6534.23.73.97.92.54.800
70.60.61.24.113.400
120.61.1000.30.300
Table 2. Protein secondary structure content of BglA and BglB as deduced from the CD spectra recorded after incubation for 16 h at pH 7 or 4.
ProteinpHα-Helix aβ-Sheet aTurns aUnordered a NRMSD b
BglA7281615250.015
433426310.032
BglB7311414240.018
473423300.023
a Percentage of different secondary structures. b NRDMS: Normalized root deviation mean square.
Disclaimer/Publisher’s Note: The statements, opinions and data contained in all publications are solely those of the individual author(s) and contributor(s) and not of MDPI and/or the editor(s). MDPI and/or the editor(s) disclaim responsibility for any injury to people or property resulting from any ideas, methods, instructions or products referred to in the content.

