Article

Plantaginis Semen Ameliorates Hyperuricemia Induced by Potassium Oxonate

Key Laboratory of TCM-Information Engineer of State Administration of TCM, School of Chinese Materia Medica, Beijing University of Chinese Medicine, Beijing 100029, China
*
Authors to whom correspondence should be addressed.
These authors contributed equally to this work.
Int. J. Mol. Sci. 2024, 25(15), 8548; https://doi.org/10.3390/ijms25158548
Submission received: 17 June 2024 / Revised: 25 July 2024 / Accepted: 27 July 2024 / Published: 5 August 2024
(This article belongs to the Section Molecular Endocrinology and Metabolism)

Abstract

:
Plantaginis semen is the dried ripe seed of Plantago asiatica L. or Plantago depressa Willd., which has a long history in alleviating hyperuricemia (HUA) and chronic kidney diseases. While the major chemical ingredients and mechanism remained to be illustrated. Therefore, this work aimed to elucidate the chemicals and working mechanisms of PS for HUA. UPLC-QE-Orbitrap-MS was applied to identify the main components of PS in vitro and in vivo. RNA sequencing (RNA-seq) was conducted to explore the gene expression profile, and the genes involved were further confirmed by real-time quantitative PCR (RT-qPCR). A total of 39 components were identified from PS, and 13 of them were detected in the rat serum after treating the rat with PS. The kidney tissue injury and serum uric acid (UA), xanthine oxidase (XOD), and cytokine levels were reversed by PS. Meanwhile, renal urate anion transporter 1 (Urat1) and glucose transporter 9 (Glut9) levels were reversed with PS treatment. RNA-seq analysis showed that the PPAR signaling pathway; glycine, serine, and threonine metabolism signaling pathway; and fatty acid metabolism signaling pathway were significantly modified by PS treatment. Further, the gene expression of Slc7a8, Pck1, Mgll, and Bhmt were significantly elevated, and Fkbp5 was downregulated, consistent with RNA-seq results. The PPAR signaling pathway involved Pparα, Pparγ, Lpl, Plin5, Atgl, and Hsl were elevated by PS treatment. URAT1 and PPARα proteins levels were confirmed by Western blotting. In conclusion, this study elucidates the chemical profile and working mechanisms of PS for prevention and therapy of HUA and provides a promising traditional Chinese medicine agency for HUA prophylaxis.

1. Introduction

Hyperuricemia (HUA) is a metabolic syndrome resulted from purine metabolism disorders or uric acid (UA) metabolism abnormalities, and it is considered as a risk factor of renal diseases [1,2]. Conventional therapies encompass lifestyle interventions and pharmacological treatments; allopurinol, febuxostat, benzbromarone, and losartan are commonly used [3]. However, these uric-lowering drugs often exhibit side effects including liver and kidney function impairment and skin adverse effects and could lead to a relapse upon withdrawal of the drug [4,5,6]. Given the complexity of hyperuricemia pathogenesis, it is imperative to search for safe, effective, and working mechanism well-defined natural drug for therapy of HUA.
Plantaginis semen, the dried ripe seed of Plantago asiatica L. or Plantago depressa Willd., is a damp-draining diuretic and has been extensively used for HUA. According to the Chinese pharmacopoeia, its major function is described as disinhibiting water, penetrating dampness, and removing phlegm, and it can be used for pyretic stranguria, edema, damp-heat diarrhea, swelling and pain of eyes, and phlegm-heat cough [7]. According to the principles of traditional Chinese medicine, the key to preventing HUA lies in invigorating the spleen and eliminating dampness, lowering turbidity, and removing phlegm. In recent years, increasing studies reported the preventive and therapeutic effects of PS on HUA. PS increased urine volume excretion and urine electrolyte excretion [8]; deregulated the expression of TGF-β1, TNF-α, and IL-1β; and reduced the content of urinary protein and UA [9]. Psyllium polysaccharide ameliorated renal damage in rats with gouty nephropathy by regulating the NOD-like receptor protein 3 (NLRP3) inflammasome signal pathway [10]. HUA is usually associated with dysregulation of lipid metabolism [11]. In our previous study, 12 biomarkers were identified from the serum samples of HUA patients, L-tyrosine, L-phenylalanine, arachidonic acid, linoleic acid, oleic acid, stearic acid, LysoPC (18:0), LysoPC (18:1 (9Z)), and LysoPC (16:0) were downregulated in the serum of HUA patients [12]. The metabolomics analyses showed that PS was intimately involved in lipid metabolism, in which 13 differentially expressed metabolites (DEMs) were included, and the glycerophospholipid metabolism pathway was affected [13]. However, the active ingredients of PS were insufficiently elucidated, but the study on the pharmacodynamic mechanism related to HUA was clarified. Therefore, we tried to combine more techniques and methods to explore the active constituents and the mechanisms of PS for prevention and therapy of HUA.
In recent years, the RNA sequencing (RNA-seq) technique has been widely employed to investigate diverse mechanisms of various medicines, and the application of ultra-high-performance liquid chromatography–tandem quadrupole electrostatic field–orbital trap–mass spectrometry (UPLC-QE-Orbitrap-MS) has significantly enhanced its capacity for analyzing chemical constituents in complex systems, especially in traditional Chinese medicine [14]. Therefore, systematic analysis and identification of the chemical components of PS both in vitro and in vivo, along with the exploration of differentially co-expressed genes and various pathways, are crucial for uncovering pharmacodynamic mechanisms and have great importance for clinical applications.
This study employed UPLC-QE-Orbitrap-MS and RNA-seq to identify the components of PS in vitro and in vivo, searching for differentially co-expressed genes, key pathways, and crucial targets. Moreover, RT-qPCR and Western blotting experiments were performed for gene expression confirmation, providing a foundational basis for further research on its mechanisms and clinical application.

2. Results

2.1. Clarification of Constituents in PS by UPLC-QE-Orbitrap-MS

A total of 39 compounds were identified from PS extract, 30 of which were in negative-ion mode (Figure 1A), and 9 were supplemented in positive-ion mode (Figure 1B); the details are listed in Table 1. 14 flavonoids were identified from the PS extract. Taking peak 12, peak 14, and peak 18 as examples, they were identified by the negative-ion mode; the [M-H] ion of peak 12 at m/z 465.1042 lost glucose to generate the aglycone parent ion [M-H-Glu] at m/z 303.0506. The fragment ion at m/z 151.0393 was generated by reverse Dills–Alder (RDA) cleavage of the flavonoid parent nucleus. Plantagoside was inferred from the fragments reported in the literature [15,16] and its mass spectrometry fragment information and possible cleavage pathways in negative-ion mode are shown in Figure 2A. The [M-H] ion of peak 14 was at m/z 303.0514, its fragments ion at m/z 151.0402 [M-H-C8H8O3] was due to RDA cleavage of the flavonoid nucleus, and the fragments ion at m/z 107.0139 [M-H-C8H8O3-CO2] was formed after losing 42 Da (CO2). Compared with the literature [15], it was identified as taxifolin (Figure 2A). The [M-H] ion of peak 18 was at m/z 447.0941 due to lost glucose, generating the aglycone parent ion [M-H-Glu] at m/z 285.0405. In addition, RDA cleavage occurred in the C ring, resulting in fragment ions at m/z 151.0041. This was identified as cynaroside (Figure 2A) based on the mass spectrometry fragment information and related literature [17].
Nine phenyl ethanol glycosides were identified in PS, eight of which were identified in negative-ion mode and one in positive-ion mode. The identification process of phenyl ethanol glycosides is shown in Figure 2B. The [M-H] ion of peak 15 at m/z 623.2000 lost caffeic acid to generate the fragment ion [M-H-C9H6O3] at m/z 461.1670 and continued to lose rhamnose (Rha) to obtain the fragment ion [M-H-C9H6O3-Rha] at m/z 315.1082. The fragment ions at m/z 179.0352, 161.0246, 153.0559, and 135.0453 were the caffeic acid fragment ions, ions of caffeic acid after losing H2O, phenyl ethanol aglycone fragment ions, and ions of it after losing H2O. It was identified as acteoside, according to the retention time and the fragments of standard substance (Figure 2B).
The [M-H] ion of peak 19 at m/z 639.1954 lost caffeic acid to generate the fragment ion [M-H-C9H6O3] at m/z 477.1605, continued to lose glucose to obtain the fragment ion [M-H-C9H6O3-Glu] at m/z 315.1107, and lost another glucose to obtain the phenyl ethanol aglycone fragment ion [M-H-C9H6O3-2Glu] at m/z 153.0549; a fragment ion [M-H-C9H6O3-2Glu-H2O] at m/z 135.0454 was generated after losing H2O. The fragment ions at m/z 179.0350 and 161.0246 were the caffeic acid fragment ions and ions of caffeic acid after losing H2O, respectively. Compared with the fragment information and the related literature [16], it was identified as plantainoside D (Figure 2B).
Four iridoids were identified in PS, two of which were identified in negative-ion mode and two in positive-ion mode. The identification process is demonstrated in Figure 2C. The [M + H]+ ion of peak 4 at m/z 375.1279 lost glucose and H2O to generate the fragment ion [M + H-Glu-H2O]+ at m/z 195.0659 and continued to lose H2O to obtain the fragment ions [M + H-Glu-2H2O]+ at m/z 177.0552, which lost CO twice to generate m/z 149.0602 [M + H-Glu-2H2O-CO]+ and m/z 121.0652 [M + H-Glu-2H2O-2CO]+. Compared with the database and the related literature [16], it was identified as gardoside (Figure 2C). The [M-H] ion of peak 6 at m/z 373.1135 lost glucose to generate the fragment ion [M-H-Glu] at m/z 211.0611, and it continued to lose H2O to obtain the fragment ion [M-H-Glu-H2O] at m/z 193.0512, lose CO2 to obtain the fragment ion [M-H-Glu-CO2] at m/z 167.0711, or lose H2O and CO2 at the same time to obtain fragment ion [M-H-Glu-CO2-H2O] at m/z 149.0609. It was identified as geniposidic acid by comparing the retention time and the fragments of the standard substance (Figure 2C).
A total of three organic acid compounds were identified, two of which were identified in negative-ion mode and one in positive-ion mode (Figure 2D). The [M + H]+ ion of peak 34 at m/z 181.0493 lost H2O to generate the fragment ion [M + H-H2O]+ at m/z 163.0395, continued to lose CO to obtain the fragment ions [M + H-H2O-CO]+ at m/z 135.0446, then lost H2O to generate the fragment ion [M + H-2H2O-CO]+ at m/z 116.9860. The ions at m/z 107.0861, 79.0545, and 65.0390 were the C7H7O, C6H7, and C5H5 fragments generated by the fracture. This peak was identified as caffeic acid (Figure 2D), compared with the database and the related literature [17].

2.2. Identification of Blood-Migrating Constituents in PS by UPLC-QE-Orbitrap-MS

The bioactive molecules or metabolites produced during drug metabolism pass through the blood and are distributed throughout the body to play pharmacological roles [18]. The blood-migrating constituents in PS are potential anti-HUA effective components of PS. These components influence the synthesis and elimination of uric acid in the body through various mechanisms, thereby ultimately affecting blood uric acid levels.
By comparing the plasma of the control group (group A) and PS administration group (group B) and analyzing the retention time, mass spectrum fragment information, and cracking rule of PS extract and standard substances, 40 components were screened and identified in blood, and 13 of them were prototype components (Table 2). These components maintain a certain concentration in the blood, which may be the potential medicinal ingredient in anti-HUA formulations.

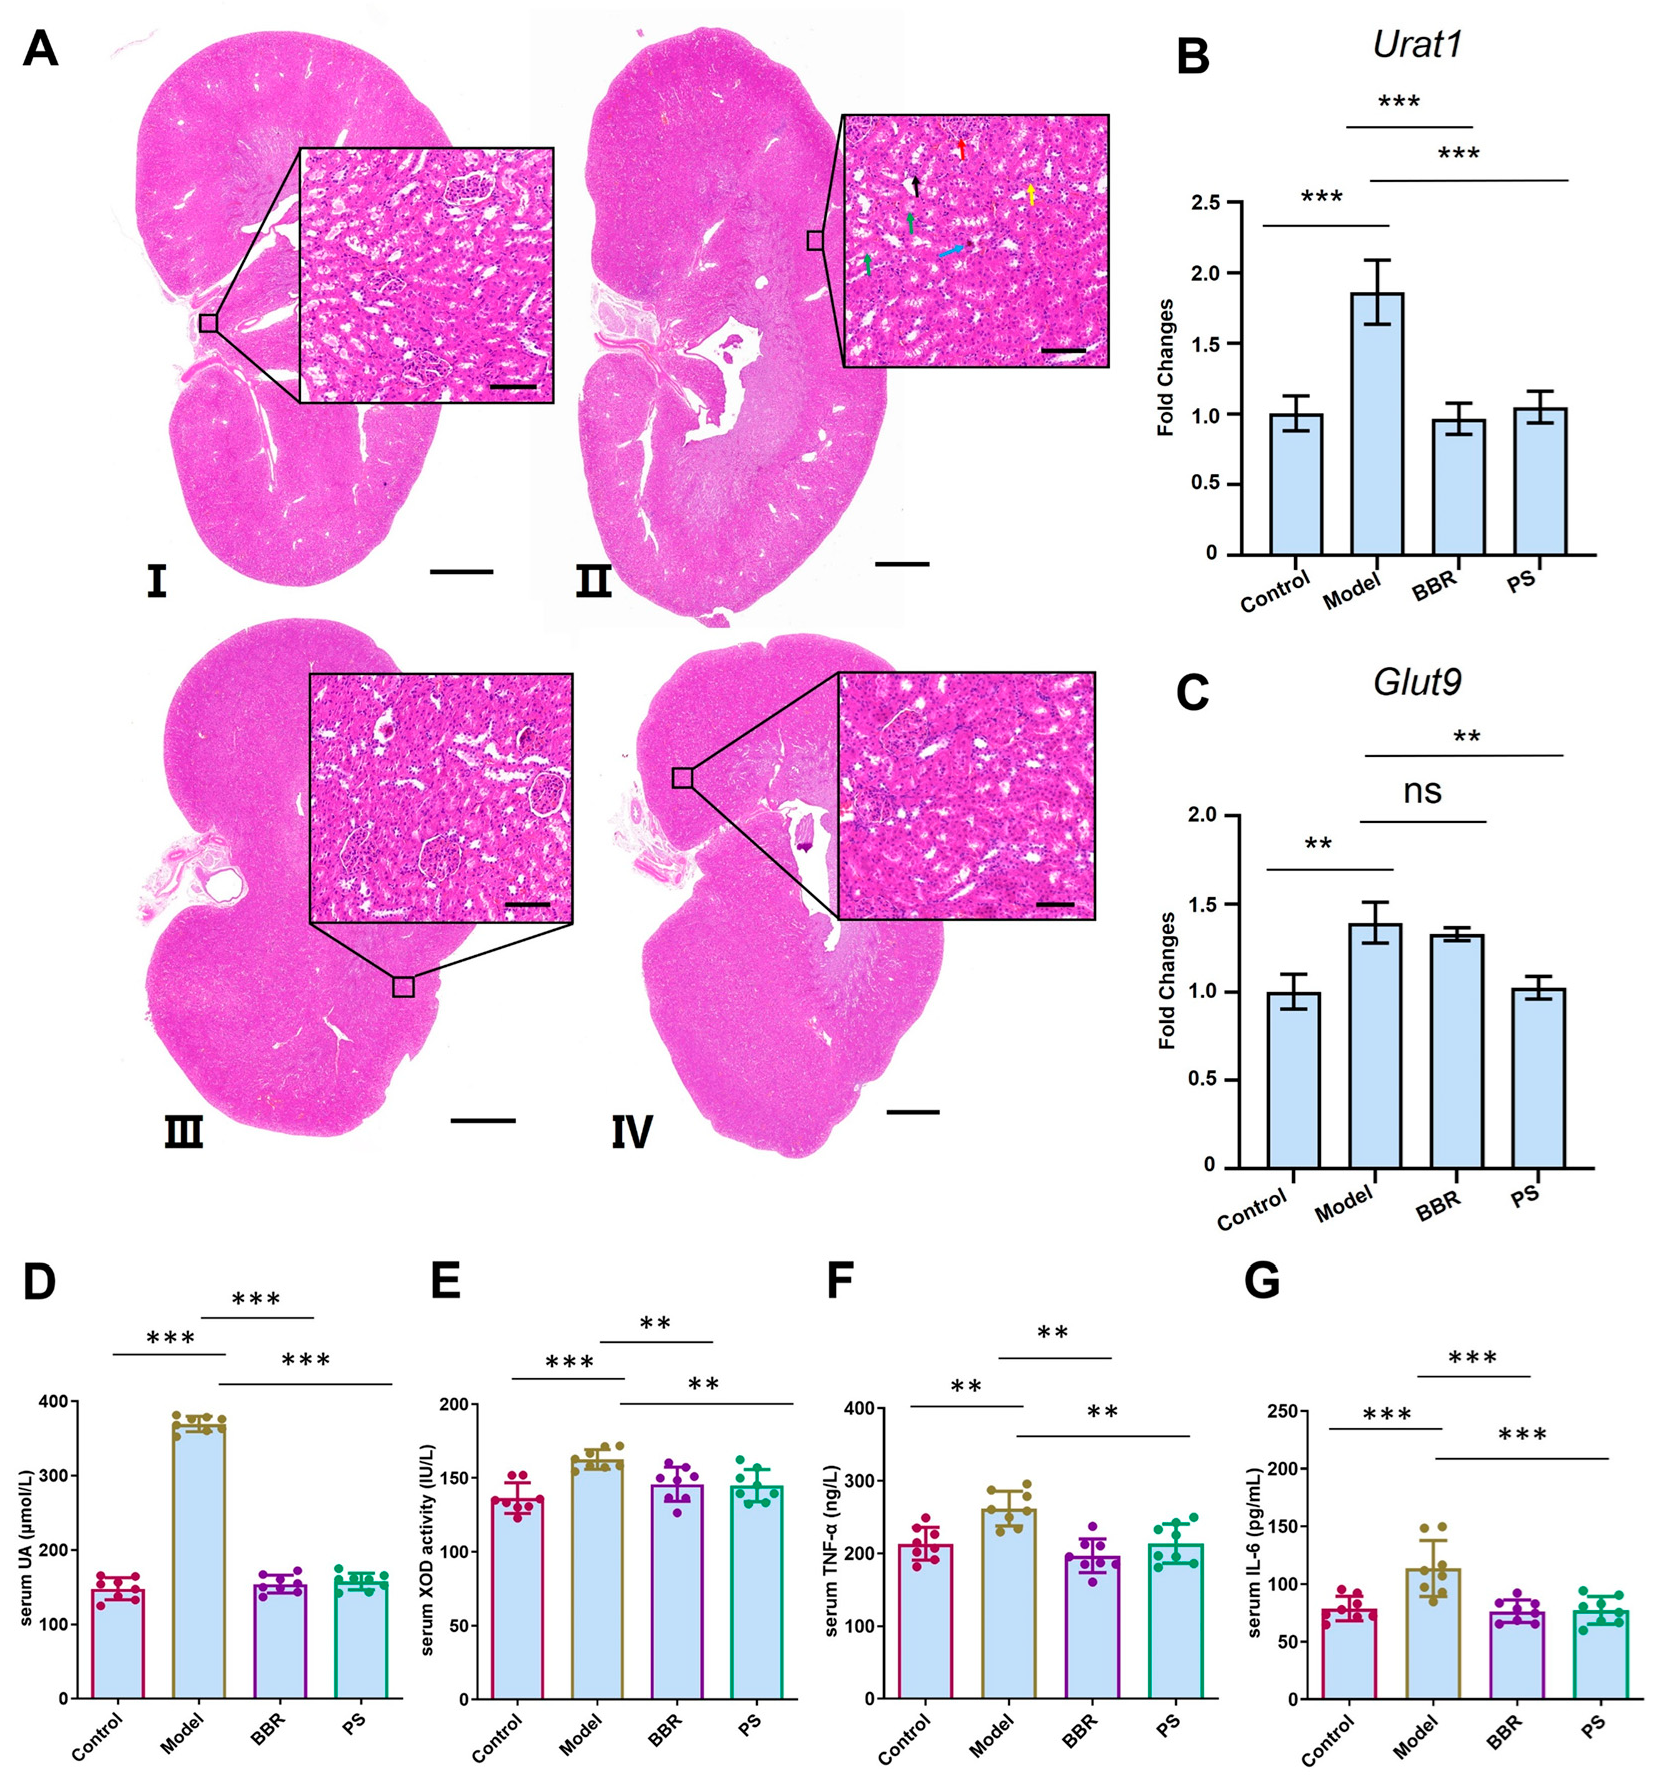
2.3. Plantaginis Semen Ethanol Extract Reversed Rat Urine Acid, Cytokines Levels, and mRNA Expression of Uric Acid Transporter Induced by Potassium Oxonate

In the normal group, the glomeruli and renal tubules showed regular morphology and structure, with no urate crystallization, mesangial hyperplasia, and glomerular segmentation, and no inflammatory cell infiltration was observed. In the potassium oxonate-stimulated HUA model group, urate crystals accumulated in the renal tubules, and protein tubules, mesangial hyperplasia, and glomerular segmentation were observed, accompanied by increased inflammatory cell infiltration. Compared to the model group, the BBR and PS treatment improved renal tubule injury, urate crystal deposition, and inflammatory cell infiltration (Figure 3A).
HUA is characterized by elevated levels of uric acid in the blood. Uric acid in the blood has two main sources: the majority is produced endogenously through purine metabolism, and the rest comes from intake of purine-rich foods in the diet [19]. The results of biochemical indexes showed that the serum UA levels (Figure 3D) and the activity of serum XOD (Figure 3E) of the model group were significantly higher than those of the control group, and the kidneys of the rats in the model group showed obvious pathological changes, indicating that the HUA rat model was successfully developed.
The level of serum UA of BBR group and PS group significantly decreased, indicating PS could lower serum UA level in potassium oxonate induced HUA rats (Figure 3D). Similarly, PS could lower XOD activity (Figure 3E) and TNF-α (Figure 3F) and IL-6 (Figure 3G) levels in potassium oxonate-induced HUA rats. XOD is an aerobic dehydrogenase that can catalyze the oxidation of xanthine to uric acid [20]. The decrease in XOD activity indicated that PS inhibited the conversion of purine to uric acid and affected the production of uric acid, playing a role in lowering uric acid. Inflammatory responses triggered by HUA-related factors, such as excessive urate crystal deposition and mitochondrial reactive oxygen species, are thought to play a critical role in the pathogenesis of HUA. The pro-inflammatory mediators TNF-α and IL-6 were found to be at high levels and involved in HUA progression [21].
Uric acid excretion disorders account for 90% of HUA cases [22]. Uric acid excretion is mainly related to the function of uric acid transporters in the kidneys [23]. Urat1 and Glut9 are uric acid reabsorption transporters that play important roles in uric acid excretion; many uric acid-lowering drugs are Urat1 inhibitors, such as benzbromarone, probenecid, and lesinurad [22,24]. The results showed that the mRNA expression levels of Urat1 (Figure 3B) and Glut9 (Figure 3C) in the renal tissues of the model group were significantly higher (p < 0.01 or p < 0.001) than the control group. PS downregulated the mRNA expressions of Urat1 and Glut9 in potassium oxonate-induced HUA rats, which further proves the pharmacological effect of PS in lowering uric acid and the mechanism of PS on the excretion of uric acid by regulating the uric acid transporter in the kidney.

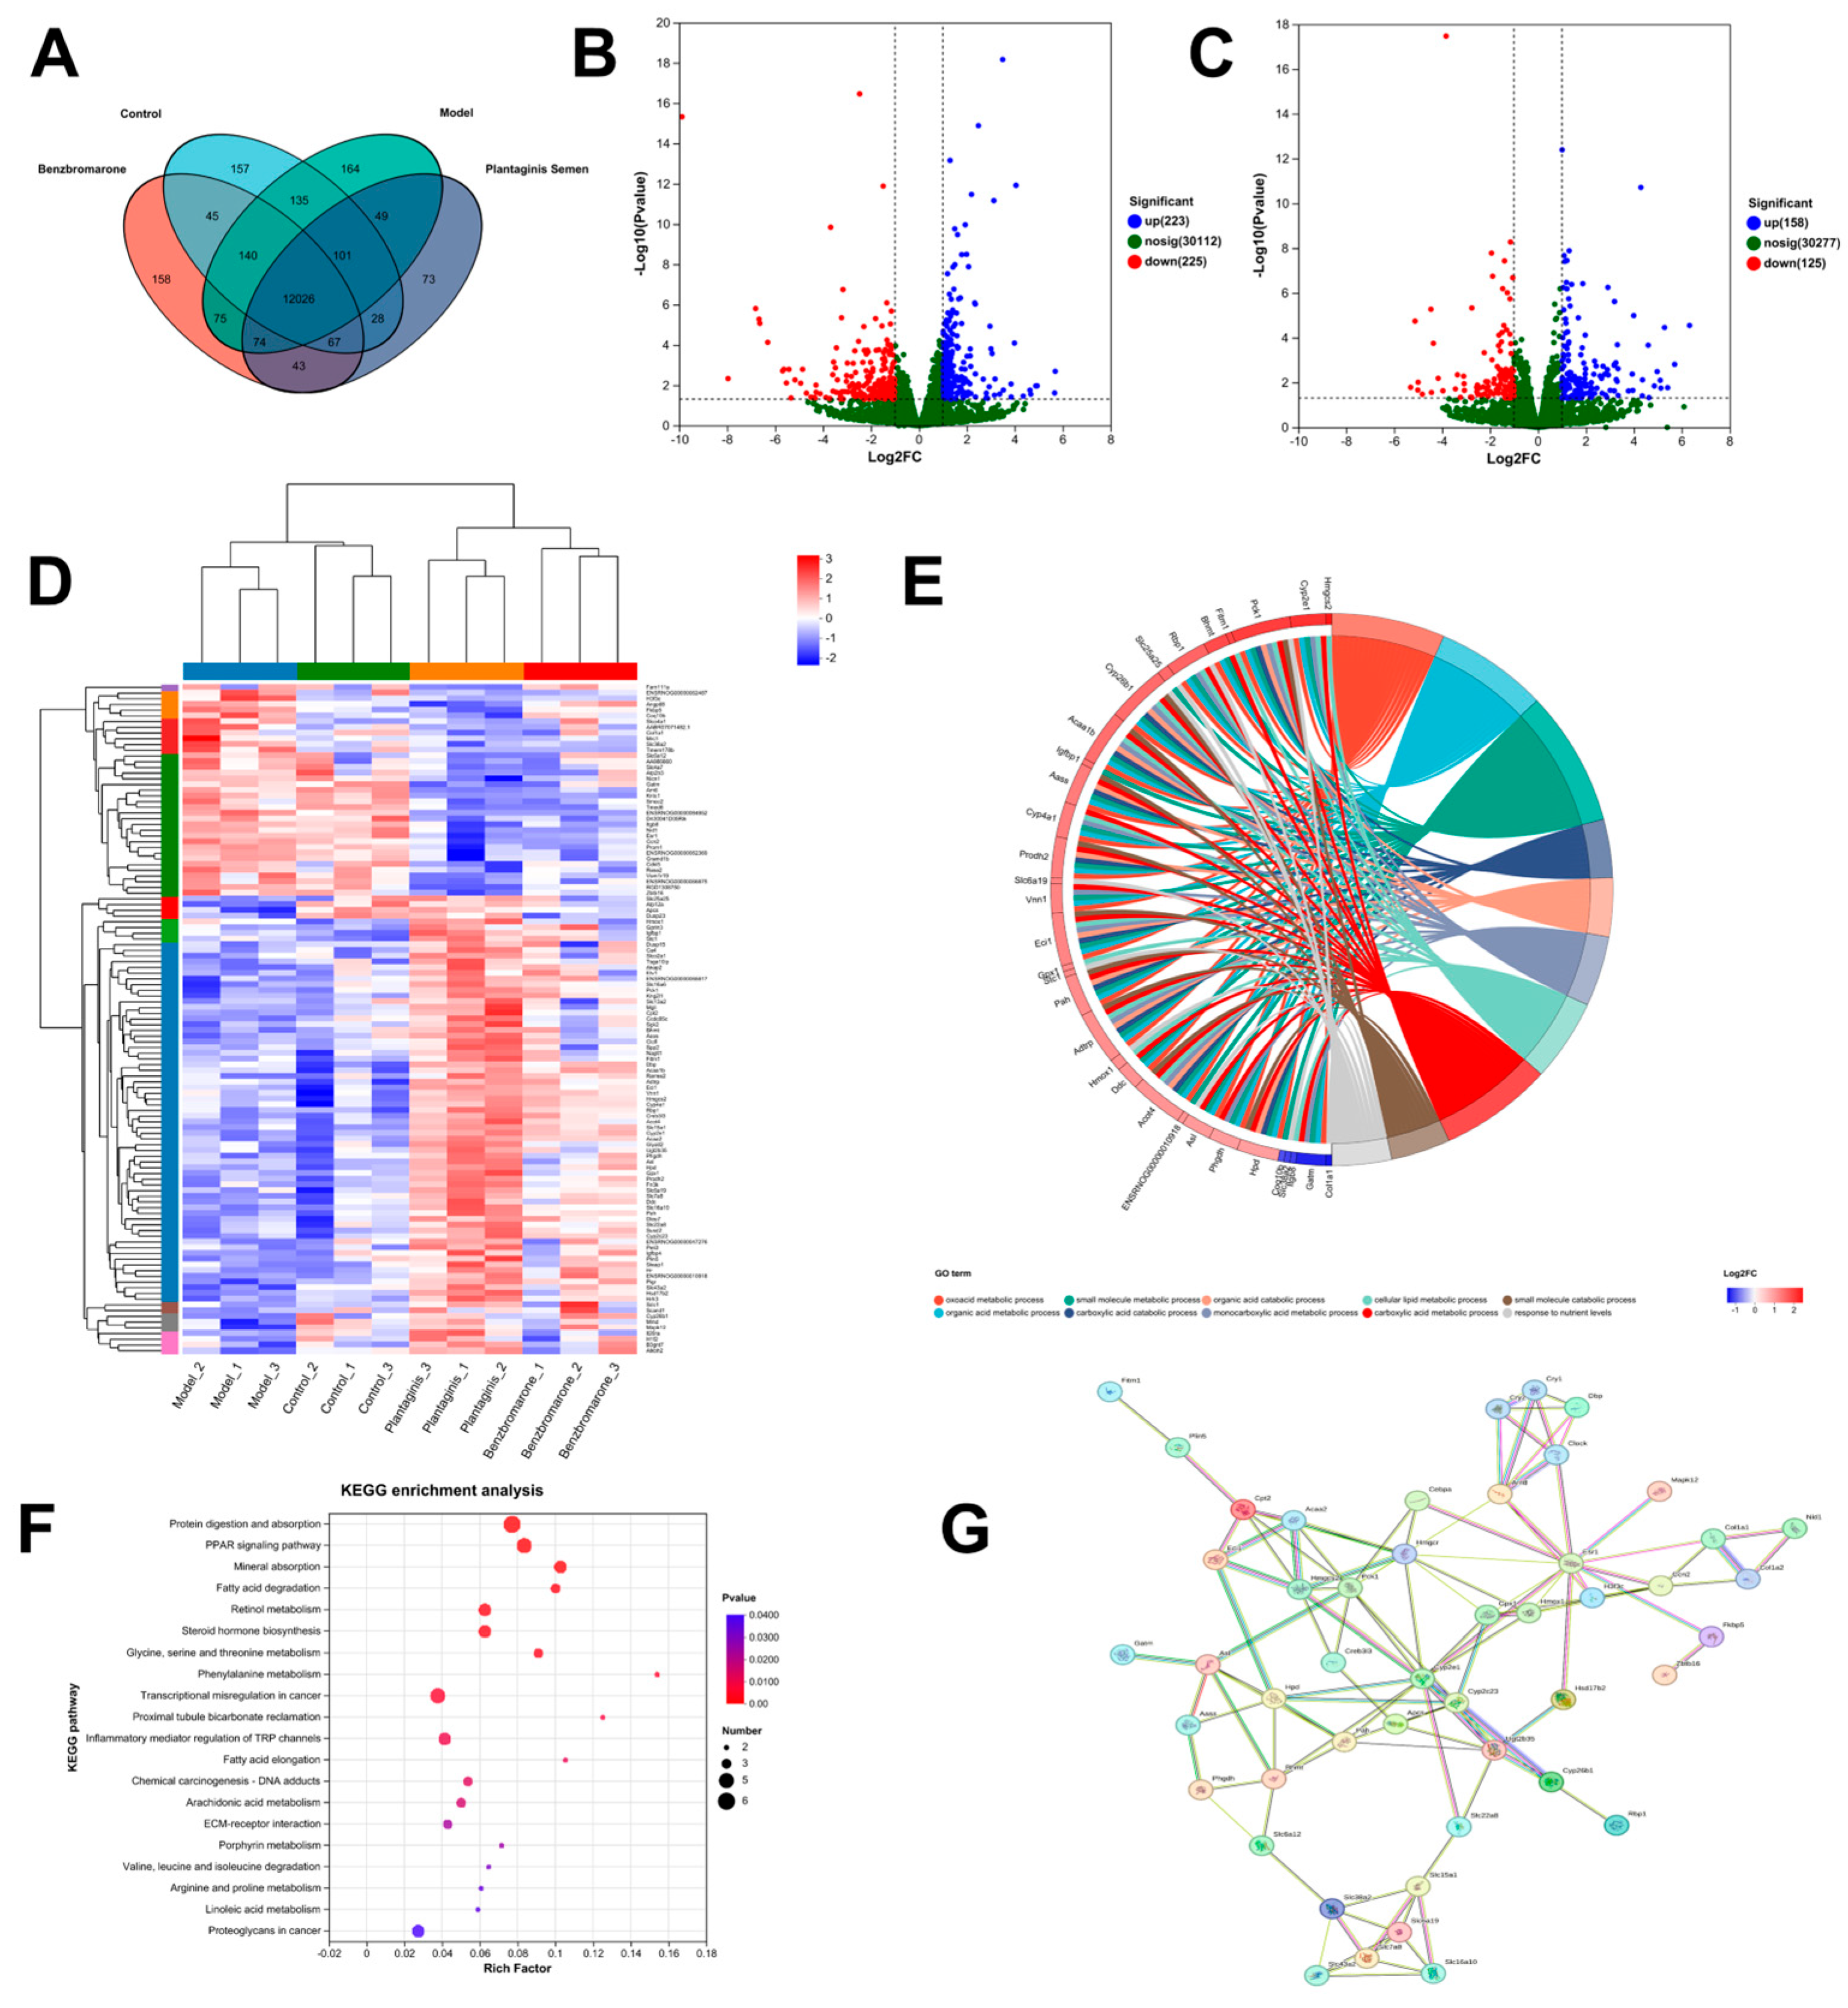
2.4. Differential Expression Genes and Related Pathways Analyzed by RNA Sequencing

In order to explore the working mechanism of PS on HUA and prove the efficacy of PS against HUA, Transcriptomes from the control, model, BBR, and PS group rat kidney tissues were sequenced. Clean reads on average were obtained from twelve samples. In all clear reads, the Q30 ratio of clean reads was higher than 94.27%, indicating high reliability of the sequencing results. The transcripts and unigenes totaled 38,657 and 20,403, respectively. The Venn analysis diagram between samples is shown in Figure 4A. A total of 2147 differentially expression genes (DEGs) were identified. Overall, 223 upregulated and 225 downregulated DEGs were identified in the PS compared to the control groups, and 158 upregulated and 125 downregulated DEGs were identified in the model compared to the control groups (Figure 4B,C). Hierarchical clustering analysis of the DEGs among four groups (Figure 4D) indicates that PS significantly upregulate the expression of Slc7a8, Pck1, Mgll, and Bhmt and downregulate the expression of Fkbp5, and it has effects on genes related to amino acid metabolism and lipid metabolism.
GO function enrichment analysis (Figure 4E) showed that compared to the model group, the DEGs in the PS group were mainly enriched for the oxoacid metabolic process, organic acid metabolic process, amino acid transmembrane transporter activity, lipid metabolic process, etc. KEGG analysis showed that the differential genes between the PS and the model group were enriched for 166 pathways, including protein digestion and absorption, PPAR signaling pathway, fatty acid degradation, retinol metabolism, steroid hormone biosynthesis, glycine and serine and threonine metabolism, phenylalanine metabolism, proximal tubule bicarbonate reclamation, inflammatory mediator regulation of TRP (transient receptor potential) channels, fatty acid elongation, etc. The top 20 pathways were enriched and suggested that PS for HUA is predominantly involved in the regulation of amino acids and lipid metabolism as well as in proximal tubule bicarbonate reclamation and inflammatory responses (Figure 4F).

2.5. Differential Expression Genes Were Verified by RT-qPCR

RNA-seq data suggested multiple key differential expression genes regulated by PS in the treatment of HUA. The DEGs were verified using RT-qPCR, and the trends were consistent with the RNA-seq (Figure 5). The RT-qPCR results showed that the mRNA expression levels of Slc7a8, Pck1, Mgll, and Bhmt in the renal tissues of the model group were significantly lower (p < 0.001 or p < 0.05) than the control group, and Fkbp5 in the model group were significantly higher (p < 0.001) than the control group. Slc7a8, Pck1, Mgll, and Bhmt are associated with the regulation of metabolic homeostasis in the treatment of metabolic syndrome [25,26,27,28], and Fkbp5 plays a crucial role in the inflammatory response [29]. PS upregulated the mRNA expressions of Slc7a8, Pck1, Mgll, and Bhmt, while it downregulated the mRNA expressions of Fkbp5 in potassium oxonate-induced HUA rats, indicating that PS ameliorates HUA induced by potassium oxonate. However, the specific mechanism needs to be further studied.

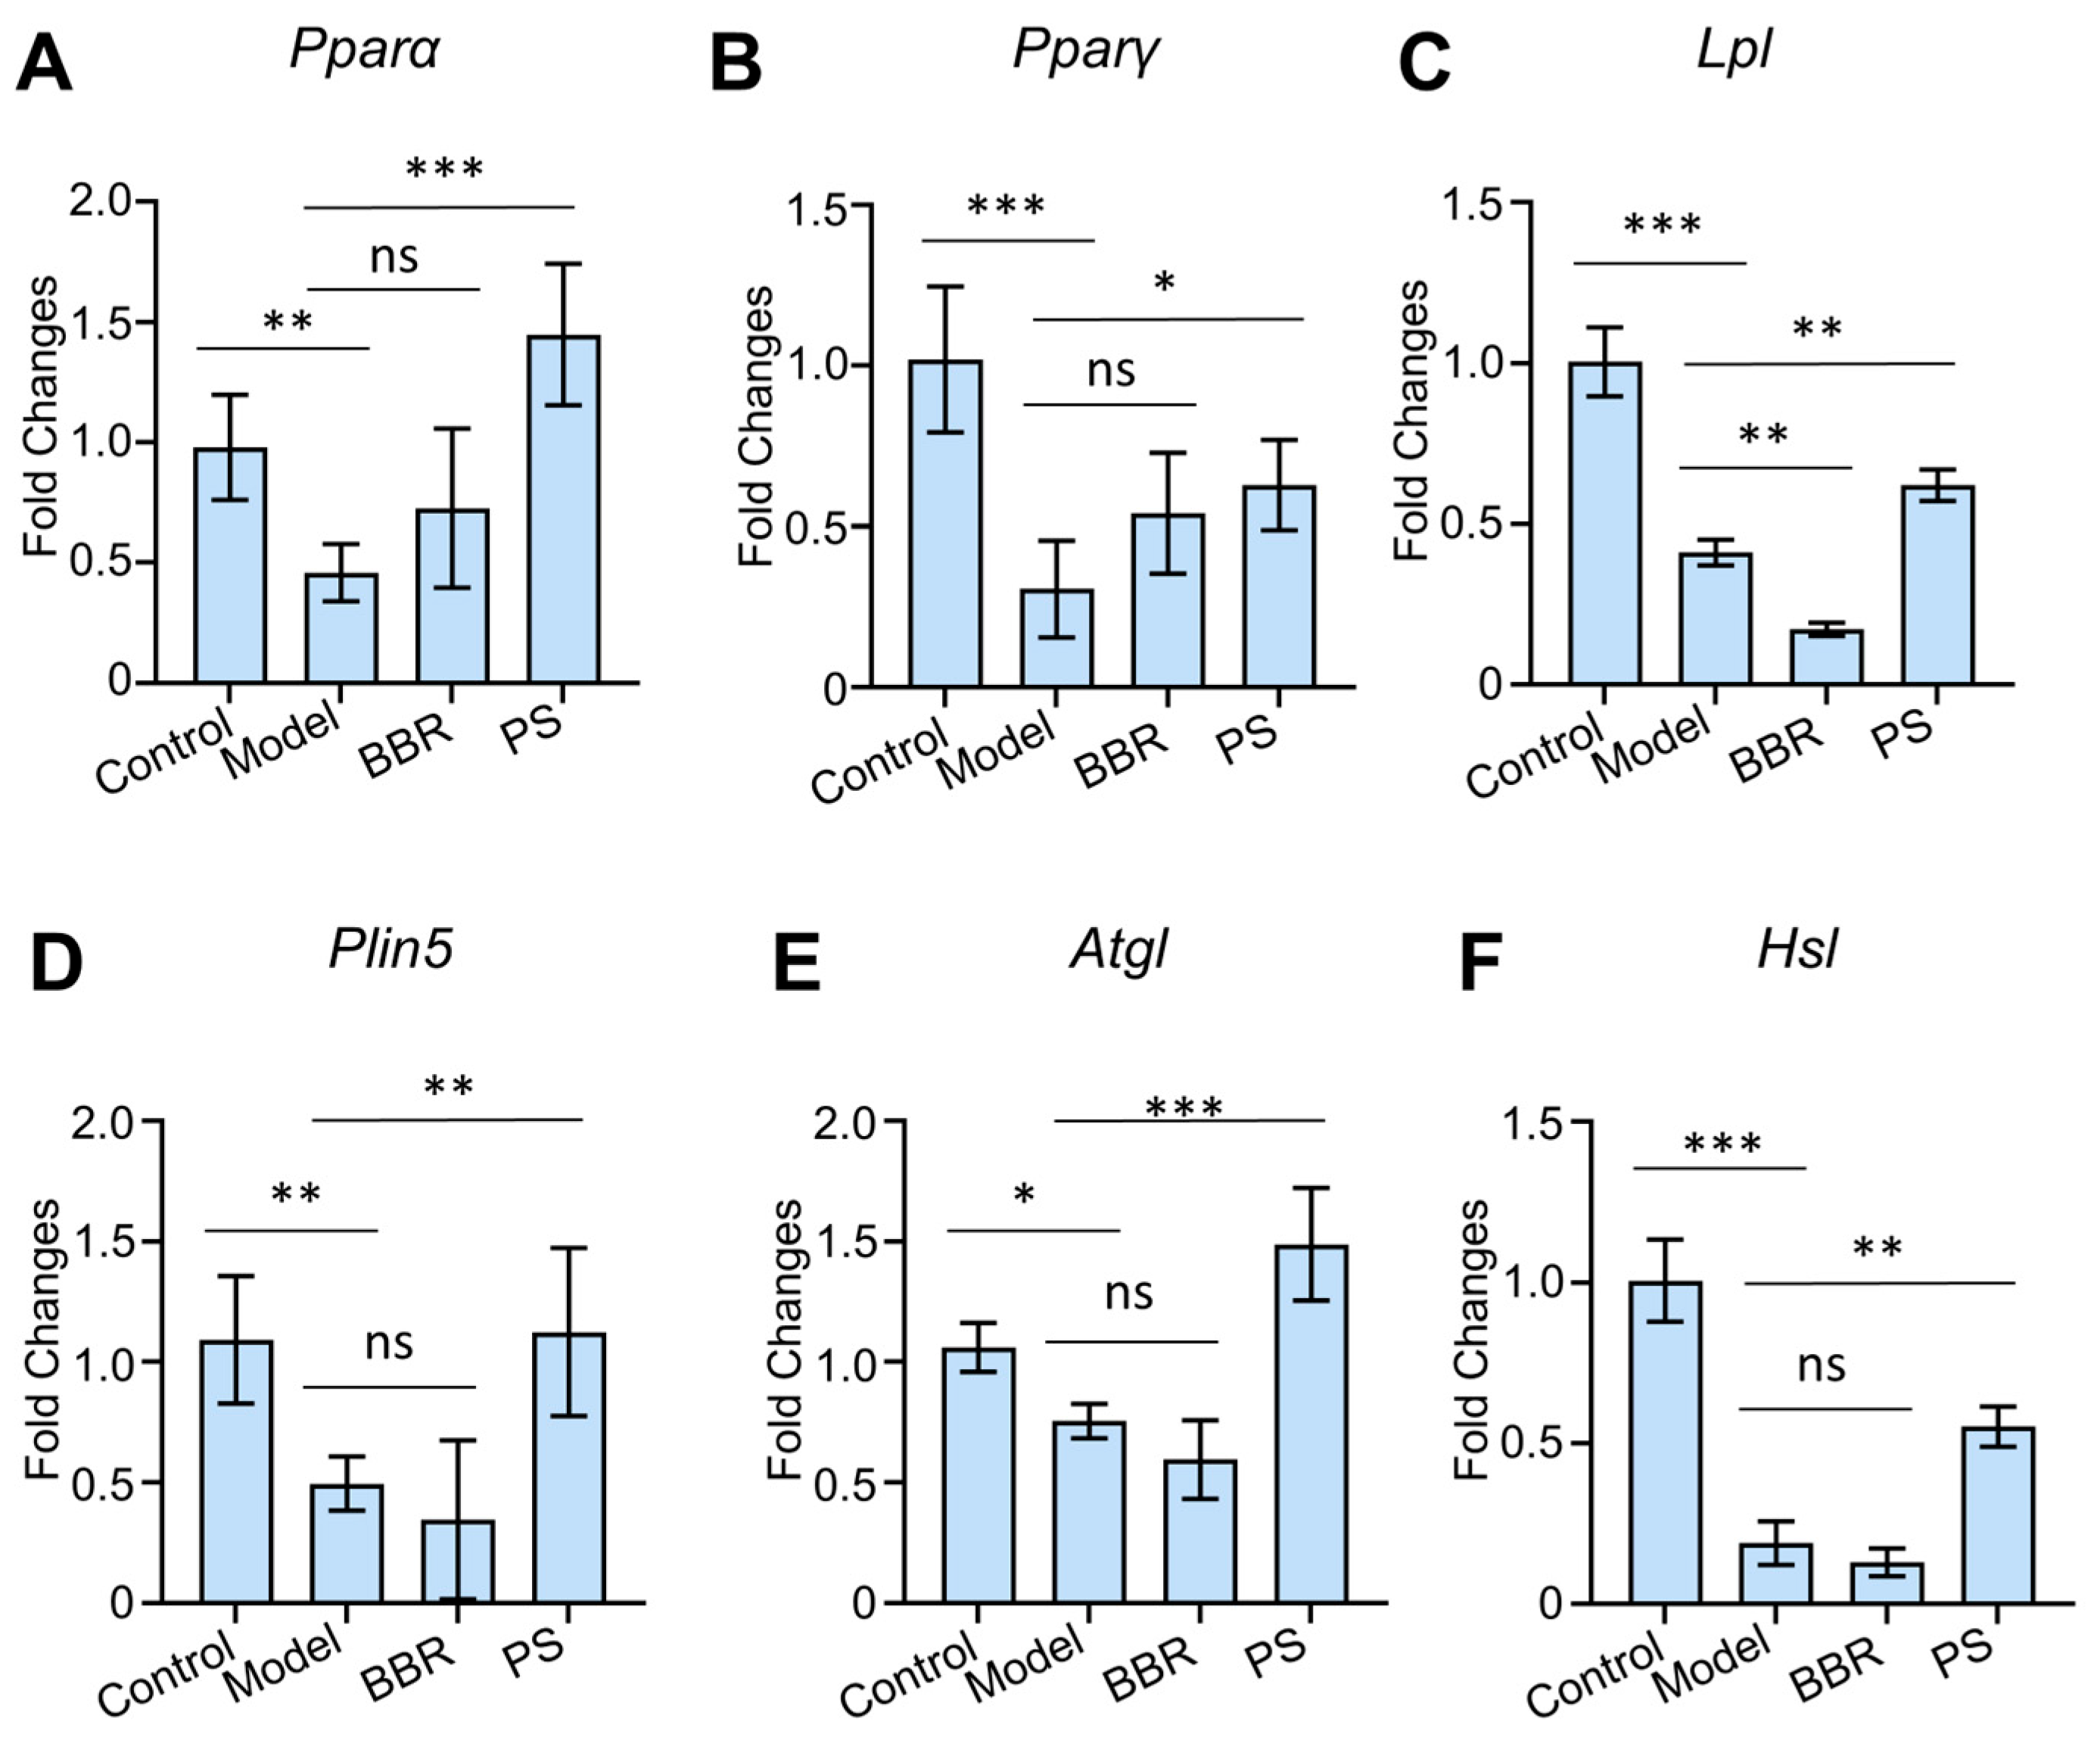
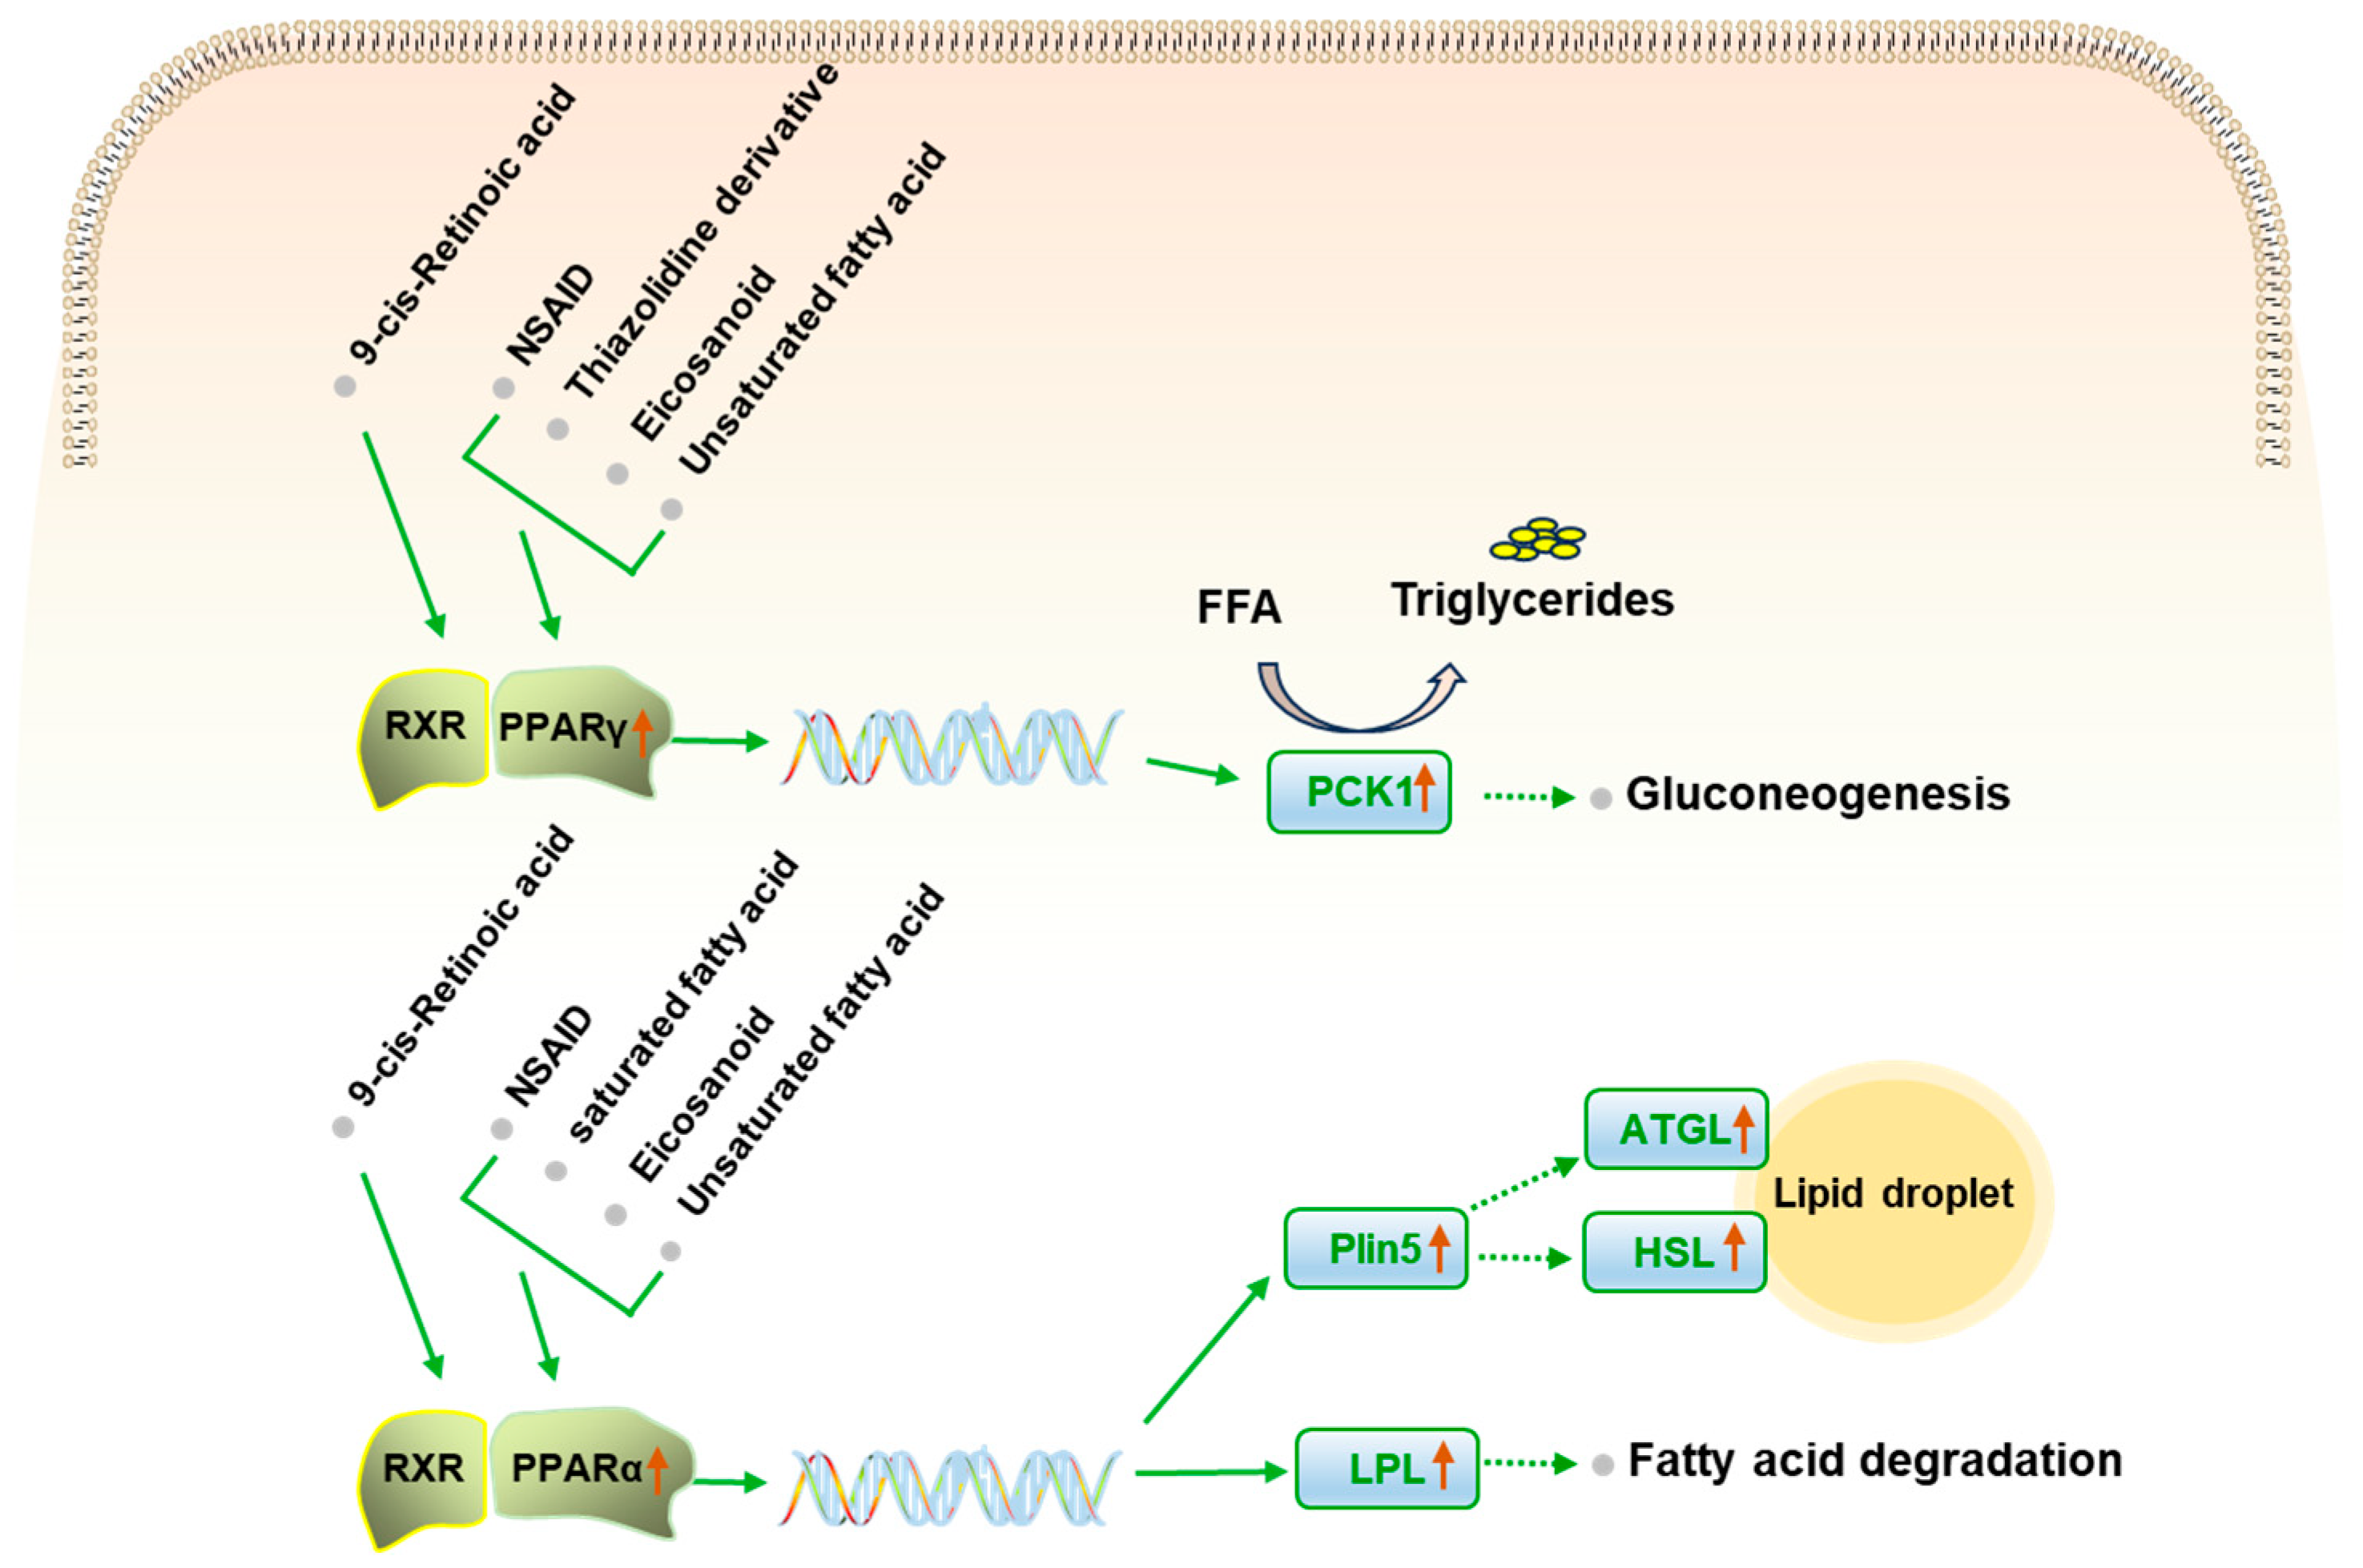
2.6. PS Regulates PPAR Signaling Pathway

In order to further explore the pathway regulated by PS regarding HUA, the effects of PS on mRNA expression associated with PPAR signaling pathway were explored using RT-qPCR (Figure 6). The result shows that PS upregulated the mRNA expressions of Pparα, Pparγ, Lpl, and Plin5 in the PPAR signaling pathway (p < 0.05) and upregulated expression of Hsl and Atgl, the downstream genes of Plin5 (p < 0.01). The results further prove the effect of PS on lipid metabolism (Figure 7).

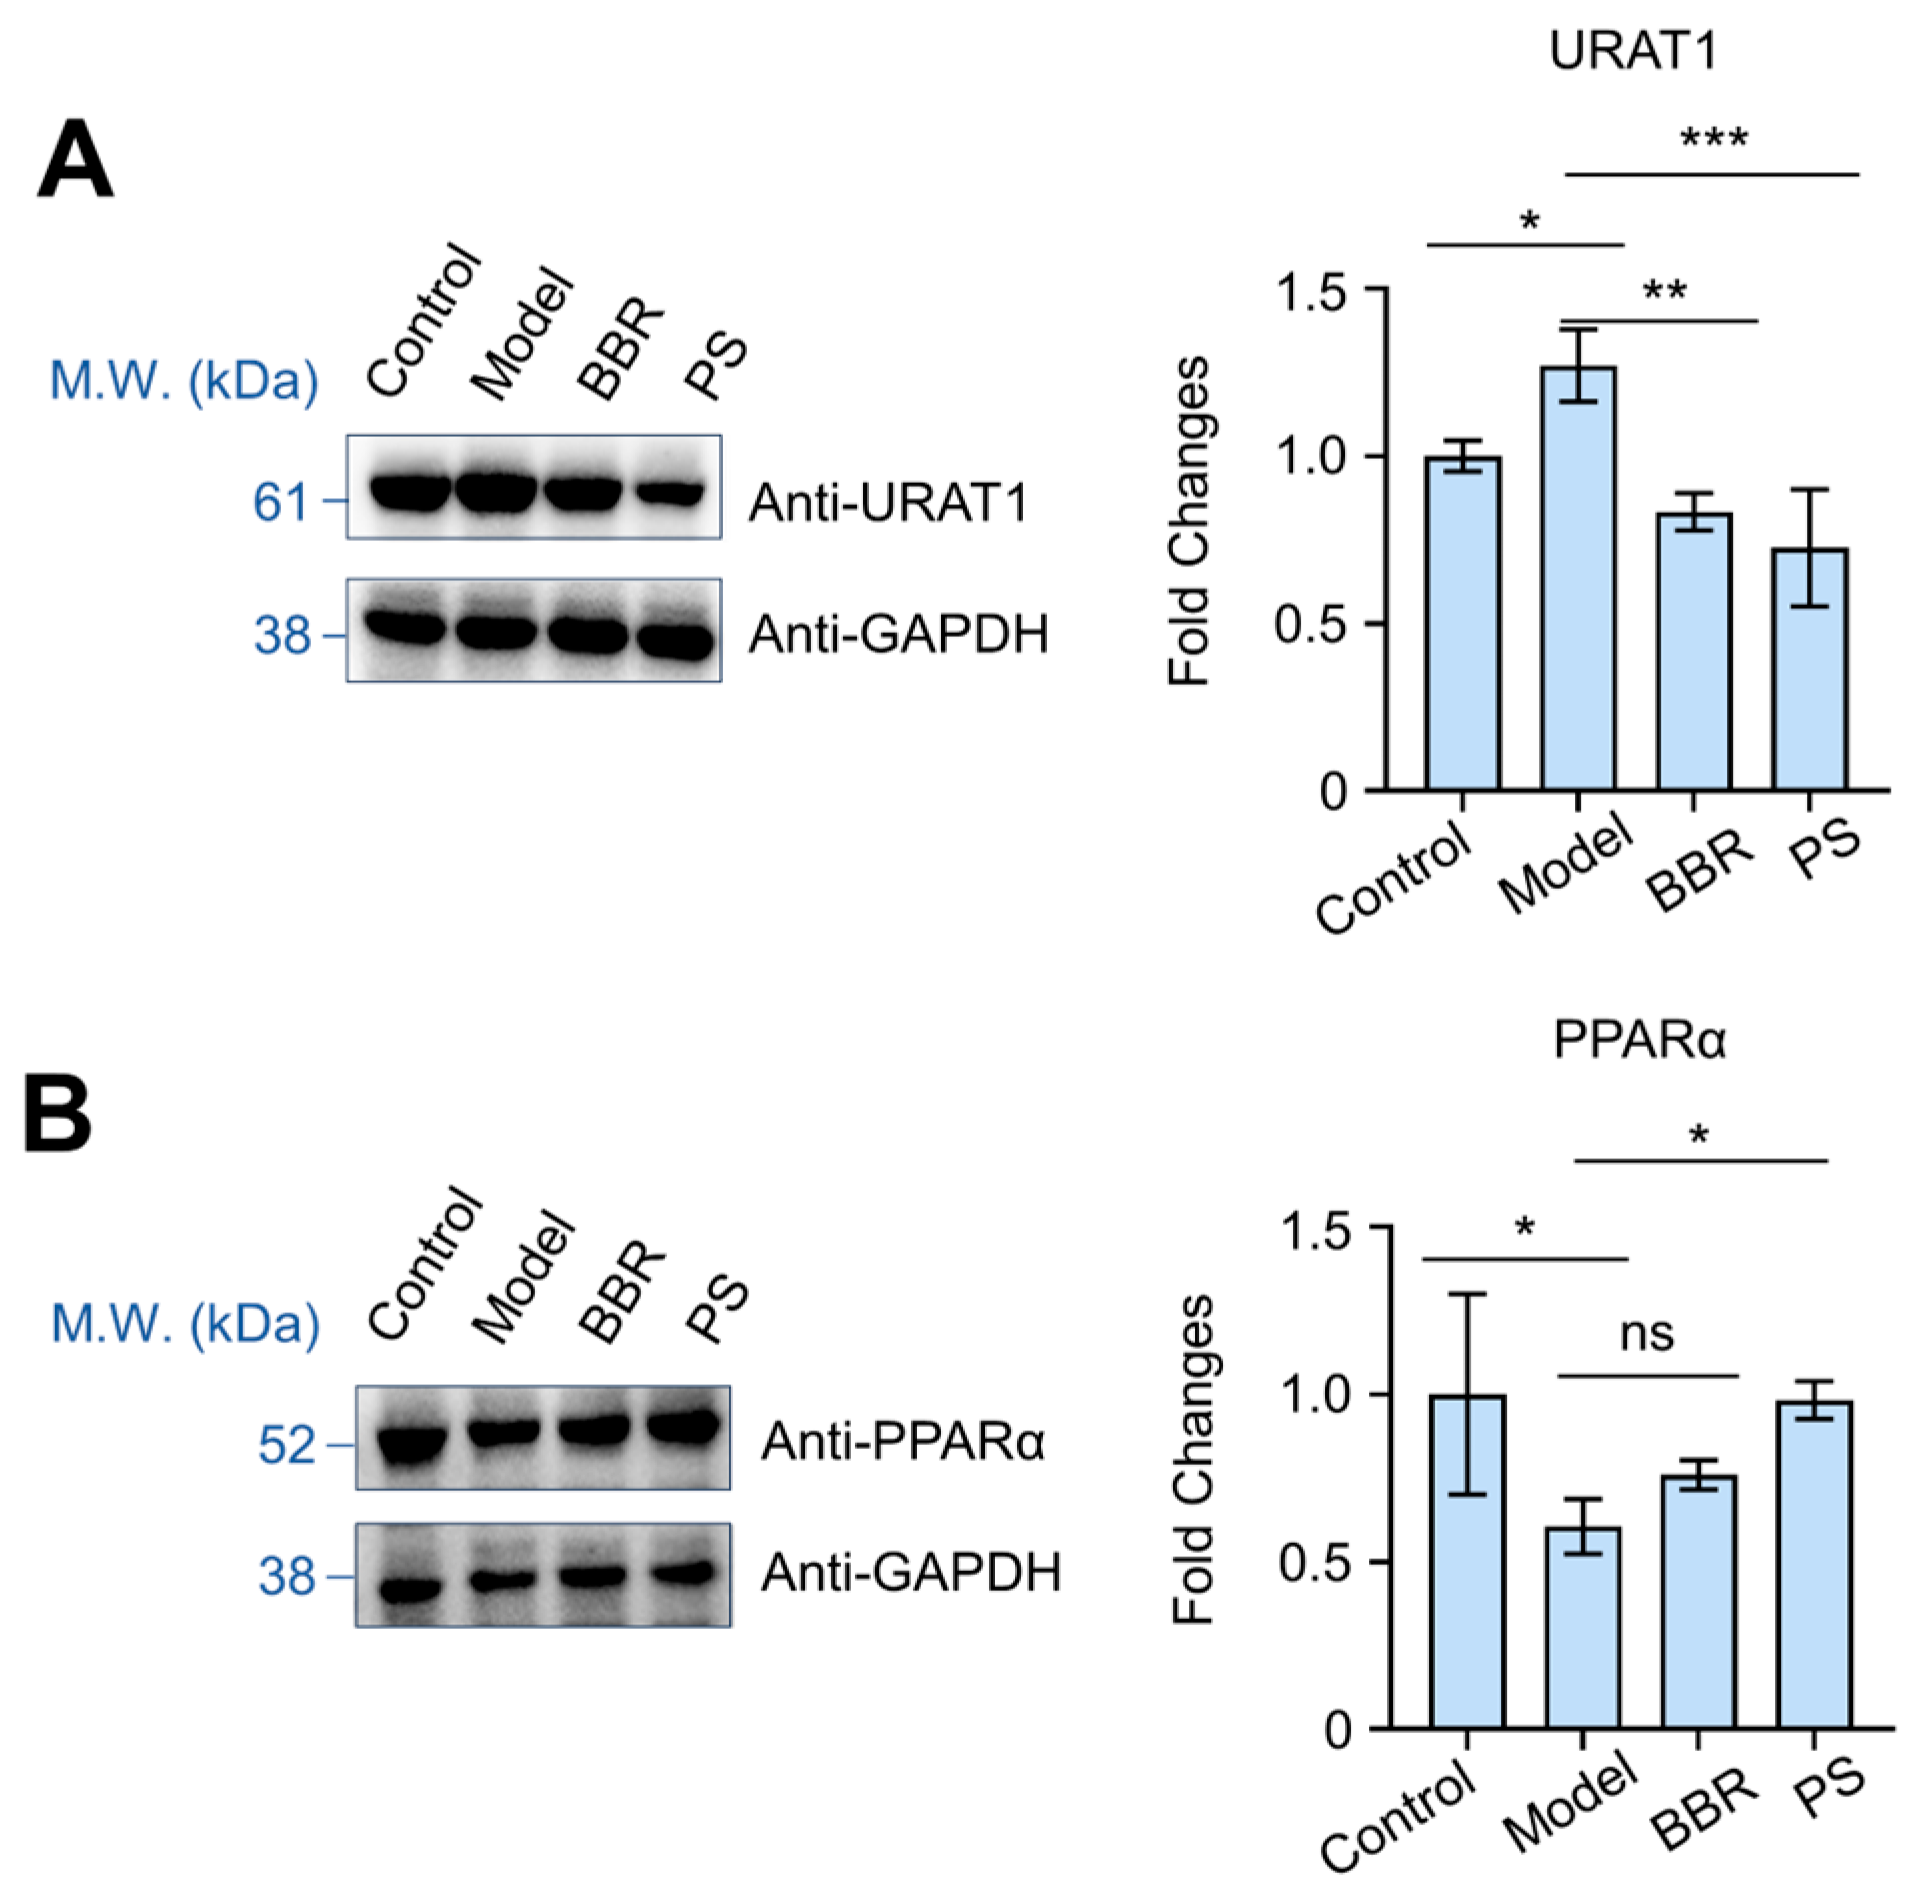
2.7. PS Regulates URAT1 and PPARα Proteins Expression

To further confirm the working mechanism of PS on regulating uric acid homeostasis, we investigated the effects of PS on the expression of URAT1 and PPARα. Western blot analysis showed that PS administration significantly downregulated kidney URAT1 and upregulated PPARα levels (Figure 8A,B). Compared to the normal control group, the URAT1 expression level was significantly increased (p < 0.05), and BBR or PS treatment reversed the elevated URAT1 (Figure 8A). Compared to the normal control group, PPARα expression level was significantly decreased (p < 0.05), and BBR or PS treatment upregulated PPARα levels (Figure 8B). URAT1 is a transporter responsible for uric acid reabsorption in renal tubules and is a key target for therapy of HUA [30]. Many uric acid-lowering drugs are URAT1 inhibitors. Inhibition of URAT1 reduces uric acid reabsorption and promotes uric acid excretion [23]. The transcriptional analysis suggests that the PPAR pathway is intimately related to PS’s activity against HUA, and here, the activation of PPARα further confirmed the key roles of the PPAR pathway involved in the activity of PS [31]. These observations clarify the working mechanism of PS, as shown by Western blot.

3. Discussion

As a traditional Chinese medicine, PS has been widely used in the clinical treatment of HUA, while the active ingredients and the working mechanism related to HUA have not been clear. In this paper, UPLC-QE-Orbitrap-MS was used to systematically analyze the components of PS that migrate to the blood; a total of 13 chemical components were identified in the rat serum sample. Notably, the prototype components present in PS, including acteoside, geniposidic acid, and isoacteoside, were detected in rat plasma after intragastric administration of PS extract, and the first two components are also key components for the quality control of medicinal materials. Acteoside and isoacteoside can lower uric acid by inhibiting XOD activity [32,33,34]. Luteolin showed inhibitory activity of XOD; it decreased expression levels of Urat1 and Glut9 while elevating organic anion transporter 1 (Oat1) and organic anion transporter 3 (Oat3) levels, leading to increased uric acid excretion [35,36]. Apigenin ameliorates hyperuricemic nephropathy by inhibiting Urat1 and Glut9 and relieving renal fibrosis [35,37]. Apigenin intervention decreased serum UA, XOD, IL-6, IL-1β, IL-18, and TNF-α as well as Urat1 and Glut9 levels and increased Oat1 [38]. Similarly, quercetin is another Urat1 inhibitor [39]. Geniposidic acid regulates lipid metabolism, inflammation, and oxidative stress and has the potential to improve HUA with abnormal lipid metabolism [40]. Aucubin activates Pparα, Pparγ, and Nrf2 to inhibit the production of fat, promote the oxidation of fatty acids, and regulate lipid metabolism [41]. Therefore, PS affects the production of uric acid by inhibiting XOD, and it promotes excretion of uric acid by regulating the uric acid transporter.
In this study, the results demonstrated the favorable therapeutic efficacy of PS in HUA prevention and therapy, manifesting in the amelioration of renal tissue pathology in the presence of HUA. PS lowered the levels of serum uric acid and serum xanthine oxidase (XOD) in model group rats and regulated TNF-α and IL-6 factors. XOD is a key enzyme in the production of uric acid and has a direct impact on the level of uric acid [20]; PS inhibits XOD activity to reduce uric acid and treat gout [34]. Furthermore, high uric acid is often associated with some inflammatory reactions, and lowering the inflammatory response can promote the excretion of uric acid in the kidneys [42,43]. PS has a certain inhibitory effect on the inflammatory response caused by HUA. Studies have shown that high uric acid can increase the expression of inflammatory factors induced by TNF-α in the TNF family and aggravate the inflammatory response [44]. PS effectively reduced TNF-α levels and suppressed the expression of TNF-α-induced inflammatory factors in HUA rats. HUA is closely related to inflammation, lipid metabolism [10], kidney disease, diabetes, etc. [45,46]. As a traditional Chinese medicine, PS enters the kidney channels and has the effects of disinhibiting water, penetrating dampness, and removing phlegm [7]. Reduced uric acid excretion is a key factor in primary hyperuricemia, accounting for about 90% [22]. Uric acid transporters exist widely in renal tubular epithelial cells, and a large number of studies showed that a decrease in renal uric acid excretion was closely related to uric acid transporters [23,47]. PS induced a decrease in the mRNA expression levels of Urat1 and Glut9 in the rat kidney model, suggested its potential in promoting uric acid excretion.
RNA-seq analysis showed that PS is involved in the oxoacid metabolic process, organic acid metabolic process, amino acid transmembrane transporter activity, and lipid metabolic process, suggesting PS’s potential role in lipid metabolic and amino acid metabolism. Earlier metabolomics studies demonstrated that PS treatment might be able to normalize metabolic perturbations caused by HUA. A total of 13 potential biomarkers were identified in HUA rats as being primarily involved in six metabolic pathways, namely the glycerophospholipids metabolism, linoleic acid metabolism, glycosylphosphatidylinositol anchor biosynthesis, alpha-linolenic acid metabolism, arachidonic acid metabolism, and the steroid biosynthesis pathways [13]. Phosphatidylcholine (PC), phosphatidylethanolamine (PE), and LysoPC are mainly involved in glycerophospholipids metabolism, and their levels were significantly increased in HUA rats. PS regulated PC, PE, and LysoPC in relation to HUA [13]. Glycerophospholipids metabolism is a series of catalytic reactions regulating the synthesis and degradation of glycerophosphate, which is closely related to development of metabolic diseases [48,49,50]. Glycerophospholipid metabolism is involved in the process of fat synthesis and degradation [51,52].
Combined with RNA-seq results, PS regulates lipid metabolism pathways including the PPAR signaling pathway, fatty acid degradation pathway, retinol metabolism pathway, and fatty acid elongation pathway. The PPAR signaling pathway is directly related to the regulation of lipid metabolism [53], Pck1, Pparα, Pparγ, Lpl, and Plin5 are implicated. Pck1 is directly involved in gluconeogenesis [54], Pparα and Pparγ play a key role in adipocyte differentiation and glucose uptake [55,56], and Lpl and Plin5 are involved in the dynamic change of lipid [57,58]. The fatty acid degradation pathway involves the decomposition of fatty acids through β-oxidation, and key genes such as Cyp4a1, Cpt2, and Acaa2 are involved. The retinol metabolism pathway involves Cyp2c23, Cyp26b1, Cyp4a1 and other enzymes; it is essential for the regulation of lipid homeostasis [59]. Fatty acid elongation is directly involved in modifying the length of fatty acid chains, and Acot4 and Acaa2 are involved in this process. It was demonstrated that HUA is a possible risk factor for dysregulation in lipid metabolism [60]. RNA-seq results indicated PS regulates amino acid metabolism pathways, including protein digestion and absorption; glycine, serine, and threonine metabolism; and phenylalanine metabolism pathways. The transporters Slc7a8, Slc6a19, Slc16a10, Slc38a2, Slc15a1, and Col1a1 in the protein digestion and absorption pathway affect the absorption of amino acids from dietary proteins and the production of uric acid [61]. The glycine, serine, and threonine metabolism pathway involves the differentially expressed genes Bhmt, Gatm, and Phgdh; it is essential for the production of nucleotides [62], and the breakdown of nucleotides leads to the formation of uric acid [63]. Our previous studies revealed PS’s capability to alleviate inflammation [13], and the RNA-seq results suggest the mechanisms of PS against HUA are related to the inflammatory mediator regulation of TRP channels and arachidonic acid metabolism pathways. There was no pathway related to adverse drug reactions, such as liver and kidney injury, found in the pathways identified by RNA-seq, and no obvious side effects was observed in the histopathological studies of the current research, indicating that PS has a high safety threshold.
The RT-qPCR results indicated that PS upregulated the mRNA expressions of Slc7a8, Pck1, Mgll, and Bhmt and downregulated the mRNA expressions of Fkbp5, which are consistent with the results of RNA-seq. Slc7a8 is associated with hypertension and obesity [25,64,65]. Pck1 is a gluconeogenic enzyme in the PPAR pathway and holds a well-established role in gluconeogenesis within the liver and kidney, which influences fat production and metabolism and thus is involved in metabolic syndrome [66]. Pck1 is highly expressed in proximal tubules and is essential for maintaining renal tubule acid–base control, physiology, and lactate and glucose homeostasis. Bhmt is cysteine methyltransferase in the glycine, serine, and threonine metabolism pathway, which contributes to the metabolism of amino acids and hepatic gluconeogenesis [27] and affects homocysteine metabolism in the kidney [28]. Mgll is an enzyme that converts triglycerides to free fatty acids [26], and it plays an important role in lipid metabolism. Fkbp5, a prominent mRNA in the tubulointerstitial compartment [67], has implications for fibrosis [68] and inflammation [29], and PS exerts a downregulating effect on its expression. The results suggest PS’s role in addressing lipid metabolic anomalies triggered by HUA. The PPAR signaling pathway is closely related to lipid metabolism [69], and our study showed that PS regulated Pparα and Pparγ, Lpl, and Plin5 expression to impact lipid metabolism, further influencing Urat1 and Glut9 expression and leading to reduced uric acid reabsorption. Western blotting results further demonstrated the regulation of PS on the expression of URAT1 and PPARα proteins, suggesting that PS regulates lipid metabolism through the PPAR pathway, reducing the levels of uric acid by inhibiting the URAT1. In addition, the single-nucleotide polymorphisms in URAT1 were certified to be associated with the pathogenesis of metabolic syndrome [47]. Clinical studies have found that HUA is associated with hyperlipidemia and is related to lipid metabolism disorders, which can be considered as a risk factor for hyperlipemia and an independent predictive factor [70]. Epidemiological research showed that HUA is significantly correlated with blood lipid abnormalities [71]. The effect of PS on the regulation of uric acid and lipid showed its potential in the treatment of HUA and HUA-induced lipid metabolism abnormalities and metabolic syndrome. PS has a long history of clinical use, and it has few side effects. As a traditional Chinese medicine, PS has multi-component, multi-target, and multi-pathway characteristics. It acts on uric acid transporters to lower uric acid levels, regulates lipid metabolism disorders, and alleviates inflammatory responses. Comprehensive treatment can be carried out from various aspects, demonstrating its potential in the treatment of HUA.

4. Materials and Methods

4.1. Materials and Reagents

Plant name: Plantaginis semen, the dried, ripe seed of Plantago asiatica L. (https://www.worldfloraonline.org/taxon/wfo-0000487709, accessed on 26 July 2024) or Plantago depressa Willd. (https://www.worldfloraonline.org/taxon/wfo-0000486802, accessed on 26 July 2024). It is harvested in the summer and autumn when the seeds are ripe. The local name is “Cheqianzi”.
PS was purchased from Beijing Qiancao Traditional Chinese Medicine Slices Co., Ltd. (Beijing, China, NO. 200610005) and identified by Professor Yaojun Yang of Beijing University of Traditional Chinese Medicine as the dried and mature seed of Plantago asiatica L. Benzbromarone tablets were produced by Excella GmbH (Nurnberger, Germany). Potassium oxonate was provided by Shanghai Macklin Biochemical Co., Ltd. (Shanghai, China). Acteoside (NO. DSTDL006101), isoacteoside (NO. DST200513-060), geniposidic acid (NO. DST200624-040), luteolin (NO. DST200910-032), quercetin (NO. DSTDH002801), aucubin (NO. DST200706-004), eriodictyol (NO. DSTDS004201), apigenin (NO. DST200809-026), and ursolic acid (NO. DSTDX001901) were all purchased from Chengdu Desite Biotechnology Co., Ltd. (Chengdu, China), with a purity of >98%.
The MS-grade acetonitrile, methanol, and formic acid were obtained from Thermo Fisher Scientific Co., Ltd. (Shanghai, China). Analytical acetonitrile methanol and formic acid were obtained from Tianjin Zhiyuan Chemical Reagent Co., Ltd. (Tianjin, China). Distilled water was purchased from Guangzhou Watsons Food and Beverage Co., Ltd. (Guangzhou, China).

4.2. Samples Preparation and Standard Solutions

One kilogram of PS was crushed and passed through a 24-mesh sieve; 65% ethanol of 8 times the amount of medicinal material was added, and it was heated and refluxed 3 times, 2 h each time. The filtrates obtained from three reflux times were mixed. Sample solution: The filtrate was cooled to room temperature and centrifuged at 12,000 rpm for 15 min, yielding the supernatant. Gavage solution: The filtrate was concentrated in a thermostatic water bath at 80 °C to a concentration of 2.0 g/mL of the crude drug and refrigerated for further use.
Standard solution: We took a proper amount of acteoside, isoacteoside, geniposidic acid, luteolin, quercetin, aucubin, eriodictyol, apigenin, and ursolic acid and added methanol to dissolve it, obtaining the single-reference solution. The mixed standard solution was obtained by mixing and diluting each reference solution.

4.3. Analysis of PS Components Migrating into the Blood

Twelve healthy Sprague–Dawley rats (male, SPF-grade, 200 ± 20 g, 6 weeks) were purchased from Vital River Laboratory Animal Technology Co., Ltd. (Beijing, China), certificate number: SYXK (jing) 2020-0033. Rats were fed in an animal room with standard laboratory environment (temperature: 20–25 °C, relative humidity: 50–65%, 12 h light and 12 h dark daily to simulate the diurnal cycle). The rats were fed adaptively for 3 days and then randomly divided into 2 groups (n = 6), including the control group (group A) and the PS-administration group (group B). In group B, the gavage solution was given intragastrically for three consecutive days according to weight (30 g/kg), and the rats were fasted for 12 h before the last administration. Group A was given the same dose of distilled water. In group B, the plasma samples were collected from the fundus vein of rats at 15 min, 30 min, 1 h, 1.5 h, 2 h, 4 h, and 6 h after administration, respectively. The obtained plasma samples were centrifuged at 3500 rpm and 4 °C for 10 min, and the supernatant was stored at –80 °C for later use.
Then, 50 μL of plasma was collected from each group at different blood collection points and combined with 3 times the amount of acetonitrile, vortexed for 5 min, and centrifuged at 12,000 rpm for 15 min at 4 °C. The supernatants were taken and dried with nitrogen, and the residue was added to 400 μL 50% methanol, vortexed for 5 min, dissolved, and centrifuged at 12,000 rpm for 15 min, after which the supernatants were collected for subsequent analysis.

4.4. Qualitative Analysis by UPLC-QE-Orbitrap-MS

Qualitative analysis was conducted using an ACQUITY UPLC BEH C18 Column (2.1 mm × 100 mm, 1.7 μm, Waters Corp., MA, USA) with a temperature of 30 °C by UPLC (Thermo Fisher Ultimate 3000, MA, USA) coupled with a QE-Orbitrap mass spectrometer (Thermo Fisher Ultimate, MA, USA). The mobile phase was composed of 0.1% (volume fraction) formic acid aqueous solution (A)-methanol (B) with a gradient elution procedure as follows: 0~1 min, 2% B; 1~4 min, 2%~30% B; 4~12 min, 30% B; 12~13 min, 30~40% B; 13~15 min, 40% B; 15~17 min, 40~60% B; 17~23 min, 60~66% B; 23~24 min, 66% B; 24~30 min, 66~98% B; 30~31 min, 98% B; 31~32 min, 98~2% B; and 32~33 min, 2% B. The flow rate was set at 0.25 mL/min, the sample chamber temperature was maintained at 4 °C, and the injection volume was 2 μL.
In mass spectrometry, the electric spray ionization source (ESI) was employed in both negative and positive modes, and the MS conditions used for analysis were as follows: the scanning mode was full scan/data-dependent secondary scan (dd-MS2) and covered the mass-to-charge (m/z) range from 100 to 1200 with a full scan at a primary MS resolution of 70,000 and dd-MS2 resolution of 17,500; the capillary temperature was 350 °C, the spray voltage of positive-ion mode was 3.5 kV, the spray voltage of negative-ion mode was 2.5 kV, the sheath gas flow rate was 35 arb (arbitrary units), and the aux gas flow rate was 15 arb; MS2 adopted three kinds of collision energy: 30 V, 50 V, and 70 V.

4.5. HUA Rat Model Establishment and Drugs Administration

Male Sprague–Dawley rats (220 ± 20 g, SPF, 6–7 weeks, certificate number: SCKY (jing) 2021-0011) were purchased from Beijing Vitong Lihua Experimental Animal Technology Co., Ltd. (Beijing, China). The rats were maintained in a room with a controlled temperature (20–25 °C). All experimental animals were kept for a 3-day acclimation period before the experiments. All experimental procedures and protocols were reviewed and approved by the Animal Care and Use Committee of the Beijing University of Chinese Medicine (Approval number: BUCM-2023051103-2225). All experiments were performed in accordance with the approved Regulations on the Management of Experimental Animals and the Detailed Rules on the Management of Chinese Medical Experimental Animals.
The HUA rat model was established by intragastric administration of potassium oxonate for 28 days [72,73]. The success of the model was judged by serum uric acid, serum xanthine oxidase levels, and the pathological changes in the kidney of rats [74,75,76]. Thirty-two rats were randomly divided into four groups (n = 8): the control group (control), model group (model), benzbromarone group (BBR), and Plantaginis semen group (PS). At 1 h before administration, rats were given potassium oxonate by intragastric administration at a dose of 1.5 g/kg. Administration and modeling induction were carried out simultaneously for 28 days. The control group was given the corresponding volume of distilled water by intragastric administration. The PS group was given PS at a dosage of 3.75 g/kg by intragastric administration. The BBR group was given benzbromarone (10 mg/kg). The dosage of PS is detailed in the previous study and was explored in the early stage. As can be seen in the reference, the dosages of 0.9375, 1.875 and 3.75 g/kg were compared, and the group with a dosage of 3.75 g/kg had the best effect on lowering uric acid [13]. The animals fasted overnight on the last day of the experimental model, and then anesthesia was induced and samples collected. After 28 days, the blood and kidneys (one kidney was fixed with 4% paraformaldehyde fixation and the other was stored at −80 °C) were collected. The blood samples were centrifuged at 3500 rpm for 15 min, and the supernatants were collected and refrigerated at −80 °C.

4.6. Biochemical Index Detection

An enzyme-linked immunosorbent assay was used to detect UA, XOD, TNF-α, and IL-6 in serum, and the experiments were conducted in strict accordance with the instructions by microplate reader (BioTek Epoch, Santa Clara, CA, USA). ELISA kits were purchased from Jiangsu Kete Biotechnology Co., Ltd. (Xuzhou, Jiangsu, China)

4.7. Hematoxylin–Eosin (H&E) Staining

Paraffin-embedded kidney slices (4 µm) were placed in a 60 °C incubator and baked. Then, the slides were immersed for dewaxing (xylene I 20 min → xylene II 20 min → Anhydrous ethanol Ⅰ 10 min → anhydrous ethanol II 10 min → 95% alcohol 5 min → 90% alcohol 5 min → 80% alcohol 5 min → 75% alcohol 5 min → distilled water). Then, the slices were dyed in hematoxylin for 5 min, washed with tap water, put into 1% hydrochloric acid alcohol solution for a few seconds, rinsed with tap water, put into 0.6% ammonia water to blue, and rinsed with running water again. Then, the slices were kept in an eosin dyeing solution and stained for 2 min. After dehydration and xylene removal twice, the tissue sections were sealed with neutral gum and manually scanned with a light microscope (Nikon Corporation, Tokyo, Japan).

4.8. RNA Sequencing

Renal tissue samples were used to extract total RNA, which was then analyzed for concentration and purity using Nanodrop 2000 (Thermo Fisher Scientific Co., Ltd.). Magnetic beads and Oligo (dT) were used to enrich mRNA. By adding the fragmentation buffer, mRNA was randomly fragmented, and small fragments of about 300 bp were enriched by magnetic bead. Under the action of reverse transcriptase, six-base random hexamers were added to invert the mRNA template to synthesize a strand cDNA, and a stable double-strand structure was then formed by double-strand synthesis. The SuperScript double-stranded cDNA synthesis kit (Invitrogen, Waltham, CA, USA) and random hexamer primers (Illumina, San Diego, CA, USA) were used. In accordance with Illumina’s library construction protocol, the synthesized cDNA was subjected to end-repair, phosphorylation, and “A” base addition and sequenced using the Illumina Novaseq 6000 platform.
To identify DEGs between two samples, the transcripts per million reads method was used to calculate the expression levels of each transcript. Gene abundance was quantified using RSEM [77], and DESeq2 [78] was used to determine DGEs based on |log2 (Fold Change)| ≧ 1 and FDR ≤ 0.05 (DESeq2) or FDR ≤ 0.001 (DEGseq). Then, functional enrichment analyses including GO and KEGG were performed by Goatools and KOBAS [77], respectively.

4.9. Real-Time Quantitative PCR

RT-qPCR was performed to detect the transcription levels of gene mRNAs in renal tissue samples. Total RNA was isolated from kidney tissues using FastPure® Cell/Tissue Total RNA Isolation Kit (RC101, Vazyme, Nanjing, China), and RNA concentration and purity were measured by spectrophotometry. RNA was reverse-transcribed using the ABScript III RT Master Mix (RK20429, ABclonal, Wuhan, China). RT-qPCR was performed by Bio-Rad Real-time PCR (CFX96 Touch, Bio-Rad, Hercules, CA, USA) and 2X Universal SYBR Green Fast qPCR Mix (RK21203, ABclonal, Wuhan, China). Relative gene expression was calculated using the 2−∆∆Ct method with Gapdh as an internal control. The primer sequences reported previously [79,80,81,82,83,84,85,86,87,88,89,90,91] were used in the current study (Table 3).

4.10. Western Blotting

Rat kidney tissues were lysed with RIPA buffer containing phosphatase and protease inhibitors, and total protein was quantified using a BCA kit (A045-4-2, Nanjing, China). After denaturation at 100 °C for 5 min, the protein was diluted with 3 times the loading buffer for SDS-PAGE electrophoresis and then transferred to PVDF membranes and blocked with TBST containing 5% milk powder for 1 h with gentle shaking. The PVDF membrane was incubated at 4 °C overnight with primary antibodies as follows: URAT1 (61 kD, Cat# YN3803, 1:1000, Immunoway), PPARα (52 kD, Cat# YT3835, 1:1000, Immunoway, Plano, TX, USA), and GAPDH (38 kD, Cat# YM3029, 1:1000, Immunoway, TX, USA). Then, it was incubated with secondary goat anti-rabbit IgG (H+L) [86 RS0002, 1:5000, Immunoway] or goat anti-mouse IgG (H+L) [86 RS0001, 1:5000, Immunoway] at room temperature. The PVDF membrane blot was developed using the ChemiDoc imaging system (ChemiDoc MP, Bio-rad, Hercules, CA, USA) and analyzed using ImageJ software (version 1.54j).

4.11. Statistical Analysis

The in vitro data are presented as mean ± standard deviation (SD). Significance was analyzed using GraphPad Prism 6.0 (GraphPad Software Inc., Boston, MA, USA) through one-way ANOVA. * p < 0.05, ** p < 0.01, and *** p < 0.001 are considered statistically significant.

5. Conclusions

In this study, UPLC-QE-Orbitrap-MS and multi-omics techniques were employed to identify the bioactive components of PS in vitro and in vivo, and the serum UA, XOD, and cytokine levels confirmed the efficacy of PS in prevention of HUA. The efficacy of PS for HUA mainly involves the oxoacid metabolic process, organic acid metabolic process, amino acid transmembrane transporter activity, and lipid metabolic process. PS is involved in regulating lipid metabolism, amino acid metabolism, and inflammatory response. PS upregulated mRNA levels of Slc7a8, Pck1, Mgll, and Bhmt while downregulating the mRNA expression of Fkbp5. These observations suggest that PS activates the PPAR signaling pathway and regulated uric acid transporters. These findings pave solid foundations for illustrating the anti-HUA mechanisms of PS and clarifying potential active ingredients, opening the path for further investigation of PS for HUA.

Author Contributions

The study was designed by Q.M.; L.W. performed the UPLC-QE-Orbitrap-MS analysis; T.L. performed the RNA-seq and RT-qPCR experiments; animal studies were performed by L.W., T.L., K.W., L.M., L.J., G.X.; T.L., L.M. and K.W. wrote the manuscript; T.L., L.J. and S.W. analyzed the data and composed the manuscript. All data were generated in-house, and no paper mill was used. All authors agree to be accountable for all aspects of work, ensuring integrity and accuracy. All authors have read and agreed to the published version of the manuscript.

Funding

This research received no external funding.

Institutional Review Board Statement

Not applicable.

Informed Consent Statement

Not applicable.

Data Availability Statement

The raw data supporting the conclusions of this article will be made available by the authors on request.

Acknowledgments

This work was supported by the Fundamental Research Funds from Beijing University of Chinese Medicine (2023-JYB-KYPT-13).

Conflicts of Interest

The authors declare that they have no known competing interests or personal relationships that could have appeared to influence the work reported in this paper.

Abbreviations

Acaa2Acetyl-CoA acyltransferase 2
Acot4Acyl-CoA thioesterase 4
AtglAdipose triglyceride lipase
BhmtBetaine-homocysteine S-Methyltransferase
Col1a1Collagen Type I Alpha 1 Chain
Cpt2Carnitine palmitoyltransferase 2
DEGsDifferential expression genes
DEMsDifferentially expressed metabolites
ELISAEnzyme-linked immunosorbent assay
Fkbp5FKBP prolyl isomerase 5
H&EHematoxylin–eosin
HslHormone-sensitive lipase
HUAHyperuricemia
GatmGlycine amidinotransferase
Glut9Glucose transporter 9
IL-1βInterleukin-1β
IL-6Interleukin-6
LplLipoprotein lipase
MgllMonoacylglycerol lipase
Pck1Phosphoenolpyruvate carboxykinase 1
Phgdh3-Phosphoglycerate dehydrogenase
PI3KPhosphatidylinositol 3-kinase
Plin5Perilipin-5
PSPlantaginis semen
PPARPeroxisome proliferators-activated receptors
RNA-seqRNA sequencing
RT-qPCRReal-time quantitative PCR
Slc7a8Solute carrier family 7 member 8
TGF-β1Transforming growth factor beta 1
TNFTumor necrosis factor
UAUric acid
UPLC-QE-Orbitrap-MSUltra-high-performance liquid chromatography–tandem quadrupole electrostatic field–orbital trap–mass spectrometry
Urat1Urate anion transporter 1
XODXanthine oxidase

References

  1. Zhu, J.W.; Zeng, Y.; Zhang, H.Y.; Qu, Y.Y.; Ying, Z.Y.; Sun, Y.J.; Hu, Y.; Chen, W.W.; Yang, H.Z.; Yang, J.; et al. The Association of Hyperuricemia and Gout with the Risk of Cardiovascular Diseases: A Cohort and Mendelian Randomization Study in UK Biobank. Front. Med. 2022, 8, 817150. [Google Scholar] [CrossRef] [PubMed]
  2. Wei, X.; Zhang, M.; Huang, S.; Lan, X.Z.; Zheng, J.; Luo, H.; He, Y.; Lei, W. Hyperuricemia: A key contributor to endothelial dysfunction in cardiovascular diseases. FASEB J. 2023, 37, e23012. [Google Scholar] [CrossRef] [PubMed]
  3. Piani, F.; Agnoletti, D.; Borghi, C. Advances in pharmacotherapies for hyperuricemia. Expert Opin. Pharmacol. 2023, 24, 737–745. [Google Scholar] [CrossRef] [PubMed]
  4. Thong, B.Y.H.; Vultaggio, A.; Rerkpattanapipat, T.; Schrijvers, R. Prevention of Drug Hypersensitivity Reactions: Prescreening and Premedication. J. Allergy Clin. Immunol. Pract. 2021, 9, 2958–2966. [Google Scholar] [CrossRef] [PubMed]
  5. Felser, A.; Lindinger, P.W.; Schnell, D.; Kratschmar, D.V.; Odermatt, A.; Mies, S.; Jenö, P.; Krähenbühl, S. Hepatocellular toxicity of benzbromarone: Effects on mitochondrial function and structure. Toxicology 2014, 324, 136–146. [Google Scholar] [CrossRef] [PubMed]
  6. Guo, X.L.; Gao, Y.Y.; Yang, Y.X.; Zhu, Q.F.; Guan, H.Y.; He, X.; Zhang, C.L.; Wang, Y.; Xu, G.B.; Zou, S.H.; et al. Amelioration effects of α-viniferin on hyperuricemia and hyperuricemia-induced kidney injury in mice. Phytomedicine 2023, 116, 154868. [Google Scholar] [CrossRef] [PubMed]
  7. Chinese Pharmacopoeia Commission. Chinese Pharmacopoeia; China Science and Technology Press: Beijing, China, 2020. [Google Scholar]
  8. Li, C.; Wen, R.; Liu, W.; Liu, Q.; Yan, L.P.; Wu, J.X.; Guo, Y.J.; Li, S.Y.; Gong, Q.F.; Yu, H. Diuretic Effect and Metabolomics Analysis of Crude and Salt-Processed Plantaginis Semen. Front. Pharmacol. 2020, 11, 563157. [Google Scholar] [CrossRef]
  9. Zhao, H.; Gao, Q.; Kong, L.Z.; Tang, W.W.; Jiao, Y.Y.; Wang, Y.L.; Yu, Z.; Feng, Y. Study on Network Pharmacological Analysis and Preliminary Validation to Understand the Mechanisms of Plantaginis Semen in Treatment of Gouty Nephropathy. Evid.-Based Complement. Altern. Med. 2020, 2020, 8861110. [Google Scholar] [CrossRef] [PubMed]
  10. Zhao, H.; Xu, J.; Wang, R.; Tang, W.; Kong, L.; Wang, W.; Wang, L.; Zhang, Y.; Ma, W. Plantaginis Semen polysaccharides ameliorate renal damage through regulating NLRP3 inflammasome in gouty nephropathy rats. Food Funct. 2021, 12, 2543–2553. [Google Scholar] [CrossRef] [PubMed]
  11. Yang, Q.; Qi, M.; Tong, R.; Wang, D.; Ding, L.; Li, Z.; Huang, C.; Wang, Z.; Yang, L. Plantago asiatica L. Seed Extract Improves Lipid Accumulation and Hyperglycemia in High-Fat Diet-Induced Obese Mice. Int. J. Mol. Sci 2017, 18, 1393. [Google Scholar] [CrossRef]
  12. Qin, N.K.; Qin, M.; Shi, W.J.; Kong, L.B.; Wang, L.T.; Xu, G.; Guo, Y.Y.; Zhang, J.Y.; Ma, Q. Investigation of pathogenesis of hyperuricemia based on untargeted and targeted metabolomics. Sci. Rep. 2022, 12, 13980. [Google Scholar] [CrossRef] [PubMed]
  13. Yang, F.; Shi, W.J.; Wang, L.T.; Qin, N.K.; Wang, C.X.; Guo, Y.Y.; Xu, G.; Fang, J.; Yu, X.; Ma, Q. Lipidomics study of the therapeutic mechanism of Plantaginis Semen in potassium oxonate-induced hyperuricemia rat. BMC Complement. Med. Ther. 2021, 21, 175. [Google Scholar] [CrossRef] [PubMed]
  14. Wu, H.; Cao, Y.; Qu, Y.; Li, T.; Wang, J.; Yang, Y.; Zhang, C.; Sun, Y. Integrating UPLC-QE-Orbitrap-MS technology and network pharmacological method to reveal the mechanism of Bailemian capsule to relieve insomnia. Nat. Prod. Res. 2022, 36, 2554–2558. [Google Scholar] [CrossRef] [PubMed]
  15. Ma, K.; Tian, P.; Zhang, D.W.; Zhou, H.Y.; Sun, W.; Wang, Y.Y.; Han, D.E. Quantitative analysis of 16 components in Cyclocarya paliurus leaf by UPLC-QE-Orbitrap-MS. China J. Chin. Mater. Medica 2018, 43, 4077–4083. [Google Scholar]
  16. Zhou, Z.; Chen, B.; Chen, S.; Lin, M.; Chen, Y.; Jin, S.; Chen, W.; Zhang, Y. Applications of Network Pharmacology in Traditional Chinese Medicine Research. Evid. -Based Complement. Altern. Med. 2020, 2020, 1646905. [Google Scholar] [CrossRef] [PubMed]
  17. Jiao, X.; Jin, X.; Ma, Y.; Yang, Y.; Li, J.; Liang, L.; Liu, R.; Li, Z. A comprehensive application: Molecular docking and network pharmacology for the prediction of bioactive constituents and elucidation of mechanisms of action in component-based Chinese medicine. Comput. Biol. Chem. 2021, 90, 107402. [Google Scholar] [CrossRef] [PubMed]
  18. Fura, A. Role of pharmacologically active metabolites in drug discovery and development. Drug Discov. Today 2006, 11, 133–142. [Google Scholar] [CrossRef] [PubMed]
  19. Li, D.; Yuan, S.; Deng, Y.; Wang, X.; Wu, S.; Chen, X.; Li, Y.; Ouyang, J.; Lin, D.; Quan, H.; et al. The dysregulation of immune cells induced by uric acid: Mechanisms of inflammation associated with hyperuricemia and its complications. Front. Immunol. 2023, 14, 1282890. [Google Scholar] [CrossRef] [PubMed]
  20. Mehmood, A.; Ishaq, M.; Zhao, L.; Safdar, B.; Rehman, A.U.; Munir, M.; Raza, A.; Nadeem, M.; Iqbal, W.; Wang, C. Natural compounds with xanthine oxidase inhibitory activity: A review. Chem. Biol. Drug Des. 2019, 93, 387–418. [Google Scholar] [CrossRef]
  21. Ren, Q.; Tao, S.; Guo, F.; Wang, B.; Yang, L.; Ma, L.; Fu, P. Natural flavonol fisetin attenuated hyperuricemic nephropathy via inhibiting IL-6/JAK2/STAT3 and TGF-beta/SMAD3 signaling. Phytomedicine 2021, 87, 153552. [Google Scholar] [CrossRef] [PubMed]
  22. Song, D.; Zhao, X.; Wang, F.; Wang, G. A brief review of urate transporter 1 (URAT1) inhibitors for the treatment of hyperuricemia and gout: Current therapeutic options and potential applications. Eur. J. Pharmacol. 2021, 907, 174291. [Google Scholar] [CrossRef] [PubMed]
  23. Shin, H.J.; Takeda, M.; Enomoto, A.; Fujimura, M.; Miyazaki, H.; Anzai, N.; Endou, H. Interactions of urate transporter URAT1 in human kidney with uricosuric drugs. Nephrology 2011, 16, 156–162. [Google Scholar] [CrossRef] [PubMed]
  24. Novikov, A.; Fu, Y.; Huang, W.; Freeman, B.; Patel, R.; van Ginkel, C.; Koepsell, H.; Busslinger, M.; Onishi, A.; Nespoux, J.; et al. SGLT2 inhibition and renal urate excretion: Role of luminal glucose, GLUT9, and URAT1. Am. J. Physiol. Renal. Physiol. 2019, 316, F173–F185. [Google Scholar] [CrossRef] [PubMed]
  25. Pitere, R.R.; van Heerden, M.B.; Pepper, M.S.; Ambele, M.A. Slc7a8 Deletion Is Protective against Diet-Induced Obesity and Attenuates Lipid Accumulation in Multiple Organs. Biology 2022, 11, 311. [Google Scholar] [CrossRef]
  26. Zhang, J.; Song, Y.; Shi, Q.; Fu, L. Research progress on FASN and MGLL in the regulation of abnormal lipid metabolism and the relationship between tumor invasion and metastasis. Front. Med. 2021, 15, 649–656. [Google Scholar] [CrossRef] [PubMed]
  27. Shen, X.; Zhang, Y.; Zhang, X.; Yao, Y.; Zheng, Y.; Cui, X.; Liu, C.; Wang, Q.; Li, J.Z. Long non-coding RNA Bhmt-AS attenuates hepatic gluconeogenesis via modulation of Bhmt expression. Biochem. Biophys. Res. Commun. 2019, 516, 215–221. [Google Scholar] [CrossRef] [PubMed]
  28. Blom, H.J.; De Vriese, A.S. Why are homocysteine levels increased in kidney failure? A metabolic approach. J. Lab. Clin. Med. 2002, 139, 262–268. [Google Scholar] [CrossRef] [PubMed]
  29. Clar, J.; Gri, B.; Calderaro, J.; Birling, M.C.; Herault, Y.; Smit, G.P.; Mithieux, G.; Rajas, F. Targeted deletion of kidney glucose-6 phosphatase leads to nephropathy. Kidney Int. 2014, 86, 747–756. [Google Scholar] [CrossRef] [PubMed]
  30. Misawa, K.; Hasegawa, T.; Mishima, E.; Jutabha, P.; Ouchi, M.; Kojima, K.; Kawai, Y.; Matsuo, M.; Anzai, N.; Nagasaki, M. Contribution of Rare Variants of the SLC22A12 Gene to the Missing Heritability of Serum Urate Levels. Genetics 2020, 214, 1079–1090. [Google Scholar] [CrossRef] [PubMed]
  31. Lamichane, S.; Dahal Lamichane, B.; Kwon, S.M. Pivotal Roles of Peroxisome Proliferator-Activated Receptors (PPARs) and Their Signal Cascade for Cellular and Whole-Body Energy Homeostasis. Int. J. Mol. Sci. 2018, 19, 949. [Google Scholar] [CrossRef] [PubMed]
  32. Huang, C.G.; Shang, Y.J.; Zhang, J.; Zhang, J.R.; Li, W.J.; Jiao, B.H. Hypouricemic effects of phenylpropanoid glycosides acteoside of Scrophularia ningpoensis on serum uric acid levels in potassium oxonate-pretreated Mice. Am. J. Chin. Med. 2008, 36, 149–157. [Google Scholar] [CrossRef]
  33. Wan, Y.; Zou, B.; Zeng, H.; Zhang, L.; Chen, M.; Fu, G. Inhibitory effect of verbascoside on xanthine oxidase activity. Int. J. Biol. Macromol. 2016, 93, 609–614. [Google Scholar] [CrossRef] [PubMed]
  34. Zeng, J.X.; Wang, J.; Zhang, S.W.; Zhu, J.X.; Li, M.; Huang, W.H.; Wan, J.Y.; Yao, H.Q.; Wang, C.Z.; Yuan, C.S. Antigout Effects of: Xanthine Oxidase Inhibitory Activities Assessed by Electrochemical Biosensing Method. Evid.-Based Complement. Altern. Med. 2018, 2018, 1364617. [Google Scholar] [CrossRef] [PubMed]
  35. Zhu, J.X.; Yang, H.Y.; Hu, W.Q.; Cheng, J.; Liu, Y.; Yi, L.T.; Cheng, H.Y. Active components from Lagotis brachystachya maintain uric acid homeostasis by inhibiting renal TLR4-NLRP3 signaling in hyperuricemic mice. Inflammopharmacology 2021, 29, 1187–1200. [Google Scholar] [CrossRef] [PubMed]
  36. Kim, O.K.; Yun, J.M.; Lee, M.; Kim, D.; Lee, J. Hypouricemic Effects of Chrysanthemum indicum L. and Cornus officinalis on Hyperuricemia-Induced HepG2 Cells, Renal Cells, and Mice. Plants 2021, 10, 1668. [Google Scholar] [CrossRef] [PubMed]
  37. Li, Y.; Zhao, Z.; Luo, J.; Jiang, Y.; Li, L.; Chen, Y.; Zhang, L.; Huang, Q.; Cao, Y.; Zhou, P.; et al. Apigenin ameliorates hyperuricemic nephropathy by inhibiting URAT1 and GLUT9 and relieving renal fibrosis via the Wnt/beta-catenin pathway. Phytomedicine 2021, 87, 153585. [Google Scholar] [CrossRef] [PubMed]
  38. Liu, T.; Gao, H.; Zhang, Y.; Wang, S.; Lu, M.; Dai, X.; Liu, Y.; Shi, H.; Xu, T.; Yin, J.; et al. Apigenin Ameliorates Hyperuricemia and Renal Injury through Regulation of Uric Acid Metabolism and JAK2/STAT3 Signaling Pathway. Pharmaceuticals 2022, 15, 1442. [Google Scholar] [CrossRef] [PubMed]
  39. Toyoda, Y.; Takada, T.; Saito, H.; Hirata, H.; Ota-Kontani, A.; Tsuchiya, Y.; Suzuki, H. Identification of Inhibitory Activities of Dietary Flavonoids against URAT1, a Renal Urate Re-Absorber: In Vitro Screening and Fractional Approach Focused on Rooibos Leaves. Nutrients 2022, 14, 575. [Google Scholar] [CrossRef] [PubMed]
  40. Huang, H.; Gu, Q.; Nie, S.M.; Wang, J.D.; Zhao, H.; Zhai, B.W.; Zhang, M.Y.; Fu, Y.J. Untargeted metabolomics reveals the regulatory effect of geniposidic acid on lipid accumulation in HepG2 cells and Caenorhabditis elegans and validation in hyperlipidemic hamsters. Phytomedicine 2023, 125, 155295. [Google Scholar] [CrossRef] [PubMed]
  41. Shen, B.; Zhao, C.; Wang, Y.; Peng, Y.; Cheng, J.; Li, Z.; Wu, L.; Jin, M.; Feng, H. Aucubin inhibited lipid accumulation and oxidative stress via Nrf2/HO-1 and AMPK signalling pathways. J. Cell. Mol. Med. 2019, 23, 4063–4075. [Google Scholar] [CrossRef] [PubMed]
  42. Zhang, Y.; Wang, S.; Dai, X.; Liu, T.; Liu, Y.; Shi, H.; Yin, J.; Xu, T.; Zhang, Y.; Zhao, D.; et al. Simiao San alleviates hyperuricemia and kidney inflammation by inhibiting NLRP3 inflammasome and JAK2/STAT3 signaling in hyperuricemia mice. J. Ethnopharmacol. 2023, 312, 116530. [Google Scholar] [CrossRef] [PubMed]
  43. Zhang, X.Y.; Cheng, J.; Zhao, P.; Chen, K.L.; Li, J. Screening the Best Compatibility of Selaginella moellendorffii Prescription on Hyperuricemia and Gouty Arthritis and Its Mechanism. Evid.-Based Complement. Altern. Med. 2019, 2019, 7263034. [Google Scholar] [CrossRef] [PubMed]
  44. Ebrahimi, R.; Pasalar, P.; Shokri, H.; Shabani, M.; Emamgholipour, S. Evidence for the effect of soluble uric acid in augmenting endoplasmic reticulum stress markers in human peripheral blood mononuclear cells. J. Physiol. Biochem. 2022, 78, 343–353. [Google Scholar] [CrossRef] [PubMed]
  45. Al Shanableh, Y.; Hussein, Y.Y.; Saidwali, A.H.; Al-Mohannadi, M.; Aljalham, B.; Nurulhoque, H.; Robelah, F.; Al-Mansoori, A.; Zughaier, S.M. Prevalence of asymptomatic hyperuricemia and its association with prediabetes, dyslipidemia and subclinical inflammation markers among young healthy adults in Qatar. BMC Endocr. Disord. 2022, 22, 21. [Google Scholar] [CrossRef] [PubMed]
  46. Tan, J.; Wan, L.; Chen, X.; Li, X.; Hao, X.; Li, X.; Li, J.; Ding, H. Conjugated Linoleic Acid Ameliorates High Fructose-Induced Hyperuricemia and Renal Inflammation in Rats via NLRP3 Inflammasome and TLR4 Signaling Pathway. Mol. Nutr. Food Res. 2019, 63, e1801402. [Google Scholar] [CrossRef] [PubMed]
  47. Wang, Z.; Cui, T.; Ci, X.; Zhao, F.; Sun, Y.; Li, Y.; Liu, R.; Wu, W.; Yi, X.; Liu, C. The effect of polymorphism of uric acid transporters on uric acid transport. J. Nephrol. 2019, 32, 177–187. [Google Scholar] [CrossRef] [PubMed]
  48. Lutkewitte, A.J.; Finck, B.N. Regulation of Signaling and Metabolism by Lipin-mediated Phosphatidic Acid Phosphohydrolase Activity. Biomolecules 2020, 10, 1386. [Google Scholar] [CrossRef] [PubMed]
  49. Shen, Z.; Cui, T.; Liu, Y.; Wu, S.; Han, C.; Li, J. Astragalus membranaceus and Salvia miltiorrhiza ameliorate diabetic kidney disease via the ”gut-kidney axis”. Phytomedicine 2023, 121, 155129. [Google Scholar] [CrossRef]
  50. Chen, M.; Dong, J.; Zhao, X.; Yin, X.; Wu, K.; Wang, Q.; Liu, X.; Wu, Y.; Gong, Z. Cadmium influence on lipid metabolism in Sprague-Dawley rats through linoleic acid and glycerophospholipid metabolism pathways. J. Biochem. Mol. Toxicol. 2023, 37, e23412. [Google Scholar] [CrossRef] [PubMed]
  51. Lee, J.; Ridgway, N.D. Substrate channeling in the glycerol-3-phosphate pathway regulates the synthesis, storage and secretion of glycerolipids. Biochim. Biophys. Acta Mol. Cell Biol. Lipids 2020, 1865, 158438. [Google Scholar] [CrossRef] [PubMed]
  52. Gonzalez-Baro, M.R.; Coleman, R.A. Mitochondrial acyltransferases and glycerophospholipid metabolism. Biochim. Biophys. Acta Mol. Cell Biol. Lipids 2017, 1862, 49–55. [Google Scholar] [CrossRef] [PubMed]
  53. Poulsen, L.; Siersbaek, M.; Mandrup, S. PPARs: Fatty acid sensors controlling metabolism. Semin. Cell Dev. Biol. 2012, 23, 631–639. [Google Scholar] [CrossRef] [PubMed]
  54. Yang, H.; Su, M.; Liu, M.; Sheng, Y.; Zhu, L.; Yang, L.; Mu, R.; Zou, J.; Liu, X.; Liu, L. Hepatic retinaldehyde deficiency is involved in diabetes deterioration by enhancing PCK1- and G6PC-mediated gluconeogenesis. Acta Pharm. Sin. B 2023, 13, 3728–3743. [Google Scholar] [CrossRef] [PubMed]
  55. Bougarne, N.; Weyers, B.; Desmet, S.J.; Deckers, J.; Ray, D.W.; Staels, B.; De Bosscher, K. Molecular Actions of PPARalpha in Lipid Metabolism and Inflammation. Endocr. Rev. 2018, 39, 760–802. [Google Scholar] [CrossRef] [PubMed]
  56. Kim, N.Y.; Lim, C.M.; Park, H.M.; Kim, J.; Pham, T.H.; Yang, Y.; Lee, H.P.; Hong, J.T.; Yoon, D.Y. MMPP promotes adipogenesis and glucose uptake via binding to the PPARgamma ligand binding domain in 3T3-L1 MBX cells. Front. Pharmacol. 2022, 13, 994584. [Google Scholar] [CrossRef] [PubMed]
  57. Wu, S.A.; Shen, C.; Wei, X.; Zhang, X.; Wang, S.; Chen, X.; Torres, M.; Lu, Y.; Lin, L.L.; Wang, H.H.; et al. The mechanisms to dispose of misfolded proteins in the endoplasmic reticulum of adipocytes. Nat. Commun. 2023, 14, 3132. [Google Scholar] [CrossRef] [PubMed]
  58. Krizanac, M.; Mass Sanchez, P.B.; Schroder, S.K.; Weiskirchen, R.; Asimakopoulos, A. Lipid-Independent Regulation of PLIN5 via IL-6 through the JAK/STAT3 Axis in Hep3B Cells. Int. J. Mol. Sci. 2023, 24, 7219. [Google Scholar] [CrossRef] [PubMed]
  59. Klyuyeva, A.V.; Belyaeva, O.V.; Goggans, K.R.; Krezel, W.; Popov, K.M.; Kedishvili, N.Y. Changes in retinoid metabolism and signaling associated with metabolic remodeling during fasting and in type I diabetes. J. Biol. Chem. 2021, 296, 100323. [Google Scholar] [CrossRef] [PubMed]
  60. Zhang, S.; Zhang, Y.; Lin, S.; Zhang, S.; Qiu, M. Hyperuricemia as a possible risk factor for abnormal lipid metabolism in the Chinese population: A cross-sectional study. Ann. Palliat. Med. 2021, 10, 11454–11463. [Google Scholar] [CrossRef] [PubMed]
  61. Trommelen, J.; Tomé, D.; van Loon, L.J.C. Gut amino acid absorption in humans: Concepts and relevance for postprandial metabolism. Clin. Nutr. Open Sci. 2021, 36, 43–55. [Google Scholar] [CrossRef]
  62. Locasale, J.W. Serine, glycine and one-carbon units: Cancer metabolism in full circle. Nat. Rev. Cancer 2013, 13, 572–583. [Google Scholar] [CrossRef] [PubMed]
  63. El Ridi, R.; Tallima, H. Physiological functions and pathogenic potential of uric acid: A review. J. Adv. Res. 2017, 8, 487–493. [Google Scholar] [CrossRef] [PubMed]
  64. Knopfel, E.B.; Vilches, C.; Camargo, S.M.R.; Errasti-Murugarren, E.; Staubli, A.; Mayayo, C.; Munier, F.L.; Miroshnikova, N.; Poncet, N.; Junza, A.; et al. Dysfunctional LAT2 Amino Acid Transporter Is Associated with Cataract in Mouse and Humans. Front. Physiol. 2019, 10, 688. [Google Scholar] [CrossRef] [PubMed]
  65. Morio, H.; Reien, Y.; Hirayama, Y.; Hashimoto, H.; Anzai, N. Protein kinase C activation upregulates human L-type amino acid transporter 2 function. J. Physiol. Sci. 2021, 71, 11. [Google Scholar] [CrossRef] [PubMed]
  66. Beale, E.G.; Harvey, B.J.; Forest, C. PCK1 and PCK2 as candidate diabetes and obesity genes. Cell Biochem. Biophys. 2007, 48, 89–95. [Google Scholar] [CrossRef] [PubMed]
  67. Lee, Y.H.; Seo, J.W.; Kim, M.; Tae, D.; Seok, J.; Kim, Y.G.; Lee, S.H.; Kim, J.S.; Hwang, H.S.; Jeong, K.H.; et al. Urinary mRNA Signatures as Predictors of Renal Function Decline in Patients with Biopsy-Proven Diabetic Kidney Disease. Front. Endocrinol. 2021, 12, 774436. [Google Scholar] [CrossRef] [PubMed]
  68. Glorieux, G.; Mullen, W.; Duranton, F.; Filip, S.; Gayrard, N.; Husi, H.; Schepers, E.; Neirynck, N.; Schanstra, J.P.; Jankowski, J.; et al. New insights in molecular mechanisms involved in chronic kidney disease using high-resolution plasma proteome analysis. Nephrol. Dial. Transpl. 2015, 30, 1842–1852. [Google Scholar] [CrossRef] [PubMed]
  69. Mao, Z.; Feng, M.; Li, Z.; Zhou, M.; Xu, L.; Pan, K.; Wang, S.; Su, W.; Zhang, W. ETV5 Regulates Hepatic Fatty Acid Metabolism Through PPAR Signaling Pathway. Diabetes 2021, 70, 214–226. [Google Scholar] [CrossRef] [PubMed]
  70. Ma, L.; Wang, J.; Ma, L.; Ge, Y.; Wang, X.M. The effect of lipid metabolism disorder on patients with hyperuricemia using Multi-Omics analysis. Sci. Rep. 2023, 13, 18211. [Google Scholar] [CrossRef]
  71. Pang, S.; Jiang, Q.; Sun, P.; Li, Y.; Zhu, Y.; Liu, J.; Ye, X.; Chen, T.; Zhao, F.; Yang, W. Hyperuricemia prevalence and its association with metabolic disorders: A multicenter retrospective real-world study in China. Ann. Transl. Med. 2021, 9, 1550. [Google Scholar] [CrossRef] [PubMed]
  72. Fang, C.H.; Tsai, C.C.; Shyong, Y.J.; Yang, C.T.; Li, K.Y.; Lin, Y.W.; Chang, K.C.; Wang, M.H.; Wu, T.M.; Lin, F.H. Effects of Highly Oxygenated Water in a Hyperuricemia Rat Model. J. Healthc. Eng. 2020, 2020, 1323270. [Google Scholar] [CrossRef] [PubMed]
  73. Li, H.L.; Liu, X.J.; Lee, M.H.; Li, H.T. Vitamin C alleviates hyperuricemia nephropathy by reducing inflammation and fibrosis. J. Food Sci. 2021, 86, 3265–3276. [Google Scholar] [CrossRef] [PubMed]
  74. Wang, X.Y.; Liu, B.Y.; Wang, S.; Sui, M.H. Effects of acupuncture at Shu, Yuan, and Mu acupoints on blood serum uric acid and xanthine oxidase levels in a rat model of gout and hyperuricemia. J. Tradit. Chin. Med. 2017, 37, 841–845. [Google Scholar] [PubMed]
  75. Qian, X.W.; Jiang, Y.; Luo, Y.Y.; Jiang, Y.C. The Anti-hyperuricemia and Anti-inflammatory Effects of Atractylodes Macrocephala in Hyperuricemia and Gouty Arthritis Rat Models. Comb. Chem. High T. Scr. 2023, 26, 950–964. [Google Scholar]
  76. Li, R.; Tan, Y.; Li, Y.; Zhu, X.; Tang, X.; Zhang, L.; Chen, J. Effects of Tart Cherry Powder on Serum Uric Acid in Hyperuricemia Rat Model. Evid.-Based Complement. Altern. Med. 2020, 2020, 1454305. [Google Scholar] [CrossRef] [PubMed]
  77. Xie, C.; Mao, X.; Huang, J.; Ding, Y.; Wu, J.; Dong, S.; Kong, L.; Gao, G.; Li, C.Y.; Wei, L. KOBAS 2.0: A web server for annotation and identification of enriched pathways and diseases. Nucleic Acids Res. 2011, 39, W316–W322. [Google Scholar] [CrossRef] [PubMed]
  78. Love, M.I.; Huber, W.; Anders, S. Moderated estimation of fold change and dispersion for RNA-seq data with DESeq2. Genome Biol. 2014, 15, 550. [Google Scholar] [CrossRef] [PubMed]
  79. Schwarz, A.P.; Nikitina, V.A.; Krytskaya, D.U.; Shcherbakova, K.P.; Trofimov, A.N. Reference gene expression stability within the rat brain under mild intermittent ketosis induced by supplementation with medium-chain triglycerides. PLoS ONE 2023, 18, e0273224. [Google Scholar] [CrossRef] [PubMed]
  80. Ravingerova, T.; Carnicka, S.; Nemcekova, M.; Ledvenyiova, V.; Adameova, A.; Kelly, T.; Barlaka, E.; Galatou, E.; Khandelwal, V.K.; Lazou, A. PPAR-alpha activation as a preconditioning-like intervention in rats in vivo confers myocardial protection against acute ischaemia-reperfusion injury: Involvement of PI3K-Akt. Can. J. Physiol. Pharmacol. 2012, 90, 1135–1144. [Google Scholar] [CrossRef] [PubMed]
  81. Hoekstra, M.; Kruijt, J.K.; Van Eck, M.; Van Berkel, T.J. Specific gene expression of ATP-binding cassette transporters and nuclear hormone receptors in rat liver parenchymal, endothelial, and Kupffer cells. J. Biol. Chem. 2003, 278, 25448–25453. [Google Scholar] [CrossRef] [PubMed]
  82. Liu, M.F.; Du, C.K.; Su, X.Y. Forskolin induced remodeling of lipid droplets in rat adipocytes. Sheng Li Xue Bao Acta Physiol. Sin. 2019, 71, 379–387. [Google Scholar]
  83. Ma, D.; Wu, T.; Qu, Y.; Yang, J.; Cai, L.; Li, X.; Wang, Y. Astragalus polysaccharide prevents heart failure-induced cachexia by alleviating excessive adipose expenditure in white and brown adipose tissue. Lipids Health Dis. 2023, 22, 9. [Google Scholar] [CrossRef] [PubMed]
  84. Wojcik, B.; Miklosz, A.; Zabielski, P.; Chabowski, A.; Gorski, J. Effect of tachycardia on mRNA and protein expression of the principal components of the lipolytic system in the rat’s heart ventricles. J. Physiol. Pharmacol. 2017, 68, 731–736. [Google Scholar] [PubMed]
  85. Slow, S.; Garrow, T.A. Liver choline dehydrogenase and kidney betaine-homocysteine methyltransferase expression are not affected by methionine or choline intake in growing rats. J. Nutr. 2006, 136, 2279–2283. [Google Scholar] [CrossRef] [PubMed]
  86. Caton, P.W.; Nayuni, N.K.; Murch, O.; Corder, R. Endotoxin induced hyperlactatemia and hypoglycemia is linked to decreased mitochondrial phosphoenolpyruvate carboxykinase. Life Sci. 2009, 84, 738–744. [Google Scholar] [CrossRef] [PubMed]
  87. Kirchhoff, P.; Dave, M.H.; Remy, C.; Kosiek, O.; Busque, S.M.; Dufner, M.; Geibel, J.P.; Verrey, F.; Wagner, C.A. An amino acid transporter involved in gastric acid secretion. Pflüg. Arch. 2006, 451, 738–748. [Google Scholar] [CrossRef] [PubMed]
  88. Tyler, R.E.; Weinberg, B.Z.S.; Lovelock, D.F.; Ornelas, L.C.; Besheer, J. Exposure to the predator odor TMT induces early and late differential gene expression related to stress and excitatory synaptic function throughout the brain in male rats. Genes Brain Behav. 2020, 19, e12684. [Google Scholar] [CrossRef]
  89. Yamakawa, J.; Ishigaki, Y.; Takano, F.; Takahashi, T.; Yoshida, J.; Moriya, J.; Takata, T.; Tatsuno, T.; Sasaki, K.; Ohta, T.; et al. The Kampo medicines Orengedokuto, Bofutsushosan and Boiogito have different activities to regulate gene expressions in differentiated rat white adipocytes: Comprehensive analysis of genetic profiles. Biol. Pharm. Bull. 2008, 31, 2083–2089. [Google Scholar] [CrossRef] [PubMed]
  90. Fang, C.; Chen, L.; He, M.; Luo, Y.; Zhou, M.; Zhang, N.; Yuan, J.; Wang, H.; Xie, Y. Molecular mechanistic insight into the anti-hyperuricemic effect of Eucommia ulmoides in mice and rats. Pharm. Biol. 2019, 57, 112–119. [Google Scholar] [CrossRef] [PubMed]
  91. Qin, Y.; Zhang, X.; Tao, H.; Wu, Y.; Yan, J.; Liao, L.; Meng, J.; Lin, F. Ameliorative effect and mechanism of Yi-Suan-Cha against hyperuricemia in rats. J. Clin. Lab. Anal. 2021, 35, e23859. [Google Scholar] [CrossRef]
Figure 1. Qualitative analysis of PS extract by UPLC-QE-Orbitrap-MS. (A) Photograph of PS (by Tian Liu). (B) Base peak ion current of PS extract analyzed in negative-ion mode. (C) Base peak ion current of PS extract analyzed in positive-ion mode. (The numbers on the peaks represent the corresponding components in Table 1). The PS extract was filtered with 0.22 μm and then subjected to UPLC-QE-Orbitrap-MS analysis.
Ijms 25 08548 g001
Figure 2. Mass spectrometry fragmentation information and speculated cleavage pathways. (A) Identification of flavonoids: I. plantagoside; II. taxifolin; III. cynaroside. (B) Identification of phenyl ethanol glycosides: I. acteoside; II. plantainoside D. (C) Identification of iridoids: I. geniposidic acid; II. gardoside. (D) Identification of organic acids: caffeic acid.
Ijms 25 08548 g002
Figure 3. PS significantly reversed histopathologic status, blood biochemical indexes, and mRNA expression of uric acid transporter of HUA rats. (A) Representative H&E staining histopathological images of potassium oxonate-induced rat kidney tissue injury treated with or without PS; the blue arrow indicates urate crystals, the yellow arrow indicates inflammatory infiltration, the red arrow indicates lobulated glomeruli, the green arrow indicates renal tubules changed into protein tubular type, and the black arrow indicates renal tubule atrophy. I. Control group. II. Model group. III. BBR group. Ⅳ. PS group. Scale bars for original images: 2000 μm, scale bars for enlarged images: 100 μm. (B) mRNA expression levels of Urat1 and (C) mRNA expression levels of Glut9. (D) UA level, (E) XOD activity, (F) TNF-α level, and (G) IL-6 level. Values represented mean ± SD; one-way ANOVA was used for statistical analysis (** p < 0.01 and *** p < 0.001). ns: not significant.
Ijms 25 08548 g003
Figure 4. Gene expression profile in PS-treated potassium oxonate-induced HUA rats. (A) Venn mapping of altered genes in control, model, BBR, and PS groups in rat kidney tissues. (B) Volcano plots of upregulated and downregulated DEGs between PS and model groups. (C) Volcano plots of upregulated and downregulated DEGs between model and control groups. (D) Heatmap for hierarchical cluster analysis of DEGs between the samples. (E) GO and (F) KEGG analysis of DEGs in the PS vs. model groups. (G) Protein–protein interaction (PPI) networks diagram of DEGs in the PS vs. model groups.
Ijms 25 08548 g004
Figure 5. Effects of PS on mRNA expression. (A) mRNA expression levels of Slc7a8. (B) mRNA expression levels of Pck1. (C) mRNA expression levels of Mgll. (D) mRNA expression levels of Bhmt. (E) mRNA expression levels of Fkbp5. Error bars indicate SD. One-way ANOVA was used for comparing statistical significance between different groups (* p < 0.05, ** p < 0.01 and *** p < 0.001). ns: not significant.
Ijms 25 08548 g005
Figure 6. Effects of PS on rat renal tissue mRNA expression associated with PPAR signaling pathway. (A) mRNA expression levels of Pparα. (B) mRNA expression levels of Pparγ. (C) mRNA expression levels of Lpl. (D) mRNA expression levels of Plin5. (E) mRNA expression levels of Atgl. (F) mRNA expression levels of Hsl. Error bars indicate SD. One-way ANOVA was used for comparing statistical significance between different groups (* p < 0.05, ** p < 0.01 and *** p < 0.001). ns: not significant.
Ijms 25 08548 g006
Figure 7. Illustration of the most significant regulated target genes related to PPAR signaling pathway. The vertical red arrows indicate the upregulated trend by PS.
Ijms 25 08548 g007
Figure 8. Effects of PS on URAT1 and PPARα proteins expression. (A) Representative immunoblots of URAT1 and URAT1 protein levels analysis. (B) Representative immunoblots of PPARα and PPARα protein levels analysis. n = 3. Error bars indicate SD. One-way ANOVA was used for comparing statistical significance between different groups (* p < 0.05, ** p < 0.01 and *** p < 0.001). ns: not significant.
Ijms 25 08548 g008
Table 1. Constituents analysis in Plantaginis semen using UPLC-QE-Orbitrap-MS.
NO.tR/minFormulaAdductsTheoretical ValueMeasured
Value
Mass Error
(ppm)
MS/MSIdentificationLabel
11.02 C6H14O6+H183.0863183.0864 0.55 147.1855, 98.9845Sorbitolh
22.81C6H8O7-H191.0186191.02017.85191.0199, 173.0089, 111.0089, 87.0088Citric acidf
3 *4.74C15H22O9-H345.1180345.11954.35299.8194, 139.0407, 89.3671Aucubinc
45.60 C16H22O10+H375.1286375.1279 −1.87 287.0074, 195.0659, 177.0552, 167.0707,
149.0602, 121.0652
Gardosidec
55.60 C16H20O9+H357.1180357.1175 −1.40 195.0659, 177.0553, 149.0603, 121.0652Feruloylsucrosei
6 *5.61C16H22O10-H373.1129373.11351.61300.3118, 211.0611, 193.0512, 167.0711,
149.0609, 123.0453, 121.0660
Geniposidic acidc
75.81C20H30O12-H461.1654461.16723.90461.1658, 315.1101, 161.0455, 135.0452Verbasosideb
86.30 C9H12O4+H185.0808185.0809 0.54 185.1539, 139.0766, 129.9802, 111.0751Pedicularis-lactonec
97.46C10H10O4-H193.0495193.05002.59193.0509, 116.9284, 96.9601Ferulic acidf
109.50C29H36O16-H639.1920639.19565.63141.5413Plantagoamidinic acide
1111.15C11H19N3O2-H224.1394224.14054.91224.1392, 141.0924Plantagoamidinic acid Ae
1211.72C21H22O12-H465.1028465.10423.01465.1032, 303.0506, 151.0393Plantagosidea
1314.23C29H36O16-H639.1920639.19545.32477.1617, 179.0362, 161.0246, 135.0457Plantamajosideb
1415.12C15H12O7-H303.0499303.05144.95303.0510, 151.0402, 107.0139Taxifolina
15*15.41C29H36O15-H623.1970623.20004.81623.1987, 461.1670, 315.1082, 179.0352,
161.0246, 153.0559, 135.0453
Acteosideb
1615.41C29H34O15-H621.1814621.18282.25179.0350, 161.0246, 135.0453Orobanchosideb
1715.94C23H26O11-H477.1391477.14103.98477.1409, 315.1057, 161.0234, 135.0448Calceolarioside Bb
1816.34C21H20O11-H447.0922447.09414.25447.0935, 285.0405, 284.0324, 256.0373,
199.0396, 151.0041
Cynarosidea
1916.45C29H36O16-H639.1920639.19545.32639.1927, 477.1605, 315.1107, 179.0350,
161.0246, 153.0549, 135.0454, 84.7942
Plantainoside Db
2017.10C27H30O15-H593.1501593.15223.54285.0384, 284.0322Kaempferol-3-rutinosidea
21 *17.15C29H36O15-H623.1970623.20004.81623.1990, 461.1681, 179.0350, 161.0245,
135.0453
Isoacteosideb
2217.58C27H32O14-H579.1708579.17252.94271.0618, 151.0029Naringina
23 *17.62 C15H12O6+H289.0707 289.0704 −1.04 271.0609, 179.0344, 163.0395, 153.0188Eriodictyola
2417.87 C21H20O12+H465.1028 465.1031 0.65 302.0745, 300.3060Hyperosidea
2517.96C21H20O10-H431.0973431.09944.87431.0989, 269.0454, 268.0375, 151.0038Apigenin 7-glucosidea
2618.11C27H30O14-H577.1552577.15753.99413.0989, 269.0454, 268.0375, 183.0457Rhoifolina
2718.26C31H38O16-H665.2076665.21125.41503.1779, 181.5070, 161.02462-Acetylacteosideb
2818.80 C21H20O11+H449.1078449.1080 0.45 449.0978, 287.0555Plantagininb
29 *18.91C15H10O7-H301.0343301.03584.98301.0358, 254.8575, 121.6543Quercetina
3019.27C22H22O11-H461.1078461.10943.47461.1952, 181.7875Homoplantaginina
31 *19.90C15H10O6-H285.0394285.04084.91285.0408, 199.0405, 175.0404, 151.0036,
133.0297, 107.0138, 83.0142
Luteolina
32 *21.05 C15H10O5-H269.0444269.04564.46269.0456, 200.9979, 117.0348, 65.0031Apigenina
3324.74 C15H10O5-H269.0444269.04564.46269.0456, 241.0506, 225.0557, 197.0611Baicaleina
3429.15 C9H8O4+H181.0495181.0493−1.10181.0718, 163.0395, 135.0446, 116.9860, 79.0545, 65.0390Caffeic acidf
3529.77 C30H48O4-H471.3469471.34843.18471.3484, 453.3378, 427.3596, 407.3329Maslinic acidd
3631.03 C18H32O2+H181.0495181.0493−1.10181.0718, 163.0395, 135.0446, 116.9860,
79.0545, 65.0390
Caffeic acidf
3731.39 C30H48O3-H455.3520455.35353.29456.3588, 455.3534, 408.2341Oleanic acidd
3831.58 C18H30O2-H277.2162277.21733.97277.2173, 259.2071, 233.1541, 121.0296,
81.9533, 59.0138
α-Linolenic acidg
39 *31.95 C30H48O3-H455.3520455.35332.85455.3536, 300.0453, 181.7717, 147.1723,
115.9207, 99.9257
Ursolic acidd
Note: The * in the NO. column indicates compounds that have been compared with standards; a denotes flavonoids, b denotes phenyl ethanol glycosides, c denotes iridoids, d denotes triterpenoids, e denotes alkaloids, f denotes organic acids, g denotes fatty acids, h denotes glycitols, and i denotes phenylpropanoid.
Table 2. Analysis of blood-migrating components of Plantaginis semen using UPLC-QE-Orbitrap-MS.
NO.tR/minFormulaAdductsTheoretical ValueMeasured
Value
Mass Error
(ppm)
MS/MSIdentification
12.53C6H8O7-H191.0186191.01996.81191.0200, 173.0090, 111.0088, 87.0088Citric acid a
23.51C9H13NO9S-H310.0227310.02476.45310.0974, 230.0188, 87.1158Citric acid j
34.72C15H22O9-H345.1180345.11933.77299.9364, 139.0401, 89.3645Aucubin a
44.79C22H30O16-H549.1450549.14601.82211.0613, 167.0714, 149.0607, 123.0452,
121.0660
Geniposidic acid i
54.96C16H22O13S-H453.0697453.07133.53453.0710, 300.4093, 193.0514, 149.0610,
123.0451, 121.4576
Geniposidic acid h
65.60C16H22O10-H373.1129373.11351.61211.0614, 193.0512, 167.0714, 149.0609,
123.0452, 121.0660
Geniposidic acid a
76.09C15H20O9-H343.1024343.10373.79343.1034, 181.6917, 162.8395, 160.8422, 159.8602, 139.0766, 101.0247, 99.0089, 89.0247Aucubin d
86.42C15H20O8-H327.1074327.10894.59165.0558, 119.1114, 99.0086, 89.0245Aucubin b
96.92C16H20O9-H355.1024355.10383.94300.2832, 121.0297Geniposidic acid b
107.11C10H10O4-H193.0495193.05076.22193.8154, 149.0606, 133.0296Ferulic acid a
1111.59C11H19N3O2-H224.1394224.14065.35224.1406, 141.0923Plantagoamidinic acid A a
1212.33C21H20O12-H463.0871463.08904.10151.0039, 107.0139Plantagoside d
1315.33C29H36O15-H623.1970623.20065.78623.2032, 461.1672, 179.0350, 161.0245, 135.0452Acteoside a
1415.77C21H20O11-H447.0922447.09393.80447.1942, 151.0037, 107.0140Plantagoside b
1515.77C21H20O11-H447.0922447.09393.80447.1942, 151.0037Cynaroside a
1617.04C29H36O15-H623.1970623.20055.62623.2021, 461.1671, 161.0244, 135.0457Isoacteoside a
1717.90C21H18O11-H445.0765445.07834.04445.1906, 269.0458Cynaroside d
1817.90C21H18O11-H445.0765445.07834.04445.1906, 269.0458, 117.0347, 65.3859Apigenin i
1917.94C21H22O11-H449.1078449.10943.56258.0529, 273.0766, 151.0039Cynaroside e
2018.76C24H40O8+H457.2796457.2792−0.87457.2742, 281.0787, 133.0863Linoleic acid i
2118.83C21H18O12-H461.0715461.07323.69461.1859, 285.0403, 199.0399, 175.0396, 151.0038, 133.0296, 107.0138Luteolin i
2219.13C15H10O9S-H364.9962364.99784.38365.1043, 213.0549, 175.0405, 151.0033Luteolin h
2319.27C22H22O11-H461.1078461.10943.47461.1850, 285.0768, 165.1093, 151.0033Cynaroside g
2419.27C22H22O11-H461.1078461.10943.47461.1850, 181.7875Homoplantaginin a
2519.31C15H12O5-H271.0601271.06134.43271.1891, 227.1645, 151.0042, 119.0504, 116.9956, 65.6944Apigenin e
2619.77C15H10O6-H285.0394285.04064.21285.0402, 194.9880, 166.9930, 133.0293, 116.9960Apigenin f
2720.89C15H10O5-H269.0444269.04522.97269.1378, 225.1501, 200.9967, 182.9875, 116.9956Apigenin a
2823.19C20H34O3+H323.2581323.2575−1.86323.2375, 149.1331, 133.1017, 107.0858, 97.0651,
69.0703, 55.0547
Linoleic acid k
2929.09C9H8O4+H181.0495181.0494−0.55181.1596, 163.0395, 135.0445, 116.9861, 79.0545,
65.0390
Caffeic acid a
3029.91C18H30O3-H293.2111293.21223.75293.2117, 275.2018, 249.2219, 121.1017, 59.0137α-Linolenic acid f
3129.95C18H32O3-H295.2268295.22783.39295.2278, 277.2172, 121.5115, 59.0137α-Linolenic acid c
3229.96C18H30O2+H279.2319279.2313−2.15279.2327, 261.2224, 173.1333, 165.1279, 163.1124, 133.1024, 131.0859, 107.0857, 105.0704, 67.0546, 65.0388, 55.0548, 53.0390Linoleic acid d
3330.27C18H32O3+H297.2424297.2420−1.35279.2326, 191.1441, 181.1586, 165.1280, 149.1332, 133.1015, 123.1173, 107.0859, 69.0702, 55.0548Linoleic acid f
3430.42C18H30O+H263.2369263.2365−1.52263.2372, 245.2271, 175.1492, 165.1640, 133.1016, 107.0859, 69.0702, 55.0548Linoleic acid b
3530.45C36H56O9-H631.3841631.38653.80456.3566, 455.3532, 408.2441Oleanolic acid i
3631.07C18H28O2-H275.2006275.20153.27275.2012, 231.2118, 121.7366, 79.9572, 59.0139α-Linolenic acid d
3731.52C18H30O2-H277.2162277.21713.25277.2171, 259.2079, 233.0141, 59.0137α-Linolenic acid a
3831.95C30H48O3-H455.3520455.35373.73455.3168, 300.1568, 181.5451, 115.9202, 99.9258Ursolic acid a
3932.01C18H32O2-H279.2319279.23283.22279.2328, 261.2221, 121.6766, 59.0138α-Linolenic acid e
4032.50C18H34O2+H283.2632283.2625−2.47177.1648, 135.1137, 109.1016, 107.0860, 71.0859,
69.0702, 57.0704, 55.0548
Linoleic acid e
a: prototype; b: dehydration; c: hydrolysis; d: dehydrogenation; e: hydroreduction; f: hydroxylation; g: methylation; h: sulfation; i: conjugated glucuronic acid; j: conjugated cysteine; k: acetylation.
Table 3. Nucleotide sequences of RT-qPCR primers.
GenesForward Primer (5′ to 3′)Reverse Primer (5′ to 3′)
Urat1CTCTGCCTTTCTCCTGTTGACCCCTTGATGATGACCTTG
Glut9TTCGGGTCCTCCTTCCTCTAGGACACAGTCACAGACCAGA
Slc7a8TCCACATTTGGTGGAGTCAATGGATCATGGCTAACACGCT
BhmtCGGGCAGACCGTACAATCCCTTTCGTCACTCCCCAAGCA
Fkbp5GAACCCAATGCTGAGCTTATGATGTACTTGCCTCCCTTGAAG
MgllGCGGTGCCATCTCCATCCGCTCCTGCCACTGCTATCC
PparαTCACACAATGCAATCCGTTTGGCCTTGACCTTGTTCATGT
PparγCATGCTTGTGAAGGATGCAAGTTCTGAAACCGACAGTACTGACAT
LplAGACTCGCTCTCAGATGCCCTACTCACTTTCAGCCACTGTGCCATAC
Plin5AAATCAGAGGAGCTGGTGGAACGCACAAAGTAGCCCTGTT
AtglCCCTGACTCGAGTTTCGGATCACATAGCGCACCCCTTGAA
HslGCCAGCCACAACCTAGCAGAACCATCGCCCTCAAAGAAGAGCACTC
GapdhTCTCTGCTCCTCCCTGTTCACACCGACCTTCACCATCT
Disclaimer/Publisher’s Note: The statements, opinions and data contained in all publications are solely those of the individual author(s) and contributor(s) and not of MDPI and/or the editor(s). MDPI and/or the editor(s) disclaim responsibility for any injury to people or property resulting from any ideas, methods, instructions or products referred to in the content.

