Abstract
Exogenous and endogenous advanced glycation end products (AGEs) contribute to the pathogenesis and progression of renal disease. This is a one-month controlled dietary counseling trial that restricts nutritional AGEs in patients with end-stage renal disease (ESRD) undergoing haemodialysis (n = 22 participants in the intervention and n = 20 participants in the control group). Haematological, biochemical markers, the soluble form of the receptor for AGEs (sRAGE), and carboxymethyl lysine (CML) were measured at baseline and at follow-up. Mononuclear cells were isolated and the protein expression of RAGE and the inflammatory marker COX-2 was measured using Western immunoblotting. The intervention group presented a lower increase in CML compared to the control group (12.39% median change in the intervention vs. 69.34% in the control group, p = 0.013), while RAGE (% mean change −56.54 in the intervention vs. 46.51 in the control group, p < 0.001) and COX-2 (% mean change −37.76 in the intervention vs. 0.27 in the control group, p < 0.001) were reduced compared to the control group. sRAGE was reduced in both groups. In addition, HbA1c (at two months), total cholesterol, and triglycerides were reduced in the intervention versus the control group. The adoption of healthy cooking methods deserves further research as a possible way of modulating inflammatory markers in patients with CKD.
1. Introduction
Advanced glycation end products (AGEs) are formed in the presence of hyperglycaemia and diseases associated with high levels of oxidative stress, such as chronic kidney disease (CKD). In CKD, the higher levels of AGEs result from both increased formation and decreased renal clearance and may be related to survival [1]. AGEs contribute to the development and progression of CKD, and, conversely, the disease further promotes AGEs formation by inducing oxidative stress [2].
More specifically, AGEs play a key role in endothelial dysfunction, glomerulosclerosis, and renal function impairment, partly through interaction with their receptor (RAGE) [3,4]. On endothelial cells, RAGE inhibits the endothelial nitric oxide synthase and promotes endothelial dysfunction [5]. The AGE–RAGE interaction activates several signaling pathways [3]. Moreover, AGEs contribute to the activation of tumor necrosis factor-α (TNF-α), interleukin-1 (IL-1), insulin-like growth factor-1 (IGF-1), and platelet-derived growth factor (PDGF), which further promote collagen IV synthesis. They are also involved in the inflammatory response by increasing cyclooxygenase-2 (COX-2) levels, a key component of prostaglandin synthesis. COX-2 is expressed at low levels when renal function is normal and increases significantly as a response to inflammation and renal function impairment [6].
It is noteworthy that patients undergoing haemodialysis have significantly higher serum AGEs along with higher circulating soluble RAGE (sRAGE) levels [7]. Although the contribution of dietary glycotoxins to overall AGEs accumulation is well established, their role in CKD pathogenesis and progression has not been fully elucidated. The need for interventions, including improvement of cooking skills, is stated in the clinical practice dietary guidelines for nutrition in patients with CKD, but no recommendation is currently made on dietary AGEs intake [8]. The absence of such a recommendation may be due to the absence of high-quality evidence, particularly from intervention studies.
In this context, the clarification of the underlying mechanisms linking dietary glycotoxins to kidney pathophysiology is crucial for appropriately formulating and modifying CKD-related lifestyle and dietary recommendations. Thus, the aim of the present study was to investigate the effects of a diet restricted in AGEs on various biochemical and inflammatory indices in patients with end-stage renal disease (ESRD) undergoing dialysis.
2. Results
The basic characteristics of the intervention and control group are shown in Table 1. It is noted that the two groups did not differ in the body mass index (BMI) and treatment duration. However, the subjects in the control group were older. The results regarding several biochemical markers of the total studied population (study group and control group) are shown in Table 2 and Supplementary Table S1. The baseline values for most parameters did not differ between the intervention and control groups, except serum glucose and creatinine, which were higher in the intervention group. However, HbA1c did not differ between the groups. Regarding changes in the measured parameters at follow-up, several changes were observed in the intervention group (Table 2). In addition, HbA1c, total cholesterol, and triglycerides were reduced in the intervention group. It is of interest that analysis of covariance (ANCOVA), after adjusting for baseline triglycerides, had the same results (significant difference between the intervention and control groups). Notably, serum creatinine and calcium were increased in both groups, while the total protein was reduced in both groups. Moreover, fasting glucose was reduced in the control group (Table 2). When the mean or median differences of variables between the groups were compared, it was evident that HbA1c (at two months), total cholesterol, and triglycerides were significantly reduced in the intervention group compared to the control group (Table 2), Weight changes were not significant in the control and intervention group. Regarding selected measurements at two months follow-up, the differences were documented in the intervention group (reductions in HbA1c, total cholesterol, and triglycerides) whereas no change was recorded for the control group. In addition, the time measurements of C-reactive protein, HbA1c, and triglycerides differed between the control and intervention groups (repeated measurement analysis at baseline, one month follow-up, and two months follow-up, Supplementary Table S2).

Table 1.
Basic characteristics of participants.
Table 2.
Haematological and Biochemical markers of the study population.
The mean ± SD values or medians and interquartile ranges of the sRAGE, CML, RAGE, and COX-2 molecular markers are shown in Table 3. It is noteworthy that CML was higher in the intervention group at baseline (p < 0.001), whereas the other parameters did not differ. With regards to the effect of age on CML expression, the Spearman’s rho between age and baseline CML was 0.424 (p = 0.062) for the control group and −0.107 (p = 0.636) for the intervention group, but showed no significant correlation between age and CML. However, CML levels were compared between the control and the intervention groups, and across stratification by age, differentations were documented only for subjects ≤65 years (p = 0.002).
Table 3.
Molecular markers in the studied population.
Moreover, the authors stratified the sample according to age tertiles and compared the baseline CML of the control and the intervention groups. The number of patients in the aged group was higher in the control group (Chi square = 0.030).
At follow-up, sRAGE, RAGE, and COX-2 were reduced in the intervention group. Similarly, sRAGE was reduced at follow-up in the control group. CML was increased at follow-up in both the intervention and the control groups (Table 3). When the mean or median differences of variables between groups were compared, it was evident that the increase in CML was smaller in the intervention group. Significant decreases in RAGE and COX-2 were only observed in the intervention group, and these changes differed significantly from the control group (Table 3).
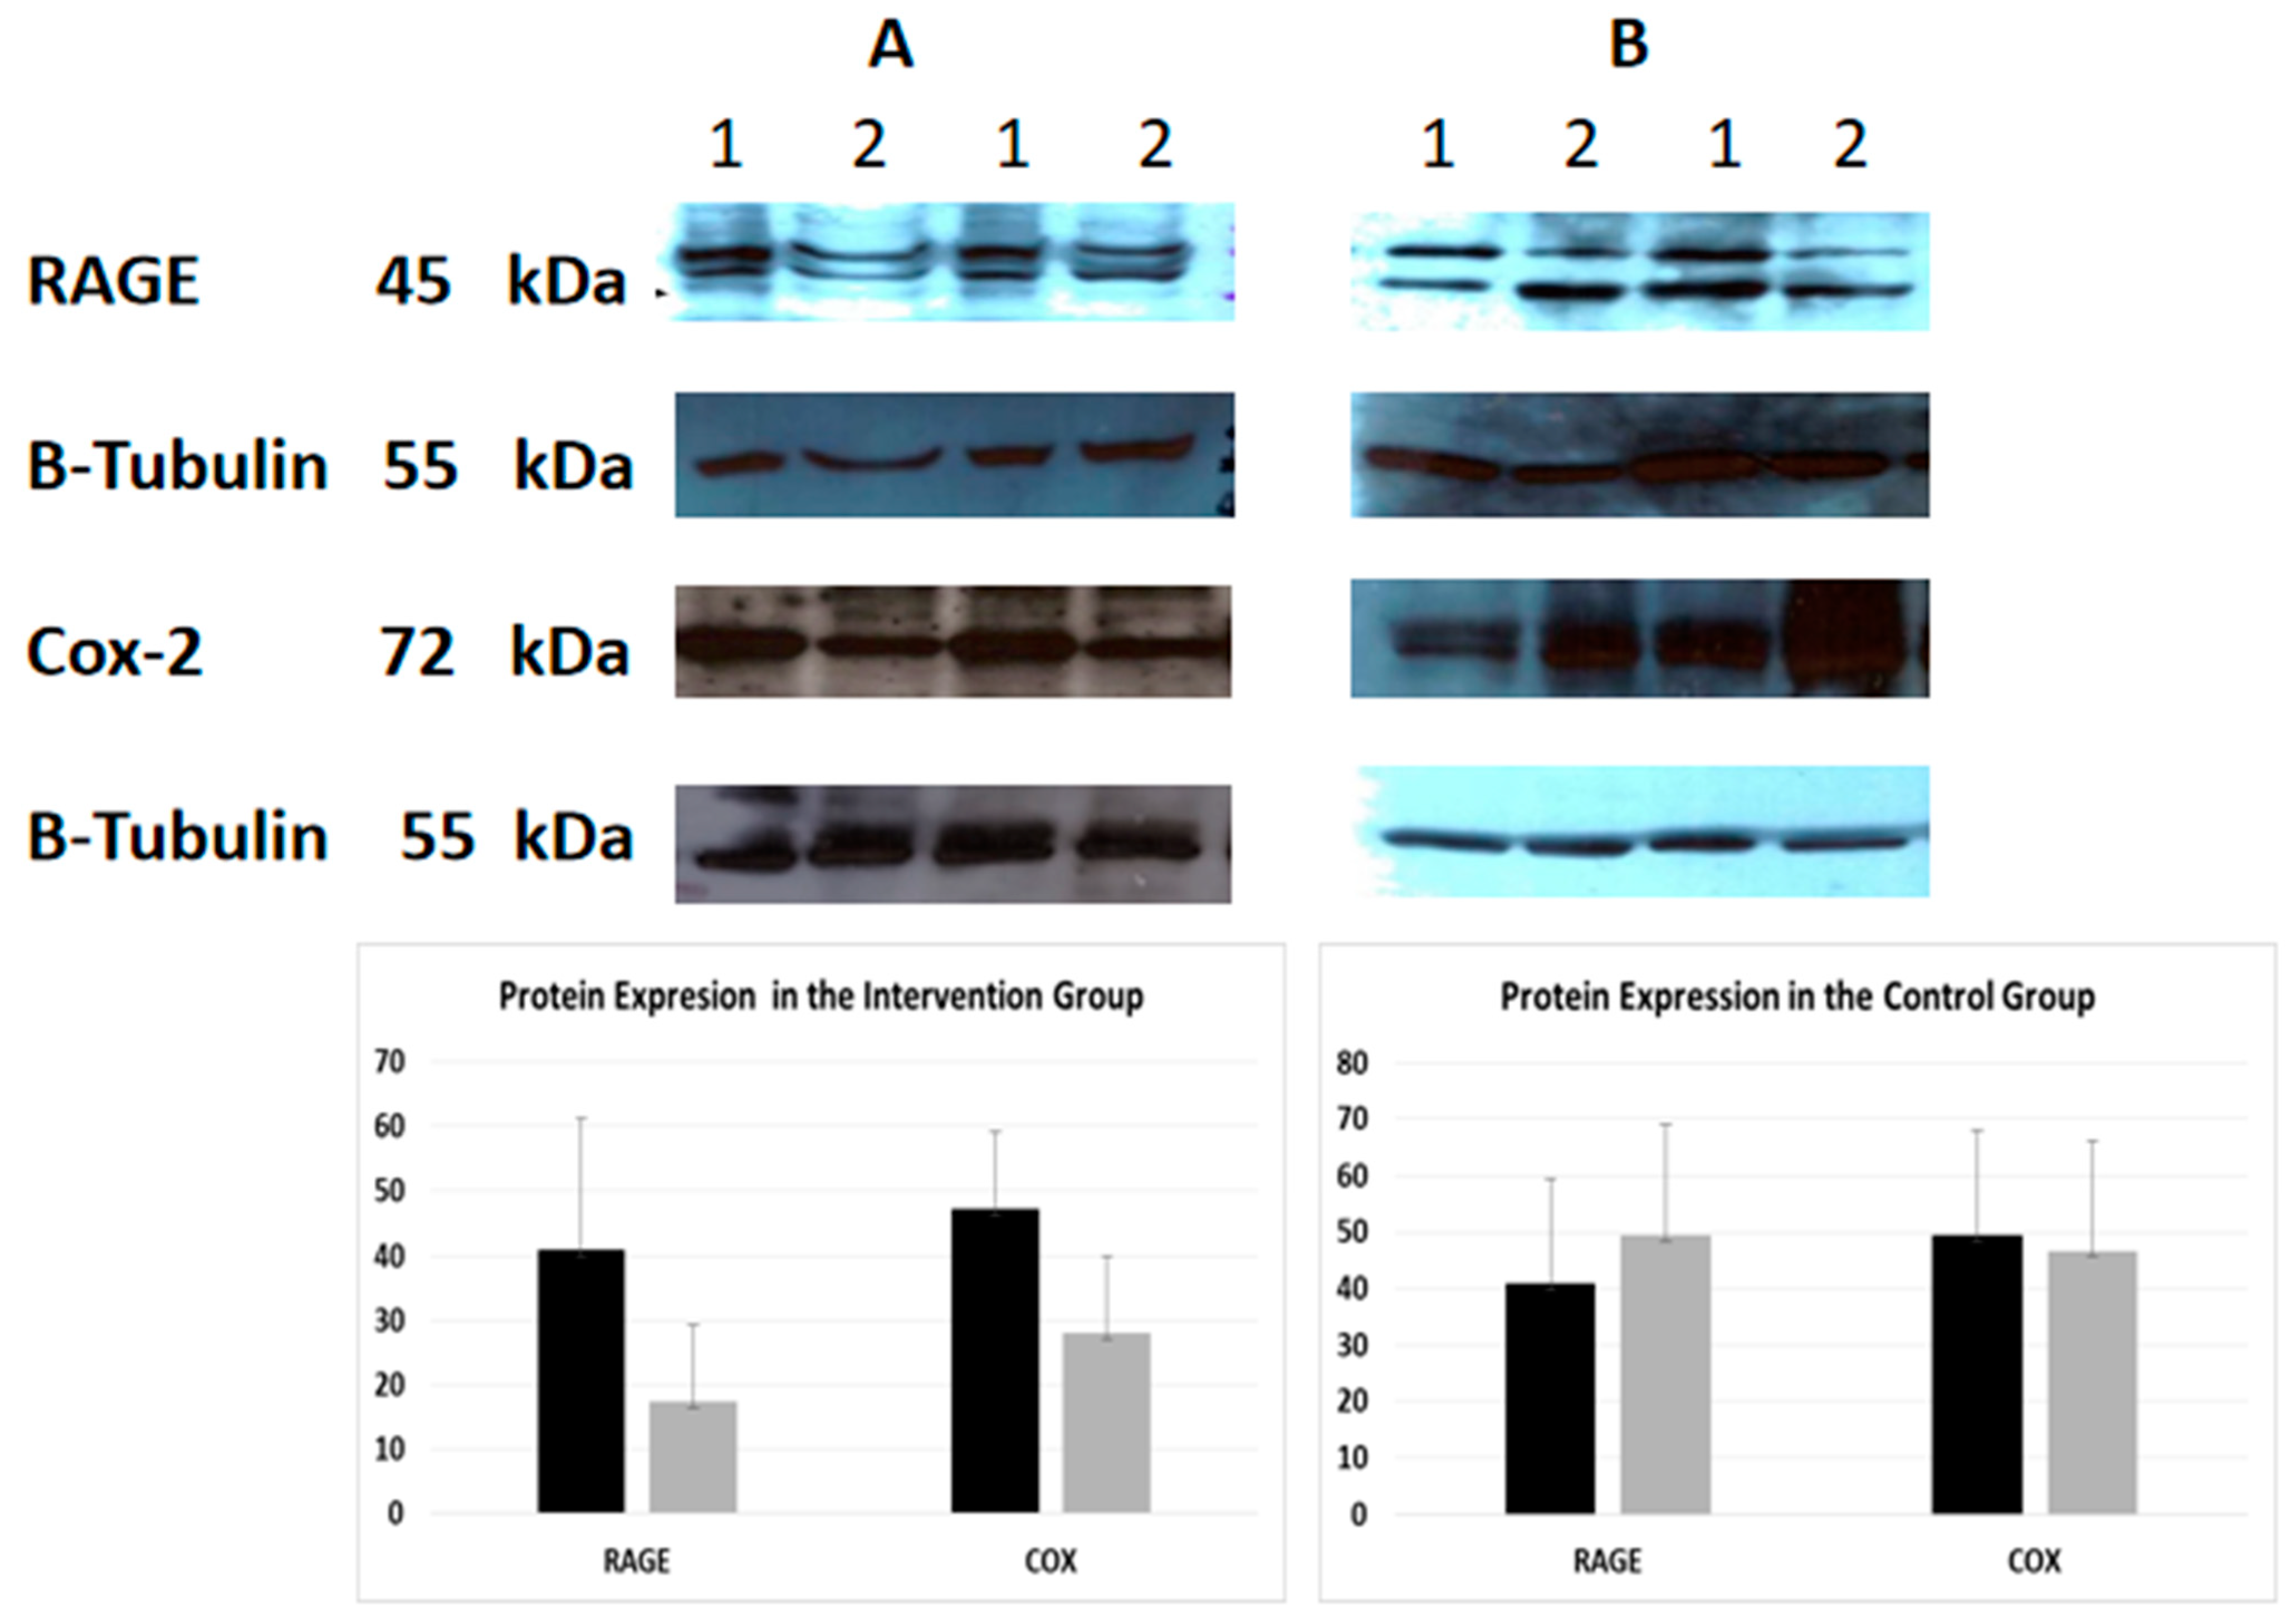
An indicative image of the quantification of the protein expression of RAGE and COX-2 using densitometry (using Scion Image-version 4.0.3.2; Scion Corporation) is presented in Figure 1. At baseline, CML was negatively correlated with sRAGE (Spearman’s rho = −0.701, p < 0.001) and RAGE (Spearman’s rho = −0.346, p = 0.031) in the total sample. Moreover, RAGE was positively related to COX-2 (Spearman’s rho = 0.447, p = 0.004), cholesterol (Spearman’s rho = 0.376 * p = 0.018), and triglycerides (Spearman’s rho = 0.317, p = 0.049), while sRAGE was positively related to urea (Spearman’s rho = 0.311, p = 0.045). The correlations of follow-up values between CML, sRAGE, RAGE, and COX-2 and biochemical indices, in the control and intervention groups, are shown in Supplementary Tables S3 and S4. Furthermore, the Spearman correlations were tested between the differences in sRAGE, CML, and RAGE with differences in glucose and lipid parameters in patients with and without diabetes, for the intervention and control group separately. The only significant correlation detected was that of differences in HbA1c at one month, with differences of sRAGE (Spearman’s rho = −0.900, p = 0.037), and CML (Spearman’s rho = 0.900, p = 0.037) in subjects with diabetes in the intervention group.

Figure 1.
Protein expression of RAGE and COX-2 (Western Immunoblotting)—indicative images. Effect of intervention on RAGE and COX-2 protein expression in PMBC cells of patients. The protein expression level was measured by Western blot analysis at baseline, and one month after dietary intervention in equal amount of cell lysate (40 lg/lane) from isolated PMBC cells of each participant. Cell lysates was subjected to electrophoresis and analyzed by Western blot. Representative blots shown for each studied protein. (A). Intervention group (B). Control group. 1. Baseline 2. After intervention.
3. Discussion
This study presents the effects of a one-month controlled dietary intervention that restricted nutritional AGEs in patients with ESRD. The intervention group presented a lower increase in CML, compared to the control group, while RAGE and COX-2 were reduced compared to the control group. sRAGE was similarly reduced in both groups. In parallel, HbA1c (at two months), as well as total cholesterol and triglycerides, were significantly reduced in the intervention group compared to the control group.
According to our previous study, dietary AGEs play an important role in the progression of CKD as well as in the adverse prognosis of patients with ESRD [9]. Patients undergoing haemodialysis have significantly higher serum AGEs along with higher circulating sRAGE levels [7]. In patients with diabetes and renal disease, Busch et al. found that the accumulation of CML was not significant, whereas Wagner et al. showed an increase in overall CML levels [10,11].
Dietary AGEs can affect circulating AGEs in subjects with kidney disease [12]. In the present study, CML, a main representative of AGEs in tissues and plasma, was increased at follow-up in both groups. This implies that the sRAGE levels may not be sufficient to eliminate the excess levels of circulating CML. Other dietary interventions in patients with ESRD undergoing peritoneal dialysis showed that CML levels were lower after an AGEs-restricted diet compared to the pre-intervention levels, as opposed to the findings of the present study [12,13]. However, dietary AGEs alone do not significantly affect serum CML, since levels of serum or tissue AGEs, including CML, are influenced by age, glucose levels, protein metabolism, oxidative stress, inflammation, liver status, smoking, and renal function [14]. Indeed, a positive association of AGE peptides with serum creatinine has been documented [15,16]. This association is also present in patients with kidney failure [13]. In this context, it is possible that a deterioration in residual renal function in both groups (as shown by creatinine increase) may also have affected circulating AGEs, and CML. Notably though, the CML increase was lower in the intervention group compared to the control, reflecting the complex regulation of circulating AGEs.
In other patients, the data regarding CML concentrations and diet effects are also contradictory. An AGEs-restricted diet for two months did not affect total AGEs content in skin and urine in patients with diabetic nephropathy [17]. Other surveys have shown that dietary AGEs alone do not significantly affect serum CML, sRAGE and CRP [18,19], inflammatory markers or endothelial dysfunction [20].
Another factor that seems to influence the relationship between diets rich in AGEs and the circulating CML levels is the study duration. According to a systematic review of randomized controlled trials conducted by Clarke et al., the magnitude of the effect of a low-AGEs diet on circulating AGEs, such as CML, and inflammatory markers was different in short-term and long-term studies [21]. In addition, in some studies, urine AGEs were measured, reflecting the metabolic state of several hours preceding the sampling, while in the present study only circulating CML was measured, using an ELISA test [17].
The AGEs-restricted intervention in the present study reduced RAGE expression. The role of dietary AGES in RAGE expression has been also demonstrated in other studies. In a study by Vlassara et al., healthy controls and patients with CKD stage 3 followed either a low-AGEs diet or an unrestricted diet. A positive correlation was found between dietary AGEs and RAGE expression in both the patients with CKD and the controls [22].
One of the most interesting findings of the present study was the reduction in the sRAGE concentrations at follow-up in both studied groups, along with an increase in CML. It could be hypothesized that the sRAGE change may be a subsequent result of CML changes or a result of further impairment in residual renal function. However, this finding is not supported by previous literature data, according to which patients undergoing haemodialysis have higher serum AGEs and sRAGE levels [7], and CML concentrations that are positively correlated to sRAGE [23].
A study by Kalousová et al. has reported that serum sRAGE levels are increased in patients with impaired renal function, particularly in those with ESRD [24]. Jung et al. have also shown that sRAGE concentrations were elevated in patients with ESRD undergoing haemodialysis. Moreover, after kidney transplantation and restoration of the renal function, sRAGE concentrations were reduced [25]. Whether sRAGE is increased due to impaired residual renal function or due to its up-regulation to counteract the toxic effects of AGEs and other toxins accumulating in uremia remains to be clarified [24]. In addition, literature regarding the relationship between diet and sRAGE is limited. It could be assumed that since sRAGE has a protective role, diets with high concentrations of AGEs could elicit an increase in sRAGE plasma concentrations. However, an AGEs-restricted diet did not affect circulating sRAGE in patients with diabetic nephropathy [17].
The present study is the first to investigate the association of dietary AGEs with COX-2. COX-2 was reduced after the intervention with an AGEs-restricted diet, while RAGE expression was positively correlated to COX-2. To date, research has focused on COX-2 involvement in the development and progression of diabetes and its complications [26]. Increased glucose concentrations promote inflammation by regulating COX-2 expression through multiple signaling pathways, resulting in the activation of mononuclear cells, which are implicated in diabetes-related complications including CKD [26]. The same conclusion was reached by Giulietti et al., who found increased COX-2 concentrations in patients with diabetes mellitus [27]. The present intervention resulted in reductions in glucose levels, which may be related to reductions in COX-2 expression. AGEs may also modulate the inflammatory milieu by inducing changes in gut microbiota [28]. Interestingly, the inhibition of AGEs formation by glycation inhibitors reduces COX-2 in monocytes [29]. In addition, dietary AGEs increase COX-2 expression in mice, an effect counterbalanced by curcumin intake, underlying the possible beneficial effects of an antioxidant-rich diet [30]. Further studies on larger populations of patients with ESRD undergoing haemodialysis and of longer duration are needed to verify our findings.
In addition, patients who adopted a low-AGEs diet exhibited an improved glucose and lipid profile, which may have been (partly) responsible for the observed differences in AGE accumulation. Interestingly, metabolic benefits regarding HbA1c, cholesterol, and triglycerides persisted at the two months follow-up. Of note, RAGE protein expression was also correlated with total cholesterol and triglycerides. The relation between ingested glucose and circulating AGEs is relatively expected, considering the mechanistic aspects of AGEs formation [31]. Moreover, dietary AGEs restriction has been shown to improve insulin sensitivity in patients with type 2 diabetes [32]. As far as lipids are concerned, AGEs may be formed during lipid peroxidation [33] and a high-fat diet [18], although no association of lipidaemic indices with CML was documented in the present study. Possibly, an up-regulation of AGEs in the lipaemic state could lead to an increase in sRAGE [34]. Moreover, it is known that a diet that promotes hyperlipidaemia also promotes atherosclerosis and oxidative stress [35]. By binding to the RAGE receptor, AGEs activate NADPH oxidase leading to ROS production. The above is in line with our finding that a low-AGEs diet is associated with a lower sRAGE expression. A diet low in AGEs and rich in fresh products, such as the Mediterranean diet, involves the consumption of less ultra-processed foods [36] since food processing accelerates the formation of new AGEs [37]. Such a diet has beneficial effects on lipids, glucose regulation [38], and adiposity [36,38]. In addition, ultra-processed foods have been connected to a high prevalence of CKD [39,40], while inorganic phosphate additives may be related to the cardiorenal syndrome [41]. Nevertheless, certain additives may reduce formed AGEs in foods [42].
Regarding HbA1c, a decrease was observed in the intervention group at two and three months after the intervention. The connection between dietary AGEs and HbA1c levels is complex and involves multiple factors. Consuming a diet high in AGEs may contribute to increased glycation reactions. Indeed, dietary AGEs contribute significantly to the body’s AGEs pool, and individuals with high dietary intake of AGEs would also have higher serum HbA1c values [43,44]. Also, dietary AGEs are associated with inflammation and oxidative stress. Chronic inflammation and oxidative stress can damage pancreatic beta cells, and impair insulin sensitivity leading to elevated blood glucose levels and HbA1c over time [28]. Last but not least, the favorable changes in glycaemic and lipidaemic profile are not related to body weight changes, since weight remained relatively stable in both groups.
The limitations of the present study include the relatively small sample size. Moreover, medications such as aspirin may have modulated COX-2 levels and other indices. In addition, only serum CML was measured, while several other AGEs such as pentosidine or MG-H1, which is a methylglyoxal derivative, may be implicated [45]. Nonetheless, CML is one of the best- characterized AGE compounds, constituting a good AGE indicator [45]. Furthermore, CML was measured by the ELISA method. The gold-standard chemical method for CML measurement is mass spectrometry, which offers important advantages because of its high selectivity and precise detection of low CML concentrations. However, ELISA methods have been the most common approach for CML measurement in several matrices (serum or foods) both in clinical and basic research [46,47]. The difference in increase of CML is somewhat difficult to interpret since the control group had much lower baseline values, suggesting the possibility of “regression to the mean” phenomenon.
In the present study, high flux filters (Kuf > 20 mL/mmHg/h/1.0 m2) with synthetic membranes (1.9–2.2 m2) or low flux filters (Kuf ≤ 20 mL/mmHg/h/1.0 m2) with synthetic membranes (1.8–2.0 m2) were used. Filters may affect AGEs concentration. For example, after dialysis sessions, AGEs perturbations are mostly present in polysulfone filters but not in polymethacrylate filters [48]. The type of membranes did not change during the intervention and the percentage of patients who underwent haemodialysis with each type of membrane was the same in both interventions.
4. Materials and Methods
4.1. Study Design
This is a one-month dietary intervention in patients with ESRD undergoing haemodialysis. A convenience sample was used. Patients were recruited from the Haemodialysis Unit, General Hospital of Molaoi, Greece. Twenty-two participants constituted the intervention group and twenty participants constituted the control group. The selection criteria for the sample were as follows: (a) age > 18 years; (b) ability to communicate in Greek; (c) satisfactory level of understanding and cooperation; (d) absence of any active infection or neoplasia; and (e) willingness to participate in the study. Selected parameters were also measured at two months (uric acid, total cholesterol, triglycerides, erythrocyte sedimentation rate, and C-reactive protein) and three months (HbA1c) to investigate longer-term differences.
4.2. Ethical Approval
The research protocol was also approved by the Ethics Committee of the University of Peloponnese (6 December 2017). In addition, authorization was obtained by the ethical committee of the haemodialysis unit, in which the patients of the survey are monitored (protocol number: 7321/17-02-2016) and permission was obtained by the Hellenic Data Protection Authority (1759/ΓΝ/ΕΞ/6597-2/09-11/2016). The objectives of the study were explained in the first page of the questionnaire and written informed consent was obtained from the participants.
4.3. Dietary Intervention
For each participant in the intervention group, an individualized dietary plan was formulated with the aid of a nutritionist, which excluded foods high in AGEs according to a previous survey conducted by our group [9]. Alternative food choices with comparable nutritional value were proposed to replace high AGEs foods with low-AGEs foods. Moreover, emphasis was given to the avoidance of processing or cooking methods that enhance the formation of AGEs. More specifically, subjects were instructed to use the following cooking methods: boiling, poaching, stewing, or steaming. In addition, they were instructed to avoid frying and oven reheating. An example of the dietary recommendations given to the control group is provided in Supplementary Table S5. The caloric value and the nutritional value of the dietary plans were not altered. No dietary changes were applied to the control group. Throughout the intervention, the patients in the intervention arm recorded the type and quantities of foods and drinks consumed, as well as the cooking methods they used to prepare food, and were encouraged not to deviate from the dietary instructions. Patients’ questions were addressed through continuous personal contact or telephone communication with the researchers. The compliance was briefly checked through oral 24-h recalls with the patients before haemodialysis sessions.
4.4. Biochemical Measurements
For blood analysis, concerning haematological and biochemical markers, peripheral fasting blood samples were collected from all participants. Blood sampling was performed during the puncture of the arteriovenous access, before the start of the haemodialysis. Blood samples were obtained on the first day of the intervention and one month later. Studied markers were measured for all participants at both time points in the same hospital biochemical laboratory, immediately after blood draw. Haematological markers were measured in a tube with ethylenediamine tetraacetic acid (EDTA) using the Sysmex K-4500 (Toa Medical Electronics Co., Ltd., Kobe, Japan) and biochemical markers in blood serum using the analyzer Siemens Advia 1800 (Siemens Healthcare Diagnostics, Inc., Tokyo, Japan) through colorimetry and/or ion selective electrode (ISE).
Blood plasma was also isolated for further analysis. The plasma soluble form of the RAGE receptor (sRAGE) was measured using the sandwich ELISA (Human sRAGE, Soluble Receptor for Advanced Glycation End product, Fine-test, China (Sensitivity: < 18.75 pg/mL, Intra-Assay: CV < 8%, Inter-Assay: CV < 10%, Recovery range: 96%, cross reactivity: Specifically recognize sRAGE, no obvious cross reaction with other analogues). Carboxymethyl lysine (CML) was measured with a competitive ELISA Kit (Competitive-ELISA Human Carboxymethyl Lysine, Fine-test, China (Sensitivity: <9.375 ng/mL, Intra-Assay: CV < 8%, Inter-Assay: CV < 10%, Recovery range: 97% cross reactivity: Specifically, it recognizes CML with no obvious cross reaction with other analogues). According to the literature, for ELISA the inter-assay % CVs of less than 15 are generally acceptable and the intra-assay % CVs should be less than 10 [49,50]. For HbA1c, a third sample was obtained sixty (60) days after the first sampling to better capture potential changes. HbA1c in ethylenediamine tetraacetic acid (EDTA) plasma was analyzed by Ion-Exchange HPLC Technology (D-10 Hemoglobin Testing System, Biorad, CA, USA).
4.5. Western Immunoblotting
A second blood sample was obtained in a heparinized syringe (heparin/blood 90 IU/10 mL) and placed in a falcon tube with more than 5 mL of Ficoll–Paque solution. The blood sample was centrifuged (centrifuge conditions: 800× g, 4 °C, 10 min, acceleration: 9, brake: 0), resulting in the separation of four layers (top to bottom: plasma, mononuclear cells, Ficoll–Paque solution and erythrocytes). In the isolated mononuclear cells of the second layer, the protein expression of RAGE and COX-2 were studied using Western immunoblotting. Western blotting was performed as previously described [51]. The following dilutions and incubation times were applied: anti-RAGE (1:200, overnight at 4 °C) (Biotechnology, Santa Cruz, CA, USA), anti-Cox (1:1000, overnight, 4 °C) (Biotechnology, Santa Cruz, CA, USA) and anti-Tubulin (1:1000, room temperature), (Upstate New York, NY, USA). Quantification of the Western signals (complexed protein bands) was performed using the Bio-Rad Universal Hood II Gel Doc Imaging System (Bio-Rad Laboratories, Hercules, CA, USA) and the image analysis program Image-Pro Plus (version 4.5, Media Cybernetics, Rockville, MD, USA).
4.6. Statistical Analysis
Descriptive analysis of the haematological, biochemical, and molecular markers of the studied population was performed. The data are presented as means +/− standard deviation (for normal variables) or as medians and interquartile ranges (for non-normally distributed variables). Paired-t test or Wilcoxon sign test was used to compare the baseline and follow-up levels of normally distributed and non-normally distributed variables, correspondingly. In addition, the % differences of all variables were calculated for both groups. Then the mean or median differences (for normally or non-normally distributed differences, correspondingly) of the intervention and the control groups were compared with the t test or Mann–Whitney test. It is noted that several modifications were made to the non-parametric variables to meet the required conditions. Specifically, the following variables were logarithmized at baseline and follow-up: Erythrocyte sedimentation rate (ESR); creatinine; AST; CK; ALP; C; P; sRAGE. The following variables were reversed (1/variable) at baseline and follow-up: RBC; glucose; ALT; RDW; HbA1c; GGT. The following variables were squared at baseline and follow-up: MCV; MPV. For the case of triglycerides, analysis of covariance (ANCOVA) was also run, since large baseline differences were observed between the intervention and control group. In this case the % difference of triglycerides was set as a dependent variable, intervention was set as a fixed factor, and baseline triglycerides were set as covariate. Repeated-measures analysis of variance (RM-ANOVA) was used to compare changes of selected parameters measured at baseline, one month and two months, between the control and the intervention group. For C-reactive protein the Kruskal–Wallis test was performed to compare measurements, since the normality criterion was not fulfilled. Potential non-linear associations were assessed using Spearman’s rho correlations between the various clinical, biochemical, and molecular characteristics. The statistical analysis was performed using the statistical package SPSS v.24 (SPSS Inc., Chicago, IL, USA) and the significance level was set at 0.05.
5. Conclusions
In the clinical practice dietary guidelines for patients with CKD, it is underlined that there is a need for interventions regarding cooking skills [8]. Although these patients are already under many restrictions that affect their quality of life, the results of the present study can be used for the formulation of specific clinical practice advice toward more “kidney-friendly” cooking methods. Moreover, the present results underline the importance of the involvement of a multidisciplinary team in the care of patients with CKD.
In conclusion, the adoption of healthy cooking methods in the context of a low-AGEs diet deserves further research as a possible way of modulating lipid, glucose, and inflammatory indices in patients with ESRD. The accumulation of AGEs can be restricted directly (by adopting healthy eating habits) or indirectly (by modifying other risk factors), minimizing the AGEs-related complications such us systemic inflammation, oxidative stress, and progression of cardiovascular-disease-related mortality.
Supplementary Materials
The following supporting information can be downloaded at: https://www.mdpi.com/article/10.3390/ijms25168893/s1.
Author Contributions
For Conceptualization, A.P.R.G., A.I., S.Z. and E.K.; methodology, A.P.R.G. and G.I.P.; formal analysis, A.A. and P.D.; investigation, A.A., G.K., D.P. and A.P.R.G.; resources, A.P.R.G.; data curation P.D.; writing—original draft preparation, A.A., A.P.R.G. and P.D.; writing—review and editing, P.D., G.I.P., E.K., B.E.S., A.I. and S.Z.; supervision, A.P.R.G. and S.Z.; project administration, A.P.R.G., A.I., A.A., G.K. and D.P.; funding acquisition, A.P.R.G. and B.E.S. All authors have read and agreed to the published version of the manuscript.
Funding
This research received no external funding.
Institutional Review Board Statement
The study was conducted in accordance with the Declaration of Helsinki, and approved by the Ethics Committee of the University of Peloponnese (06.12.2017). Authorization was also obtained by the ethical committees of the haemodialysis unit, in which the patients of the survey are monitored (protocol number: 7321/17-02-2016) and permissions were taken by the Hellenic Data Protection Authority (1759/ΓΝ/ΕΞ/6597-2/09-11/2016).
Informed Consent Statement
Informed consent was obtained from all subjects involved in the study.
Data Availability Statement
Data are available upon request.
Conflicts of Interest
The authors declare no conflicts of interest.
References
- Schwedler, S.B.; Metzger, T.; Schinzel, R.; Wanner, C. Advanced Glycation End Products and Mortality in Hemodialysis Patients. Kidney Int. 2002, 62, 301–310. [Google Scholar] [CrossRef]
- Miyata, T.; Kurokawa, K.; Van Ypersele De Strihou, C. Relevance of Oxidative and Carbonyl Stress to Long-Term Uremic Complications. Kidney Int. 2000, 58, S120–S125. [Google Scholar] [CrossRef]
- Busch, M.; Franke, S.; Rüster, C.; Wolf, G. Advanced Glycation End-Products and the Kidney: AGEs AND KIDNEY. Eur. J. Clin. Investig. 2010, 40, 742–755. [Google Scholar] [CrossRef]
- Sadik, N.A.H.; Mohamed, W.A.; Ahmed, M.I. The Association of Receptor of Advanced Glycated End Products and Inflammatory Mediators Contributes to Endothelial Dysfunction in a Prospective Study of Acute Kidney Injury Patients with Sepsis. Mol. Cell. Biochem. 2012, 359, 73–81. [Google Scholar] [CrossRef]
- Brunet, P.; Gondouin, B.; Duval-Sabatier, A.; Dou, L.; Cerini, C.; Dignat-George, F.; Jourde-Chiche, N.; Argiles, A.; Burtey, S. Does Uremia Cause Vascular Dysfunction. Kidney Blood Press. Res. 2011, 34, 284–290. [Google Scholar] [CrossRef] [PubMed]
- Nørregaard, R.; Kwon, T.-H.; Frøkiær, J. Physiology and Pathophysiology of Cyclooxygenase-2 and Prostaglandin E2 in the Kidney. Kidney Res. Clin. Pract. 2015, 34, 194–200. [Google Scholar] [CrossRef]
- Assiri, A.; Kamel, H.F.M.; ALrefai, A. Critical Appraisal of Advanced Glycation End Products (AGEs) and Circulating Soluble Receptors for Advanced Glycation End Products (sRAGE) as a Predictive Biomarkers for Cardiovascular Disease in Hemodialysis Patients. Med. Sci. 2018, 6, 38. [Google Scholar] [CrossRef] [PubMed]
- Ikizler, T.A.; Burrowes, J.D.; Byham-Gray, L.D.; Campbell, K.L.; Carrero, J.-J.; Chan, W.; Fouque, D.; Friedman, A.N.; Ghaddar, S.; Goldstein-Fuchs, D.J.; et al. KDOQI Clinical Practice Guideline for Nutrition in CKD: 2020 Update. Am. J. Kidney Dis. 2020, 76, S1–S107. [Google Scholar] [CrossRef] [PubMed]
- Aroni, A.; Zyga, S.; Tsironi, M.; Presvelos, D.; Drakopoulos, A.; Ralli, M.; Moisoglou, I.; Leventogianni, V.; Kosmidis, G.; Rojas Gil, A.P. Correlation of Dietary Advanced Glycation End Products with the Hematological and Biochemical Markers of Patients with Chronic Kidney Disease Undergoing Hemodialysis. Cureus 2019, 11, e6360. [Google Scholar] [CrossRef]
- Busch, M.; Franke, S.; Wolf, G.; Brandstädt, A.; Ott, U.; Gerth, J.; Hunsicker, L.G.; Stein, G. The Advanced Glycation End Product Nε-Carboxymethyllysine Is Not a Predictor of Cardiovascular Events and Renal Outcomes in Patients With Type 2 Diabetic Kidney Disease and Hypertension. Am. J. Kidney Dis. 2006, 48, 571–579. [Google Scholar] [CrossRef]
- Wagner, Z.; Wittmann, I.; Mazák, I.; Schinzel, R.; Heidland, A.; Kientsch-Engel, R.; Nagy, J. Nϵ-(Carboxymethyl)Lysine Levels in Patients with Type 2 Diabetes: Role of Renal Function. Am. J. Kidney Dis. 2001, 38, 785–791. [Google Scholar] [CrossRef] [PubMed]
- Yacoub, R.; Nugent, M.; Cai, W.; Nadkarni, G.N.; Chaves, L.D.; Abyad, S.; Honan, A.M.; Thomas, S.A.; Zheng, W.; Valiyaparambil, S.A.; et al. Advanced Glycation End Products Dietary Restriction Effects on Bacterial Gut Microbiota in Peritoneal Dialysis Patients; a Randomized Open Label Controlled Trial. PLoS ONE 2017, 12, e0184789. [Google Scholar] [CrossRef] [PubMed]
- Uribarri, J.; Peppa, M.; Cai, W.; Goldberg, T.; Lu, M.; He, C.; Vlassara, H. Restriction of Dietary Glycotoxins Reduces Excessive Advanced Glycation End Products in Renal Failure Patients. J. Am. Soc. Nephrol. 2003, 14, 728–731. [Google Scholar] [CrossRef] [PubMed]
- Heidland, A.; Sebekova, K.; Schinzel, R. Advanced Glycation End Products and the Progressive Course of Renal Disease. Am. J. Kidney Dis. 2001, 38, S100–S106. [Google Scholar] [CrossRef] [PubMed]
- Makita, Z.; Radoff, S.; Rayfield, E.J.; Yang, Z.; Skolnik, E.; Delaney, V.; Friedman, E.A.; Cerami, A.; Vlassara, H. Advanced Glycosylation End Products in Patients with Diabetic Nephropathy. N. Engl. J. Med. 1991, 325, 836–842. [Google Scholar] [CrossRef]
- Schalkwijk, C.G.; Ter Wee, P.M.; Stehouwer, C.D.A. Plasma Levels of AGE Peptides in Type 1 Diabetic Patients Are Associated with Serum Creatinine and Not with Albumin Excretion Rate: Possible Role of AGE Peptide—Associated Endothelial Dysfunction. Ann. N. Y. Acad. Sci. 2005, 1043, 662–670. [Google Scholar] [CrossRef] [PubMed]
- Steenbeke, M.; De Decker, I.; Marchand, S.; Glorieux, G.; Van Biesen, W.; Lapauw, B.; Delanghe, J.R.; Speeckaert, M.M. Dietary Advanced Glycation End Products in an Elderly Population with Diabetic Nephropathy: An Exploratory Investigation. Nutrients 2022, 14, 1818. [Google Scholar] [CrossRef]
- Davis, K.E.; Prasad, C.; Vijayagopal, P.; Juma, S.; Adams-Huet, B.; Imrhan, V. Contribution of Dietary Advanced Glycation End Products (AGE) to Circulating AGE: Role of Dietary Fat. Br. J. Nutr. 2015, 114, 1797–1806. [Google Scholar] [CrossRef]
- Semba, R.D.; Ang, A.; Talegawkar, S.; Crasto, C.; Dalal, M.; Jardack, P.; Traber, M.G.; Ferrucci, L.; Arab, L. Dietary Intake Associated with Serum versus Urinary Carboxymethyl-Lysine, a Major Advanced Glycation End Product, in Adults: The Energetics Study. Eur. J. Clin. Nutr. 2012, 66, 3–9. [Google Scholar] [CrossRef]
- Semba, R.D.; Gebauer, S.K.; Baer, D.J.; Sun, K.; Turner, R.; Silber, H.A.; Talegawkar, S.; Ferrucci, L.; Novotny, J.A. Dietary Intake of Advanced Glycation End Products Did Not Affect Endothelial Function and Inflammation in Healthy Adults in a Randomized Controlled Trial. J. Nutr. 2014, 144, 1037–1042. [Google Scholar] [CrossRef]
- Clarke, R.; Dordevic, A.; Tan, S.; Ryan, L.; Coughlan, M. Dietary Advanced Glycation End Products and Risk Factors for Chronic Disease: A Systematic Review of Randomised Controlled Trials. Nutrients 2016, 8, 125. [Google Scholar] [CrossRef] [PubMed]
- Vlassara, H.; Cai, W.; Goodman, S.; Pyzik, R.; Yong, A.; Chen, X.; Zhu, L.; Neade, T.; Beeri, M.; Silverman, J.M.; et al. Protection against Loss of Innate Defenses in Adulthood by Low Advanced Glycation End Products (AGE) Intake: Role of the Antiinflammatory AGE Receptor-1. J. Clin. Endocrinol. Metab. 2009, 94, 4483–4491. [Google Scholar] [CrossRef] [PubMed]
- Villegas-Rodríguez, M.E.; Uribarri, J.; Solorio-Meza, S.E.; Fajardo-Araujo, M.E.; Cai, W.; Torres-Graciano, S.; Rangel-Salazar, R.; Wrobel, K.; Garay-Sevilla, M.E. The AGE-RAGE Axis and Its Relationship to Markers of Cardiovascular Disease in Newly Diagnosed Diabetic Patients. PLoS ONE 2016, 11, e0159175. [Google Scholar] [CrossRef] [PubMed]
- Kalousová, M.; Hodková, M.; Kazderová, M.; Fialová, J.; Tesař, V.; Dusilová-Sulková, S.; Zima, T. Soluble Receptor for Advanced Glycation End Products in Patients With Decreased Renal Function. Am. J. Kidney Dis. 2006, 47, 406–411. [Google Scholar] [CrossRef] [PubMed]
- Jung, E.S.; Chung, W.; Kim, A.J.; Ro, H.; Chang, J.H.; Lee, H.H.; Jung, J.Y. Associations between Soluble Receptor for Advanced Glycation End Products (sRAGE) and S100A12 (EN-RAGE) with Mortality in Long-Term Hemodialysis Patients. J. Korean Med. Sci. 2017, 32, 54. [Google Scholar] [CrossRef] [PubMed]
- Shanmugam, N.; Gaw Gonzalo, I.T.; Natarajan, R. Molecular Mechanisms of High Glucose-Induced Cyclooxygenase-2 Expression in Monocytes. Diabetes 2004, 53, 795–802. [Google Scholar] [CrossRef] [PubMed]
- Giulietti, A.; Van Etten, E.; Overbergh, L.; Stoffels, K.; Bouillon, R.; Mathieu, C. Monocytes from Type 2 Diabetic Patients Have a Pro-Inflammatory Profile. Diabetes Res. Clin. Pract. 2007, 77, 47–57. [Google Scholar] [CrossRef] [PubMed]
- Kellow, N.J.; Coughlan, M.T. Effect of Diet-Derived Advanced Glycation End Products on Inflammation. Nutr. Rev. 2015, 73, 737–759. [Google Scholar] [CrossRef] [PubMed]
- Jahan, H.; Siddiqui, N.N.; Iqbal, S.; Basha, F.Z.; Shaikh, S.; Pizzi, M.; Choudhary, M.I. Suppression of COX-2/PGE2 Levels by Carbazole-Linked Triazoles via Modulating Methylglyoxal-AGEs and Glucose-AGEs–Induced ROS/NF-κB Signaling in Monocytes. Cell. Signal. 2022, 97, 110372. [Google Scholar] [CrossRef]
- Sowndhar Rajan, B.; Krishnan, K.; Vellaichamy, E. Diet-Derived Advanced Glycation End Products (dAGEs) Induce Proinflammatory Cytokine Expression in Cardiac and Renal Tissues of Experimental Mice: Protective Effect of Curcumin. Cardiovasc. Toxicol. 2022, 22, 35–51. [Google Scholar] [CrossRef]
- Vlassara, H.; Uribarri, J. Advanced Glycation End Products (AGE) and Diabetes: Cause, Effect, or Both? Curr. Diab Rep. 2014, 14, 453. [Google Scholar] [CrossRef]
- Uribarri, J.; Cai, W.; Ramdas, M.; Goodman, S.; Pyzik, R.; Chen, X.; Zhu, L.; Striker, G.E.; Vlassara, H. Restriction of Advanced Glycation End Products Improves Insulin Resistance in Human Type 2 Diabetes. Diabetes Care 2011, 34, 1610–1616. [Google Scholar] [CrossRef]
- Fu, M.-X.; Requena, J.R.; Jenkins, A.J.; Lyons, T.J.; Baynes, J.W.; Thorpe, S.R. The Advanced Glycation End Product, N∊-(Carboxymethyl)Lysine, Is a Product of Both Lipid Peroxidation and Glycoxidation Reactions. J. Biol. Chem. 1996, 271, 9982–9986. [Google Scholar] [CrossRef] [PubMed]
- Yamagishi, S.; Adachi, H.; Nakamura, K.; Matsui, T.; Jinnouchi, Y.; Takenaka, K.; Takeuchi, M.; Enomoto, M.; Furuki, K.; Hino, A.; et al. Positive Association between Serum Levels of Advanced Glycation End Products and the Soluble Form of Receptor for Advanced Glycation End Products in Nondiabetic Subjects. Metabolism 2006, 55, 1227–1231. [Google Scholar] [CrossRef]
- McNair, E.; Qureshi, M.; Prasad, K.; Pearce, C. Atherosclerosis and the Hypercholesterolemic AGE–RAGE Axis. Int. J. Angiol. 2016, 25, 110–116. [Google Scholar] [CrossRef]
- Detopoulou, P.; Dedes, V.; Syka, D.; Tzirogiannis, K.; Panoustopoulos, G. Relation of Minimally Processed Foods and Ultra-Processed Foods with the Mediterranean Diet Score, Time-Related Meal Patterns and Waist Circumference: Results from a Cross-Sectional Study in University Students. Int. J. Environ. Res. Public Health 2023, 20, 2806. [Google Scholar] [CrossRef]
- Krajcovicová-Kudlácková, M.; Sebeková, K.; Schinzel, R.; Klvanová, J. Advanced Glycation End Products and Nutrition. Physiol. Res. 2002, 51, 313–316. [Google Scholar] [CrossRef]
- Juul, F.; Vaidean, G.; Parekh, N. Ultra-Processed Foods and Cardiovascular Diseases: Potential Mechanisms of Action. Adv. Nutr. 2021, 12, 1673–1680. [Google Scholar] [CrossRef] [PubMed]
- Kityo, A.; Lee, S.-A. The Intake of Ultra-Processed Foods and Prevalence of Chronic Kidney Disease: The Health Examinees Study. Nutrients 2022, 14, 3548. [Google Scholar] [CrossRef] [PubMed]
- Su, D.; Chen, J.; Du, S.; Kim, H.; Yu, B.; Wong, K.E.; Boerwinkle, E.; Rebholz, C.M. Metabolomic Markers of Ultra-Processed Food and Incident CKD. CJASN 2023, 18, 327–336. [Google Scholar] [CrossRef]
- Calvo, M.S.; Dunford, E.K.; Uribarri, J. Industrial Use of Phosphate Food Additives: A Mechanism Linking Ultra-Processed Food Intake to Cardiorenal Disease Risk? Nutrients 2023, 15, 3510. [Google Scholar] [CrossRef] [PubMed]
- Wang, S.; Zheng, X.; Zheng, L.; Yang, Y.; Xiao, D.; Zhang, H.; Ai, B.; Sheng, Z. κ-Carrageenan Inhibits the Formation of Advanced Glycation End Products in Cakes: Inhibition Mechanism, Cake Characteristics, and Sensory Evaluation. Food Chem. 2023, 429, 136583. [Google Scholar] [CrossRef] [PubMed]
- Guilbaud, A.; Niquet-Leridon, C.; Boulanger, E.; Tessier, F. How Can Diet Affect the Accumulation of Advanced Glycation End-Products in the Human Body? Foods 2016, 5, 84. [Google Scholar] [CrossRef] [PubMed]
- Demirer, B.; Yardımcı, H.; Erem Basmaz, S. Inflammation Level in Type 2 Diabetes Is Associated with Dietary Advanced Glycation End Products, Mediterranean Diet Adherence and Oxidative Balance Score: A Pathway Analysis. J. Diabetes Its Complicat. 2023, 37, 108354. [Google Scholar] [CrossRef] [PubMed]
- Uribarri, J.; Cai, W.; Peppa, M.; Goodman, S.; Ferrucci, L.; Striker, G.; Vlassara, H. Circulating Glycotoxins and Dietary Advanced Glycation Endproducts: Two Links to Inflammatory Response, Oxidative Stress, and Aging. J. Gerontol. Ser. A Biol. Sci. Med. Sci. 2007, 62, 427–433. [Google Scholar] [CrossRef] [PubMed]
- Takeuchi, M.; Makita, Z.; Yanagisawa, K.; Kameda, Y.; Koike, T. Detection of Noncarboxymethyllysine and Carboxymethyllysine Advanced Glycation End Products (AGE) in Serum of Diabetic Patients. Mol. Med. 1999, 5, 393–405. [Google Scholar] [CrossRef] [PubMed]
- Gómez-Ojeda, A.; Jaramillo-Ortíz, S.; Wrobel, K.; Wrobel, K.; Barbosa-Sabanero, G.; Luevano-Contreras, C.; De La Maza, M.P.; Uribarri, J.; Del Castillo, M.D.; Garay-Sevilla, M.E. Comparative Evaluation of Three Different ELISA Assays and HPLC-ESI-ITMS/MS for the Analysis of N ε-Carboxymethyl Lysine in Food Samples. Food Chem. 2018, 243, 11–18. [Google Scholar] [CrossRef] [PubMed]
- Noce, A.; Rovella, V.; Marrone, G.; Cattani, G.; Zingaretti, V.; Limongi, D.; D’Agostini, C.; Sorge, R.; Casasco, M.; Di Daniele, N.; et al. Hemodialysis Biomarkers: Total Advanced Glycation End Products (AGEs) against Oxidized Human Serum Albumin (HSAox). Acta Diabetol. 2019, 56, 1323–1331. [Google Scholar] [CrossRef] [PubMed]
- Salimetrics Calculating Inter- and Intra-Assay Coefficients of Variability. Available online: https://salimetrics.com/calculating-inter-and-intra-assay-coefficients-of-variability/ (accessed on 15 December 2019).
- Brindle, E.; Lillis, L.; Barney, R.; Bansil, P.; Hess, S.Y.; Wessells, K.R.; Ouédraogo, C.T.; Arredondo, F.; Barker, M.K.; Craft, N.E.; et al. A Multicenter Analytical Performance Evaluation of a Multiplexed Immunoarray for the Simultaneous Measurement of Biomarkers of Micronutrient Deficiency, Inflammation and Malarial Antigenemia. PLoS ONE 2021, 16, e0259509. [Google Scholar] [CrossRef]
- Rojas-Gil, A.P.; Ziros, P.G.; Diaz, L.; Kletsas, D.; Basdra, E.K.; Alexandrides, T.K.; Zadik, Z.; Frank, S.J.; Papathanassopoulou, V.; Beratis, N.G.; et al. Growth Hormone/JAK-STAT Axis Signal-transduction Defect: A Novel Treatable Cause of Growth Failure. FEBS J. 2006, 273, 3454–3466. [Google Scholar] [CrossRef]
Disclaimer/Publisher’s Note: The statements, opinions and data contained in all publications are solely those of the individual author(s) and contributor(s) and not of MDPI and/or the editor(s). MDPI and/or the editor(s) disclaim responsibility for any injury to people or property resulting from any ideas, methods, instructions or products referred to in the content. |
© 2024 by the authors. Licensee MDPI, Basel, Switzerland. This article is an open access article distributed under the terms and conditions of the Creative Commons Attribution (CC BY) license (https://creativecommons.org/licenses/by/4.0/).