Abstract
Liver fibrosis, characterized by excessive extracellular matrix deposition, is driven by activated hepatic stellate cells (HSCs). Due to the limited availability of anti-fibrotic drugs, the research on therapeutic agents continues. Here we have investigated Moringa oleifera Lam. (MO), known for its various bioactive properties, for anti-fibrotic effects. This study has focused on 1-phenyl-2-pentanol (1-PHE), a compound derived from MO leaves, and its effects on LX-2 human hepatic stellate cell activation. TGF-β1-stimulated LX-2 cells were treated with MO extract or 1-PHE, and the changes in liver fibrosis markers were assessed at both gene and protein levels. Proteomic analysis and molecular docking were employed to identify potential protein targets and signaling pathways affected by 1-PHE. Treatment with 1-PHE downregulated fibrosis markers, including collagen type I alpha 1 chain (COL1A1), collagen type IV alpha 1 chain (COL4A1), mothers against decapentaplegic homologs 2 and 3 (SMAD2/3), and matrix metalloproteinase-2 (MMP2), and reduced the secretion of matrix metalloproteinase-9 (MMP-9). Proteomic analysis data showed that 1-PHE modulates the Wnt/β-catenin pathway, providing a possible mechanism for its effects. Our results suggest that 1-PHE inhibits the TGF-β1 and Wnt/β-catenin signaling pathways and HSC activation, indicating its potential as an anti-liver-fibrosis agent.
1. Introduction
Liver fibrosis is the physiological consequence of the excessive wound healing process that responds to the liver injury [1]. Several etiological factors can cause the inflammation in the liver and increase the risk of fibrous scar formation, resulting from toxins, viral hepatitis, alcoholic liver disease (ALD), and non-alcoholic fatty liver disease (NAFLD) [2]. Characteristically, hepatic fibrosis is underpinned by the accumulation of extracellular matrix (ECM), especially collagen types I and III [3]. Several studies have revealed the key factors in the synthesis of ECM in response to hepatic injury include hepatic stellate cells (HSCs), which belong to hepatic mesenchymal cells [4,5,6,7]. In response to liver injury, transforming growth factor beta 1 (TGF-β1), secreted from the surrounding immune cells, induces fibrogenesis by stimulating HSCs, leading to myofibroblast differentiation. Activated myofibroblasts then release several proteins which are the key markers of hepatic fibrosis, including matrix metalloproteinases (MMPs), alpha-smooth muscle actin (α-SMA), and collagen type I, as well as specific phenotypic changes, such as fibrogenesis, contractility, and immunomodulation [3]. The process of hepatic fibrosis accumulation is reversible when the causes are removed. Progressive chronic liver inflammation can lead to the development of cirrhosis, the irreversible form of hepatic structural change, which affects liver function [8]. Since the specific medication for liver fibrosis remains limited there is a need to explore new agents to treat the condition.
Phytochemical active compounds have drawn attention in the field of anti-hepatic-fibrosis research since several active compounds isolated from plants have shown promising biological activities in vitro and in vivo [9,10,11,12,13]. Moringa oleifera Lam. (MO), a plant that belongs to the Moringaceae family [14], is one that has been extensively studied in various phytomedicine-related fields, for anti-inflammatory [15,16,17], anti-cancer [18,19,20], anti-microbial [21,22,23], and anti-hepatic-fibrosis activities [24,25]. The study from Wisitpongpun et al. showed that 1-phenyl-2-pentanol (1-PHE), the active compound isolated from the ethyl acetate extract of MO leaf, has anti-cancer activity by inducing cell cycle arrest and apoptosis in a triple-negative breast cancer cell line [26]. This compound has been used as a food additive and a flavoring agent [27]. However, the anti-hepatic-fibrosis activity of the 1-PHE remains unexplored.
In this study, we aimed to evaluate the anti-liver-fibrotic activity of 1-PHE in the TGF-β1-induced HSC model. The expression of activated HSC markers was measured at the gene and protein levels. Proteomics analysis was employed to visualize the proteins that might be involved in the mechanism of action of 1-PHE. Moreover, molecular docking analysis was used to predict the potential binding interaction between the active compound and candidate protein targets. Our findings provided the valuable insights into the potential anti-fibrotic agent of 1-PHE isolated from MO plants, which contributes to the growing knowledge on finding novel anti-hepatic-fibrosis agents.
2. Results
2.1. The Effects of Crude MO Extract and 1-PHE on Cell Viability
LX-2 cells were exposed to varying concentrations of crude MO extract and 1-PHE for 24 h, and then examined for cell viability by the resazurin dye exclusion test. Dose–response curves were analyzed using GraphPad Prism’s non-linear regression tools (Figure 1). The formulas to calculate IC5 and IC10 values are shown below [28], where F represents the desired inhibition percentage and H is the Hill slope. The IC5, IC10, and IC50 of crude MO extract were 31.64, 43.95, and 115.61 µg/mL, respectively. In contrast, 1-PHE showed less toxicity for LX-2 cells than the crude MO extract, with IC5, IC10, and IC50 values of 59.00, 85.37, and 252.92 µg/mL, respectively. Based on these results, concentrations of 40 µg/mL (crude extract) and 80 µg/mL (1-PHE) were chosen as the upper limits for further investigations.
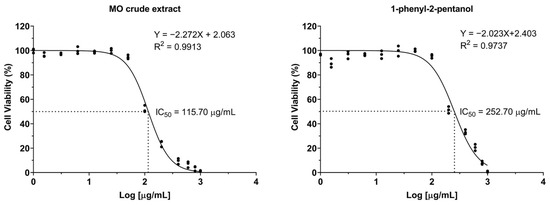
Figure 1.
The dose–response curves of LX-2 cell viability after treatment with varying concentrations of crude Moringa extract or 1-phenyl-2-pentanol.
2.2. The Effects of Crude MO Extract and 1-PHE on Expression of Liver Fibrotic Markers
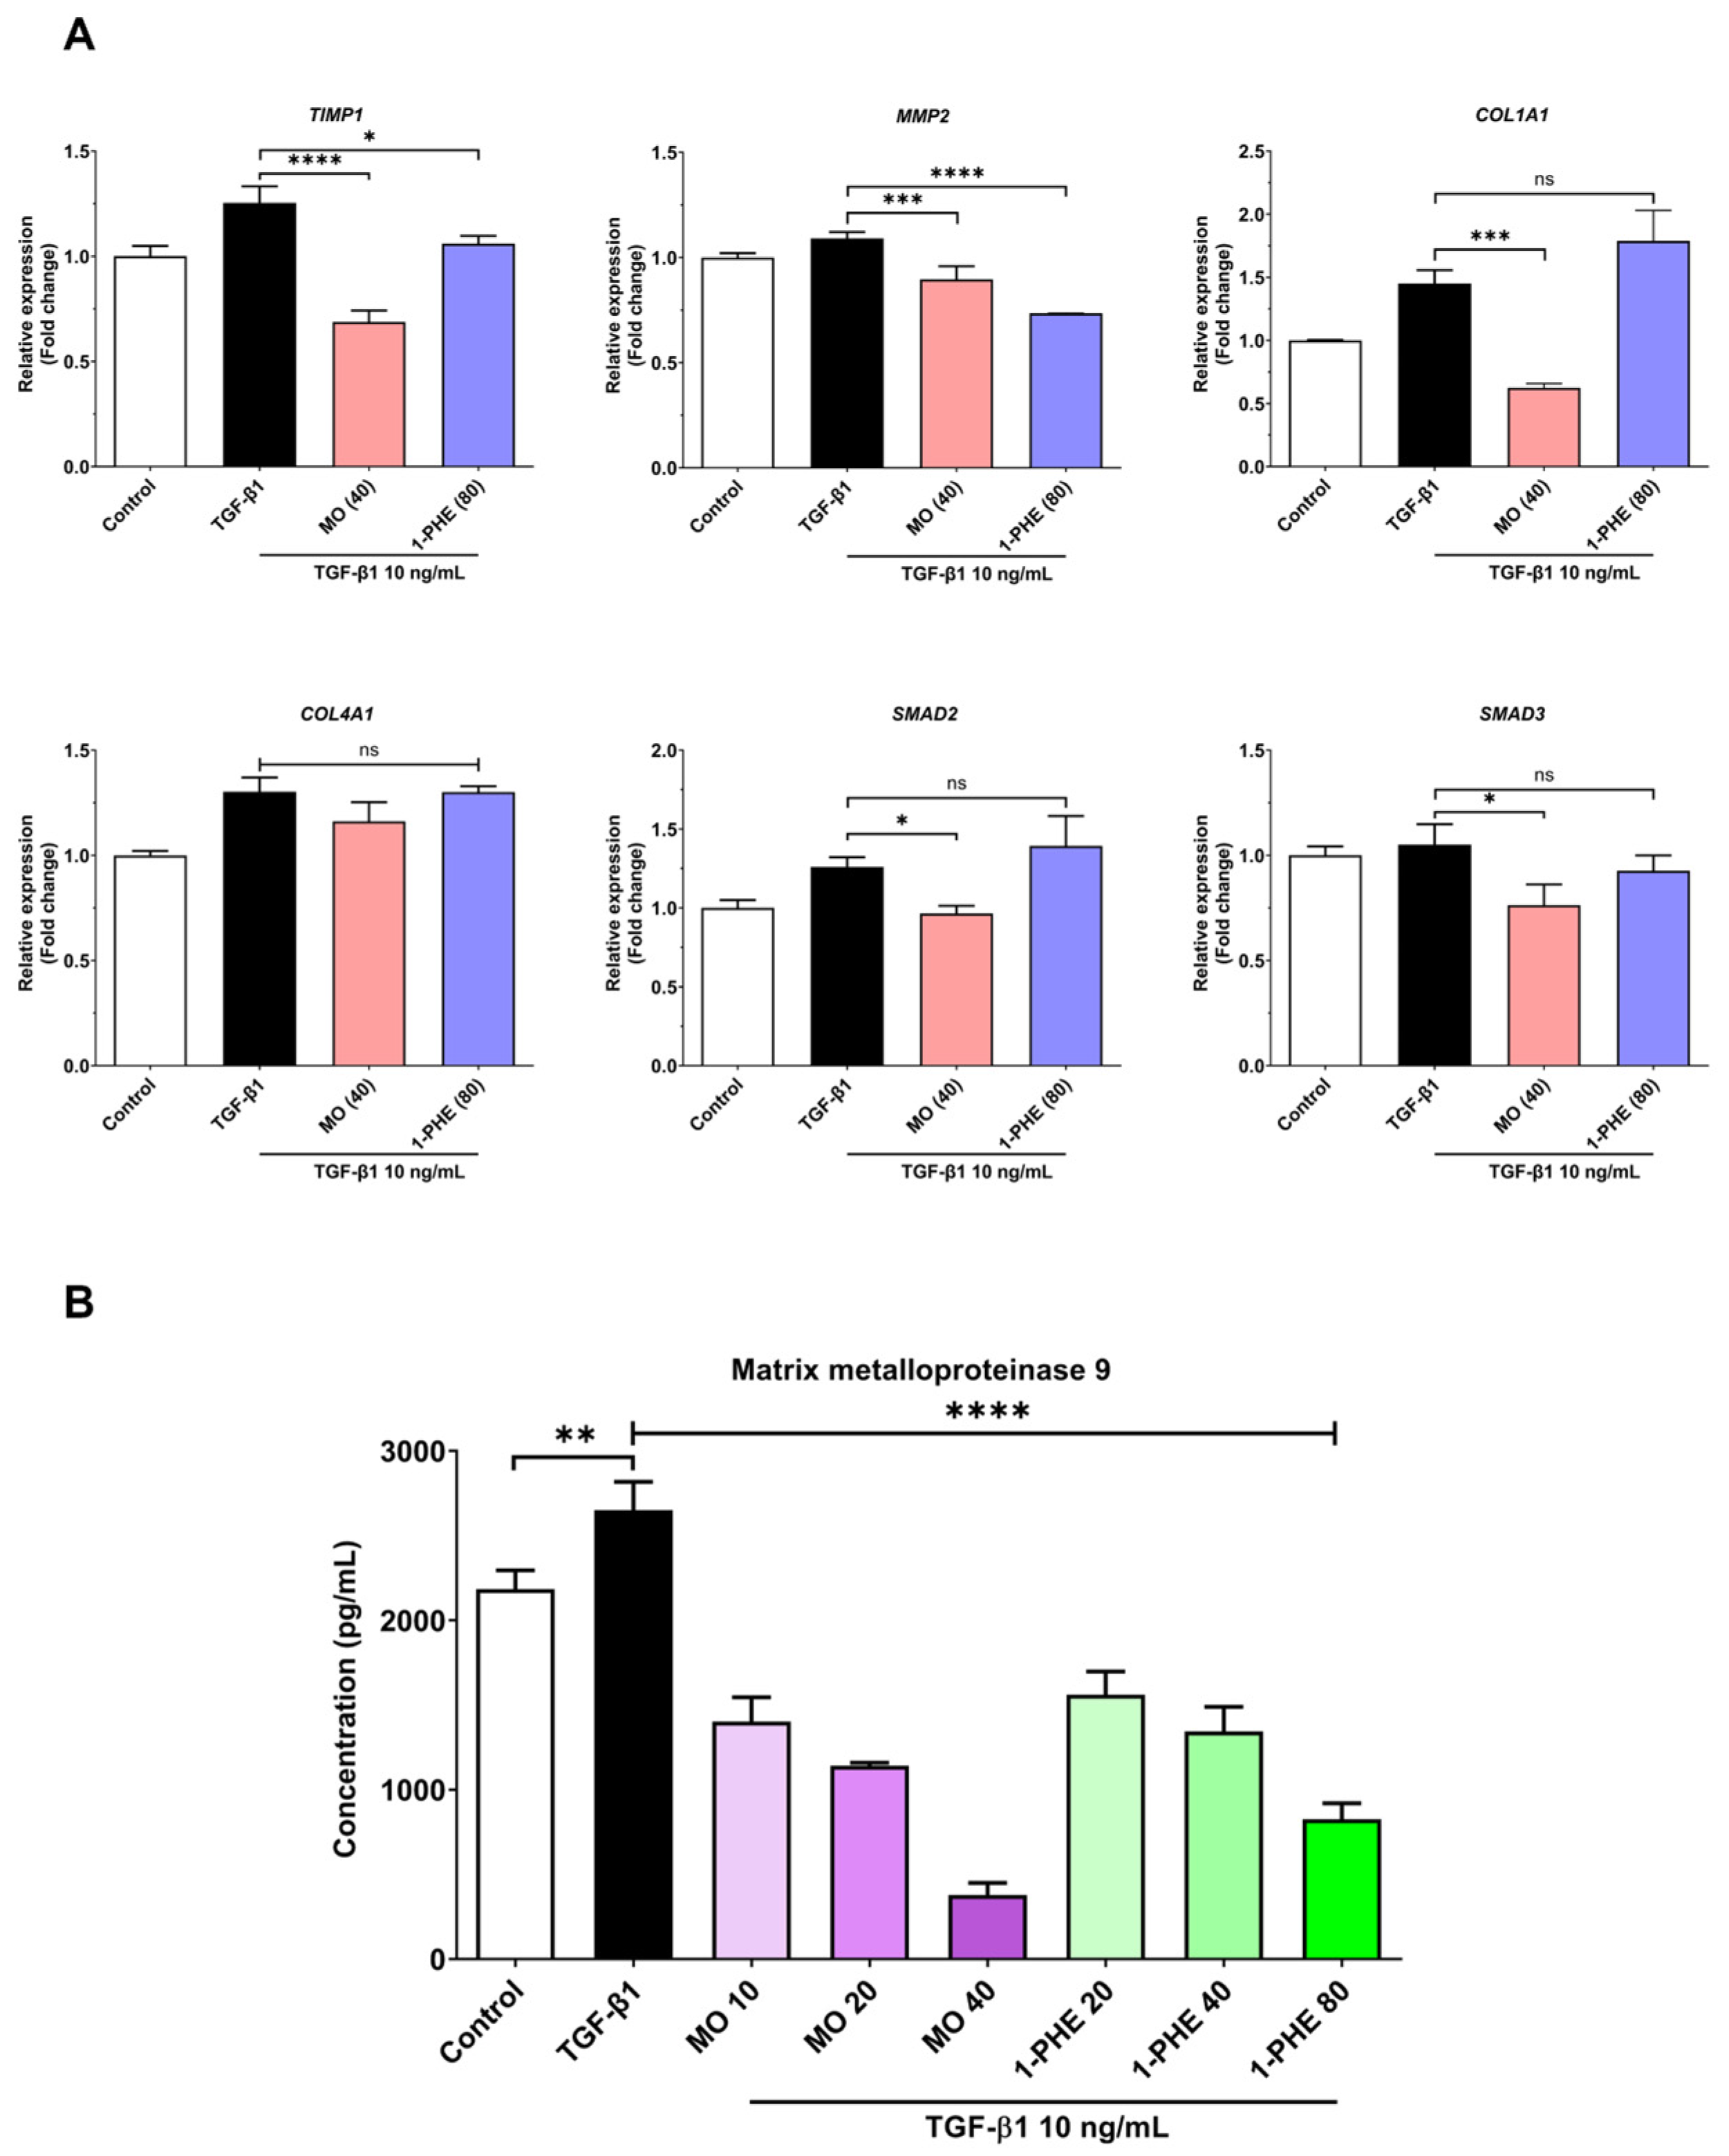
The expression of selected liver fibrosis markers (both gene expression and MMP-9 levels) in LX-2 cells exposed to varying concentrations of crude MO extract and 1-PHE was evaluated using qRT-PCR and ELISA. Cells were treated for 48 h with 10 ng/mL TGF-β1. Crude MO significantly suppressed the expression of COL1A1, TIMP1, MMP2, SMAD2, and SMAD3 genes in the TGF-β1-treated LX2 cells. High-dose 1-PHE treatment significantly inhibited TIMP1 and MMP2 expression (Figure 2A). Both crude MO extract and 1-PHE significantly reduced the release of MMP-9 in a dose-dependent manner (Figure 2B). These results suggest potential anti-fibrotic activity of crude MO extract and 1-PHE at both transcriptional and protein levels.
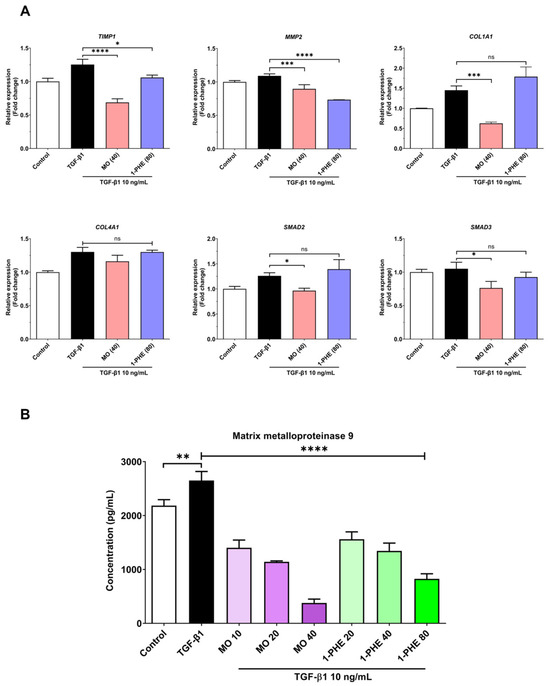
Figure 2.
The expression of liver fibrotic-associated genes and the MMP-9 level in crude MO extract and 1-PHE treated cells. The LX-2 cells at 2 × 10⁵ cells/well were incubated with different concentrations of crude MO extract or 1-PHE in the presence of 10 ng/mL TGF-β1 for 48 h. The cells were harvested and the mRNA expression measured using real-time qRT-PCR. (A) The candidate liver fibrotic-associated genes, as shown above, include COL1A1, TIMP1, MMP2, SMAD2, and SMAD3. The relative gene expression was normalized to GAPDH. (B) The cell culture supernatant was collected and evaluated for the MMP-9 level. The data are presented as mean ± SD. p-value < 0.0332 (*), p-value < 0.0021 (**), p-value < 0.0002 (***), p-value < 0.0001 (****).
2.3. Proteomic Analysis of 1-PHE Treatment in LX-2 Cells
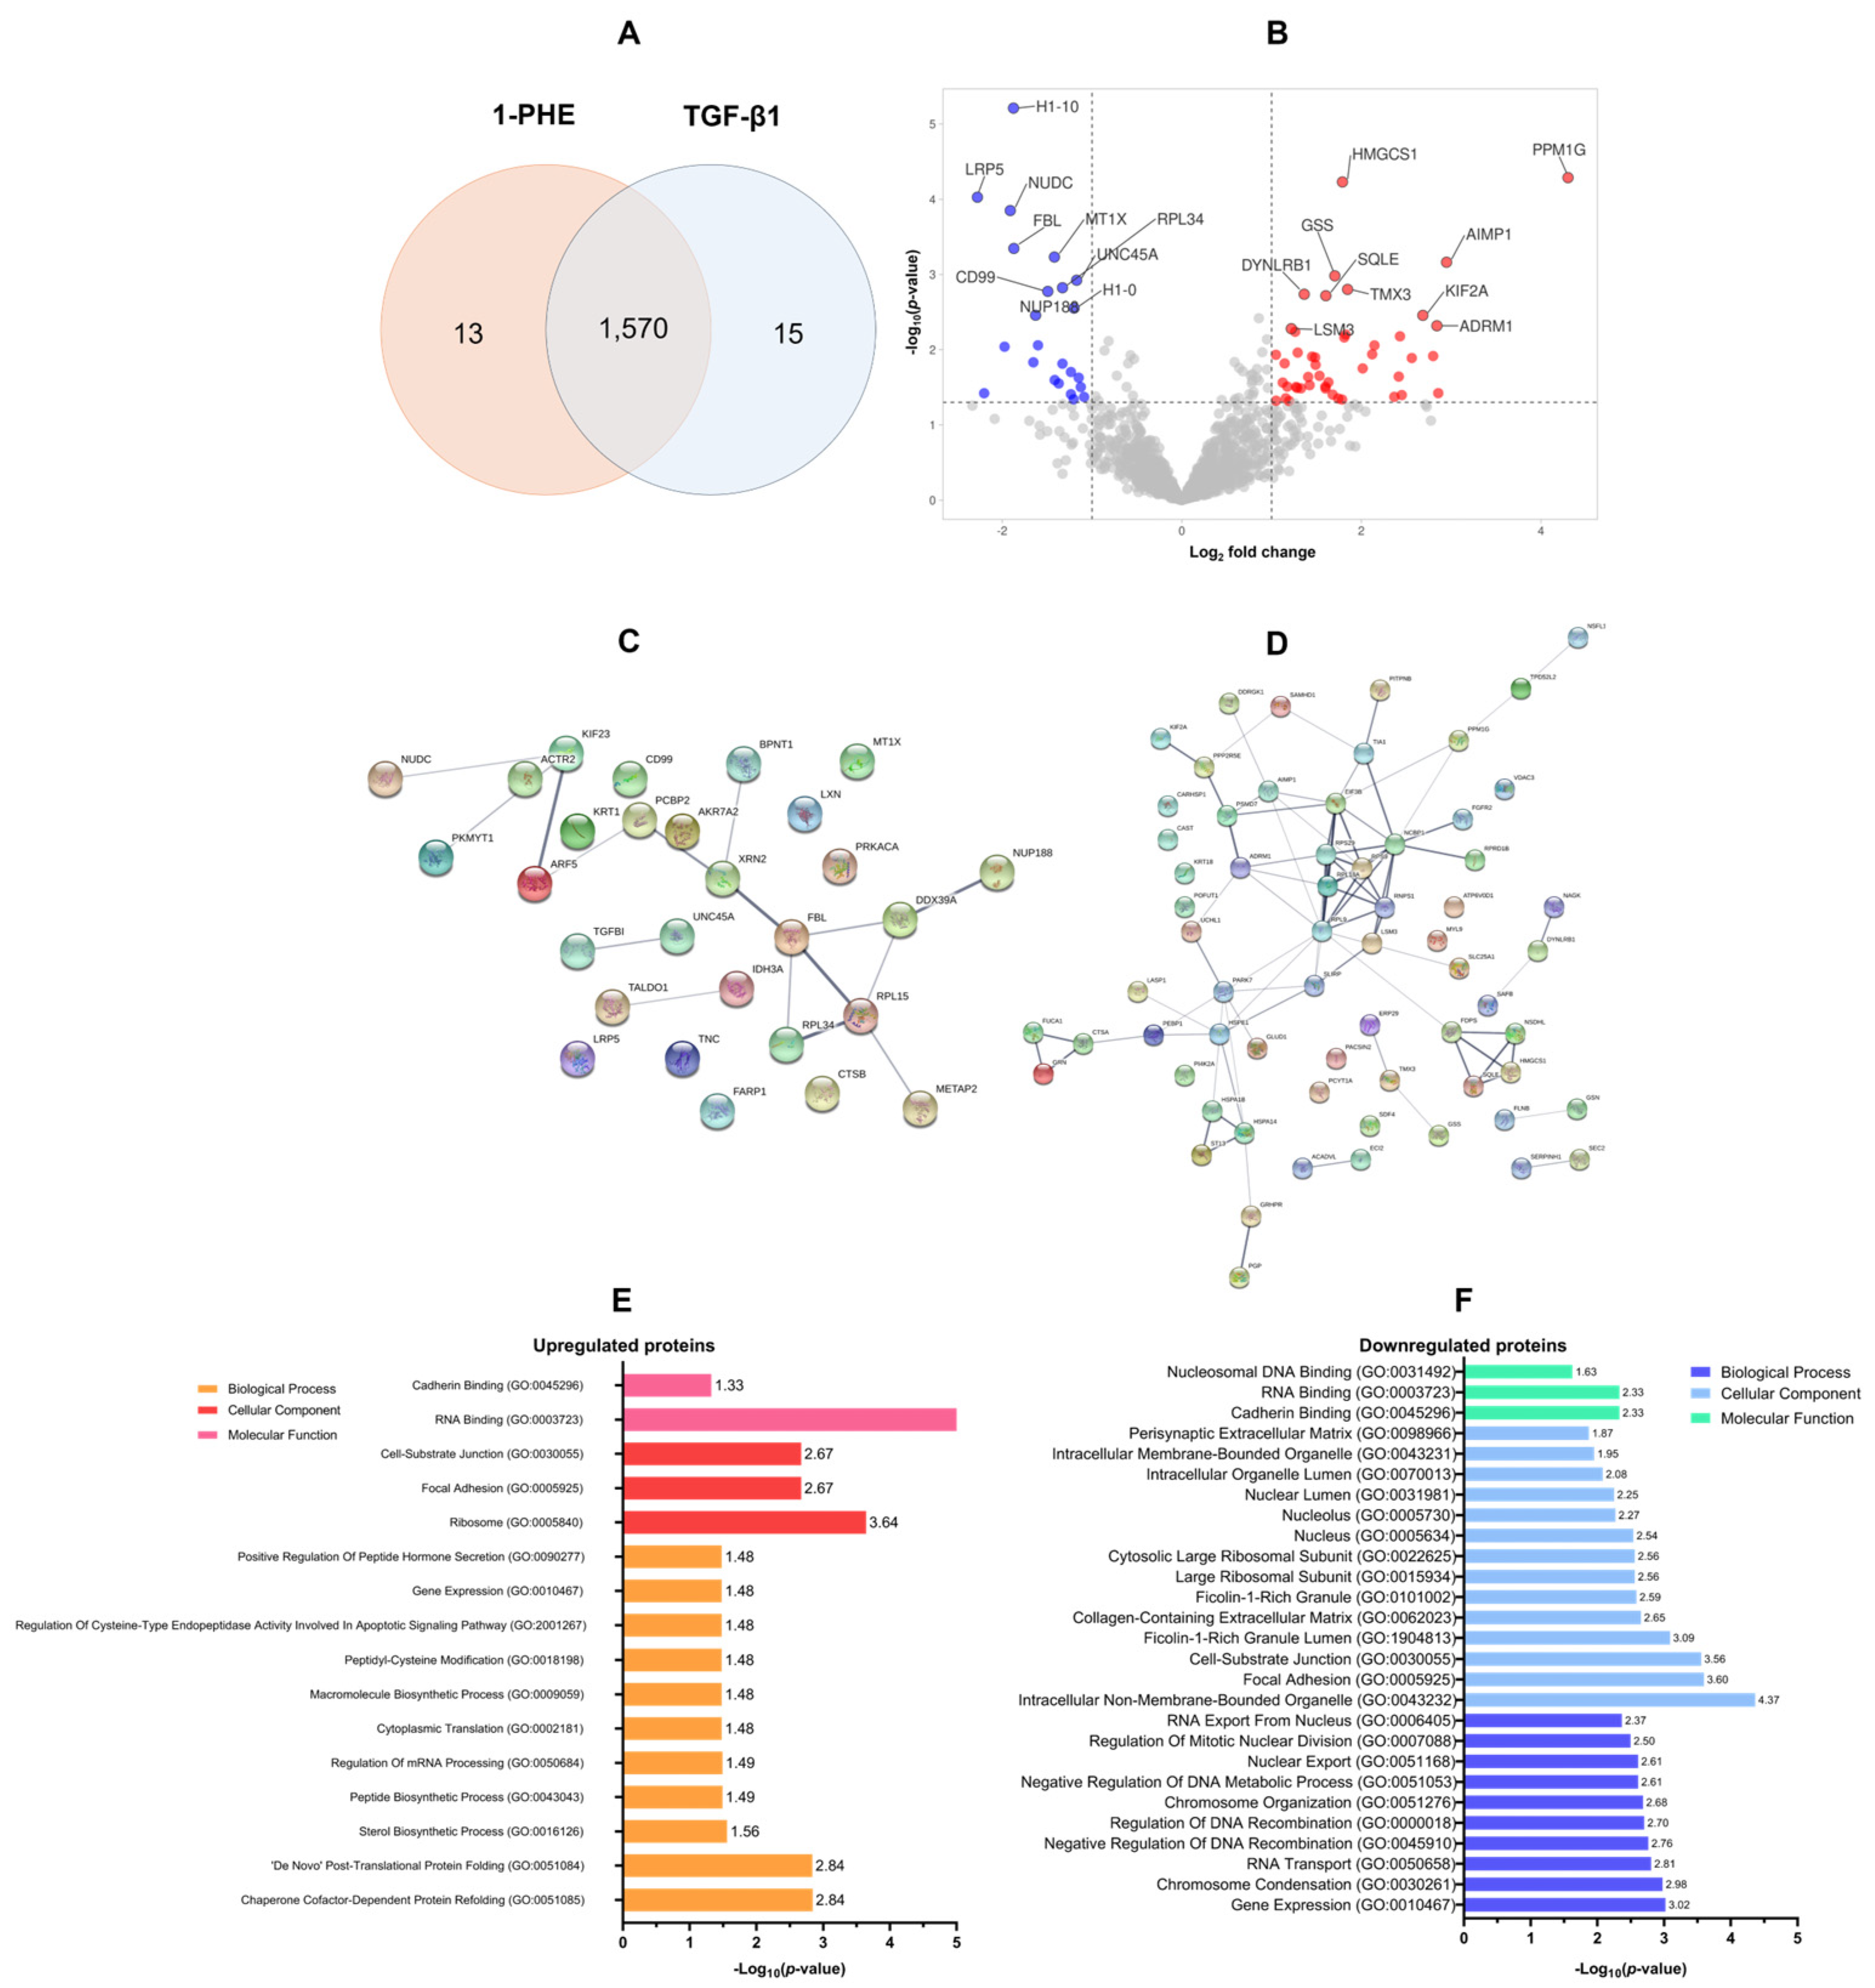
A proteomic analysis was conducted to evaluate the effects of 1-PHE treatment on TGF-β1 LX-2 cells for 48 h. Statistical analysis (p-value < 0.05 and log2 fold change) revealed differential expression of 1570 proteins (DEPs). Treatment with 1-PHE resulted in the upregulation of 68 proteins and the downregulation of 30 proteins (Figure 3A,B). Table 1 summarizes the top 10 most significantly impacted proteins. A protein–protein interaction (PPI) network analysis, constructed using a stringent interaction score threshold (0.700), revealed significant interconnectivity among differentially expressed proteins (Figure 3C,D). This suggests potential functional relationships among the upregulated and downregulated proteins.

Figure 3.
The proteomic profiling of DEPs and GO annotation analysis. In total, 1570 DEPs were identified following treatment of LX-2 cells with 1-PHE and TGF-β1 (A). Statistical thresholds (log2 fold change ≤1.5 or ≥1.5; p-value < 0.05) were applied to distinguish significantly upregulated (n = 68; red dots) and downregulated (n = 30; blue dots) proteins (B). Protein–protein interaction (PPI) network analysis demonstrated interconnectedness within the sets of upregulated and downregulated DEPs (C,D). To illuminate the potential functions of these DEPs, Gene Ontology (GO) annotation was employed, categorizing proteins by biological process, cellular component, and molecular function (E,F).

Table 1.
The list of top 10 up- and downregulated proteins of LX-2 cells in response to 1-PHE treatment.
Gene Ontology (GO) annotation demonstrated that the upregulated DEPs were primarily involved in chaperone-mediated protein refolding (GO:0051085 and GO:0051084), as well as sterol biosynthesis (GO:0016126). Conversely, downregulated DEPs were associated with gene expression regulation (GO:0010467), the process of chromosome condensation (GO:0030261), and RNA transport (GO:0050658). Analysis of cellular localization showed that upregulated proteins were found in the ribosome (GO:0005840), focal adhesions (GO:0005925), and cell–substrate junctions (GO:0030055). In contrast, downregulated DEPs were predominantly associated with non-membrane-bound intracellular organelles (GO:0043232), focal adhesions (GO:0005925), cell–substrate junctions (GO:0030055), ficolin-1-rich granule lumens (GO:1904813), and the collagen-containing extracellular matrix (GO:0062023). Molecular function classification revealed that upregulated DEPs exhibited a strong propensity for RNA binding (GO:0003723), cadherin binding (GO:0045296), and protein homodimerization (GO:0042803). Downregulated DEPs also demonstrated cadherin- and RNA-binding activities, as well as an affinity for nucleosomal DNA binding (GO:0031492), as shown in Figure 3E,F.
KEGG enrichment analysis revealed differential modulation of several signaling pathways in LX-2 cells following 1-PHE treatment. Notably, pathways associated with Parkinson’s disease, ribosomal function, steroid and terpenoid backbone biosynthesis, and endoplasmic reticulum protein processing were significantly upregulated. In contrast, pathways related to renin secretion, eukaryotic ribosome biogenesis, autophagy, Wnt signaling, and tight junction formation were downregulated (Figure 4A,B). To highlight pathways implicated in hepatic fibrosis [29,30,31,32], the Wnt signaling pathway was diagrammed (Figure 4C). Within this pathway, downregulated genes, LDL-receptor-related protein 5 (LRP5) and protein kinase cAMP-activated catalytic subunit alpha (PRKACA), are indicated in cyan.
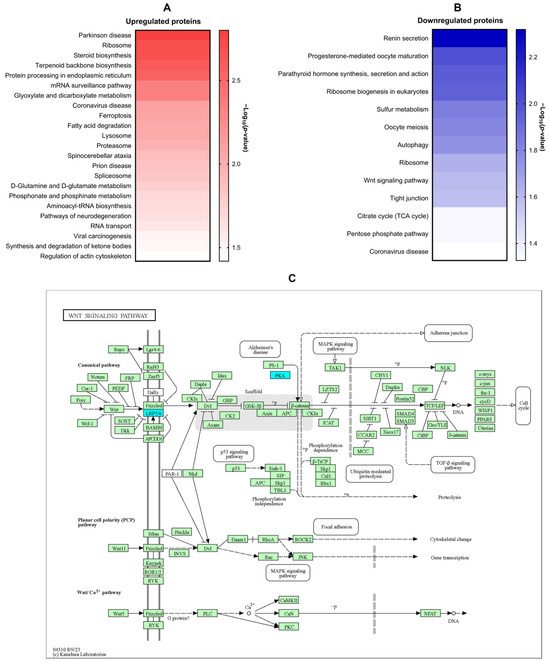
Figure 4.
KEGG signaling pathway enrichment analysis of DEPs. KEGG signaling pathway enrichment analysis was performed on DEPs to elucidate the potential impact of 1-PHE on signaling pathways within LX-2 cells. Notably, Parkinson’s disease emerged as the most significantly enriched pathway associated with upregulated DEPs (A). In contrast, the renin secretion signaling pathway demonstrated the strongest enrichment among downregulated proteins (B). Intriguingly, the Wnt signaling pathway, a pathway strongly implicated in liver fibrosis and HSC activation, was also found to be downregulated (C). Downregulated genes were indicated by the color blue, while other genes within the pathway were represented by green. LRP5, LDL-receptor-related protein 5; PRKACA, protein kinase cAMP-activated catalytic subunit alpha.
2.4. Molecular Docking Analysis of Candidate Target Proteins
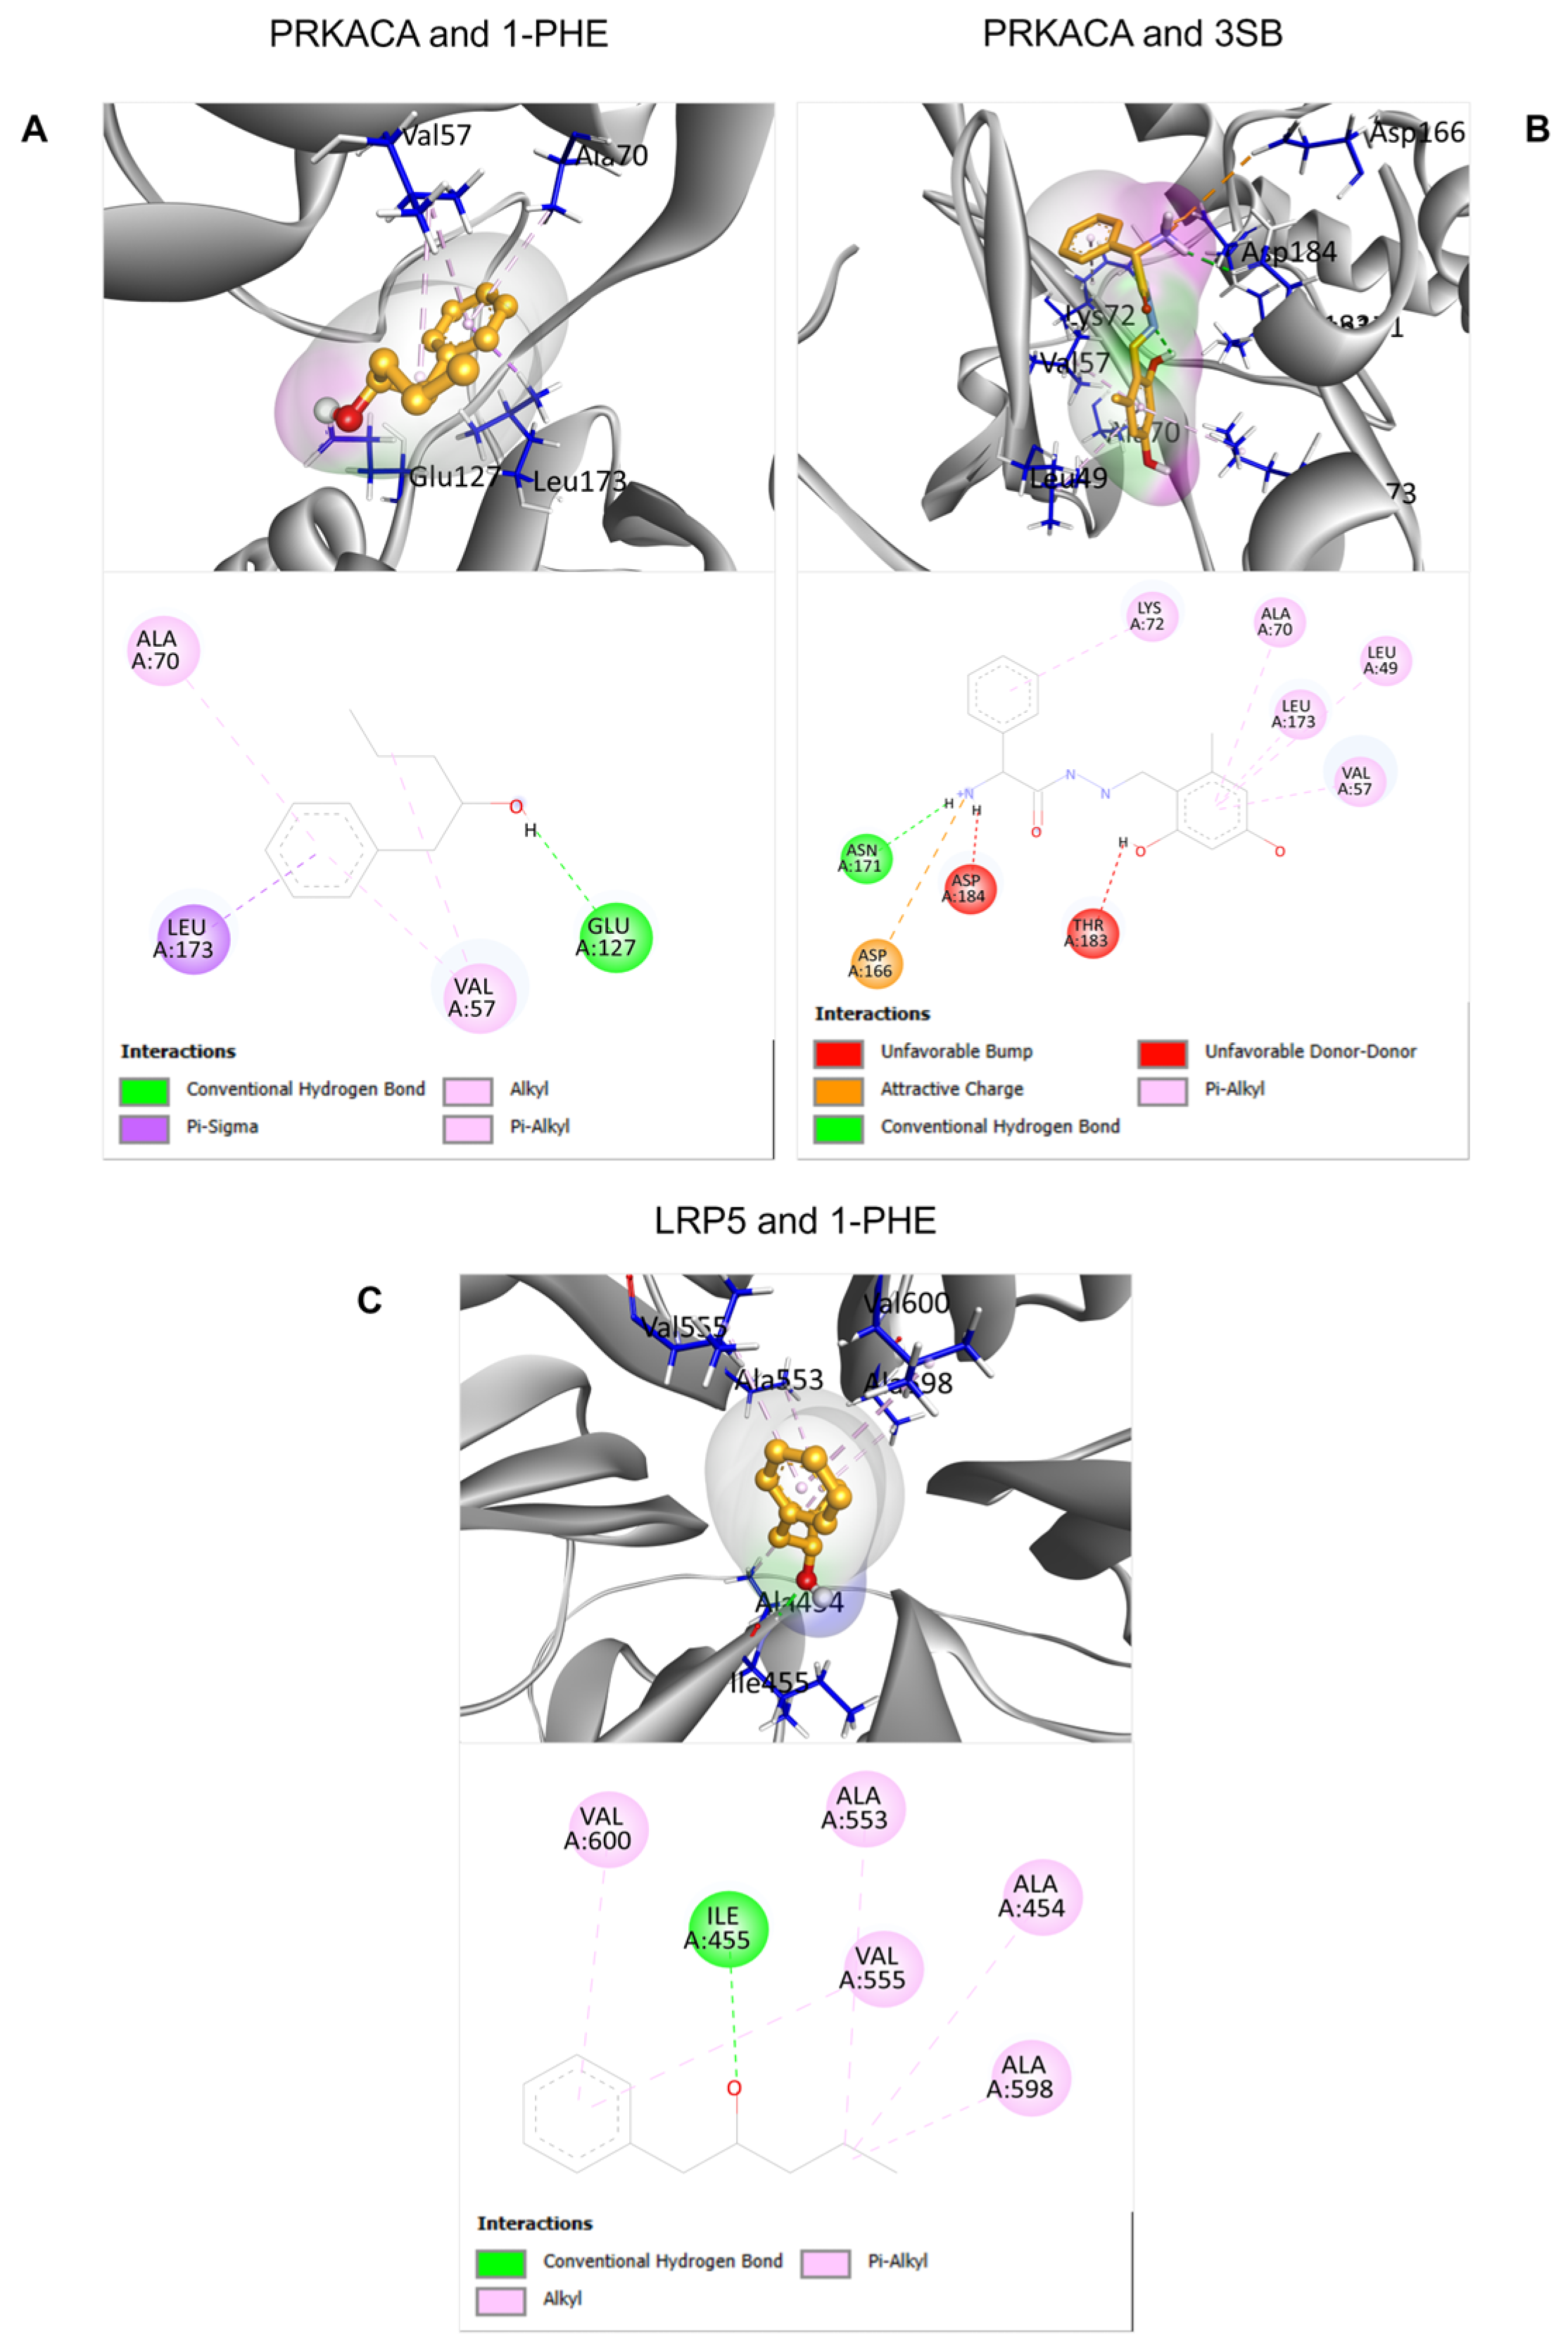
To predict potential interactions between 1-PHE and proteins within the Wnt signaling pathway, molecular docking analyses were performed on two downregulated proteins identified through proteomic analysis: PRKACA and LRP5. For PRKACA, the binding score of 1-PHE (−6.033) was comparable to that of the known binding compound 3SB (−6.306), suggesting a potential binding affinity of 1-PHE for the same binding site on PRKACA. In the case of LRP5, due to the absence of a known binding compound and a corresponding experimental crystal structure in the RCSB PDB database, the docking site was determined solely based on protein cavity identification using the BIOVIA Discovery Studio Visualizer software version 21.1.0.20298 (Dassault Systèmes, San Diego, CA, USA). Despite these limitations, the calculated binding score between 1-PHE and LRP5 (−6.055) indicated a favorable interaction, as detailed in Table 2. Figure 5 provides in-depth 2D and 3D visualizations of the predicted binding poses and specific chemical interactions between 1-PHE and both target proteins.
Table 2.
The molecular docking analysis of selected proteins and compounds.
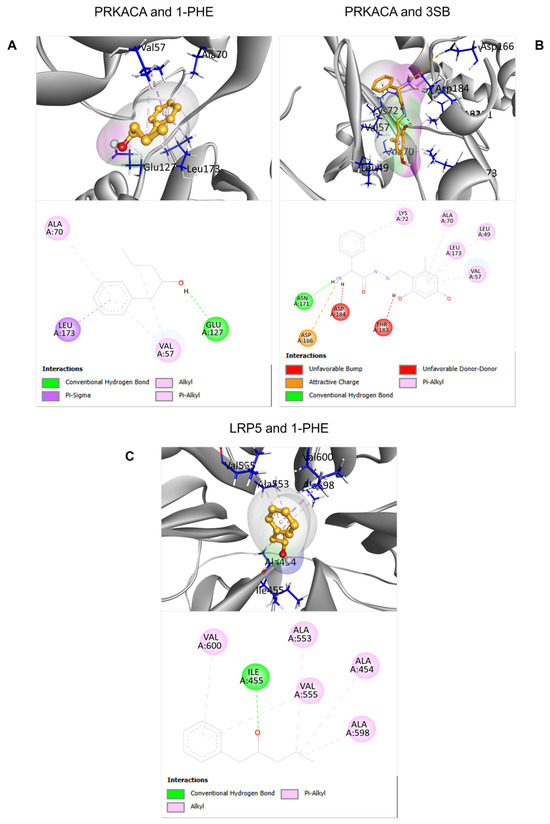
Figure 5.
The 2D and 3D structural characteristics of ligand-protein complexes. Specifically, the interactions between PRKACA and two ligands, 1-PHE and 3SB, were visualized (A,B). Additionally, the interaction between 1-PHE and LRP5 was investigated (C).
2.5. Molecular Dynamics Simulation
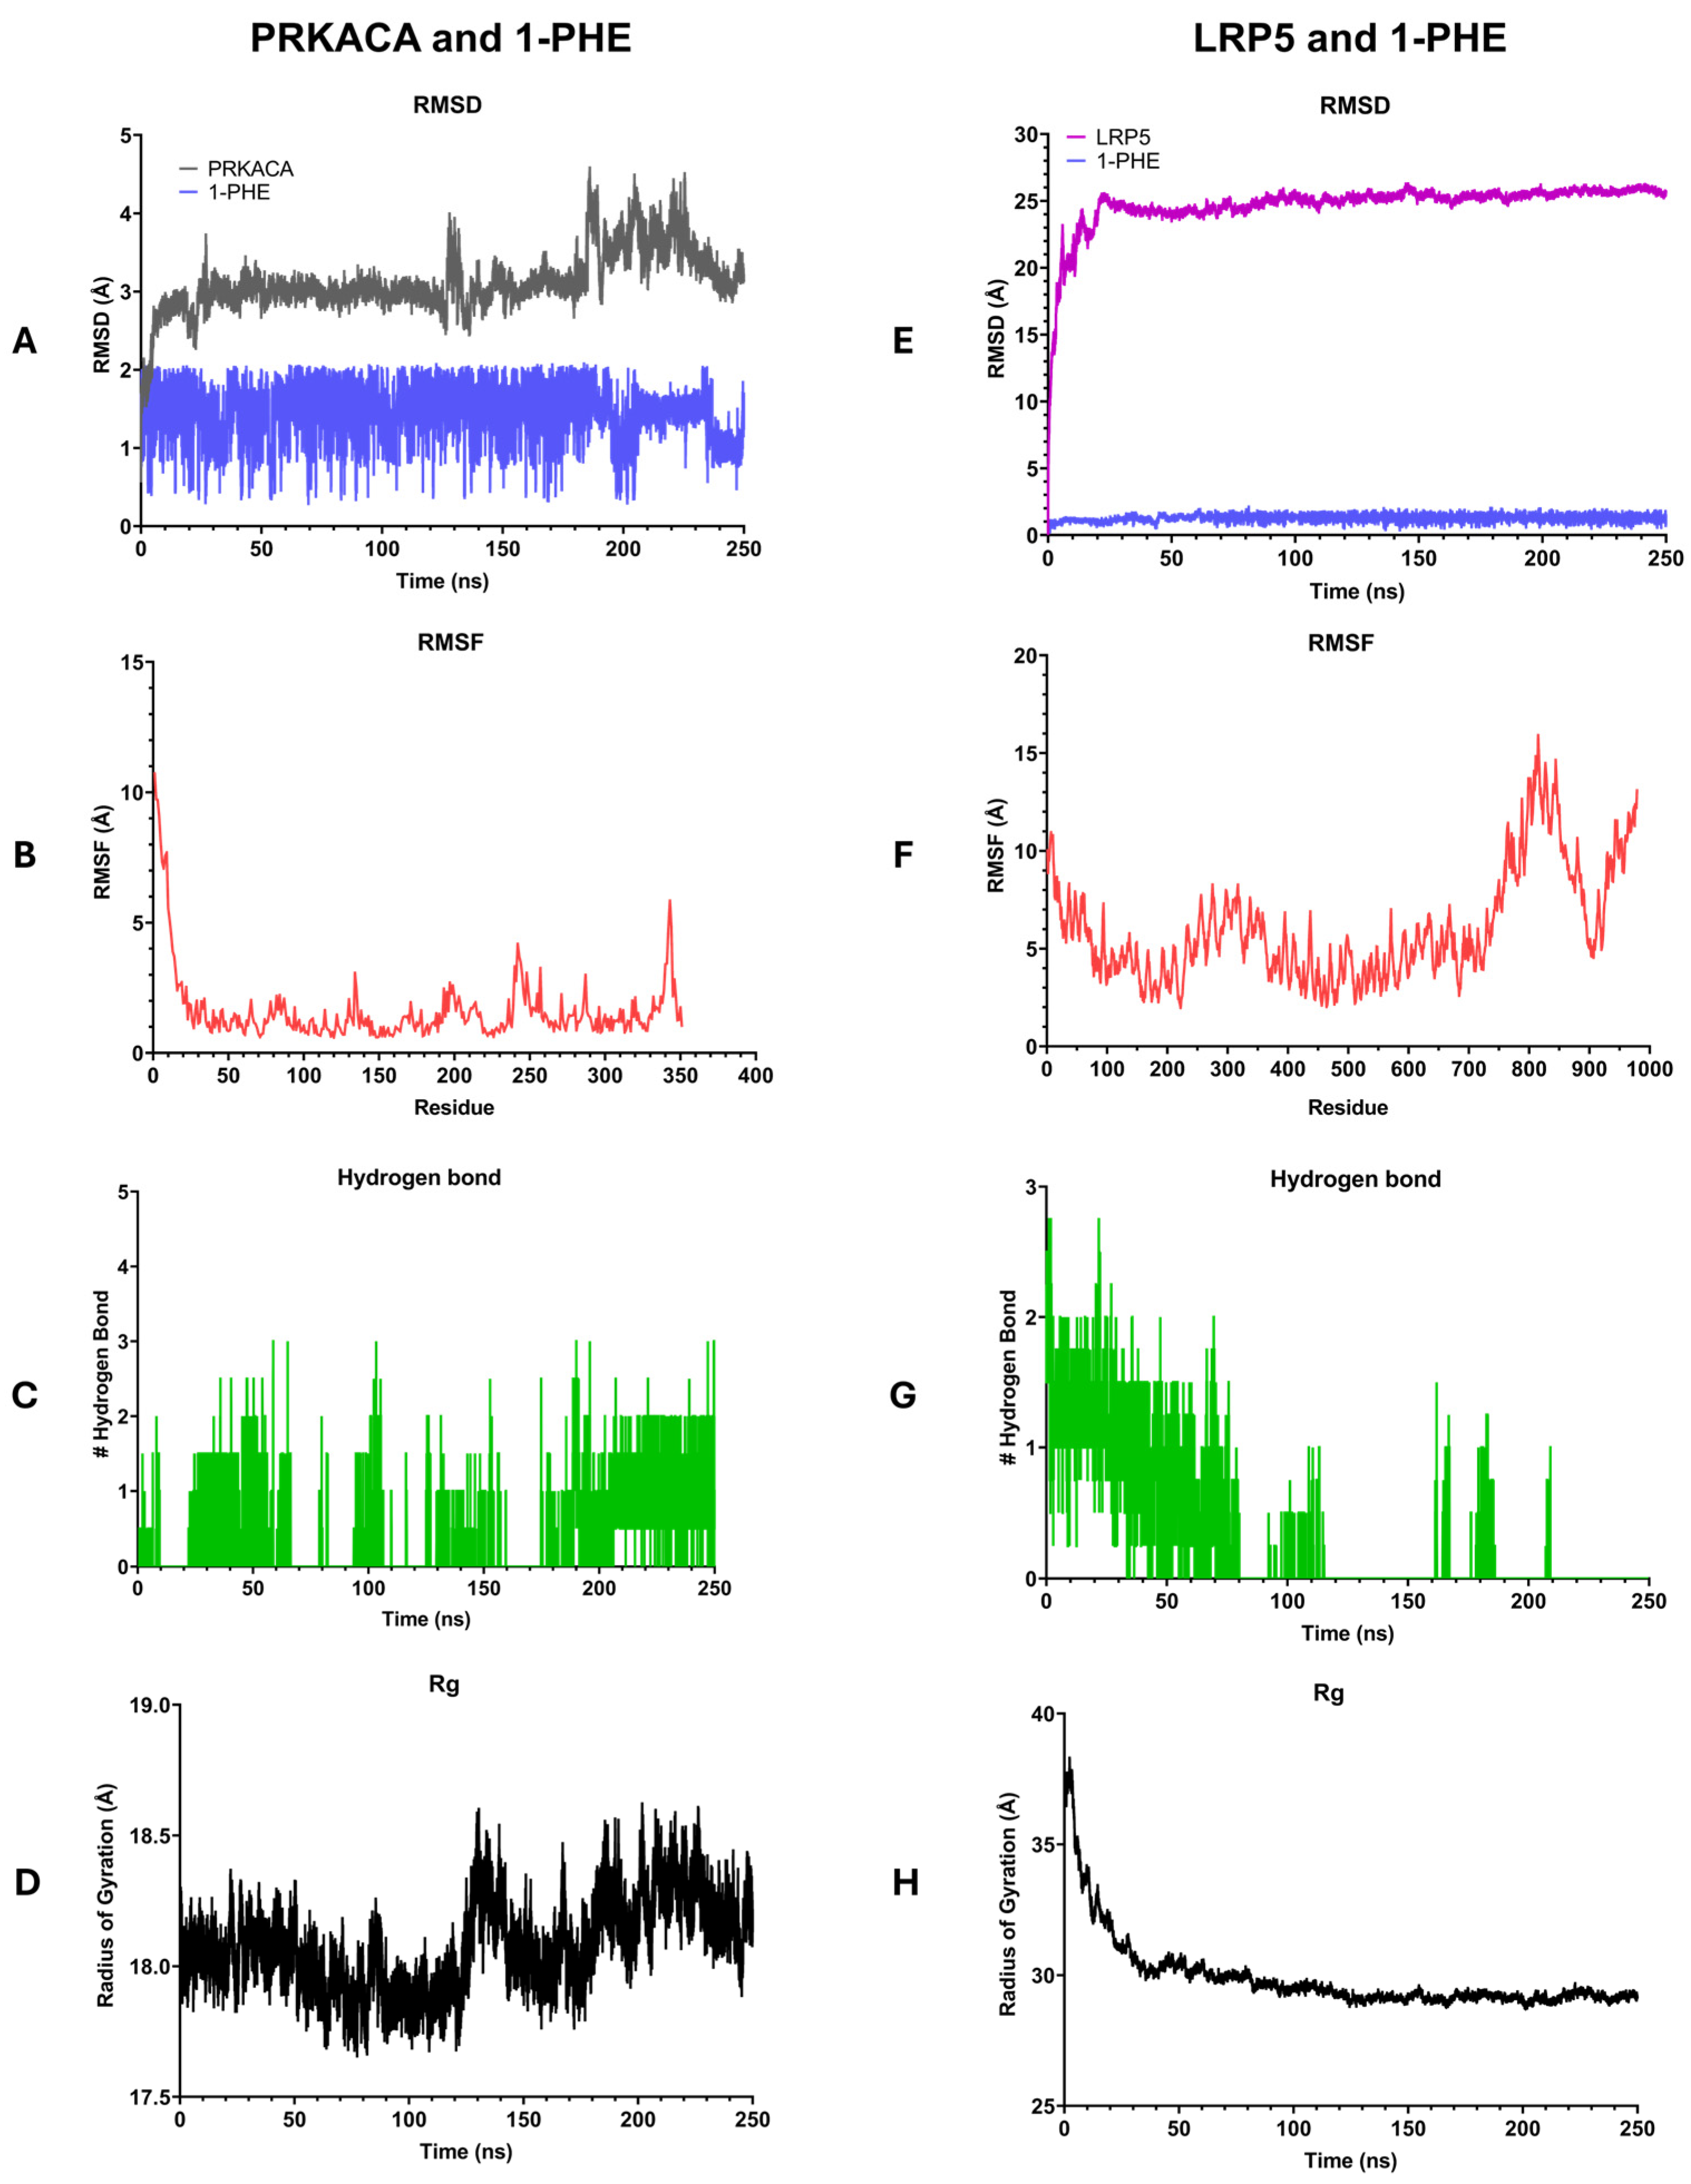
Molecular dynamics simulations were conducted to investigate the interactions between 1-PHE and two target proteins, PRKACA and LRP5, as depicted in Figure 6. During 250 ns, the 1-PHE bound stably within the binding site of both proteins. The stability of the formed complexes was assessed by calculating the root mean square deviation (RMSD). The PRKACA-1-PHE complex exhibited a stable RMSD of 2–5 Å over the 250 ns simulation (Figure 6A), indicative of a robust complex formation. In contrast, the LRP5-1-PHE complex demonstrated initial fluctuations in RMSD before stabilizing (Figure 6E). After 30 ns, both protein–ligand complexes reached equilibrium as indicated by the RMSD of protein less than 2 Å. To evaluate the flexibility of the complexes, root mean square fluctuations (RMSFs) were computed. The PRKACA-1-PHE complex displayed lower RMSF values compared to the LRP5-1-PHE complex (Figure 6B,F), suggesting greater rigidity in the former. Hydrogen bond analysis revealed a higher number of hydrogen bonds in the PRKACA-1-PHE complex (Figure 6C) compared to the LRP5-1-PHE complex (Figure 6G), further supporting the notion of a more stable interaction. The radius of gyration (Rg) was employed to assess the compactness of the complexes. The PRKACA-1-PHE complex maintained a stable Rg of 18.5 Å throughout the simulation (Figure 6D), signifying a compact structure. Conversely, the LRP5-1-PHE complex exhibited a higher initial Rg value that gradually decreased over time (Figure 6H), suggesting a more compact conformation. Collectively, the MD simulation results indicate that 1-PHE can form a stable complex with PRKACA and LRP5. However, experimental binding assays are necessary to corroborate these computational findings.
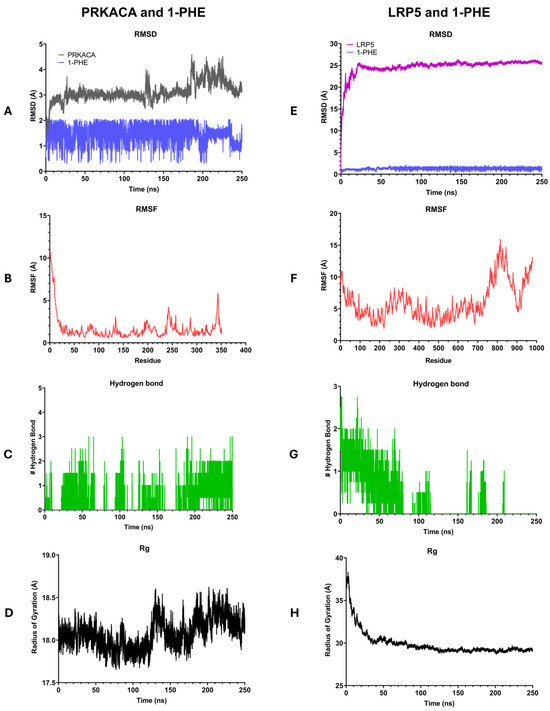
Figure 6.
Illustration of the results of 250-nanosecond molecular dynamics simulations comparing the interactions of 1-PHE with PRKACA (A–D) and LRP5 (E–H). (A,D) present root mean square deviation (RMSD) plots, (B,F) display root mean square fluctuation (RMSF) plots, (C,G) depict numbers of hydrogen bonds, and (D,H) showcase radius of gyration (Rg) plots.
3. Discussion
Hepatic stellate cells (HSCs) are recognized as central mediators of extracellular matrix (ECM) production in hepatic fibrosis. Upon pathological stimuli associated with liver fibrosis, this phenotypic shift is orchestrated by a complex network of growth factors and signaling cascades, including TGF-β/SMAD, PDGF, NF-κB, and Wnt/β-catenin [1,3,4,7,33]. Of these, the TGF-β/SMAD pathway stands as the most extensively investigated, with TGF-β1 binding to its cognate receptor (TGF-β receptor 1), initiating a cascade of downstream effectors [34,35]. The activation of the TGF-β/SMAD signaling pathway in HSCs resulted in the upregulation of several key genes associated with hepatic fibrosis, including TIMP1, SMAD2, SMAD3, COL1A1, and MMP2, as well as increased secretion of MMP-9 protein (Figure 2). Treatment with the crude extract of MO mitigated the expression of these fibrosis-associated markers at both the mRNA and protein levels. This suggests that MO extract may inhibit HSC activation by interfering with the TGF-β/SMAD signaling cascade, particularly targeting the production of SMAD2 and SMAD3 transcription factors. In contrast, treatment with 1-PHE significantly reduced the mRNA expression of TIMP1 and MMP2, along with MMP-9 secretion, indicating that 1-PHE may operate through an alternative signaling pathway involved in the production of MMPs, distinct from the TGF-β/SMAD pathway.
Proteomic analysis of 1-PHE-treated, activated LX-2 cells demonstrated alterations in multiple signaling cascades. Notably, proteins integral to the Wnt/β-catenin pathway exhibited downregulation, including low-density-lipoprotein-receptor-related protein 5 (LRP5) and protein kinase cAMP-activated catalytic subunit alpha (PRKACA). Several studies have suggested that the Wnt/β-catenin pathway is implicated in HSC activation [29,30,31,32,33]. Activation of this pathway commences with β-catenin binding to its receptor, LRP5/6, triggering the integrin-adhesion complex (IAC) pathway through integrin-mediated sensing of mechanical cues. The observed decrease in LRP5 protein expression following 1-PHE treatment raises the possibility an interference with the Wnt/β-catenin signaling cascade. This may occur through 1-PHE suppressing receptor expression. Nevertheless, additional investigations are warranted to validate this concept and clarify the precise mechanism by which 1-PHE disrupts the Wnt/β-catenin signaling cascade during HSC activation.
Molecular docking analysis and molecular dynamics simulations were conducted to explore potential interactions between 1-PHE and the Wnt/β-catenin signaling pathway proteins PRKACA and LRP5. Comparative binding energy analysis using Autodock Vina within the Chimera software platform version 1.18 revealed similar binding affinities between 1-PHE and 3SB at the same binding site on PRKACA (Table 2). These findings suggest that 1-PHE may bind to PRKACA at a site overlapping with that of a known ligand. However, the possibility of alternative binding sites on PRKACA cannot be excluded. For LRP5, in the absence of experimental structural data and a known ligand-binding site, a potential binding site was predicted using BIOVIA Discovery Studio Visualizer software version 21.1.0.20298. The calculated binding score of 1-PHE to LRP5 was comparable to that for PRKACA. Molecular dynamics simulations, as depicted in Figure 6, demonstrated the sustained stability and compact conformation of the 1-PHE complexes with both PRKACA and LRP5 over a 250-nanosecond timescale. Notably, the complex formed with PRKACA exhibited superior stability compared to that with LRP5. Based on these in silico results, we hypothesize that 1-PHE could disrupt β-catenin signaling by interacting with PRKACA and LRP5, ultimately attenuating HSC activation. It is crucial to emphasize that these predictions are based solely on computational modeling and require experimental binding validation to confirm potential target–ligand interactions.
The MMPs are integral to the activation of HSCs during liver fibrosis. MMP-2 and MMP-9 are particularly crucial in the remodeling of the ECM during hepatic fibrogenesis [36,37]. Research indicate that the Wnt/β-catenin pathway is involved in MMP production [38,39,40]. The proteomic analysis and MMP expression data following 1-PHE treatment suggest that the observed decrease in MMP2 mRNA and MMP-9 secretion might be due to interference with the Wnt/β-catenin pathway. This interference may attenuate the TGF-β1-mediated activation of HSCs, potentially offering a therapeutic strategy for mitigating hepatic fibrosis [41].
Our finding is the first to show that 1-PHE may suppress HSC activation induced by TGF-β1, possibly through modulation of the Wnt/β-catenin signaling pathway, given that inhibition of Wnt/β-catenin signaling is a recognized therapeutic strategy for liver fibrosis [29,30]. This study positions 1-PHE as a promising candidate for further investigation in the development of novel anti-fibrotic agents. However, in vivo and clinical studies are essential to validate these findings and to fully elucidate the pharmacological effects and mechanism of action of 1-PHE in the context of liver fibrosis.
4. Materials and Methods
4.1. Chemicals and Reagents
Dulbecco’s modified Eagle’s medium (DMEM), fetal bovine serum (FBS), antibiotic–antimycotic, phosphate-buffered saline (pH 7.4), and trypsin-EDTA (0.25%) were purchased from Gibco (Thermo Fisher Scientific, Waltham, MA, USA). Human recombinant TGF-beta 1 (TGF-β1) was obtained from STEMCELL Technologies (STEMCELL Technologies Canada, Inc., Vancouver, BC, Canada). Dimethyl sulfoxide (DMSO) was purchased from VWR International (VWR Corporate Headquarters, West Chester, PA, USA). Polysorbate 80 (Tween 80) was purchased from BioBasic (BioBasic, Inc., Markham, ON, Canada). Human matrix metalloproteinase 9 (MMP-9) ELISA kit was obtained from Sino Biological (Sino Biological, Inc., Beijing, China). Resazurin sodium salt was purchased from Sigma-Aldrich (MilliporeSigma, Burlington, MA, USA). Trizol reagent and Pierce BCA protein assay kits were obtained from Invitrogen and Thermo Scientific™, respectively (Thermo Fisher Scientific, Waltham, MA, USA). Tetro™ cDNA Synthesis and SensiFAST™ SYBR® No-ROX kits were purchased from Meridian Bioscience (Meridian Diagnostics & Corporate Offices, Cincinnati, OH, USA). Protease-phosphatase inhibitor cocktail was purchased from Cell Signaling Technology (Cell Signaling Technology, Inc., Danvers, MA, USA). RapidGest SF was obtained from Waters™ (Waters Corporation, Milford, MA, USA). Trypsin and Tris(2-carboxyethyl) phosphine (TCEP) were purchased from Promega (Promega Corporation, Madison, WI, USA). Iodoacetamide (IAA) was purchased from GE Healthcare Technologies (GE HealthCare Technologies, Inc., Chicago, IL, USA). LC-MS/MS analysis reagents, including acetonitrile, formic acid, ammonium bicarbonate, acetone, and water were purchased from J.T.Baker (Fisher Scientific, Houston, TX, USA).
4.2. Cell Line and Culture
The immortalized human hepatic stellate cell line, LX-2, was kindly provided by associate professor Dr. Saranyapin Potikanond (Department of Pharmacology, Chiang Mai University, Thailand). The cells were cultured in high-glucose Dulbecco’s modified Eagle’s medium (DMEM) supplemented with 4 mM L-glutamine, 2% fetal bovine serum (FBS), and 1% antibiotic–antimycotic in a 37 °C, 5% CO2 humidified incubator. The subculture of the cells was conducted after approximately 80% confluence of the cells was reached using trypsin-EDTA (0.25%) reagent.
4.3. Preparation of MO Leaf Crude Extract and Active Compound
The protocol of extraction and identification of active compound, 1-phenyl-2-pentanol (1-PHE), from the Moringa oleifera Lam. (MO) leaf was performed as previously describe in [26]. The crude extract from ethyl acetate, which represented the highest activity of inhibiting cancer cell growth, was used to evaluate the anti-liver-fibrosis in this study. 1-phenyl-2-pentanol (Sigma Aldrich, St. Louis, MO, USA), the active compound, was purchased for use in this study. The crude extract and active compound were prepared in dissolving solvent (DMSO:Tween 80) (1:1) to improve the solubility in water. The final residue percentage of the dissolving solvent in the cell culture experiments was less than 0.5% in the highest concentration of both compounds.
4.4. Cytotoxicity Assessment by Resazurin Reduction Assay
The optimal concentrations of crude MO extract and 1-PHE for LX-2 experiments were evaluated by resazurin reduction assay [42]. The LX-2 cells (2 × 10⁴ cells/well) were plated in 96-well cell culture plate. The cells were treated with differential diluted concentrations (0–1000 µg/mL) of crude extract and 1-PHE. Then, the resazurin reagent (at final concentration 25 µg/mL) was added to the cell mixture and incubated in the incubator for 24 h. The fluorescence signal was measured using an EnSpire® microplate reader (Petro Emphor Co. W.L.L., Doha, Qatar) with a 560 nm excitation/590 nm emission filter set. The inhibitory concentration (IC) was calculated using GraphPad Prism version 8.0.1 (GraphPad Software, Boston, MA, USA). The IC10 (concentration inhibiting 10% cell viability) of each compound was used as the maximum concentration for further experiments.
4.5. Real-Time Quantitative Reverse Transcription PCR
The expression of fibrotic marker genes in LX-2 cells, including COL1A1, COL4A1, TIMP1, SMAD2, SMAD3, and MMP2, was measured by real-time qRT-PCR. Briefly, the cells were treated with the mixture of TGF-β1 (10 ng/mL) and crude MO extract or 1-PHE for 24 h. The mRNA in each condition was extracted using Trizol reagent, as described in the manufacturer’s protocol. The total RNA was converted to cDNA using a Tetro™ cDNA Synthesis Kit. The PCR reaction was conducted using a SensiFAST™ SYBR® No-ROX Kit. The thermal cycler settings were composed of polymerase activation (95 °C, 1 min), followed by 45 cycles of denaturation (95 °C, 10 s) and annealing/extension (60 °C, 1 min) on the CFX96 Touch Real-Time PCR Detection System (Bio-Rad Laboratories, Hercules, CA, USA). The oligonucleotide primers used in this study are shown in Table 3 [43].
Table 3.
The oligonucleotide primer pairs used in this study.
4.6. Enzyme-Linked Immunosorbent Assay (ELISA)
To measure the level of MMP-9 secretion, which is one of the key markers in fibrogenesis response of LX-2 cells, the cells culture supernatant from the experiment was collected and the human matrix metalloproteinase 9 ELISA kit was used according to the manufacturer’s protocol. The absorbance of the ELISA reaction was measured at wavelength 450 nm using an EnSpire® microplate reader.
4.7. Sample Preparation for LC-MS/MS Analysis
LX-2 cells treated with 1-PHE for 48 h were harvested. The cells were washed twice with 1X PBS (pH 7.4). Total protein was extracted using lysis buffer (1X RIPA with protease–phosphatase inhibitors) and incubated on ice for 5 min. The lysate was sonicated (5 cycles, 30 s each, with rests on ice) and centrifuged (14,000× g, 4 °C, 10 min). The protein concentration was determined using a Pierce™ BCA protein assay kit following the manufacturer’s instructions. According to the previous sample preparation protocol with minor modifications [44], the protein concentration was achieved using a 3 kDa molecular weight cutoff filter, followed by precipitation with ice-cold acetone (1:5 v/v). The pellet was resuspended in 0.3% RapidGest SF/2.5 mM ammonium bicarbonate. A 30 µg aliquot of protein underwent tryptic digestion. Disulfide bonds were reduced (1 mM tris(2-carboxyethyl) phosphine, TCEP, 37 °C, 2 h) and alkylated (5 mM iodoacetamide, IAA, room temperature, 50 min, protected from light). The sample was desalted (Zeba Spin Column) (Thermo Fisher Scientific, Waltham, MA, USA) prior to a second trypsin digestion (1:40 enzyme–protein ratio, 37 °C, 6 h). After drying, the digested peptides were resuspended in 0.1% formic acid for LC-MS/MS analysis.
4.8. LC-MS/MS Setting and Data Processing for Proteomic Analysis
Samples were analyzed via liquid chromatography–tandem mass spectrometry (LC-MS/MS) (HF-X hybrid Quadrupole-Orbitrap, EASY-nLC1000 system, nano C18 column) (Thermo Fisher Scientific, Waltham, MA, USA) operating in positive ionization mode. Chromatographic separation employed a 3–60% gradient of 90% acetonitrile/0.1% formic acid over 135 min (300 nL/min), using 0.1% formic acid in water as mobile phase A. Column regeneration and re-equilibration steps were performed. Data-dependent acquisition (TopN15) was carried out with higher-energy collisional dissociation (29 eV)-guided peptide analysis. MS parameters and database search (UniProt Homo sapiens, 14 January 2023) were implemented in Proteome Discoverer™ 2.4 software (Thermo Fisher Scientific, Waltham, MA, USA). Peptide/protein tolerances, modifications, and a 1% FDR were applied. Data were normalized (total intensity count) and subjected to pathway analysis via PADOG in Reactome v84 (Homo sapiens, 25 February 2023) [45].
4.9. Bioinformatic Analysis of Proteomic Data
We used several bioinformatic tools to further investigate the differentially expressed proteins (DEPs) identified using Proteome Discoverer™ 2.4 software. DEPs in the treatment group were filtered based on a log2 fold change threshold (≤−1.5 and ≥1.5) and an adjusted p-value of <0.05. Visualization of DEPs was achieved through a volcano plot generated using VolcaNoseR2 [46] https://huygens.science.uva.nl/VolcaNoseR2/ (accessed on 10 February 2024). Cytoscape software version 3.10.1 [47] with the aid of stringApp application version 2.0.3 [48] was employed to analyze and visualize the protein–protein interaction network within the DEPs. Enrichr web server [49,50,51] https://maayanlab.cloud/Enrichr/ (accessed on 10 February 2024). provided Gene Ontology (GO) annotations, classifying DEPs by biological process, cellular component, and molecular function. The Kyoto Encyclopedia of Genes and Genomes (KEGG) database [52,53,54] was used to map DEPs onto signaling pathways, facilitating pathway enrichment analysis.
4.10. Molecular Docking Analysis
The crystal structures of candidate proteins identified from the proteomics, including low-density-lipoprotein-receptor-related protein 5 (LRP5) and the catalytic subunit alpha of cAMP-dependent protein kinase (PRKACA), were retrieved from public databases (LRP5-AlphaFold protein structure database [55,56], PRKACA-RCSB PDB database (PDB ID: 3OXT) [57,58]). Chemical structures of 1-PHE (CID: 8842) and the known binding ligand of PRKACA, 3SB ((2s)-2-amino-N’-[(1e)-(2,4-dihydroxy-6-methylphenyl)methylidene]-2-phenylethanehydrazide; CID: 137348168), were obtained from PubChem [27]. Standard preparation procedures were applied to both the target proteins and ligands using the Dock Prep tool [59] within UCSF Chimera alpha version 1.18 [60]. This involved removing non-standard residues and water molecules, assigning charges, and modifying incomplete amino acid side chains. Docking simulations were then performed using AutoDock Vina software version 1.2.3 [61,62]. BIOVIA Discovery Studio Visualizer version 21.1.0.20298 was employed to analyze 2D and 3D interactions between target proteins and the compound.
4.11. Molecular Dynamics (MD) Simulation
Molecular dynamics (MD) simulations of 1-PHE in complex with LRP5 and PRKACA proteins were executed using the GROMACS 2022.4 software package [63] on GPU accelerators. The simulation protocol employed in this study was adapted from a previously published method [64] with minor adjustments. The protein topology was prepared using the gmx_pdb2gmx module and was parameterized using the AMBER ff99SB force field. The ligand structure was parameterized using the general AMBER force field (GAFF). The charge of 1-PHE was calculated using the AM1-BCC method using the acpype package. The protein–ligand complexes were solvated in a TIP3P water box with a 12 Å buffer distance using the tleap utility. The system was neutralized with Na+ and Cl− ions to a concentration of 0.15 M. The system was initially energy minimized using the steepest descent algorithm to a tolerance of 10 kJ/mol/nm. Equilibration was conducted in two stages: a constant number of particles, volume, and temperature (NVT), followed by a constant number of particles, pressure, and temperature (NPT), ensembles for 1000 ps each. Production simulations were run for 250 ns at 310 K and 1 bar, with coordinates saved every 10 ps. The MD trajectories were analyzed using GROMACS tools. The dynamics of the system was monitored using by the root mean square deviation (RMSD) and root mean square fluctuation (RMSF) using the gmx_rms and gmx_rmsf utilities, respectively. Hydrogen bond analysis was conducted with gmx_hbond and visual molecular dynamics (VMD) [65], with the following criteria: distance between donor and acceptor ≤3.5 Å and an angle cutoff value of 20°. The GROMOS method was performed for clustering analysis of the protein backbone, with a cutoff of 1.5 Å.
4.12. Statistical Analysis
To analyze differences in means across groups, a one-way analysis of variance (ANOVA) was employed followed by Tukey’s post hoc test for multiple comparisons in GraphPad Prism software version 8.0.1 (GraphPad Software, Boston, MA, USA). Results were reported as mean ± standard deviation (SD), with statistical significance determined at a p-value threshold < 0.05.
5. Conclusions
These findings indicate that 1-PHE may attenuate HSC activation induced by TGF-β1 via multiple mechanisms. This is evidenced by the observed suppression of established hepatic fibrosis markers, including type I and IV collagen, TIMP-1, and MMPs (MMP-2 and MMP-9). One potential mechanism involves the inhibition of the TGF-β/SMAD pathway, as demonstrated by a decrease in SMAD2/3 transcription factor levels. Additionally, modulation of the Wnt/β-catenin signaling pathway is implicated, supported by downregulation of the LPR5 receptor and protein kinase cAMP-activated catalytic subunit alpha. In this study, the possible anti-fibrotic properties of 1-PHE are first demonstrated. To completely comprehend the effects of this substance in the context of the intricacies of liver fibrosis, experimental binding validation and in vivo investigations are necessary.
Author Contributions
Conceptualization, K.U. and W.B.; methodology, W.B.; formal analysis, W.B., S.K., Y.Y., N.K. and P.S.; investigation, W.B.; resources, P.P. and K.D.; data curation, K.U. and Y.T.; writing—original draft preparation, W.B.; writing—review and editing, W.B., A.F., C.L. and K.U.; visualization, K.U. and W.B.; supervision, K.U.; funding acquisition, K.U. All authors have read and agreed to the published version of the manuscript.
Funding
This work was supported by Thailand Science Research and Innovation and Naresuan University (R2567B041) and the APC was funded by Reinventing University Program 2023, the Ministry of Higher Education, Science, Research and Innovation (MHESI), Thailand (R2566A053).
Institutional Review Board Statement
The study was conducted in accordance with the Declaration of Helsinki and approved by the Institutional Review Board of Naresuan University (IRB No. P1-0133/2565, approved on 21 October 2022).
Informed Consent Statement
Not applicable.
Data Availability Statement
The original data presented in the study are openly available in ProteomeXchange Consortium via the PRIDE partner repository at http://www.ebi.ac.uk/pride/archive/PXD052809 (accessed on 4 June 2024). The following username and password can be used to access the dataset by logging in to the PRIDE website: Username: reviewer_pxd052809@ebi.ac.uk. Password: WQ6fuT3osQOJ.
Acknowledgments
The authors gratefully acknowledge Saranyapin Potikanond (Department of Pharmacology, Faculty of Medicine, Chiang Mai University) for the generous contribution of the LX-2 cells used in this research. We also would like to thank the Franco-Thai Cooperation Programme in Higher Education and Research (Franco-Thai Mobility Programme/PHC SIAM) 2024–2025 for partial support.
Conflicts of Interest
The authors declare no conflicts of interest.
References
- Parola, M.; Pinzani, M. Liver fibrosis: Pathophysiology, pathogenetic targets and clinical issues. Mol. Asp. Med. 2019, 65, 37–55. [Google Scholar] [CrossRef] [PubMed]
- Roehlen, N.; Crouchet, E.; Baumert, T.F. Liver Fibrosis: Mechanistic Concepts and Therapeutic Perspectives. Cells 2020, 9, 875. [Google Scholar] [CrossRef] [PubMed]
- Tsuchida, T.; Friedman, S.L. Mechanisms of hepatic stellate cell activation. Nat. Rev. Gastroenterol. Hepatol. 2017, 14, 397–411. [Google Scholar] [CrossRef] [PubMed]
- Sato, M.; Suzuki, S.; Senoo, H. Hepatic Stellate Cells: Unique Characteristics in Cell Biology and Phenotype. Cell Struct. Funct. 2003, 28, 105–112. [Google Scholar] [CrossRef] [PubMed]
- Tan, Z.; Sun, H.; Xue, T.; Gan, C.; Liu, H.; Xie, Y.; Yao, Y.; Ye, T. Liver Fibrosis: Therapeutic Targets and Advances in Drug Therapy. Front. Cell Dev. Biol. 2021, 9, 730176. [Google Scholar] [CrossRef] [PubMed]
- Acharya, P.; Chouhan, K.; Weiskirchen, S.; Weiskirchen, R. Cellular Mechanisms of Liver Fibrosis. Front. Pharmacol. 2021, 12, 671640. [Google Scholar] [CrossRef] [PubMed]
- Liedtke, C.; Nevzorova, Y.A.; Luedde, T.; Zimmermann, H.; Kroy, D.; Strnad, P.; Berres, M.-L.; Bernhagen, J.; Tacke, F.; Nattermann, J.; et al. Liver Fibrosis—From Mechanisms of Injury to Modulation of Disease. Front. Med. 2022, 8, 814496. [Google Scholar] [CrossRef]
- Pellicoro, A.; Ramachandran, P.; Iredale, J.P.; Fallowfield, J.A. Liver fibrosis and repair: Immune regulation of wound healing in a solid organ. Nat. Rev. Immunol. 2014, 14, 181–194. [Google Scholar] [CrossRef]
- Pan, X.; Ma, X.; Jiang, Y.; Wen, J.; Yang, L.; Chen, D.; Cao, X.; Peng, C. A Comprehensive Review of Natural Products against Liver Fibrosis: Flavonoids, Quinones, Lignans, Phenols, and Acids. Evid. Based Complement. Alternat. Med. 2020, 2020, 7171498. [Google Scholar] [CrossRef]
- El-Tantawy, W.H.; Temraz, A. Anti-fibrotic activity of natural products, herbal extracts and nutritional components for prevention of liver fibrosis: Review. Arch. Physiol. Biochem. 2022, 128, 382–393. [Google Scholar] [CrossRef]
- Ma, X.; Jiang, Y.; Wen, J.; Zhao, Y.; Zeng, J.; Guo, Y. A comprehensive review of natural products to fight liver fibrosis: Alkaloids, terpenoids, glycosides, coumarins and other compounds. Eur. J. Pharmacol. 2020, 888, 173578. [Google Scholar] [CrossRef] [PubMed]
- Shan, L.; Liu, Z.; Ci, L.; Shuai, C.; Lv, X.; Li, J. Research progress on the anti-hepatic fibrosis action and mechanism of natural products. Int. Immunopharmacol. 2019, 75, 105765. [Google Scholar] [CrossRef] [PubMed]
- Chen, S.-R.; Chen, X.-P.; Lu, J.-J.; Wang, Y.; Wang, Y.-T. Potent natural products and herbal medicines for treating liver fibrosis. Chin. Med. 2015, 10, 7. [Google Scholar] [CrossRef] [PubMed]
- Su, X.; Lu, G.; Ye, L.; Shi, R.; Zhu, M.; Yu, X.; Li, Z.; Jia, X.; Feng, L. Moringa oleifera Lam.: A comprehensive review on active components, health benefits and application. RSC Adv. 2023, 13, 24353–24384. [Google Scholar] [CrossRef] [PubMed]
- Xu, Y.-B.; Chen, G.-L.; Guo, M.-Q. Antioxidant and Anti-Inflammatory Activities of the Crude Extracts of Moringa oleifera from Kenya and Their Correlations with Flavonoids. Antioxidants 2019, 8, 296. [Google Scholar] [CrossRef]
- Chen, G.; Xu, Y.; Wu, J.; Li, N.; Guo, M. Anti-Inflammatory Properties and Potential Bioactive Components from Moringa oleifera Leaves Revealed by Affinity Ultrafiltration LC–MS and Molecular Docking. ACS Food Sci. Technol. 2021, 1, 1953–1962. [Google Scholar] [CrossRef]
- Luetragoon, T.; Pankla Sranujit, R.; Noysang, C.; Thongsri, Y.; Potup, P.; Suphrom, N.; Nuengchamnong, N.; Usuwanthim, K. Bioactive Compounds in Moringa oleifera Lam. Leaves Inhibit the Pro-Inflammatory Mediators in Lipopolysaccharide-Induced Human Monocyte-Derived Macrophages. Molecules 2020, 25, 191. [Google Scholar] [CrossRef]
- Bhadresha, K.; Thakore, V.; Brahmbhatt, J.; Upadhyay, V.; Jain, N.; Rawal, R. Anticancer effect of Moringa oleifera leaves extract against lung cancer cell line via induction of apoptosis. Adv. Cancer Biol. Metastasis 2022, 6, 100072. [Google Scholar] [CrossRef]
- Al-Asmari, A.K.; Albalawi, S.M.; Athar, M.T.; Khan, A.Q.; Al-Shahrani, H.; Islam, M. Moringa oleifera as an Anti-Cancer Agent against Breast and Colorectal Cancer Cell Lines. PLoS ONE 2015, 10, 135814. [Google Scholar] [CrossRef]
- Luetragoon, T.; Pankla Sranujit, R.; Noysang, C.; Thongsri, Y.; Potup, P.; Suphrom, N.; Nuengchamnong, N.; Usuwanthim, K. Anti-Cancer Effect of 3-Hydroxy-β-Ionone Identified from Moringa oleifera Lam. Leaf on Human Squamous Cell Carcinoma 15 Cell Line. Molecules 2020, 25, 3563. [Google Scholar] [CrossRef]
- van den Berg, J.; Kuipers, S. The antibacterial action of Moringa oleifera: A systematic review. S. Afr. J. Bot. 2022, 151, 224–233. [Google Scholar] [CrossRef]
- Segwatibe, M.K.; Cosa, S.; Bassey, K. Antioxidant and Antimicrobial Evaluations of Moringa oleifera Lam Leaves Extract and Isolated Compounds. Molecules 2023, 28, 899. [Google Scholar] [CrossRef] [PubMed]
- Enerijiofi, K.E.; Akapo, F.H.; Erhabor, J.O. GC–MS analysis and antibacterial activities of Moringa oleifera leaf extracts on selected clinical bacterial isolates. Bull. Natl. Res. Cent. 2021, 45, 179. [Google Scholar] [CrossRef]
- Wilujeng, L.K.; Safitri, F.N.; Supriono, S.; Kalim, H.; Poeranto, S. The effect of Moringa oleifera (Lam) leaves ethanol extracts as anti-inflammatory and anti-fibrotic through TNF-α and p38-MAPK expression: In vivo model of liver fibrosis approach. AIP Conf. Proc. 2021, 2353, 30046. [Google Scholar]
- Hamza, A.A. Ameliorative effects of Moringa oleifera Lam seed extract on liver fibrosis in rats. Food Chem. Toxicol. 2010, 48, 345–355. [Google Scholar] [CrossRef] [PubMed]
- Wisitpongpun, P.; Suphrom, N.; Potup, P.; Nuengchamnong, N.; Calder, P.C.; Usuwanthim, K. In Vitro Bioassay-Guided Identification of Anticancer Properties from Moringa oleifera Lam. Leaf against the MDA-MB-231 Cell Line. Pharmaceuticals 2020, 13, 464. [Google Scholar] [CrossRef] [PubMed]
- Kim, S.; Chen, J.; Cheng, T.; Gindulyte, A.; He, J.; He, S.; Li, Q.; Shoemaker, B.A.; Thiessen, P.A.; Yu, B.; et al. PubChem 2023 update. Nucleic Acids Res. 2023, 51, 1373–1380. [Google Scholar] [CrossRef] [PubMed]
- QuickCalcs, G. EC Anything Calculator. Available online: https://www.graphpad.com/quickcalcs/Ecanything1/ (accessed on 17 February 2023).
- Duspara, K.; Bojanic, K.; Pejic, J.I.; Kuna, L.; Kolaric, T.O.; Nincevic, V.; Smolic, R.; Vcev, A.; Glasnovic, M.; Curcic, I.B.; et al. Targeting the Wnt Signaling Pathway in Liver Fibrosis for Drug Options: An Update. J. Clin. Transl. Hepatol. 2021, 9, 960–971. [Google Scholar] [CrossRef]
- Nishikawa, K.; Osawa, Y.; Kimura, K. Wnt/β-Catenin Signaling as a Potential Target for the Treatment of Liver Cirrhosis Using Antifibrotic Drugs. Int. J. Mol. Sci. 2018, 19, 3103. [Google Scholar] [CrossRef]
- Miao, C.-g.; Yang, Y.-y.; He, X.; Huang, C.; Huang, Y.; Zhang, L.; Lv, X.-W.; Jin, Y.; Li, J. Wnt signaling in liver fibrosis: Progress, challenges and potential directions. Biochimie 2013, 95, 2326–2335. [Google Scholar] [CrossRef]
- El-Ashmawy, N.E.; Al-Ashmawy, G.M.; Fakher, H.E.; Khedr, N.F. The role of WNT/β-catenin signaling pathway and glutamine metabolism in the pathogenesis of CCl4-induced liver fibrosis: Repositioning of niclosamide and concerns about lithium. Cytokine 2020, 136, 155250. [Google Scholar] [CrossRef] [PubMed]
- Zhao, Y.-Q.; Deng, X.-W.; Xu, G.-Q.; Lin, J.; Lu, H.-Z.; Chen, J. Mechanical homeostasis imbalance in hepatic stellate cells activation and hepatic fibrosis. Front. Mol. Biosci. 2023, 10, 1183808. [Google Scholar] [CrossRef] [PubMed]
- Fabregat, I.; Caballero-Díaz, D. Transforming Growth Factor-β-Induced Cell Plasticity in Liver Fibrosis and Hepatocarcinogenesis. Front. Oncol. 2018, 8, 357. [Google Scholar] [CrossRef] [PubMed]
- Xu, F.; Liu, C.; Zhou, D.; Zhang, L. TGF-β/SMAD Pathway and Its Regulation in Hepatic Fibrosis. J. Histochem. Cytochem. 2016, 64, 157–167. [Google Scholar] [CrossRef] [PubMed]
- Naim, A.; Pan, Q.; MS, B. Matrix Metalloproteinases (MMPs) in Liver Diseases. J. Clin. Exp. Hepatol. 2017, 7, 367–372. [Google Scholar] [CrossRef] [PubMed]
- Roeb, E. Matrix metalloproteinases and liver fibrosis (translational aspects). Matrix Biol. 2018, 68, 463–473. [Google Scholar] [CrossRef] [PubMed]
- Liu, X.; Zhang, Z.; Pan, S.; Shang, S.; Li, C. Interaction between the Wnt/β-catenin signaling pathway and the EMMPRIN/MMP-2, 9 route in periodontitis. J. Periodontal Res. 2018, 53, 842–852. [Google Scholar] [CrossRef] [PubMed]
- Wu, B.; Crampton, S.P.; Hughes, C.C.W. Wnt Signaling Induces Matrix Metalloproteinase Expression and Regulates T Cell Transmigration. Immunity 2007, 26, 227–239. [Google Scholar] [CrossRef] [PubMed]
- Ingraham, C.A.; Park, G.C.; Makarenkova, H.P.; Crossin, K.L. Matrix Metalloproteinase (MMP)-9 Induced by Wnt Signaling Increases the Proliferation and Migration of Embryonic Neural Stem Cells at Low O2 Levels. J. Biol. Chem. 2011, 286, 17649–17657. [Google Scholar] [CrossRef]
- Geervliet, E.; Bansal, R. Matrix Metalloproteinases as Potential Biomarkers and Therapeutic Targets in Liver Diseases. Cells 2020, 9, 1212. [Google Scholar] [CrossRef]
- Riss, T.L.; Moravec, R.A.; Niles, A.L.; Duellman, S.; Benink, H.A.; Worzella, T.J.; Minor, L. Cell Viability Assays. Available online: https://www.ncbi.nlm.nih.gov/books/NBK144065/ (accessed on 11 February 2023).
- Robert, S.; Gicquel, T.; Bodin, A.; Lagente, V.; Boichot, E. Characterization of the MMP/TIMP Imbalance and Collagen Production Induced by IL-1β or TNF-α Release from Human Hepatic Stellate Cells. PLoS ONE 2016, 11, 153118. [Google Scholar] [CrossRef] [PubMed]
- Krobthong, S.; Yingchutrakul, Y.; Samutrtai, P.; Hitakarun, A.; Siripattanapipong, S.; Leelayoova, S.; Mungthin, M.; Choowongkomon, K. Utilizing Quantitative Proteomics to Identify Species-Specific Protein Therapeutic Targets for the Treatment of Leishmaniasis. ACS Omega 2022, 7, 12580–12588. [Google Scholar] [CrossRef] [PubMed]
- Griss, J.; Viteri, G.; Sidiropoulos, K.; Nguyen, V.; Fabregat, A.; Hermjakob, H. ReactomeGSA—Efficient Multi-Omics Comparative Pathway Analysis. Mol. Cell. Proteom. 2020, 19, 2115–2125. [Google Scholar] [CrossRef] [PubMed]
- Goedhart, J.; Luijsterburg, M.S. VolcaNoseR is a web app for creating, exploring, labeling and sharing volcano plots. Sci. Rep. 2020, 10, 20560. [Google Scholar] [CrossRef]
- Shannon, P.; Markiel, A.; Ozier, O.; Baliga, N.S.; Wang, J.T.; Ramage, D.; Amin, N.; Schwikowski, B.; Ideker, T. Cytoscape: A Software Environment for Integrated Models of Biomolecular Interaction Networks. Genome Res. 2003, 13, 2498–2504. [Google Scholar] [CrossRef] [PubMed]
- Doncheva, N.T.; Morris, J.H.; Gorodkin, J.; Jensen, L.J. Cytoscape StringApp: Network Analysis and Visualization of Proteomics Data. J. Proteome Res. 2019, 18, 623–632. [Google Scholar] [CrossRef]
- Chen, E.Y.; Tan, C.M.; Kou, Y.; Duan, Q.; Wang, Z.; Meirelles, G.V.; Clark, N.R.; Ma’ayan, A. Enrichr: Interactive and collaborative HTML5 gene list enrichment analysis tool. BMC Bioinform. 2013, 14, 128. [Google Scholar] [CrossRef]
- Kuleshov, M.V.; Jones, M.R.; Rouillard, A.D.; Fernandez, N.F.; Duan, Q.; Wang, Z.; Koplev, S.; Jenkins, S.L.; Jagodnik, K.M.; Lachmann, A.; et al. Enrichr: A comprehensive gene set enrichment analysis web server 2016 update. Nucleic Acids Res. 2016, 44, 90–97. [Google Scholar] [CrossRef]
- Xie, Z.; Bailey, A.; Kuleshov, M.V.; Clarke, D.J.B.; Evangelista, J.E.; Jenkins, S.L.; Lachmann, A.; Wojciechowicz, M.L.; Kropiwnicki, E.; Jagodnik, K.M.; et al. Gene Set Knowledge Discovery with Enrichr. Curr. Protoc. 2021, 1, 90. [Google Scholar] [CrossRef]
- Kanehisa, M.; Goto, S. KEGG: Kyoto Encyclopedia of Genes and Genomes. Nucleic Acids Res. 2000, 28, 27–30. [Google Scholar] [CrossRef]
- Kanehisa, M. Toward understanding the origin and evolution of cellular organisms. Protein Sci. 2019, 28, 1947–1951. [Google Scholar] [CrossRef] [PubMed]
- Kanehisa, M.; Furumichi, M.; Sato, Y.; Kawashima, M.; Ishiguro-Watanabe, M. KEGG for taxonomy-based analysis of pathways and genomes. Nucleic Acids Res. 2023, 51, 587–592. [Google Scholar] [CrossRef] [PubMed]
- Jumper, J.; Evans, R.; Pritzel, A.; Green, T.; Figurnov, M.; Ronneberger, O.; Tunyasuvunakool, K.; Bates, R.; Žídek, A.; Potapenko, A.; et al. Highly accurate protein structure prediction with AlphaFold. Nature 2021, 596, 583–589. [Google Scholar] [CrossRef]
- Varadi, M.; Bertoni, D.; Magana, P.; Paramval, U.; Pidruchna, I.; Radhakrishnan, M.; Tsenkov, M.; Nair, S.; Mirdita, M.; Yeo, J.; et al. AlphaFold Protein Structure Database in 2024: Providing structure coverage for over 214 million protein sequences. Nucleic Acids Res. 2024, 52, 368–375. [Google Scholar] [CrossRef]
- Berman, H.M.; Westbrook, J.; Feng, Z.; Gilliland, G.; Bhat, T.N.; Weissig, H.; Shindyalov, I.N.; Bourne, P.E. The Protein Data Bank. Nucleic Acids Res. 2000, 28, 235–242. [Google Scholar] [CrossRef]
- Berman, H.; Henrick, K.; Nakamura, H. Announcing the worldwide Protein Data Bank. Nat. Struct. Mol. Biol. 2003, 10, 980. [Google Scholar] [CrossRef] [PubMed]
- Shapovalov, M.V.; Dunbrack, R.L., Jr. A smoothed backbone-dependent rotamer library for proteins derived from adaptive kernel density estimates and regressions. Structure 2011, 19, 844–858. [Google Scholar] [CrossRef] [PubMed]
- Pettersen, E.F.; Goddard, T.D.; Huang, C.C.; Couch, G.S.; Greenblatt, D.M.; Meng, E.C.; Ferrin, T.E. UCSF Chimera—A visualization system for exploratory research and analysis. J. Comput. Chem. 2004, 25, 1605–1612. [Google Scholar] [CrossRef]
- Eberhardt, J.; Santos-Martins, D.; Tillack, A.F.; Forli, S. AutoDock Vina 1.2.0: New Docking Methods, Expanded Force Field, and Python Bindings. J. Chem. Inf. Model. 2021, 61, 3891–3898. [Google Scholar] [CrossRef]
- Trott, O.; Olson, A.J. AutoDock Vina: Improving the speed and accuracy of docking with a new scoring function, efficient optimization, and multithreading. J. Comput. Chem. 2010, 31, 455–461. [Google Scholar] [CrossRef]
- Abraham, M.J.; Murtola, T.; Schulz, R.; Páll, S.; Smith, J.C.; Hess, B.; Lindahl, E. GROMACS: High performance molecular simulations through multi-level parallelism from laptops to supercomputers. SoftwareX 2015, 1–2, 19–25. [Google Scholar] [CrossRef]
- Khamto, N.; Utama, K.; Boontawee, P.; Janthong, A.; Tatieng, S.; Arthan, S.; Choommongkol, V.; Sangthong, P.; Yenjai, C.; Suree, N.; et al. Inhibitory Activity of Flavonoid Scaffolds on SARS-CoV-2 3CLpro: Insights from the Computational and Experimental Investigations. J. Chem. Inf. Model. 2024, 64, 874–891. [Google Scholar] [CrossRef] [PubMed]
- Humphrey, W.; Dalke, A.; Schulten, K. VMD: Visual molecular dynamics. J. Mol. Graph. 1996, 14, 33–38. [Google Scholar] [CrossRef] [PubMed]


Disclaimer/Publisher’s Note: The statements, opinions and data contained in all publications are solely those of the individual author(s) and contributor(s) and not of MDPI and/or the editor(s). MDPI and/or the editor(s) disclaim responsibility for any injury to people or property resulting from any ideas, methods, instructions or products referred to in the content. |
© 2024 by the authors. Licensee MDPI, Basel, Switzerland. This article is an open access article distributed under the terms and conditions of the Creative Commons Attribution (CC BY) license (https://creativecommons.org/licenses/by/4.0/).