Article

Gene Expression of Neurogenesis Related to Exercise Intensity in a Cerebral Infarction Rat Model

Department of Physical & Rehabilitation Medicine, Chonnam National University Medical School, #160, Baekseo-ro, Dong-gu, Gwangju 61469, Republic of Korea
*
Author to whom correspondence should be addressed.
These authors contributed equally to this work.
Int. J. Mol. Sci. 2024, 25(16), 8997; https://doi.org/10.3390/ijms25168997
Submission received: 30 June 2024 / Revised: 15 August 2024 / Accepted: 17 August 2024 / Published: 19 August 2024
(This article belongs to the Special Issue Neurological Diseases: From Molecular Basis to Therapy)

Abstract

:
Regular exercise improves several functions, including cognition, in patients with stroke. However, the effect of regular exercise on neurogenesis related to cognition remains doubtful. We investigated the most effective exercise intensity for functional recovery after stroke using RNA sequencing following regular treadmill exercise. Photothrombotic cerebral infarction was conducted for 10-week-old male Sprague-Dawley rats (n = 36). A Morris water maze (MWM) test was performed before a regular treadmill exercise program (5 days/week, 4 weeks). Rats were randomly divided into four groups: group A (no exercise); group B (low intensity, maximal velocity 18 m/min); group C (moderate intensity, maximal velocity 24 m/min) and group D (high intensity, maximal velocity 30 m/min). After 4 weeks, another MWM test was performed, and all rats were sacrificed. RNA sequencing was performed with ipsilesional hippocampal tissue. On the day after cerebral infarction, no differences in escape latency and velocity were observed among the groups. At 4 weeks after cerebral infarction, the escape latencies in groups B, C, and D were shorter than in group A. The escape latencies in groups B and C were shorter than in group D. The velocity in groups A, B, and C was faster than in group D. Thirty gene symbols related to neurogenesis were detected (p < 0.05, fold change > 1.0, average normalized read count > four times). In the neurotrophin-signaling pathway, the CHK gene was upregulated, and the NF-κB gene was downregulated in the low-intensity group. The CHK and NF-κB genes were both downregulated in the moderate-intensity group. The Raf and IRAK genes were downregulated in the high-intensity group. Western blot analysis showed that NF-κB expression was lowest in the moderate-intensity group, whereas CHK and Raf were elevated, and IRAK was decreased in the high-intensity group. Moderate-intensity exercise may contribute to neuroplasticity. Variation in the expression of neurotrophins in neurogenesis according to exercise intensity may reveal the mechanism of neuroplasticity. Thus, NF-κB is the key neurotrophin for neurogenesis related to exercise intensity.

1. Introduction

Post-stroke cognitive impairment (PSCI), which occurs in up to 60% of stroke survivors and ranges from mild to severe [1], is associated with several adverse outcomes contributing to a lower quality of life [2]. PSCI may also complicate effective and timely treatment [3].
Regular exercise improves cognitive function in patients with stroke [4]. Activity-regulated structural and functional changes in hippocampal cells may modulate neuroplasticity [5]. Exercise can promote increased levels of neurotrophic factors, change the levels of various cytokines, and alter microglial function in the brains of patients with neurodegenerative diseases [6]. Long-term exercise training in rats may enhance memory by regulating brain-derived neurotrophic factor (BDNF) expression and microglial activation [7,8].
Exercise therapy for neurorehabilitation during functional recovery plays a key role in patients with stroke [9]. However, such patients may have difficulty performing exercise properly because mobility and endurance may be restricted by neurologic deficits. An effective therapeutic exercise program should be precisely prescribed for a favorable outcome following a stroke.
Nonetheless, the effective exercise intensity for neurogenesis related to cognitive function remains unclear. A previous study revealed that swimming exercise of moderate-duration intensity is an effective exercise in a cerebral infarction rat model via neuroplasticity [10]. Several studies of treadmill exercise showed that prolonged low-intensity exercise was more effective than high-intensity exercise [11,12]. Other research revealed that high-intensity exercise may inhibit neurogenesis compared with low- to moderate-intensity exercise [13,14], whereas a systematic review reported that acute high-intensity interval training may enhance executive function in patients with stroke [15]. One recent study reported that varying intensities of treadmill exercise improved working memory in rats [16]. Thus, the optimal treadmill exercise protocol for neurogenesis related to cognitive function remains uncertain.
The aim of the present study was to determine the therapeutic exercise intensity that most effectively promotes cognitive functional recovery in stroke using RNA sequencing following regular treadmill exercise.

2. Results

2.1. Morris Water Maze Test of Neurobehavioral Function

The escape latency on the first day after cerebral infarction was 100.97 ± 36.28 s in group A, 97.67 ± 33.34 s in group B, 115.51 ± 28.23 s in group C, and 115.04 ± 77.44 s in group D. There was no significant difference among groups (p = 0.798). After 4 weeks, the escape latencies were 189.90 ± 74.57, 96.89 ± 64.87, 73.51 ± 29.49, and 134.39 ± 47.19 s in groups A–D, respectively. The follow-up escape latencies in groups B, C, and D were significantly shorter than those in group A, and latencies in groups B and C were shorter than those in group D (p = 0.001). Repeated-measures analysis of variance (ANOVA) with the Duncan post hoc test showed a significant time × group interaction effect (F = 5.851, p = 0.003). However, no significant effect was shown for time (F = 2.097, p = 0.157) (Figure 1).
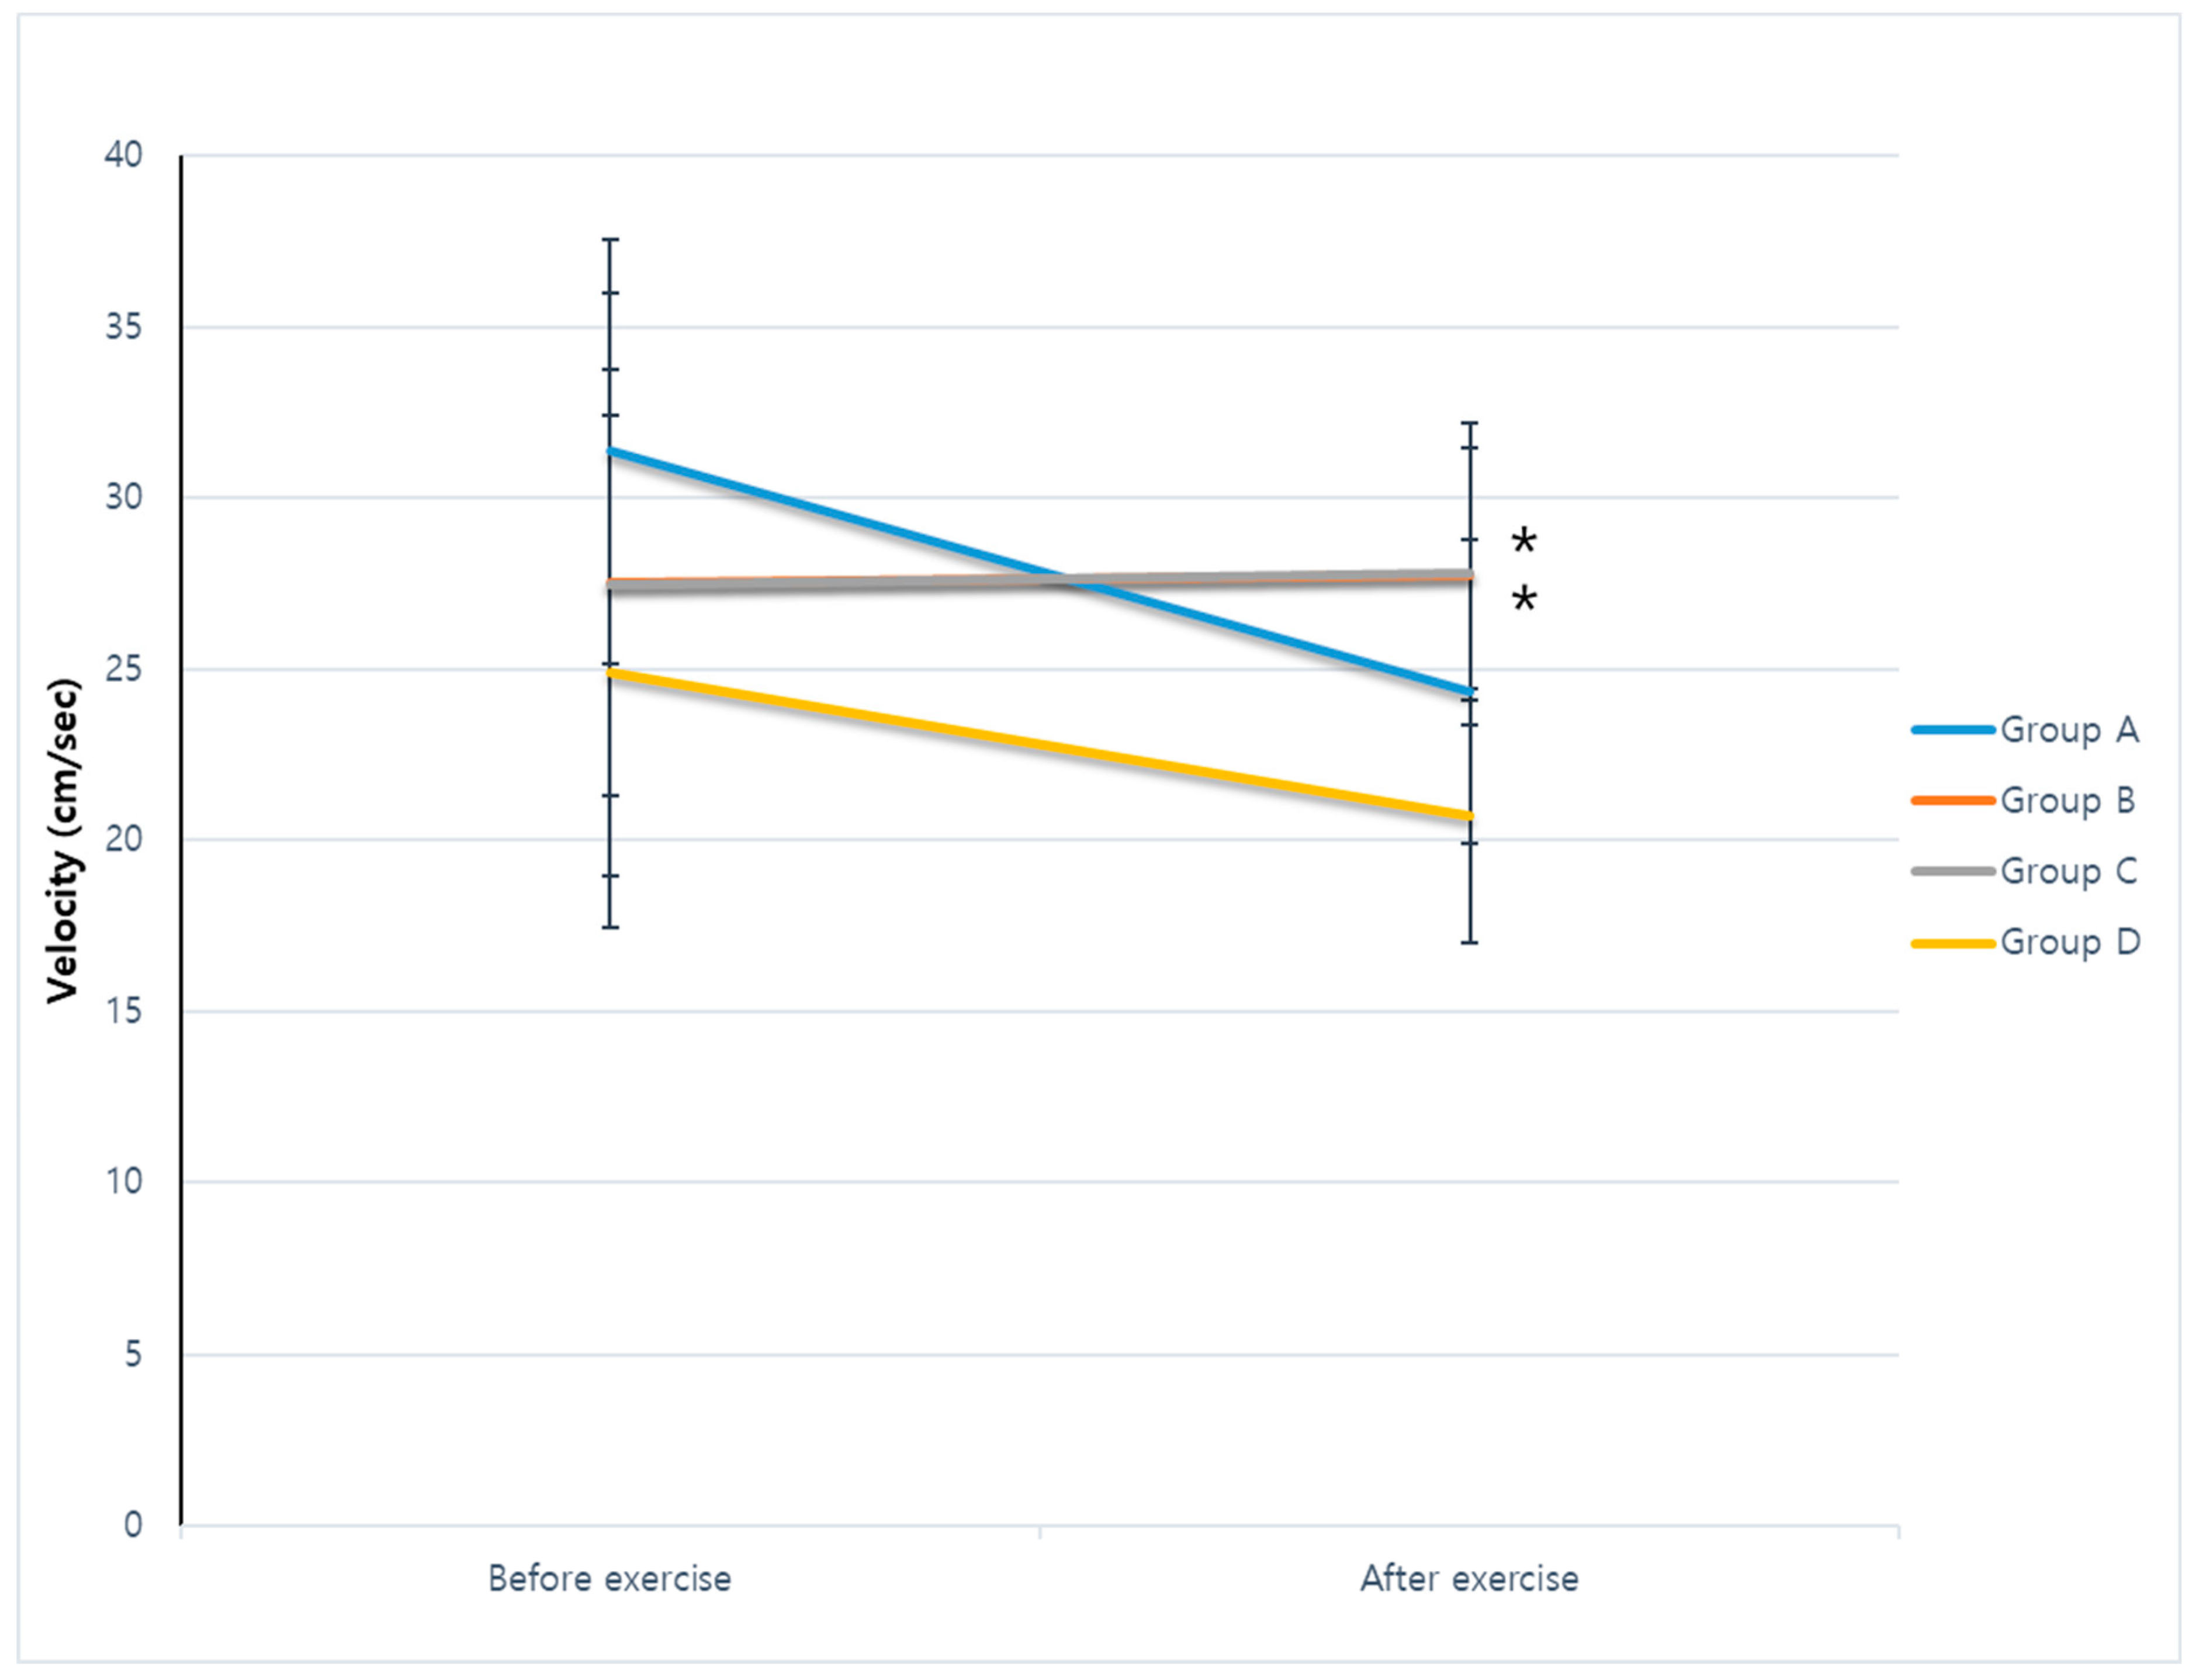
The velocities on the first day after cerebral infarction were 31.37 ± 9.30 cm/s in group A, 27.55 ± 6.22 cm/s in group B, 27.50 ± 8.53 cm/s in group C, and 24.93 ± 7.49 cm/s in group D. There was no significant difference among the groups (p = 0.406). After 4 weeks, the velocities were 24.35 ± 2.77, 27.79 ± 4.42, 27.81 ± 3.69, and 20.71 ± 3.71 cm/s in groups A–D. Respectively, the Duncan post hoc correction revealed faster velocities in groups B and C compared with groups A and D after 4 weeks of exercise (p = 0.002). However, repeated-measures ANOVA with the Duncan post hoc test showed no significant effects for time and time × group interaction (F = 2.375, p = 0.133; F = 0.334, p = 0.567) (Figure 2).

2.2. RNA Sequencing Data

QuantSeq RNA analysis revealed 17,048 gene symbols. We identified several symbols showing significant fold changes in each exercise group compared with the control group. Thirty gene symbols related to neurogenesis (Iqgap1, Lrrc7, Coq7, Myef2, Mapk3, Vhl, Fuom, Pex5, Il33, Kdm4c, Ldb1, Heyl, Baiap2, Kdm1a, Mapkapk5, Epha2, Enah, Snw1, Nefm, Hsp90aa1, Nr2f6, Btbd6, Bloc1s5, Fbxo7, Cdh11, Trappc4, Cacna1a, Mapk6, Vcan, and Dag1) were detected (p < 0.05, fold change > 1.0, average normalized read count [RC] > 4). To use the clustering heatmap, the patterns of gene expression in the low- and moderate-intensity treadmill exercise groups were similar and different from the control and high-intensity treadmill exercise groups (Figure 3).

2.3. KEGG Mapper Tool Analysis

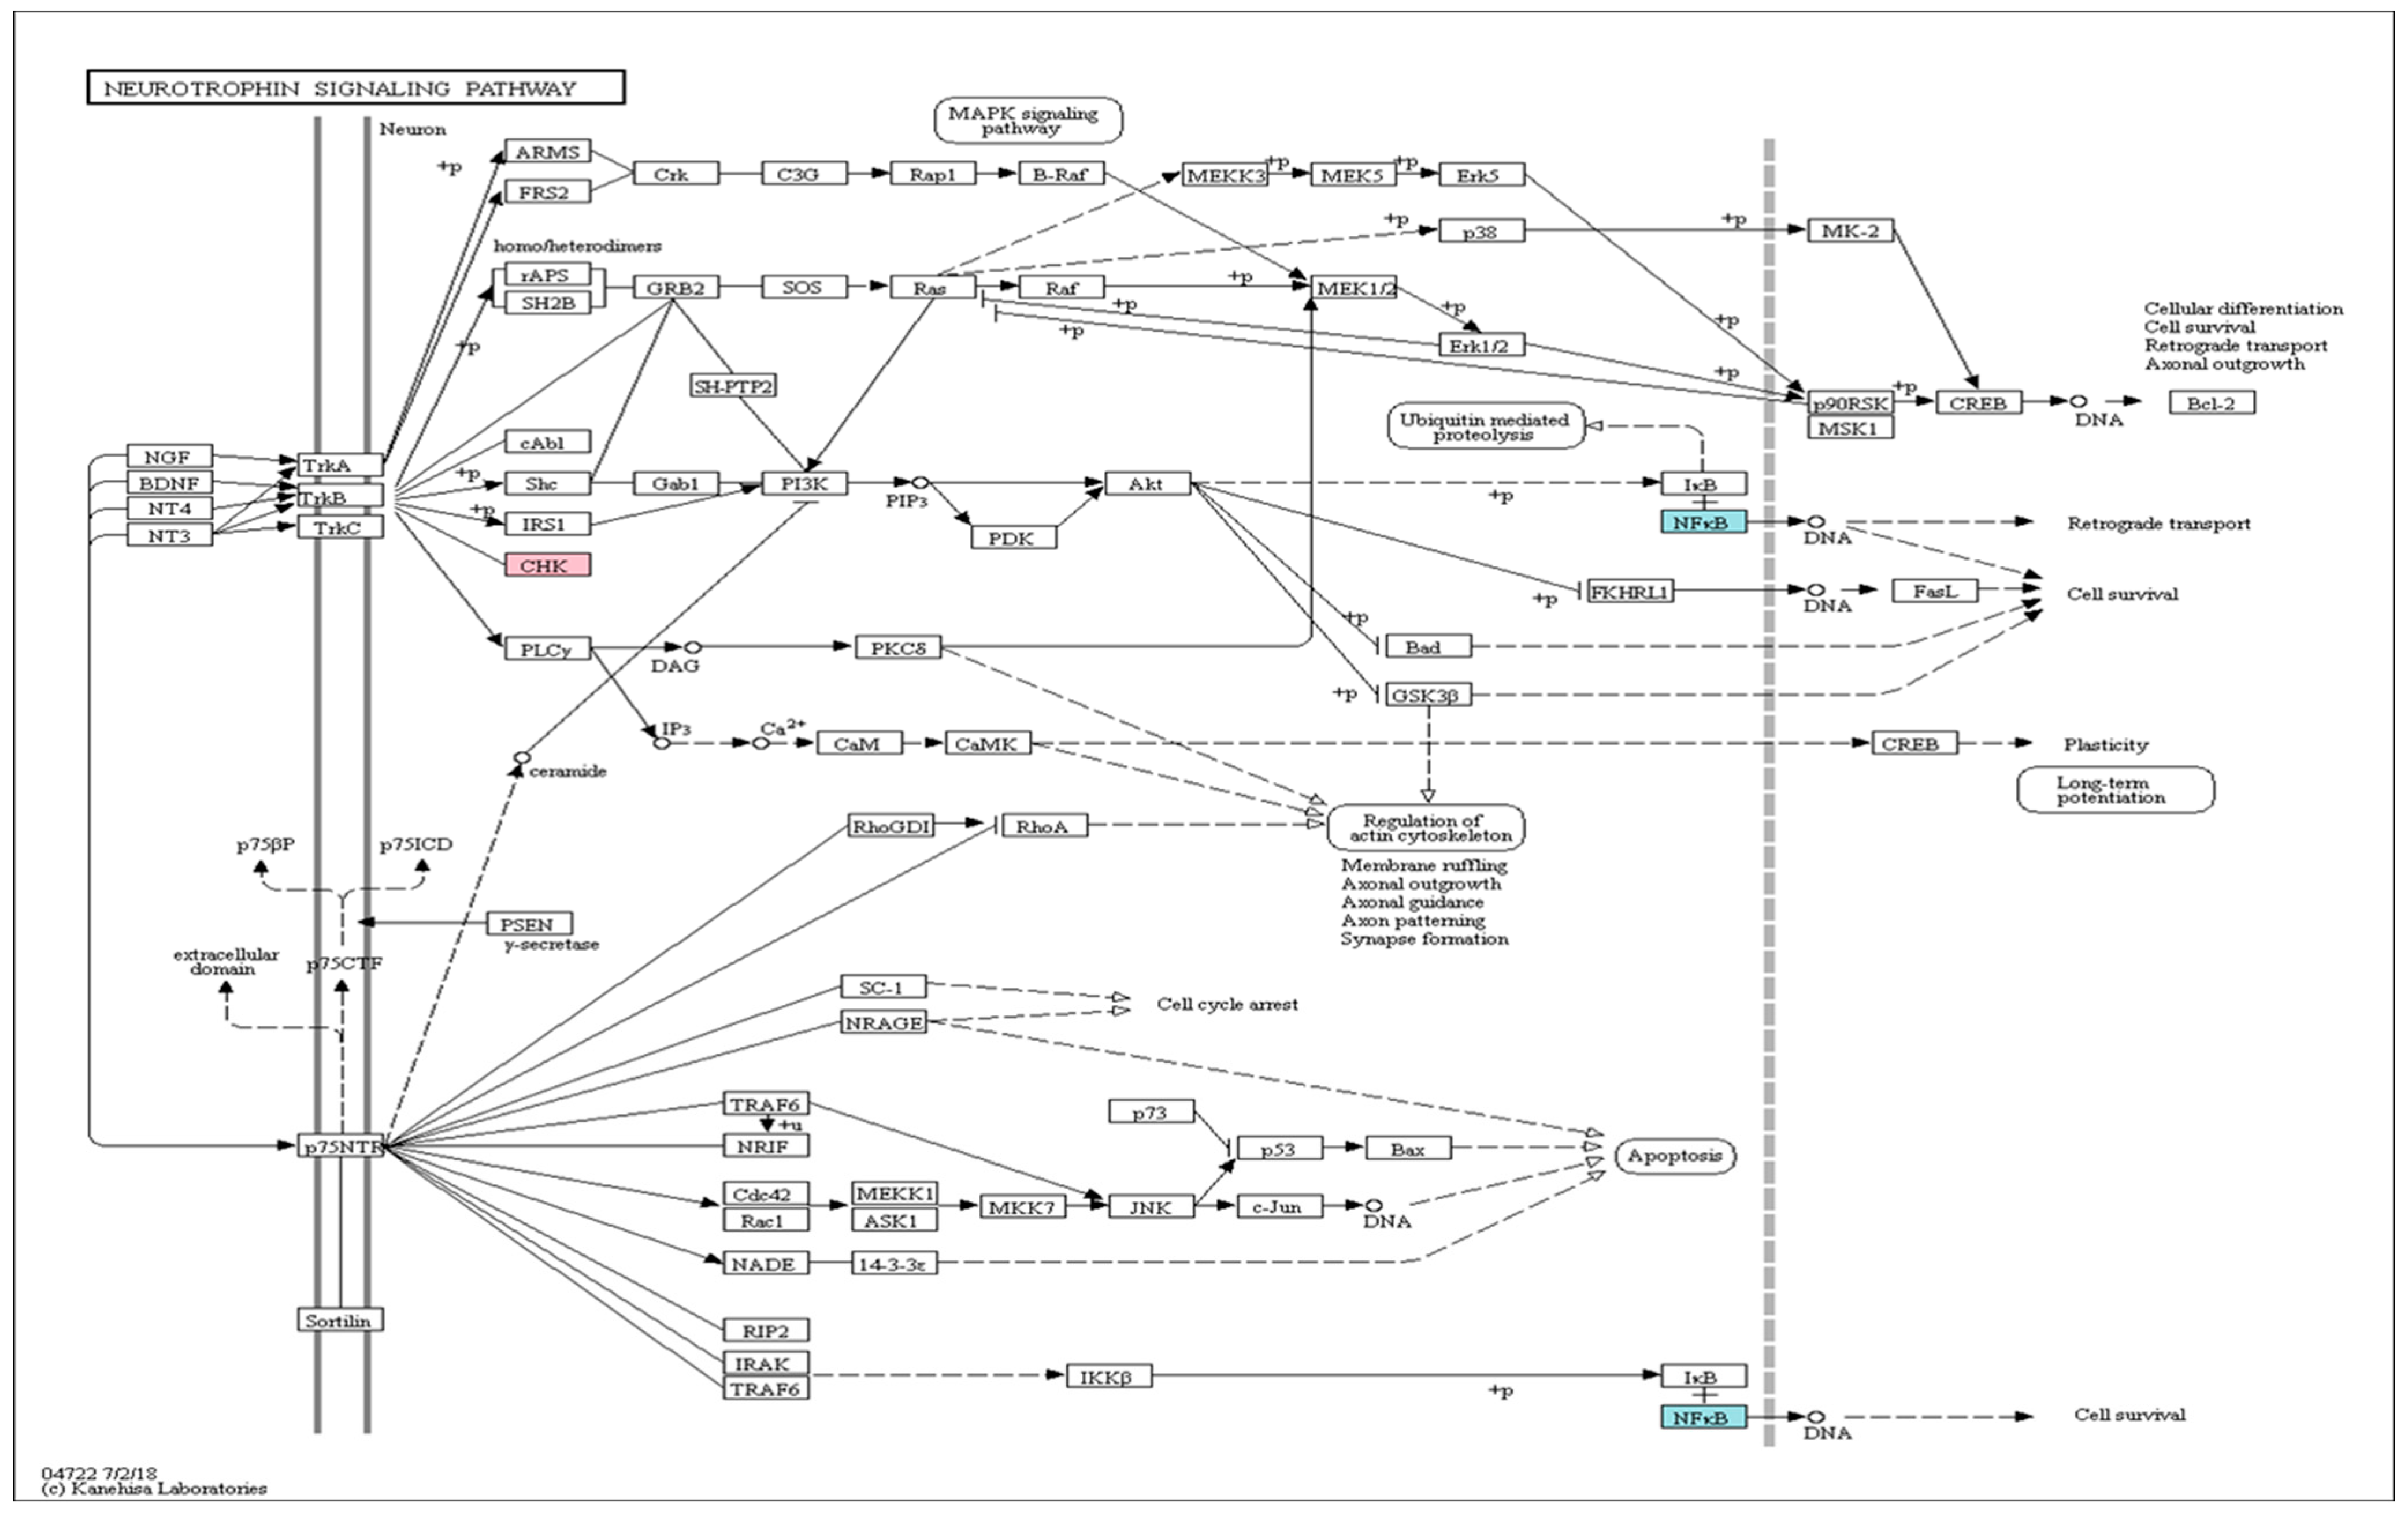
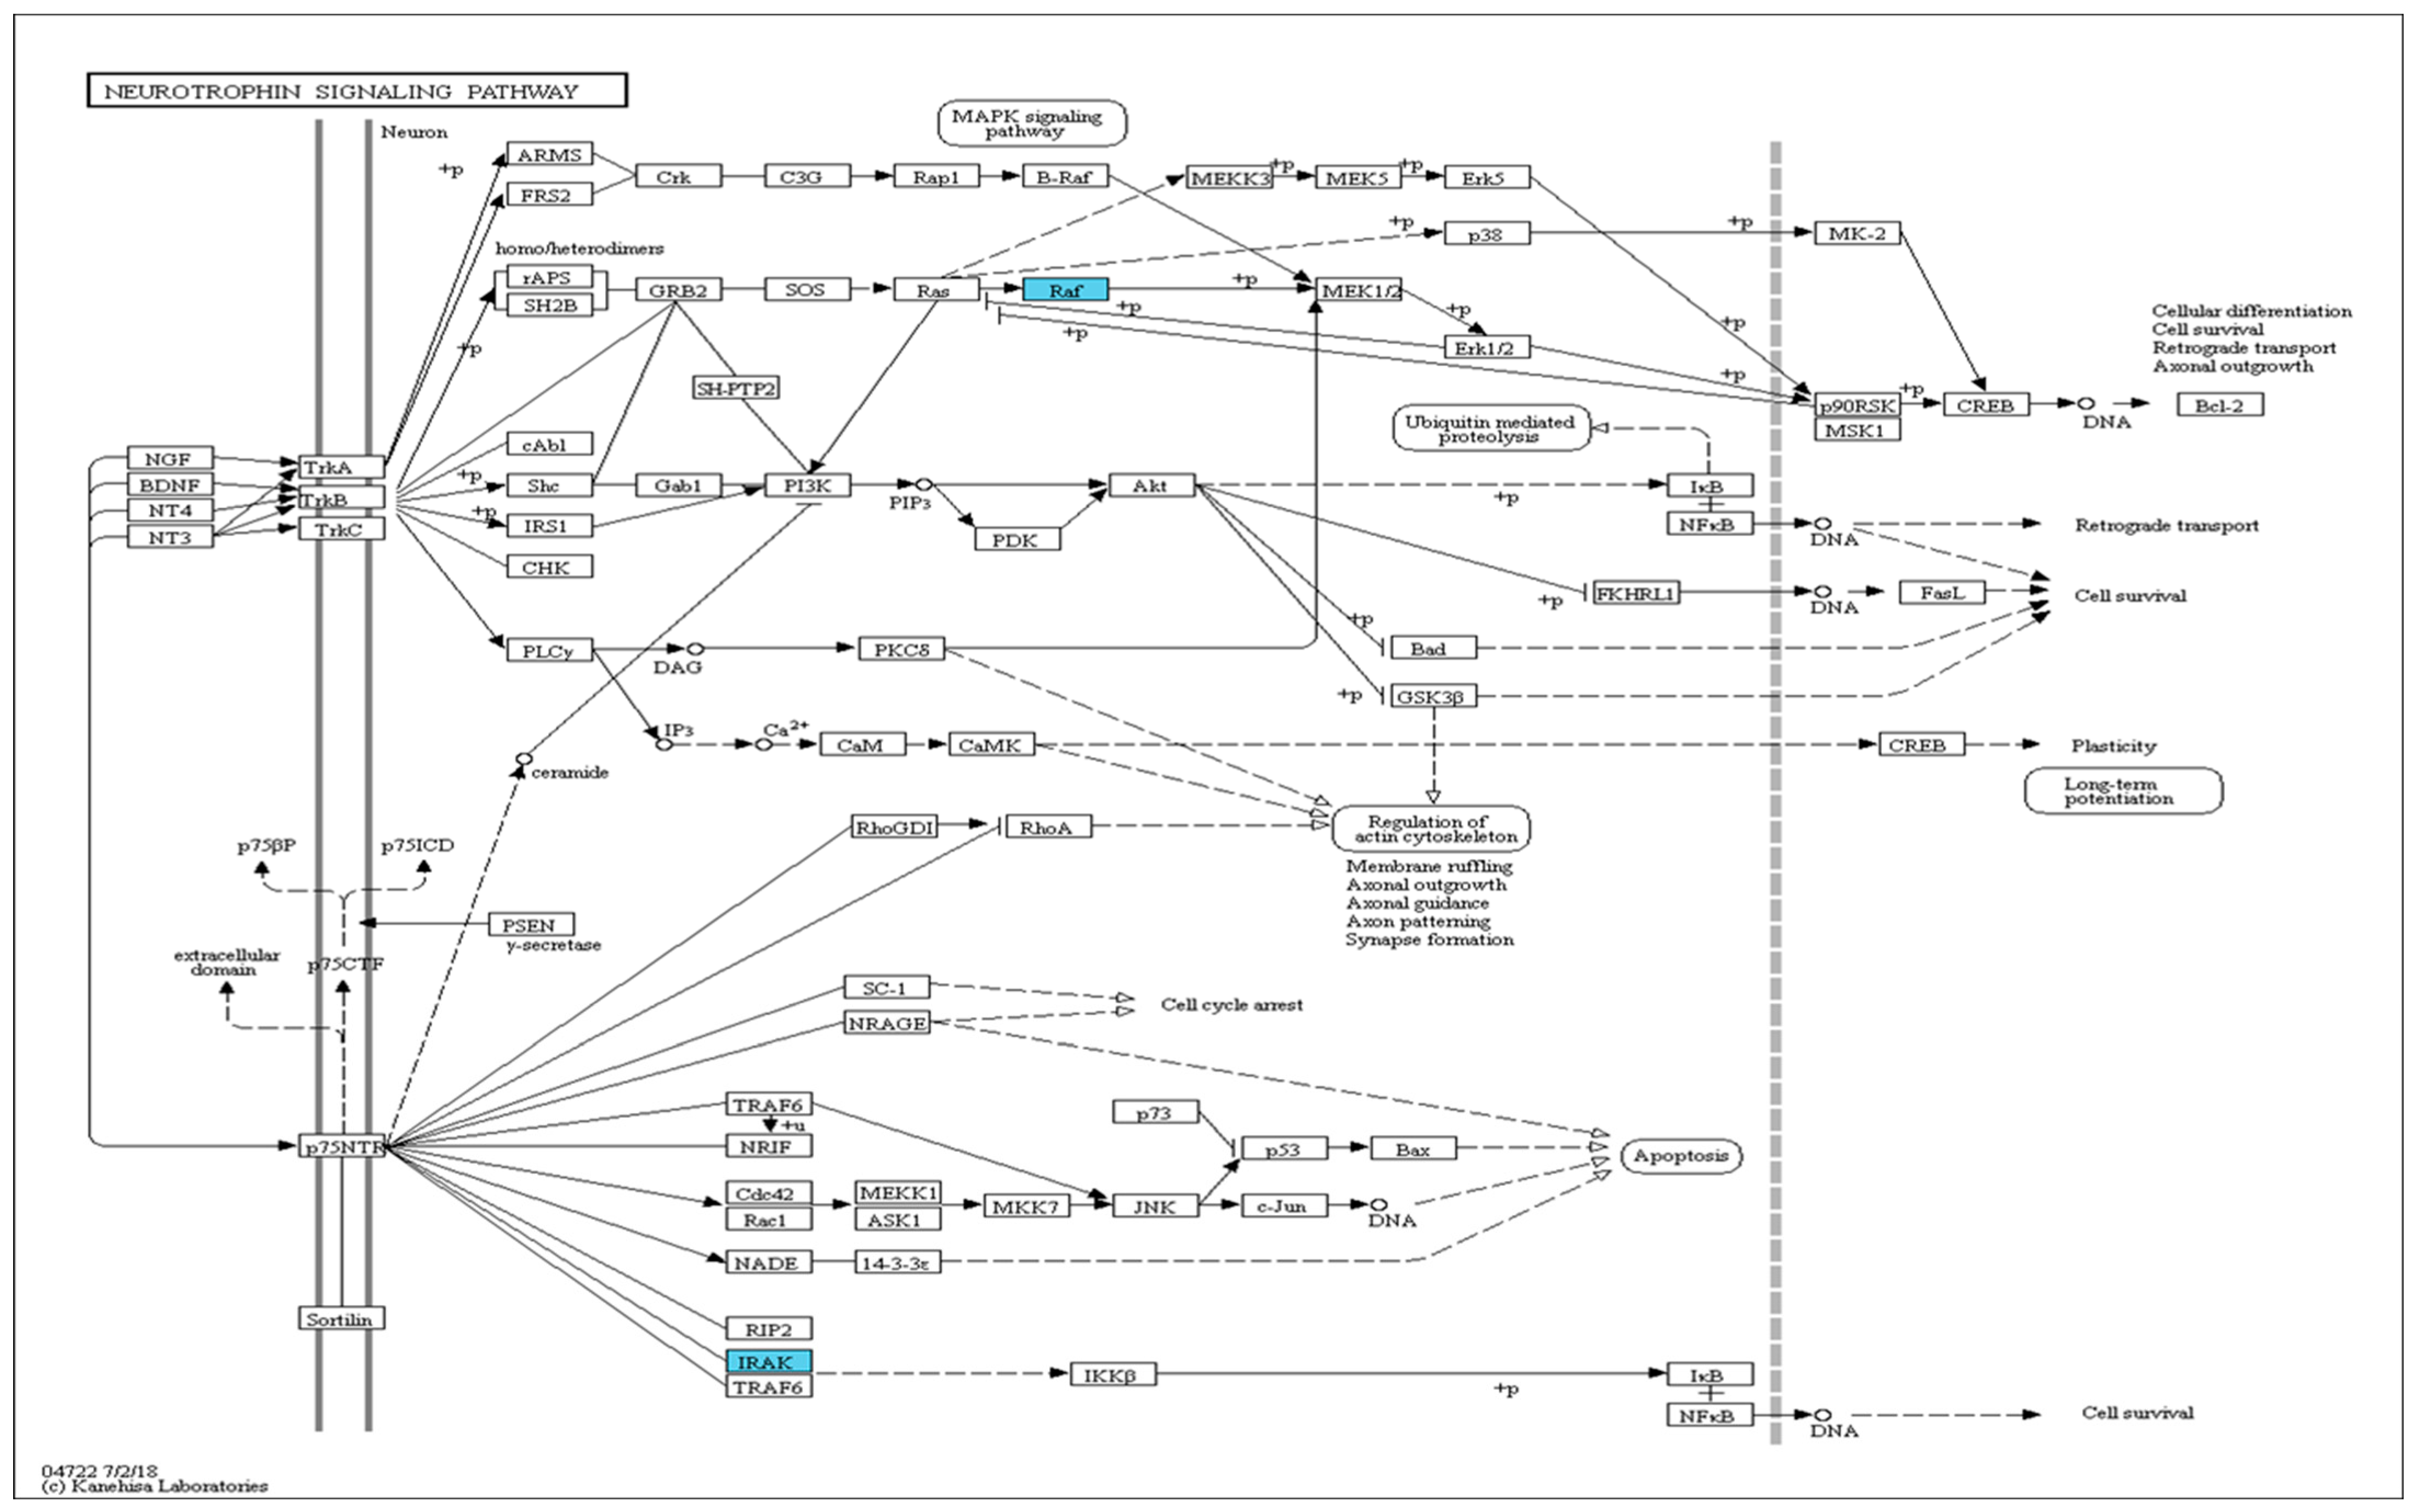
We subjected the gene symbols with greater expression in the experimental groups than in the control group (p < 0.05, fold change > 1.0, average normalized RC > 4) to the Kyoto Encyclopedia of Genes and Genomes (KEGG) mapper tool analysis. We found changes in gene expression of components of the neurotrophin-signaling pathway after low-intensity treadmill exercise: the CHK gene was upregulated, and the NF-κB gene was downregulated (Figure 4). After moderate-intensity treadmill exercise, both the CHK and NF-κB genes were downregulated (Figure 5). In the high-intensity treadmill exercise group, gene expression was significantly different compared with the low- and moderate-intensity exercise groups, with downregulation of the Raf and IRAK genes (Figure 6).

2.4. Western Blot Analyses

Western blot analyses with antibodies to NF-kB, CHK, Raf, and IRAK were conducted for the ipsilesional hippocampal tissues 4 weeks following cerebral infarction. The reactivities of NF-kB protein were 0.461 ± 0.023 μg protein in group A, 0.518 ± 0.468 μg protein in group B, 0.375 ± 0.037 μg protein in group C, and 0.456 ± 0.079 μg protein in group D. The expression of the NF-kB protein in group C was weaker than in groups A, B, and D (p = 0.001) (Figure 7).
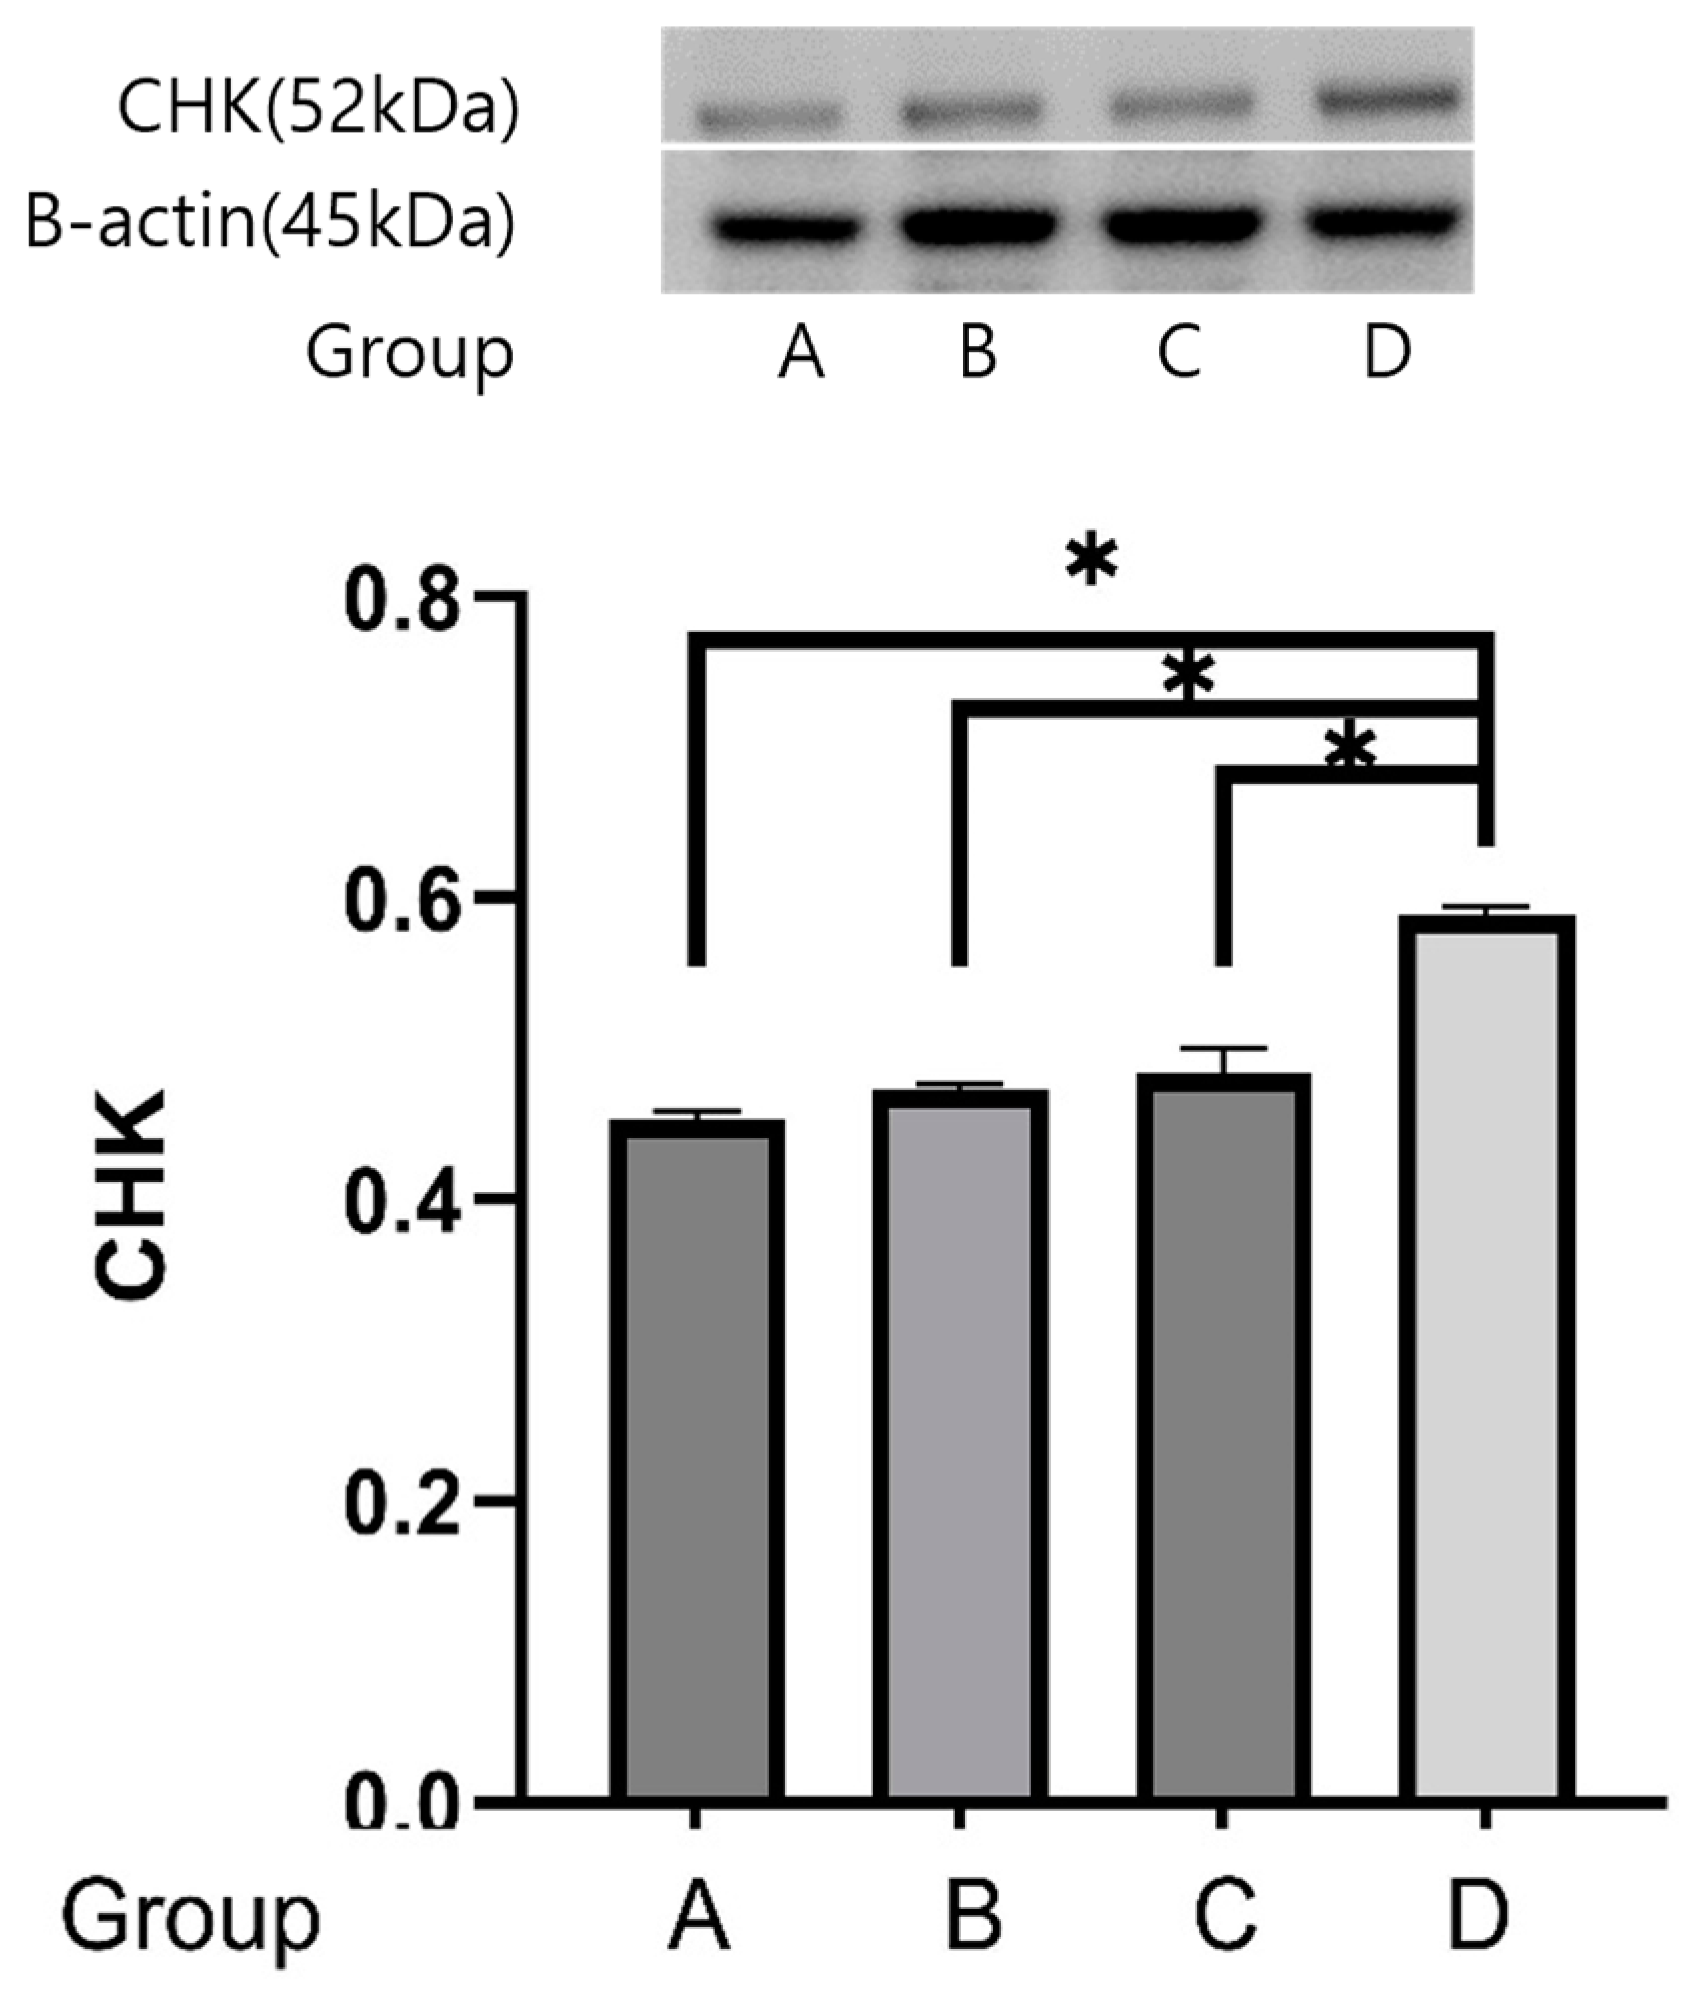
The reactivities of the CHK protein were 0.453 ± 0.005 μg protein in group A, 0.472 ± 0.003 μg protein in group B, 0.484 ± 0.016 μg protein in group C, and 0.588 ± 0.005 μg protein in group D. The expression of the CHK protein was stronger in group D than in groups A, B, and C (p = 0.05) (Figure 8).
The reactivities of the Raf protein were 0.797 ± 0.016 μg protein in group A, 0.906 ± 0.014 μg protein in group B, 0.973 ± 0.038 μg protein in group C, and 1.059 ± 0.018 μg protein in group D. The expression of the Raf protein was stronger in group D than in groups A, B, and C (p = 0.05) (Figure 9).
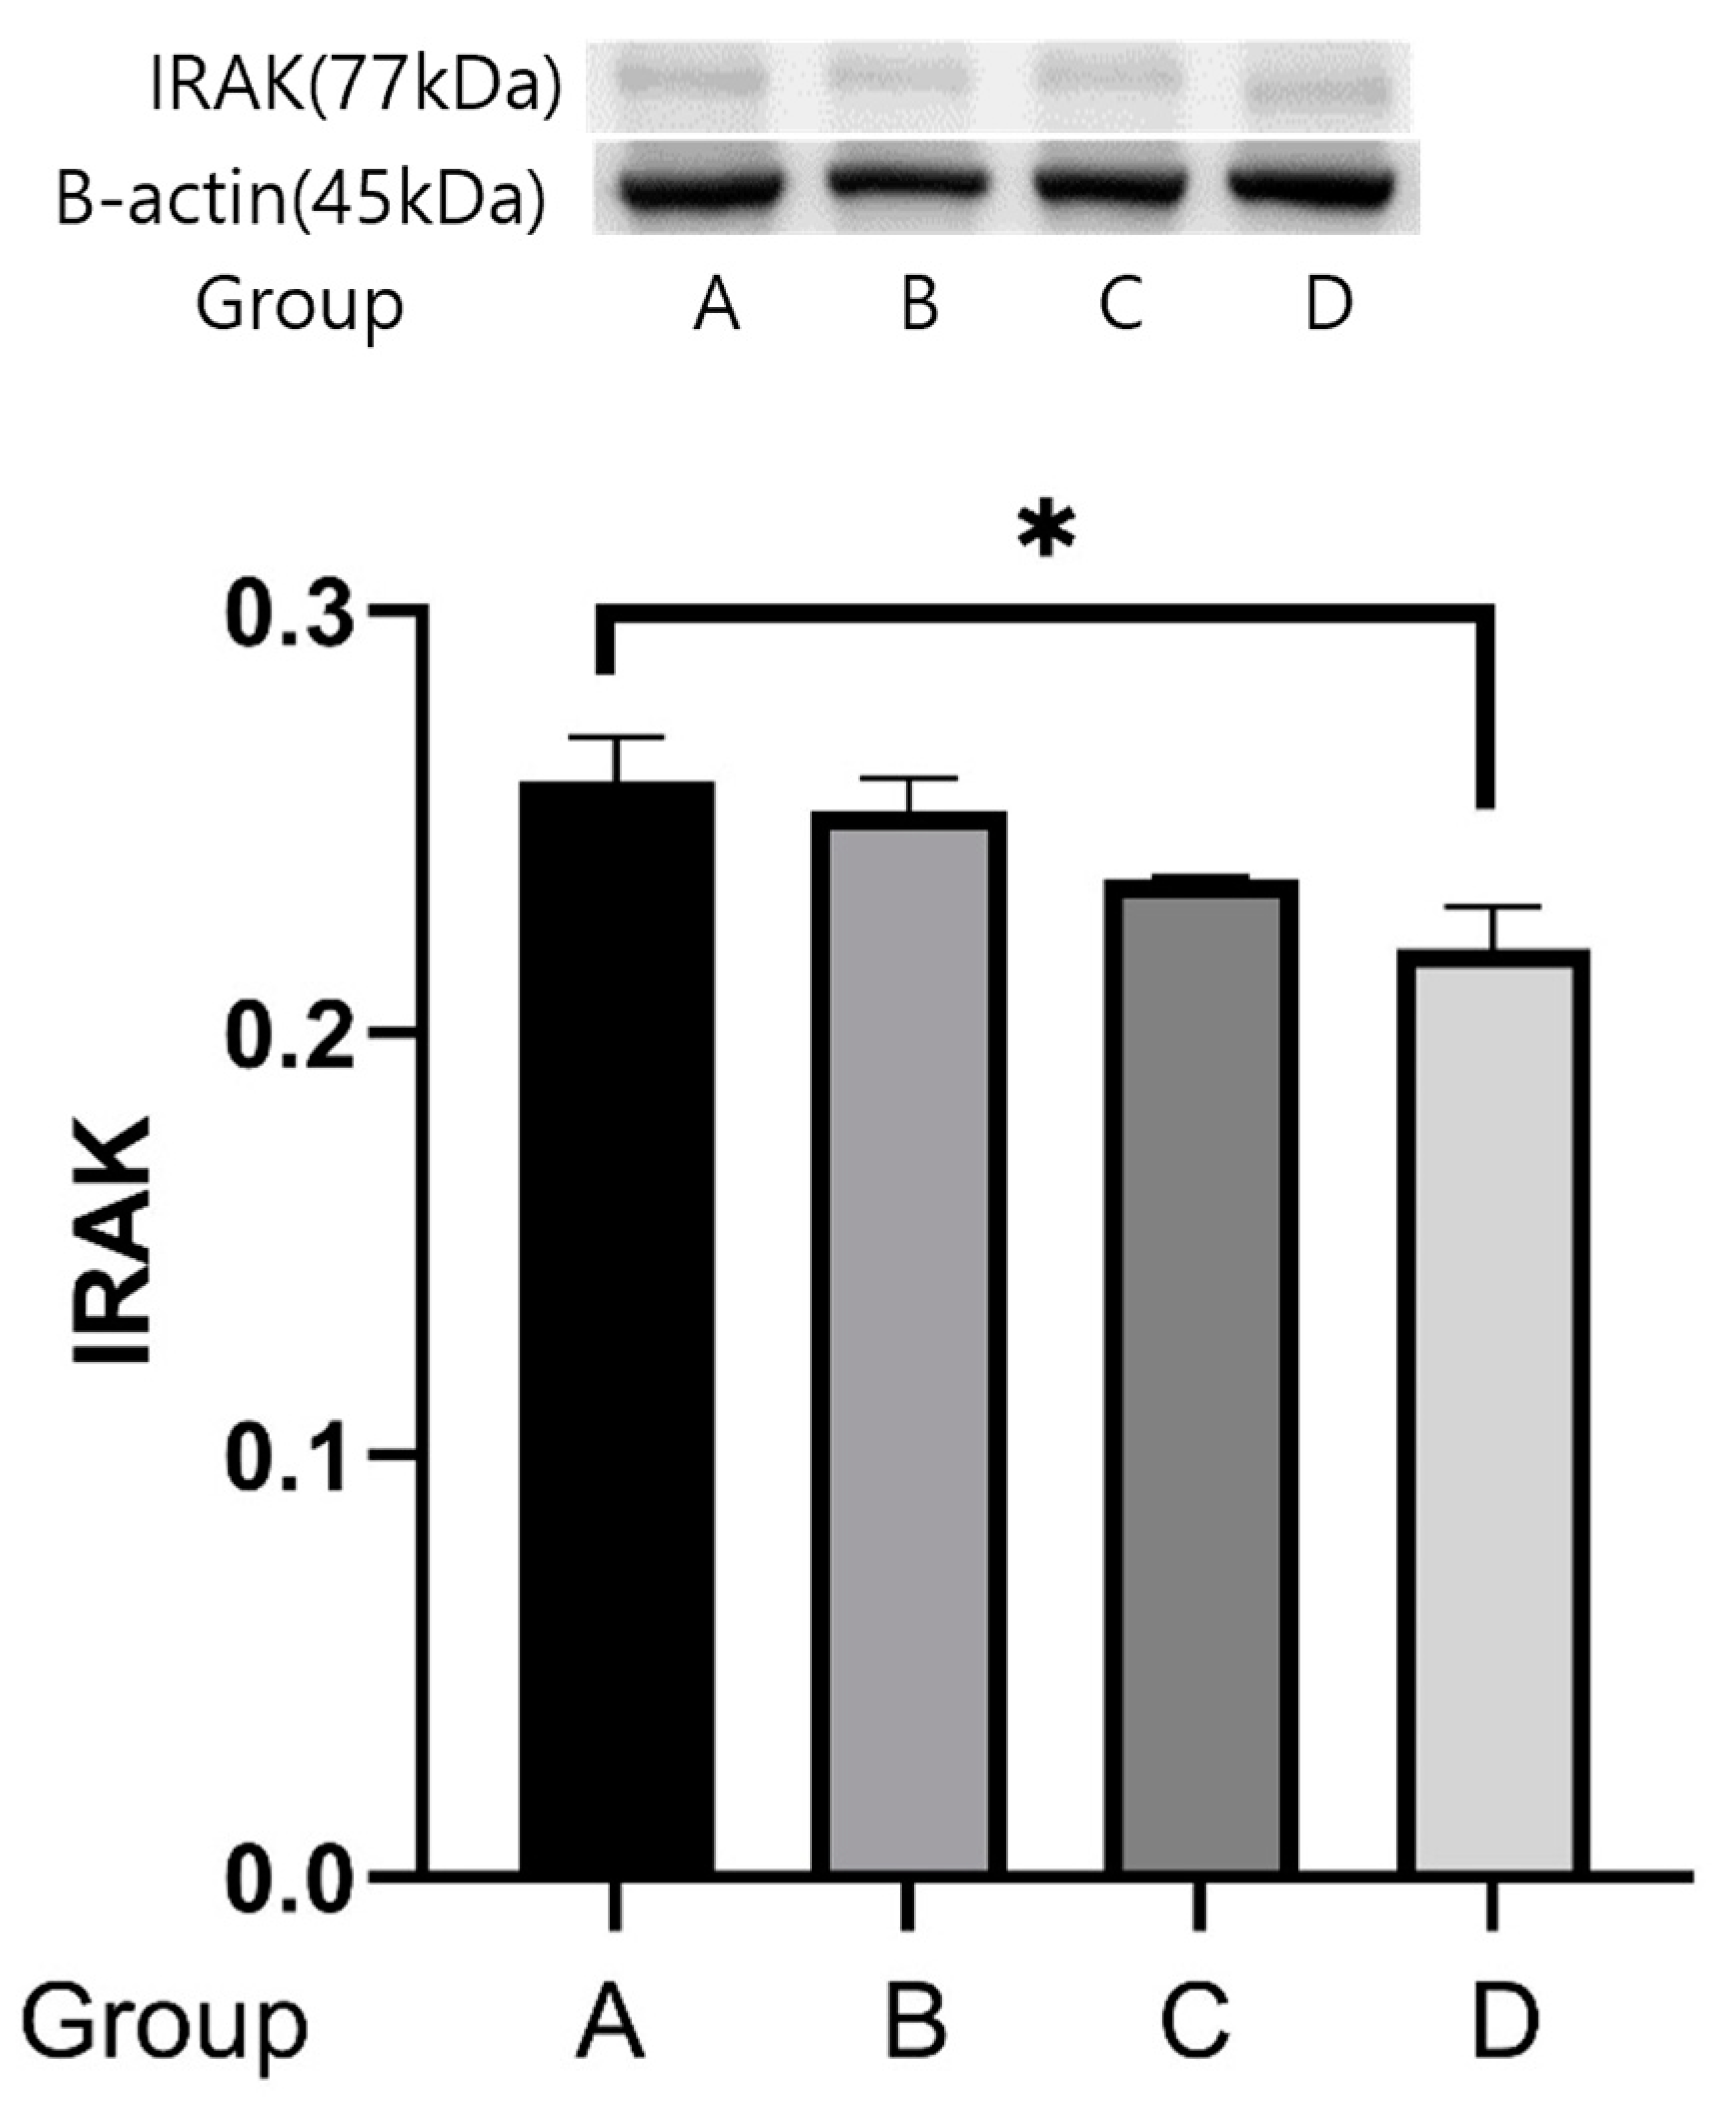
The reactivities of IRAK protein were 0.252 ± 0.012 μg protein in group A, 0.247 ± 0.011 μg protein in group B, 0.236 ± 0.010 μg protein in group C, and 0.227 ± 0.014 μg protein in group D. The expression of the IRAK protein was weaker in group D than in group A (p = 0.05) (Figure 10).

3. Discussion

Stroke is a neurologic disorder associated with cerebrovascular events, and it often causes functional deficits. Maximal functional recovery is the primary goal for patients with stroke. Therapeutic approaches to functional recovery have been applied in such patients in combination with proper neurorehabilitation management and medical therapy.
In the neurorehabilitation of patients with stroke, the main strategy for neurobehavioral functional recovery is based on neuroplasticity, which is the ability of the brain to transfer neural connections to a different brain area. Neuroplasticity serves to optimize neural connectivity after brain tissue damage [17]. However, neuroplasticity may not be directly correlated with neurobehavioral functional recovery. Exercise intensity may enhance or decrease neurobehavioral functional recovery in stroke neurorehabilitation. Therefore, flexible and appropriate exercise intensity is important for patients with stroke to attain optimal functional recovery based on neuroplasticity.
Neuroplasticity is related to three mechanisms: neurogenesis, angiogenesis, and synaptogenesis. In particular, neurogenesis involves several neurotrophic pathways that promote the proliferation, differentiation, repair, and survival of neural tissues in the brain [18]. Among several neurotrophins that regulate the neurotrophic pathways related to neurogenesis, the best known are BDNF, nerve growth factor (NGF), neurotrophin-3, vascular endothelial growth factor, insulin-like growth factor-1, and erythropoietin in the adult hippocampus [19]. Still, there are many unknown neurotrophic pathways for neurogenesis by which neurotrophins may modulate neuroplasticity in each area of the brain.
Csk homologous kinase (CHK) was downregulated in the moderate-intensity group and upregulated in the low-intensity group, compared with the control group. CHK may modulate the terminal differentiation of oligodendrocytes and neurons in the central nervous system. CHK is involved in the neurite outgrowth of PC12 cells in response to NGF through its participation in TrkA-signaling [20]. However, overexpression of CHK in hippocampal neurons facilitates aggregation of cell bodies, axon fasciculation, and changes in neuronal morphology [21]. The level of CHK expression may enhance or inhibit neurogenesis.
By contrast, high-intensity treadmill exercise showed different gene expression patterns compared with low- and moderate-intensity exercise. The Raf and IRAK genes were downregulated with high-intensity treadmill exercise. IRAK-1 and IRAK-4 are recruited to the receptor complex [22], and lack of IRAK-1 expression in neurons may induce recalcitrancy of NF-κB activation during Toll-like receptor (TLR) pathway signaling [23]. Further, Ras/Raf/ERK signaling participates in the neuronal apoptosis observed in the hippocampus in early post-subarachnoid hemorrhage brain injury [24]. The downregulation of Raf and IRAK may have inhibited neurogenesis by interrupting neuronal apoptosis in the present research.
The Western blot analysis showed different results: CHK and Raf expression were elevated, but IRAK expression was decreased in high-intensity treadmill exercise. Thus, the regulation of CHK, Raf and IRAK would not be the main pathway of neurogenesis related to exercise intensity if these may affect the process of neurogenesis.
In this study, the regulation of NF-ĸB was the most important in these neurotrophic pathways. NF-κB in the central nervous system plays a role in neuroplasticity and neurocognitive function. Previous studies showed that activation of NF-ĸB through p75NTh may promote the migration of extracellular matrix proteins during nerve regeneration in Schwann cells [25]. NF-κB can be activated by BDNF and NGF and may facilitate synaptogenesis by glutamate [26]. Recent studies have reported that NF-κB is a key neurotrophin for learning and memory in mice [27,28]. NF-κB may regulate cognitive functions such as learning and memory by modulating synaptogenesis [29,30,31,32,33] and by regulating dendrite growth [34]. NF-κB target genes may be essential for neurogenesis by modulating neurotransmitters, cytokines, and kinases [31,35]. However, we found that the NF-κB gene was downregulated in the low- and moderate-intensity exercise groups compared with the control group. Also, expression of the NF-kB protein in the low- and moderate-intensity exercise groups showed the greatest protein decrease relative to the other groups.
Some studies have shown that overexpression of NF-κB in a transgenic mouse combined with massive expression of ncaIKK-2 may cause the destruction of granule cells and stimulate astrocytosis [36]. Further, the presence of the p50 subunit of NF-κB may affect brain tissue [37]. In p50−/−mice, half of the newborn neurons survived in the dentate gyrus, although spatial short-term memory was impaired [38]. The function of NF-κB remains unclear, and further research is needed to determine the effects of the subunits of NF-κB in neurogenesis.
NF-κB caused excitotoxic damage in the hippocampus in a middle cerebral artery occlusion model via an anti-inflammatory cytokine [37]. Inhibiting NF-κB could suppress neuroinflammation in peri-infarcted areas of the brain and protect neuronal cells [39,40]. In the present research, the brain may still have been in the inflammatory period, and long-term exercise may have provided an anti-inflammatory effect in the cerebral infarction rat model after stabilizing neurogenesis in the brain. Therefore, moderate-intensity exercise training may be sufficient to suppress the expression of the NF-κB gene as an inflammation-related gene.
In the behavioral test, we found that low- and moderate-intensity exercise had a greater effect than high-intensity treadmill exercise on neurogenesis in the cerebral infarction rat model. The difference in functional recovery would depend on the level of gene expression in each intensity condition, and NF-κB is the key neurotrophin for neurogenesis related to exercise intensity. Therefore, prescribing an exercise program of the proper intensity could play a pivotal role in maximal functional recovery during a stroke neurorehabilitation program.
There are some limitations in this study. First, it does not reflect aging and comorbidities as the most important risk factors for stroke. However, in this study, 14-week-old rats may be considered as aged rats after a 4-week exercise program. Previous studies reported that aged rats could have limited recovery of neurologic function because of the lack of neuroprotective factors, immune imbalance, and comorbidities related to stroke risk factors such as obesity and metabolic syndrome [41,42,43]. Further studies are needed to consider aging and comorbidities in stroke experiments. Second, this study showed gene expression with RNA sequencing analyses and performed Western blot analyses for the quantification of proteins related to gene expression. Several studies have used quantitative methods, such as Western blot analyses after RNA sequencing [44,45,46]. However, there are several direct analyses, such as immunofluorescence, enzyme-linked immunosorbent assay (ELISA) or reverse transcription-polymerase chain reaction (RT-PCR), to confirm the mechanism. Therefore, it would have been better to quantify gene expression with immunofluorescence, ELISA, or RT-PCR. Further studies are needed to use direct analysis methods for standardizing the biomechanism of neurogenesis after various exercise intensities.

4. Materials and Methods

4.1. Experimental Subjects and Ethics Approval

All experimental protocols were approved by the Institutional Animal Care and Use Committee (IACUC) of Chonnam National University (approval number: CNU IACUC-H 02018-2). Thirty-six 10-week-old male Sprague-Dawley (SD) rats (Samtako; Osan, Republic of Korea) were used. All experimental rats were housed following the protocol of the Animal Care Laboratory at Chonnam National University.

4.2. Methods

4.2.1. Photothrombotic Cerebral Infarction Rat Model

We induced photothrombotic cerebral infarction in rats using Watson’s method [47]. Every SD rat was anesthetized with 5% isoflurane and maintained with 2% isoflurane in a 70% nitrous oxide and 30% oxygen mixture during the surgical procedure. The operation was performed on a homeothermic plate (Harvard Apparatus; Holliston, MA, USA) to maintain body temperature at 37.5 ± 0.5 °C. Each rat was placed in a stereotactic frame (Stoelting; Wood Dale, IL, USA) in a prone position. After an incision and exposure of the scalp, we injected Rose Bengal dye (50 mg/kg; Sigma-Aldrich Co., St. Louis, MO, USA) into the left femoral vein, and light exposure (3300 K, 150 W; KL 1500 LCD; SCHOTT AG, Mainz, Germany) was applied to the mixed zone of the left M1 and S1, known as the primary sensorimotor cortex, for 10 min.

4.2.2. Regular Treadmill Exercise Program

All rats were randomly assigned to four groups: group A (no treadmill exercise; n = 9); group B (regular treadmill exercise with maximal velocity of 18 m/min, 5 days a week for 4 weeks; n = 9); group C (regular treadmill exercise with maximal velocity of 24 m/min, 5 days a week for 4 weeks; n = 9); and group D (regular treadmill exercise with maximal velocity of 30 m/min, 5 days a week for 4 weeks; n = 9). Exercise intensity was decided by Bedford’s theory as 50%, 65%, or 80% of rat maximal oxygen uptake [48]. An electric treadmill machine (Columbus Instruments; Columbus, OH, USA) was used for the exercise. The apparatus consisted of a 3-lane animal exerciser using single-belt construction with dividing walls suspended over the tread surface. The overall dimensions of the treadmill were 80.0 × 50.0 × 50.8 cm (width × depth × height), and the dimensions of each exercise lane were 56 × 12 × 13 cm (width × depth × height). All rats were placed on a moving belt facing away from the electrified grid (stimulus intensity 1.0 mA), and they ran in the direction opposite to the belt movement to acclimate to the treadmill exercise at an inclination of 0°.

4.2.3. Neurobehavioral Test: The Morris Water Maze

Spatial learning memory was measured using the Morris water maze (MWM) test based on the method described by Morris [49]. The MWM test was conducted in a circular metal pool (diameter 184 cm, height 60 cm) filled with water and maintained at 20–25 °C. The pool was divided into four approximately equal quadrants, one of which was allocated as the target quadrant. Visual cues were placed at the perimeter of each quadrant. A circular escape platform (diameter 10 cm, height 38 cm) was placed in the center of the target quadrant. The water level in the pool was adjusted so that the platform was submerged 1 cm below the surface of the water.
The animals were placed in the water maze facing the maze wall at random entry points, which were distributed equally around the maze perimeter. After finding the platform, the rats were allowed to remain there for 10 s before the next trial. Any rat that did not find the hidden platform within 120 s was guided to the platform and allowed to stay there for 15 s. Then, the rat was removed from the pool, dried, and placed back in its holding bin for a period of 5 min, after which the second trial was conducted. All groups were acclimated to the abovementioned pre-training process for 3 consecutive days before induction of photothrombotic cerebral infarction. After the treadmill exercise program, the follow-up MWM test was performed. In this trial, rats had to find the platform within 300 s. The time to reach the platform (escape latency) and the length of the swim path were recorded automatically by a video tracking system (Ethovision Color-Pro®; Noldus, Wageningen, The Netherlands). Velocity was calculated by dividing the length of the swim path by the escape latency.

4.2.4. RNA Sequencing Analysis

RNA sequencing analysis followed Kim’s method [50]. RNA sequencing was performed with ipsilesional hippocampal tissue. Total RNA was isolated with TRIzol™ reagent (Thermo Fisher Scientific; Waltham, MA, USA). A NanoDropTM 2000 spectrophotometer (Thermo Fisher Scientific; Waltham, MA, USA) was used for RNA quantification. QuantSeq 3′ mRNA-Seq Library Prep Kit (Lexogen, Inc.; Vienna, Austria) was used for library preparation. High-throughput sequencing was performed with NextSeq 500 (Illumina, Inc.; San Diego, CA, USA).
QuantSeq 3′ mRNA-Seq reads were aligned using Bowtie 2 [51]. Expressed genes were determined on counts with Bedtools [52]. The RC data were measured by edgeR within R using a Bioconductor [53]. DAVID (https://david.ncifcrf.gov/, accessed on 19 December 2020) and Medline (http://www.ncbi.nlm.nih.gov/, accessed on 19 December 2020) databases were used for gene classification. A clustering heatmap was developed using MultiExperiment Viewer version 4.9.0 (http://mev.tm4.org, accessed on 19 December 2020) based on log2 values for the average of normalized data.
The neurotrophin-signaling pathway was elicited using the KEGG Mapper Search and Color Pathway tool We identified the gene symbols with greater expression in the experimental groups than in the control group (p < 0.05, fold change > 1.0, average normalized RC > 4). The identified genes were entered on the website, and we clicked ‘included aliases’ and ‘uncolored diagram’. Then, the related pathways were identified [54]. We chose the neurotrophin-signaling pathway listed for the various pathways in each group.

4.2.5. Western Blot Analysis

Hippocampal tissues were homogenized with 300 μL of a lysis buffer. The tissue was immediately put on ice and stored at –80 °C. After centrifugation at 13,000 rpm for 10 min at 4.0 °C, the supernatant liquid was collected (Centrifuge 5424; Eppendorf, Germany). For the detection of the NF-κB, CHK, Raf, and IRAK proteins, 20 μg of each sample was separated using 10% sodium dodecyl sulfate-polyacrylamide gel electrophoresis. The gels were transferred to a polyvinylidene difluoride membrane at 300 mA for 1 h. The membranes were stained with Ponceau Red to confirm equal protein loading. Immunodetection of each protein was done by blocking the membrane with 5% nonfat milk for 1 h. Tris-buffered saline, including 0.1% Tween-20 (TBS-T) for 1 h at room temperature. The membranes were rinsed with TBS-T four times within 10 min. Then, the membranes were incubated with the primary antibodies against NF-κB (rabbit polyclonal antibody 1:1000; Thermo Fisher Scientific), CHK (rabbit polyclonal antibody 1:1000; Abcam, Cambridge, UK), Raf (rabbit polyclonal antibody 1:1000; Abcam), and IRAK (rabbit polyclonal antibody 1:1000; Abcam), overnight at 4.0 °C in TBS-T. Excess antibodies were removed by washing with TBS-T three times over 5 min and for a series of four times each. The membranes were incubated with a horseradish peroxidase-conjugated goat anti-rabbit immunoglobulin G (1:1000 dilution; Thermo Fisher Scientific, US) secondary antibody blocking solution for 1 h. The membranes were rinsed with TBS-T three times within 5 min and for a series of three times each. Immunoreactive bands were visualized by Enhanced Chemiluminescence Plus using Immobilon Western Chemiluminet substrate (Millipore; Burlington, MA, USA). After the protein bands were photographed in grayscale at a resolution of 600 dpi, the bands were quantified using ImageJ (National Institutes of Health; Washington, DC, USA).

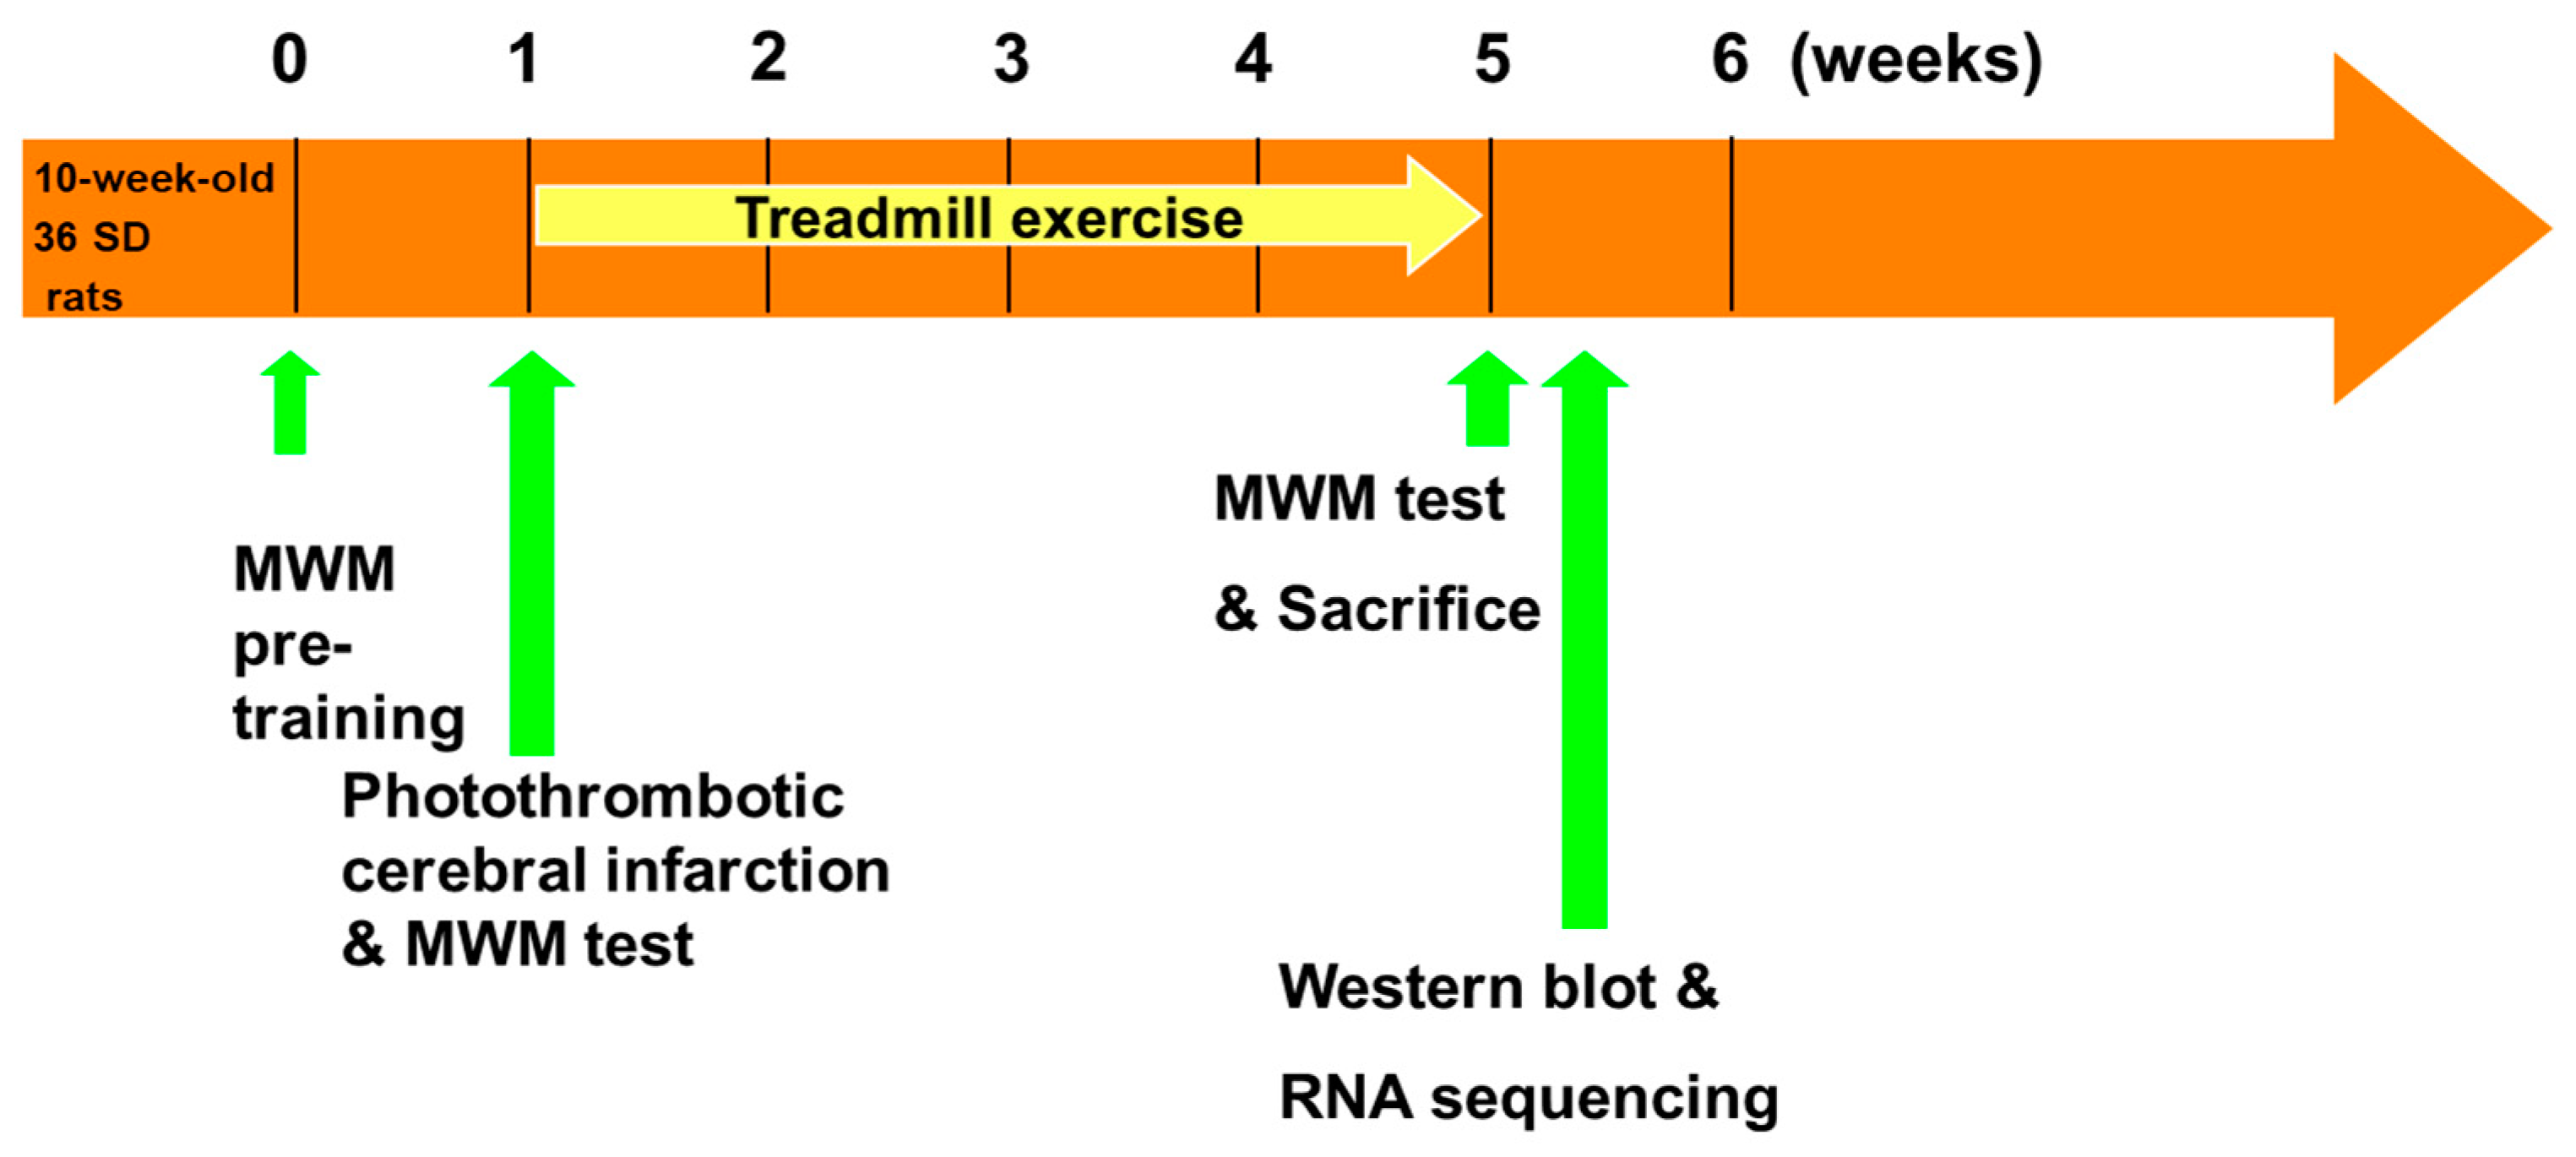
4.2.6. Timing of the Experiments

Figure 11 shows the timing of the experiments in this study. Photothrombotic cerebral infarction was conducted for 10-week-old male SD rats (n = 36). All rats were acclimated to the abovementioned pre-training process for 3 consecutive days before photothrombotic cerebral infarction. The MWM test was performed before and after a regular treadmill exercise program (5 days/week, 4 weeks). The follow-up MWM test was performed after the treadmill exercise program; all rats were sacrificed after the MWM test to obtain the brain tissues.

4.2.7. Statistical Analyses

Statistical analyses were performed using SPSS version 23.0 (IBM Corp.; North Castle, NY, USA). A repeated-measures analysis of variance with a post hoc analysis was used for the behavioral test. The Chi-squared test was performed for western blot analyses. Data are shown as mean ± standard deviation. Differences were considered statistically significant when the p-value was < 0.05.

5. Conclusions

Neurobehavioral functional recovery may have been affected by exercise intensity in a cerebral infarction rat model. Moderate-intensity exercise may contribute to neuroplasticity. Variation in the expression of neurotrophins in neurogenesis according to exercise intensity may reveal the mechanism of neuroplasticity, and in our study, NF-κB was the key neurotrophin involved in neurogenesis related to exercise intensity. Overall, this study demonstrated that an exercise program of the proper intensity plays a major role in assuring favorable functional recovery, and especially for the recovery of cognitive function, in stroke rehabilitation.

Author Contributions

Conceptualization, M.-K.S. and S.-G.L.; methodology, M.-K.S., E.-J.K., and S.-G.L.; validation, E.-J.K. and J.-K.K.; investigation, M.-K.S. and E.-J.K.; resources, J.-K.K.; data curation, J.-K.K.; writing—original draft preparation, M.-K.S. and H.-S.J.; writing—review and editing, S.-G.L.; visualization, M.-K.S. and E.-J.K.; supervision, S.-G.L.; project administration, S.-G.L.; funding acquisition, M.-K.S. All authors have read and agreed to the published version of the manuscript.

Funding

This research was supported by the National Research Foundation of Korea (NRF-2022R1A2C1091592) and a grant (BCRI-21032) from the Chonnam National University Hospital Biomedical Research Institute.

Institutional Review Board Statement

All experimental protocols were approved by the Institutional Animal Care and Use Committee (IACUC) of Chonnam National University (approval number: CNU IACUC-H 02018-2).

Data Availability Statement

The data presented in this study are available on request from the corresponding author.

Conflicts of Interest

The authors declare no conflicts of interest.

References

  1. El Husseini, N.; Katzan, I.L.; Rost, N.S.; Blake, M.L.; Byun, E.; Pendlebury, S.T.; Aparicio, H.J.; Marquine, M.J.; Gottesman, R.F.; Smith, E.E.; et al. Cognitive Impairment After Ischemic and Hemorrhagic Stroke: A Scientific Statement From the American Heart Association/American Stroke Association. Stroke 2023, 54, e272–e291. [Google Scholar] [CrossRef] [PubMed]
  2. Lanctot, K.L.; Lindsay, M.P.; Smith, E.E.; Sahlas, D.J.; Foley, N.; Gubitz, G.; Austin, M.; Ball, K.; Bhogal, S.; Blake, T.; et al. Canadian Stroke Best Practice Recommendations: Mood, cognition and fatigue following stroke, 6th edition update 2019. Int. J. Stroke 2020, 15, 668–688. [Google Scholar] [CrossRef]
  3. MacIntosh, B.J.; Edwards, J.D.; Kang, M.; Cogo-Moreira, H.; Chen, J.L.; Mochizuki, G.; Herrmann, N.; Swardfager, W. Post-stroke fatigue and depressive symptoms are differentially related to mobility and cognitive performance. Front. Aging Neurosci. 2017, 9, 343. [Google Scholar] [CrossRef] [PubMed]
  4. Oberlin, L.E.; Waiwood, A.M.; Cumming, T.B.; Marsland, A.L.; Bernhardt, J.; Erickson, K.I. Effects of physical activity on poststroke cognitive function a meta-analysis of randomized controlled trials. Stroke 2017, 48, 3093–3100. [Google Scholar] [CrossRef] [PubMed]
  5. Nelson, E.D.; Maynard, K.R.; Nicholas, K.R.; Tran, M.N.; Divecha, H.R.; Collado-Torres, L.; Hicks, S.C.; Martinowich, K. Activity-regulated gene expression across cell types of the mouse hippocampus. Hippocampus 2023, 33, 1009–1027. [Google Scholar] [CrossRef]
  6. Svensson, M.; Lexell, J.; Deierborg, T. Effects of Physical Exercise on Neuroinflammation, Neuroplasticity, Neurodegeneration, and Behavior: What We Can Learn From Animal Models in Clinical Settings. Neurorehabil. Neural Repair. 2015, 29, 577–589. [Google Scholar] [CrossRef]
  7. Inoue, K.; Hanaokam, Y.; Nishijimam, T.; Okamotom, M.; Changm, H.; Saitom, T.; Soyam, H. Long-term mild exercise training enhances hippocampus-dependent memory in rats. Int. J. Sports Med. 2015, 36, 280–285. [Google Scholar] [CrossRef]
  8. Xiong, J.Y.; Li, S.C.; Sun, Y.X.; Zhang, X.S.; Dong, Z.Z.; Zhong, P.; Sun, X.R. Long-term treadmill exercise improves spatial memory of male APPswe/PS1dE9 mice by regulation of BDNF expression and microglia activation. Biol. Sport 2015, 32, 295–300. [Google Scholar] [CrossRef] [PubMed]
  9. Cooke, E.V.; Mares, K.; Clark, A.; Tallis, R.C.; Pomeroy, V.M. The effects of increased dose of exercise-based therapies to enhance motor recovery after stroke: A systematic review and meta-analysis. BMC Med. 2010, 8, 60. [Google Scholar] [CrossRef]
  10. Song, M.K.; Kim, E.J.; Kim, J.K.; Park, H.K.; Lee, S.G. Effect of regular swimming exercise to duration-intensity on neurocognitive function in cerebral infarction rat model. Neurol. Res. 2019, 41, 37–44. [Google Scholar] [CrossRef]
  11. Ploughman, M.; Granter-Button, S.; Chernenko, G.; Attwood, Z.; Tucker, B.A.; Mearow, K.M.; Corbett, D. Exercise intensity influences the temporal profile of growth factors involved in neuronal plasticity following focal ischemia. Brain Res. 2007, 1150, 207–216. [Google Scholar] [CrossRef] [PubMed]
  12. Modaberi, S.; Shahbazi, M.; Dehghan, M.; Naghdi, N. The role of mild treadmill exercise on spatial learning and memory and motor activity in animal models of ibotenic acid-induced striatum lesion. Sport. Sci. Health 2018, 14, 587–596. [Google Scholar] [CrossRef]
  13. Aguiar, A.S.; Castro, A.A.; Moreira, E.L.; Glaser, V.; Santos, A.R.; Tasca, C.I.; Latini, A.; Prediger, R.D. Short bouts of mild-intensity physical exercise improve spatial learning and memory in aging rats: Involvement of hippocampal plasticity via AKT, CREB and BDNF signaling. Mech. Ageing Dev. 2011, 132, 560–567. [Google Scholar] [CrossRef]
  14. Gegentonglaga; Yoshizato, H.; Higuchi, Y.; Toyota, Y.; Hanai, Y.; Ando, Y.; Yoshimura, A. Variable alteration of regional tissue oxygen pressure in rat hippocampus by acute swimming exercise. Life Sci. 2013, 93, 773–777. [Google Scholar] [CrossRef] [PubMed]
  15. Ai, J.Y.; Chen, F.T.; Hsieh, S.S.; Kao, S.C.; Chen, A.G.; Hung, T.M.; Chang, Y.K. The effect of acute high-intensity interval training on executive function: A systematic review. Int. J. Environ. Res. Public. Health 2021, 18, 3593. [Google Scholar] [CrossRef]
  16. Wang, X.Q.; Wang, G.W. Effects of treadmill exercise intensity on spatial working memory and long-term memory in rats. Life Sci. 2016, 149, 96–103. [Google Scholar] [CrossRef] [PubMed]
  17. Gentleman, R.C.; Carey, V.J.; Bates, D.M.; Bolstad, B.; Dettling, M.; Dudoit, S.; Ellis, B.; Gautier, L.; Ge, Y.; Gentry, J.; et al. Bioconductor: Open software development for computational biology and bioinformatics. Genome Biol. 2004, 5, R80. [Google Scholar] [CrossRef]
  18. Voss, M.W.; Nagamatsu, L.S.; Liu-Ambrose, T.; Kramer, A.F. Exercise, brain, and cognition across the life span. J Appl Physiol (1985) 2011, 111, 1505–1513. [Google Scholar] [CrossRef] [PubMed]
  19. Lee, E.; Son, H. Adult hippocampal neurogenesis and related neurotrophic factors. BMB Rep. 2009, 42, 239–244. [Google Scholar] [CrossRef]
  20. Yamashita, H.; Avraham, S.; Jiang, S.; Dikic, I.; Avraham, H. The Csk homologous kinase associates with TrkA receptors and is involved in neurite outgrowth of PC12 cells. J. Biol. Chem. 1999, 274, 15059–15065. [Google Scholar] [CrossRef]
  21. Kim, S.O.; Avraham, S.; Jiang, S.; Zagozdzon, R.; Fu, Y.; Avraham, H.K. Differential expression of Csk homologous kinase (CHK) in normal brain and brain tumors. Cancer 2004, 101, 1018–1027. [Google Scholar] [CrossRef] [PubMed]
  22. Akira, S.; Takeda, K. Toll-like receptor signalling. Nat. Rev. Immunol. 2004, 4, 499–511. [Google Scholar] [CrossRef] [PubMed]
  23. Rao, N.; Nguyen, S.; Ngo, K.; Fung-Leung, W.P. A novel splice variant of interleukin-1 receptor (IL-1R)-associated kinase 1 plays a negative regulatory role in Toll/IL-1R-induced inflammatory signaling. Mol. Cell Biol. 2005, 25, 6521–6532. [Google Scholar] [CrossRef] [PubMed]
  24. Feng, D.; Wang, B.; Ma, Y.; Shi, W.; Tao, K.; Zeng, W.; Cai, Q.; Zhang, Z.; Qin, H. The Ras/Raf/Erk Pathway Mediates the Subarachnoid Hemorrhage-Induced Apoptosis of Hippocampal Neurons Through Phosphorylation of p53. Mol. Neurobiol. 2016, 53, 5737–5748. [Google Scholar] [CrossRef] [PubMed]
  25. Anton, E.S.; Weskamp, G.; Reichardt, L.F.; Matthew, W.D. Nerve growth factor and its low-affinity receptor promote Schwann cell migration. Proc. Natl. Acad. Sci. USA 1994, 91, 2795–2799. [Google Scholar] [CrossRef] [PubMed]
  26. Meffert, M.K.; Chang, J.M.; Wiltgen, B.J.; Fanselowm, M.S.; Baltimorem, D. NF-kappa B functions in synaptic signaling and behavior. Nat. Neurosci. 2003, 6, 1072–1078. [Google Scholar] [CrossRef] [PubMed]
  27. Albensim, B.C.; Mattsonm, M.P. Evidence for the involvement of TNF and NF-kappaB in hippocampal synaptic plasticity. Synapse 2000, 35, 151–159. [Google Scholar] [CrossRef]
  28. Levensonm, J.M.; Choi, S.; Lee, S.Y.; Cao, Y.A.; Ahn, H.J.; Worley, K.C.; Pizzi, M.; Liou, H.C.; Sweatt, J.D. A bioinformatics analysis of memory consolidation reveals involvement of the transcription factor c-rel. J. Neurosci. 2004, 24, 3933–3943. [Google Scholar] [CrossRef]
  29. Gutierrez, H.; Hale, V.A.; Dolcet, X.; Davies, A. NF-kappaB signalling regulates the growth of neural processes in the developing PNS and CNS. Development 2005, 132, 1713–1726. [Google Scholar] [CrossRef]
  30. Kaltschmidt, B.; Ndiaye, D.; Korte, M.; Pothion, S.; Arbibe, L.; Prüllage, M.; Pfeiffer, J.; Lindecke, A.; Staiger, V.; Israël, A.; et al. NF-kappaB regulates spatial memory formation and synaptic plasticity through protein kinase A/CREB signaling. Mol. Cell Biol. 2006, 26, 2936–2946. [Google Scholar] [CrossRef]
  31. Heckscher, E.S.; Fetter, R.D.; Marek, K.W.; Albin, S.D.; Davis, G.W. NF-kappaB, IkappaB, and IRAK control glutamate receptor density at the Drosophila NMJ. Neuron 2007, 55, 859–873. [Google Scholar] [CrossRef] [PubMed]
  32. Wang, J.; Fu, X.Q.; Lei, W.L.; Wang, T.; Sheng, A.L.; Luo, Z.G. Nuclear factor kappaB controls acetylcholine receptor clustering at the neuromuscular junction. J. Neurosci. 2010, 30, 11104–11113. [Google Scholar] [CrossRef] [PubMed]
  33. Boersma, M.C.; Dresselhaus, E.C.; De Biase, L.M.; Mihalas, A.B.; Bergles, D.E.; Meffert, M.K. A requirement for nuclear factor-kappaB in developmental and plasticity-associated synaptogenesis. J. Neurosci. 2011, 31, 5414–5425. [Google Scholar] [CrossRef]
  34. Qiu, J.; Hu, X.; Nesic, O.; Grafe, M.R.; Rassin, D.K.; Wood, T.G.; Perez-Polo, J.R. Effects of NF-kappaB oligonucleotide “decoys” on gene expression in P7 rat hippocampus after hypoxia/ischemia. J. Neurosci. Res. 2004, 77, 108–118. [Google Scholar] [CrossRef] [PubMed]
  35. Schneider, A.; Martin-Villalba, A.; Weih, F.; Vogel, J.; Wirth, T.; Schwaninger, M. NF-kappaB is activated and promotes cell death in focal cerebral ischemia. Nat. Med. 1999, 5, 554–559. [Google Scholar] [CrossRef]
  36. Maqbool, A.; Lattke, M.; Wirth, T.; Baumann, B. Sustained, neuron-specific IKK/NF-κB activation generates a selective neuroinflammatory response promoting local neurodegeneration with aging. Mol. Neurodegener. 2013, 8, 40. [Google Scholar] [CrossRef]
  37. Yu, Z.; Zhou, D.; Bruce-Keller, A.J.; Kindy, M.S.; Mattson, M.P. Lack of the p50 subunit of nuclear factor-kappaB increases the vulnerability of hippocampal neurons to excitotoxic injury. J. Neurosci. 1999, 19, 8856–8865. [Google Scholar] [CrossRef]
  38. Kaltschmidt, B.; Kaltschmidt, C. NF-KappaB in Long-Term Memory and Structural Plasticity in the Adult Mammalian Brain. Front. Mol. Neurosci. 2015, 8, 69. [Google Scholar] [CrossRef]
  39. Liu, C.; Liu, S.; Xiong, L.; Zhang, L.; Li, X.; Cao, X.; Xue, J.; Li, L.; Huang, C.; Huang, Z. Genistein-3′-sodium sulfonate Attenuates Neuroinflammation in Stroke Rats by Down-Regulating Microglial M1 Polarization through α7nAChR-NF-κB Signaling Pathway. Int. J. Biol. Sci. 2021, 17, 1088–1100. [Google Scholar] [CrossRef]
  40. Ye, Y.; Jin, T.; Zhang, X.; Zeng, Z.; Ye, B.; Wang, J.; Zhong, Y.; Xiong, X.; Gu, L. Meisoindigo Protects Against Focal Cerebral Ischemia-Reperfusion Injury by Inhibiting NLRP3 Inflammasome Activation and Regulating Microglia/Macrophage Polarization via TLR4/NF-κB Signaling Pathway. Front. Cell Neurosci. 2019, 13, 553. [Google Scholar] [CrossRef]
  41. Popa-Wagner, A.; Stöcker, K.; Balseanu, A.T.; Rogalewski, A.; Diederich, K.; Minnerup, J.; Margaritescu, C.; Schäbitz, W.R. Effects of granulocyte-colony stimulating factor after stroke in aged rats. Stroke 2010, 41, 1027–1031. [Google Scholar] [CrossRef] [PubMed]
  42. Dumbrava, D.A.; Surugiu, R.; Börger, V.; Ruscu, M.; Tertel, T.; Giebel, B.; Hermann, D.M.; Popa-Wagner, A. Mesenchymal stromal cell-derived small extracellular vesicles promote neurological recovery and brain remodeling after distal middle cerebral artery occlusion in aged rats. Geroscience 2022, 44, 293–310. [Google Scholar] [CrossRef] [PubMed]
  43. Ciobanu, O.; Elena Sandu, R.; Tudor Balseanu, A.; Zavaleanu, A.; Gresita, A.; Petcu, E.B.; Uzoni, A.; Popa-Wagner, A. Caloric restriction stabilizes body weight and accelerates behavioral recovery in aged rats after focal ischemia. Aging Cell 2017, 16, 1394–1403. [Google Scholar] [CrossRef]
  44. Zhang, Y.; Yu, J.; Lee, C.; Xu, B.; Sartor, M.A.; Koenig, R.J. Genomic binding and regulation of gene expression by the thyroid carcinoma-associated PAX8-PPARG fusion protein. Oncotarget 2015, 6, 40418–40432. [Google Scholar] [CrossRef]
  45. Koch, C.M.; Chiu, S.F.; Akbarpour, M.; Bharat, A.; Ridge, K.M.; Bartom, E.T.; Winter, D.R. A Beginner’s Guide to Analysis of RNA Sequencing Data. Am. J. Respir. Cell Mol. Biol. 2018, 59, 145–157. [Google Scholar] [CrossRef] [PubMed]
  46. Blondeau, A.; Lucier, J.F.; Matteau, D.; Dumont, L.; Rodrigue, S.; Jacques, P.É.; Blouin, R. Dual leucine zipper kinase regulates expression of axon guidance genes in mouse neuronal cells. Neural Dev. 2016, 11, 13. [Google Scholar] [CrossRef]
  47. Watson, B.D.; Dietrich, W.D.; Busto, R.; Wachtel, M.S.; Ginsberg, M.D. Induction of reproducible brain infarction by photochemically initiated thrombosis. Ann. Neurol. 1985, 17, 497–504. [Google Scholar] [CrossRef] [PubMed]
  48. Bedford, T.G.; Tipton, C.M.; Wilson, N.C.; Oppliger, R.A.; Gisolfi, C.V. Maximum oxygen consumption of rats and its changes with various experimental procedures. J. Appl. Physiol. Respir. Environ. Exerc. Physiol. 1979, 47, 1278–1283. [Google Scholar] [CrossRef]
  49. Morris, R.G.; Garrud, P.; Rawlins, J.N.; O’Keefe, J. Place navigation impaired in rats with hippocampal lesions. Nature 1982, 297, 681–683. [Google Scholar] [CrossRef]
  50. Kim, H.J.; Hur, S.W.; Park, J.B.; Seo, J.; Shin, J.J.; Kim, S.Y.; Kim, M.H.; Han, D.H.; Park, J.W.; Park, J.M.; et al. Histone demethylase PHF2 activates CREB and promotes memory consolidation. EMBO Rep. 2019, 20, e45907. [Google Scholar] [CrossRef]
  51. Langmead, B.; Salzberg, S.L. Fast gapped-read alignment with Bowtie 2. Nat. Methods 2012, 9, 357–359. [Google Scholar] [CrossRef] [PubMed]
  52. Quinlan, A.R.; Hall, I.M. BEDTools: A flexible suite of utilities for comparing genomic features. Bioinformatics 2010, 26, 841–842. [Google Scholar] [CrossRef] [PubMed]
  53. Duffau, H. Brain plasticity and reorganization before, during, and after glioma resection. In Glioblastoma; Elsevier: Amsterdam, The Netherlands, 2016; pp. 225–236. [Google Scholar]
  54. Kanehisa, M.; Sato, Y.; Kawashima, M. KEGG mapping tools for uncovering hidden features in biological data. Protein Sci. 2022, 31, 47–53. [Google Scholar] [CrossRef] [PubMed]
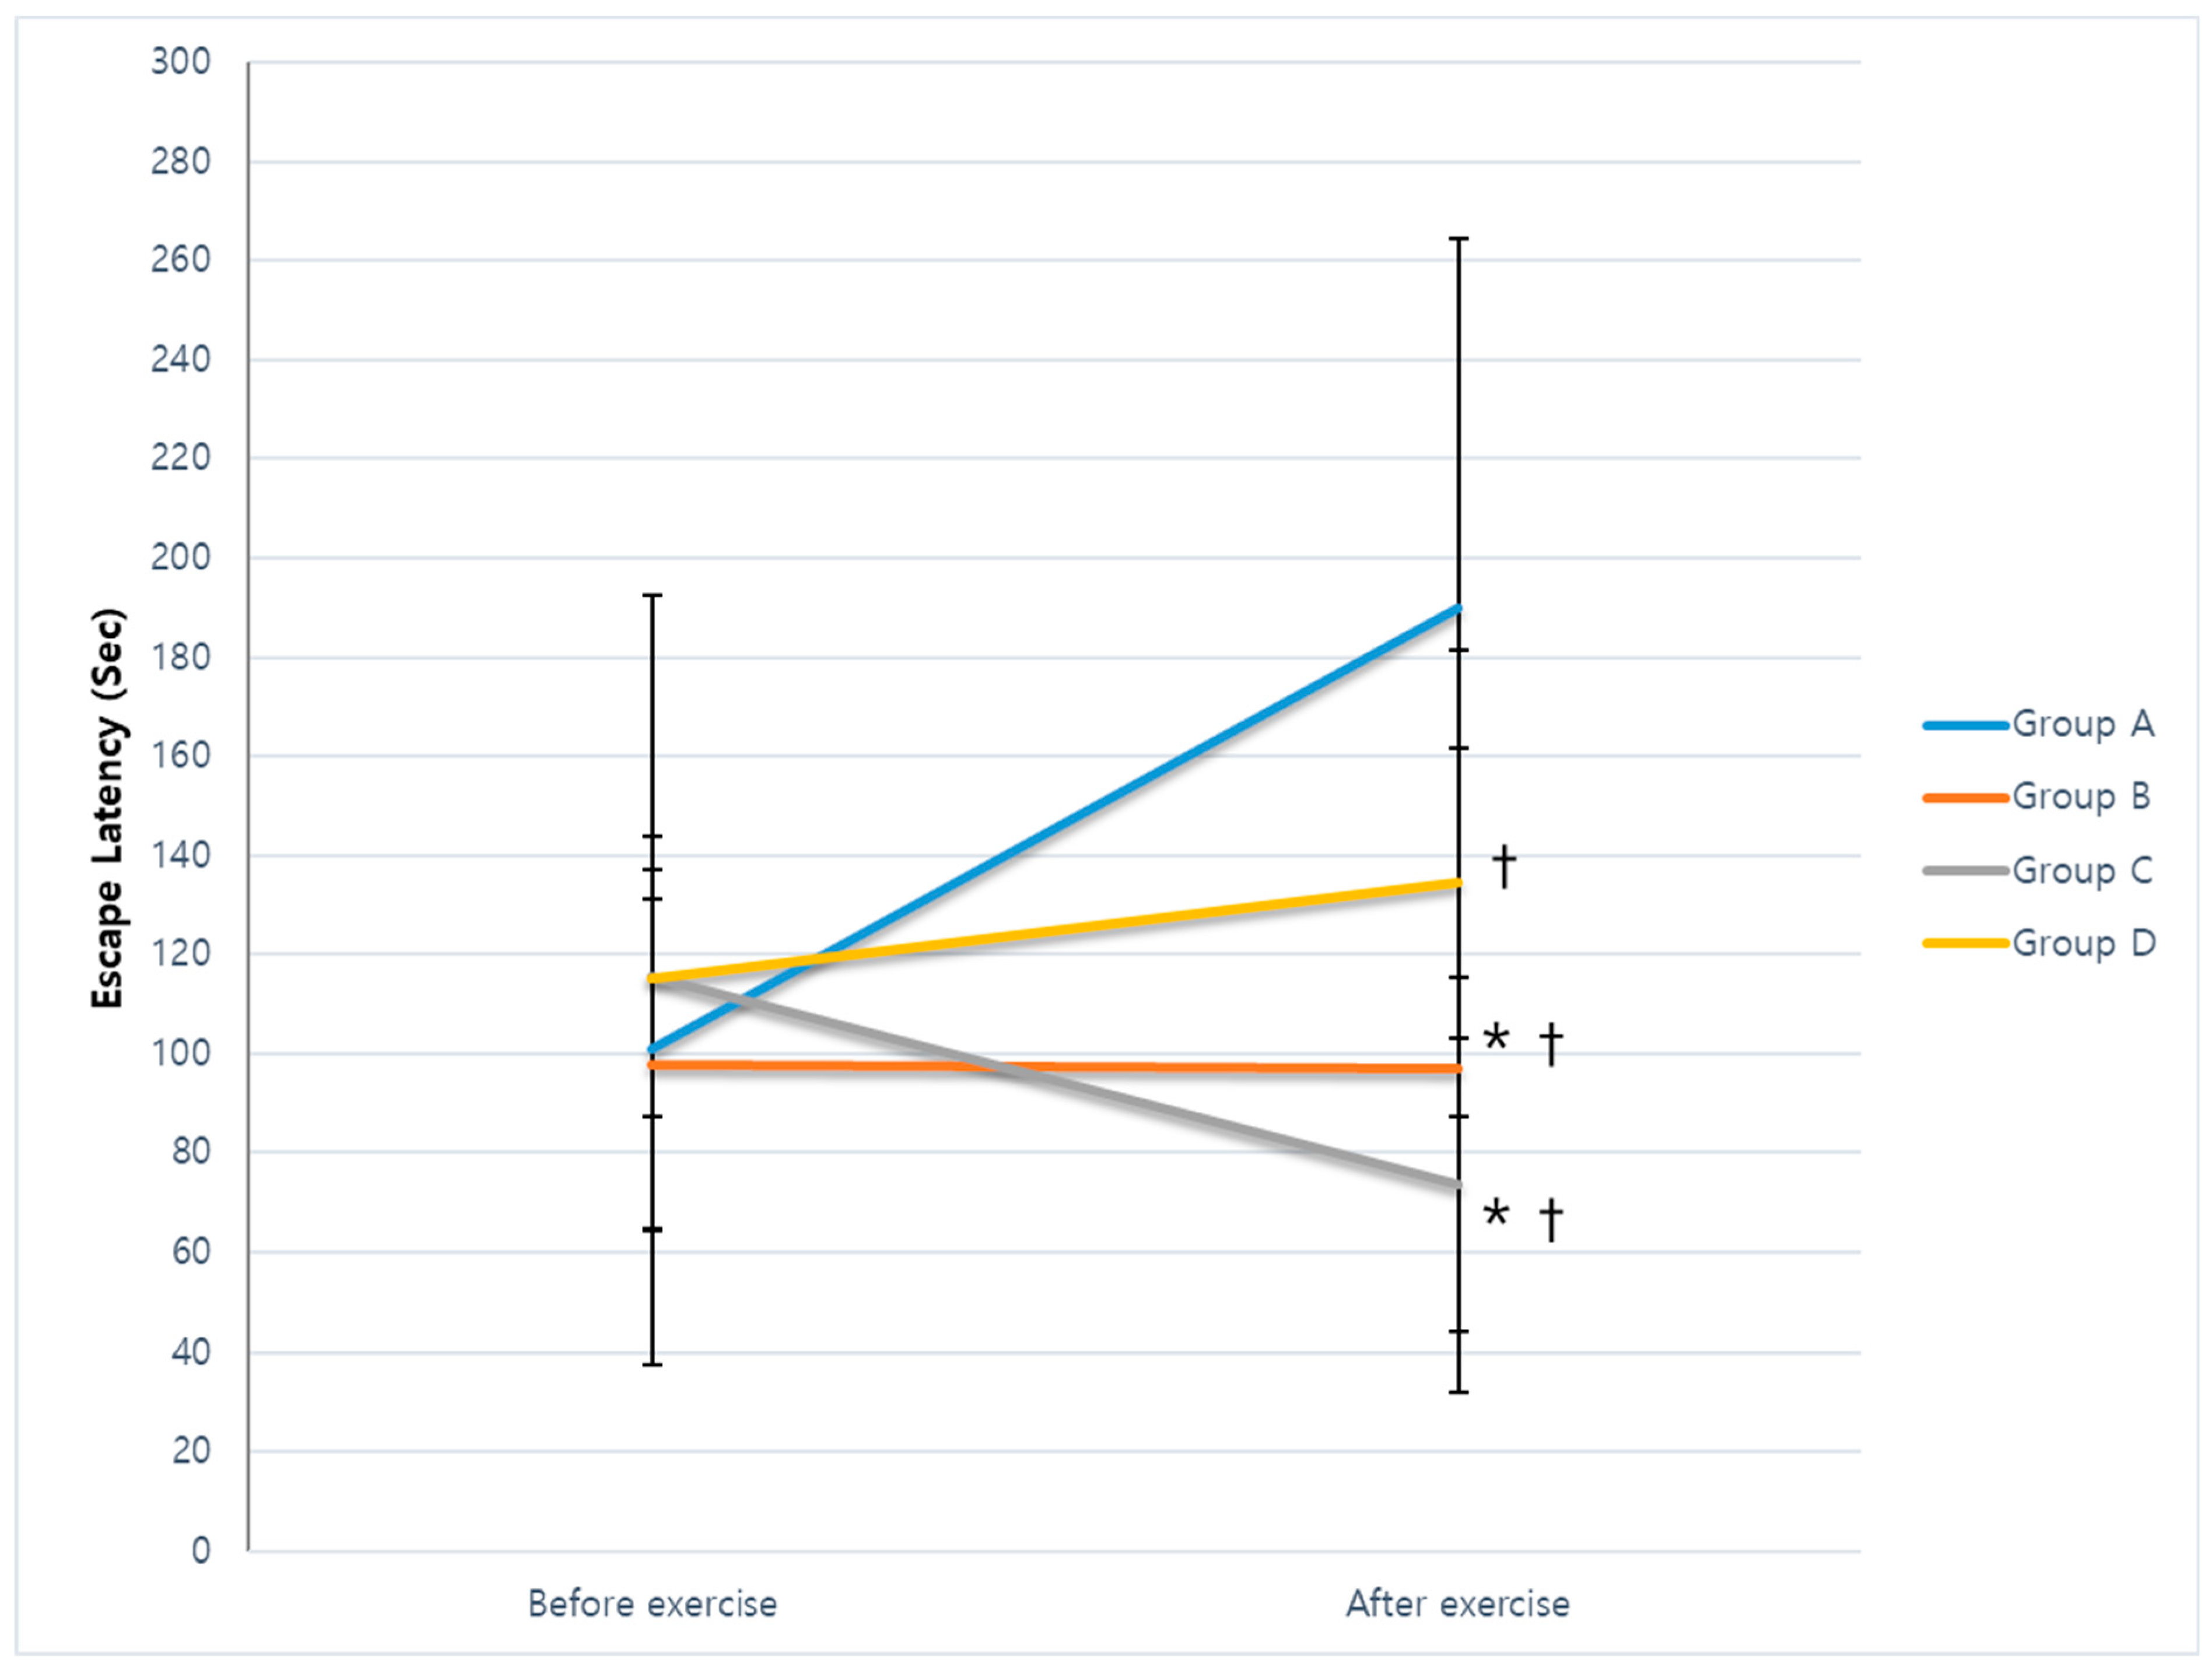
Figure 1. Escape latency during the Morris water maze test. No differences in escape latency on the day after cerebral infarction were found among the groups (p = 0.798). The follow-up escape latencies in groups B, C, and D were significantly shorter than those in group A, and latencies in groups B and C were shorter than those in group D (p = 0.001). Repeated-measures ANOVA with the Duncan post hoc test showed a significant time × group interaction (F = 5.851, p = 0.003). However, no significant effect was shown for time (F = 2.097, p = 0.157). *,† p < 0.05.
Ijms 25 08997 g001
Figure 2. Velocity during the Morris water maze test. No differences in velocity were noted among groups on the day after cerebral infarction (p = 0.406). The Duncan post hoc correction revealed faster velocities in groups B and C compared with groups A and D after 4 weeks of exercise (p = 0.002). However, repeated-measures ANOVA with the Duncan post hoc test showed no significant effects for time and time × group interaction (F = 2.375, p = 0.133; F = 0.334, p = 0.567). * p < 0.05.
Ijms 25 08997 g002
Figure 3. Hierarchical clustering heatmap in each group. Average normalized read count (RC) of gene expression and fold change of gene expression in each group compared with the control group (p < 0.05, fold change > 1.0, average normalized RC > 4). The patterns of gene expression in the low- and moderate-intensity treadmill exercise groups were similar and different from the control and high-intensity treadmill exercise groups. C: control group (no treadmill exercise); H: high-intensity treadmill exercise group; L: low-intensity treadmill exercise group; M: moderate-intensity treadmill exercise group.
Ijms 25 08997 g003
Figure 4. Neurotrophin-signaling pathways in the low-intensity exercise group (coral: upregulation; blue: downregulation). The CHK gene was upregulated, and the NF-κB gene was downregulated with low-intensity treadmill exercise. The neurotrophin-signaling pathway was elicited with the KEGG Mapper Search and Color Pathway tool (http://www.genome.jp/kegg/tool/map_pathway2.html, accessed on 19 December 2020).
Ijms 25 08997 g004
Figure 5. Neurotrophin-signaling pathways in the moderate-intensity exercise group (blue: downregulation). The CHK and NF-κB genes were both downregulated. The neurotrophin-signaling pathway was elicited with the KEGG Mapper Search and Color Pathway tool (http://www.genome.jp/kegg/tool/map_pathway2.html, accessed on 19 December 2020).
Ijms 25 08997 g005
Figure 6. Neurotrophin-signaling pathways in the high-intensity exercise group (blue: downregulation). The Raf and IRAK genes were downregulated. The neurotrophin signaling pathway was elicited with the KEGG Mapper Search and Color Pathway tool (http://www.genome.jp/kegg/tool/map_pathway2.html, accessed on 19 December 2020).
Ijms 25 08997 g006
Figure 7. Effects of treadmill exercise on NF-κB protein concentrations. The reactivities of NF-κB protein were 0.461 ± 0.023 μg protein in group A, 0.518 ± 0.468 μg protein in group B, 0.375 ± 0.037 μg protein in group C, and 0.456 ± 0.079 μg protein in group D. The expression of the NF-κB protein in group C was weaker than in groups A, B, and D (* p = 0.05, ** p = 0.001).
Ijms 25 08997 g007
Figure 8. Effects of treadmill exercise on CHK protein concentrations. The reactivities of the CHK protein were 0.4532 ± 0.005 μg protein in group A, 0.4724 ± 0.003 μg protein in group B, 0.4835 ± 0.016 μg protein in group C, and 0.5883 ± 0.005 μg protein in group D. The expression of the CHK protein was stronger in group D than in groups A, B, and C. * p = 0.05.
Ijms 25 08997 g008
Figure 9. Effects of treadmill exercise on Raf protein concentrations. The reactivities of the Raf protein were 0.797 ± 0.016 μg protein in group A, 0.906 ± 0.014 μg protein in group B, 0.973 ± 0.038 μg protein in group C, and 1.059 ± 0.018 μg protein in group D. The expression of the Raf protein was stronger in group D than in groups A, B, and C. * p = 0.05.
Ijms 25 08997 g009
Figure 10. Effects of treadmill exercise on IRAK protein concentrations. The reactivities of IRAK protein were 0.252 ± 0.012 μg protein in group A, 0.247 ± 0.011 μg protein in group B, 0.236 ± 0.010 μg protein in group C, and 0.227 ± 0.014 μg protein in group D. The expression of the IRAK protein was weaker in group D than in group A. * p = 0.05.
Ijms 25 08997 g010
Figure 11. Schematic representation of the experiments. Photothrombotic cerebral infarction was conducted for 10-week-old male Sprague-Dawley (SD) rats (n = 36). All rats were acclimated to the abovementioned pre-training process for 3 consecutive days before photothrombotic cerebral infarction. The Morris water maze (MWM) test was performed before and after a regular treadmill exercise program (5 days/week, 4 weeks). The follow-up MWM test was performed after the treadmill exercise program; all rats were sacrificed after the MWM test to obtain the brain tissues.
Ijms 25 08997 g011
Disclaimer/Publisher’s Note: The statements, opinions and data contained in all publications are solely those of the individual author(s) and contributor(s) and not of MDPI and/or the editor(s). MDPI and/or the editor(s) disclaim responsibility for any injury to people or property resulting from any ideas, methods, instructions or products referred to in the content.